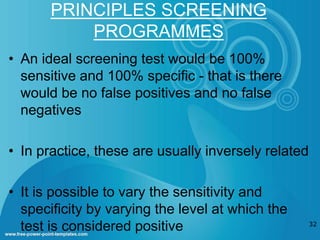
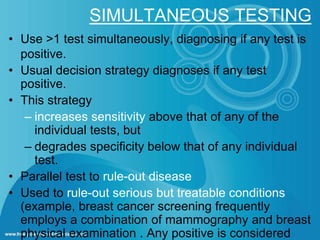
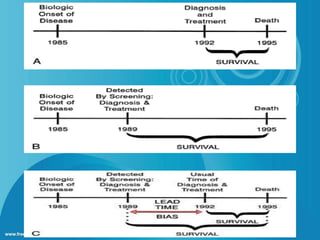
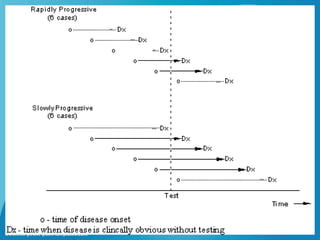
Call Girls ITPL Just Call 7001305949 Top Class Call Girl Service Available
Disease Screening Criteria and Tests
1. DISEASE
SCREENING
DR. AMANDEEP KAUR
JUNIOR RESIDENT
DEPARTMENT OF COMMUNITY
MEDICINE
PGIMS, ROHTAK
2. CONTENTS
• Introduction
• Why screening?
• Lead time
• Uses of screening
• Types of screening
• Criteria of screening
• Problem of borderline
• Use of multiple tests
• Bias in screening
• Evaluation of screening programme
• Examples
4. DISEASE PREVENTION
CATEGORIES:
• Primordial prevention – prevention of development
of risk factors
• Primary prevention - The actual prevention of a
disease before it has been able to occur.
• Secondary prevention - The early detection of a
disease while it is still curable. Screening is the
major component of secondary prevention.
• Tertiary prevention - The limiting of disease
sequelae. 4
5. NATURAL HISTORY OF
DISEASE
outcome
5
(A)
Biologic
onset of
disease
(S)
Signs &
Symptoms
of disease
(M)
Medical
Care
Sought
(D)
Diagnosis
(T)
Treatment
(P)
Pathologic
Evidence of
disease if
Sought
Pre-clinical phase Clinical phase
Primary prevention
Secondary prevention Tertiary prevention
(L)
Disability
limitation
(R)
Rehabilitation
6. DEFINITION
SCREENING:
The search for unrecognized disease or
defect by means of rapidly applied tests,
examinations or other procedures in apparently
healthy individuals.
(in those populations or individuals who are NOT
seeking health care)
The active search for disease among
apparently healthy people – fundamental
concept.
7. DEFINITION
CASE-FINDING:
use of clinical and/or laboratory tests to
detect disease in individuals seeking health
care for other reasons.
For example, the use of VDRL test to detect
syphilis in pregnant women.
8. DEFINITION
DIAGNOSTIC TEST:
use of clinical and/or laboratory
procedures to confirm or refute the existence of
disease or true abnormality in patients with
signs & symptoms presumed to be caused by
the disease.
For example, VDRL testing of patients with
lesions suggestive of secondary syphilis.
9. Done on apparently healthy Done on those with indication or
sick
Applied to groups Applied to single patient
Results are arbitrary and final Diagnosis not final, but sum of
all evidence
Based on one criterion or cut off
point
Evaluation of symptoms, signs
and lab findings
Less accurate and less
expensive
More accurate and more
expensive
Not a basis for treatment Basis of treatment
Initiative comes from
investigator
Initiative comes from a patient
12. LEAD TIME
Detection programmes should be restricted to those
conditions in which there is considerable time lag between
disease onset and the usual time of onset.
A
B
Disease
onset &
detection
Final
critical
diagnosi
s
Lead time
First
possibl
e point
A – usual outcome of the disease B – expected
outcome
B – A : benefits of the programme
OUTCOM
E
Usual
time of
diagnosi
s
Screening time
13. APPARENTLY
HEALTHY
(Screening tests)
APPARENTLY
NORMAL
(Periodic re-screening)
APPARENTLY
ABNORMAL
a. Normal – periodic –
re-screening
b. Intermediate -
surveillance
c. Abnormal -
treatment
POSSIBLE OUTCOMES OF
SCREENING TEST
14.
15. USES OF SCREENING
Case detection – (prescriptive screening)
presumptive identification of unrecognized disease,
which does not arise from patient’s request. People
screened primarily for their own benefit.
E.g., neonatal screening, bacteriuria in pregnancy,
diabetes mellitus.
Control of disease – (prospective screening)
people screened for benefit of others.
E.g. screening of immigrants from infectious disease.
Research purpose.
Educational opportunities.
16. TYPES OF SCREENING
Mass screening: screening of a whole
population or a sub-group, e.g., all children;
irrespective of the particular risk individual may run
of contracting the disease in question.
High risk or selective screening:
applied selectively to high risk groups, the groups
defined on the basis of epidemiological research,
e.g., screening of cancer cervix in lower social
groups.
Multiphasic screening: application of two or
more screening tests in combination to a large
number of people at one time. It is very expensive.
17. TYPES OF SCREENING
Opportunistic screening: individuals are
entered into a screening programme whenever an
opportunity arises, usually when they go to a doctor
about something else.
e.g., STIs, cervical cancer
Systematic screening programmes: in
which an attempt is made to identify everyone who
should be screened and invite them to attend for the
screening test
19. CRITERIA FOR SCREENING
DISEASE
Important health problem
Recognizable latent or early asymptomatic stage.
Natural history of the condition should be known.
Presence of a test that can detect the disease prior
to onset of signs and symptoms.
There should be an effective treatment
20. CRITERIA FOR SCREENING
DISEASE Facilities should be available for confirmation of the
diagnosis.
Agreed on policy concerning whom to treat as
patients.
Good evidence that early detection and treatment
reduces morbidity and mortality.
The expected benefits of early detection should
exceed the risks and costs.
When the above criteria are satisfied, then only, the screening test is
23. Acceptability
• The test should be acceptable to the
people at whom it is aimed.
• It should not be painful, discomforting, or
embarrassing
24. Repeatability
Test must give consistent results when repeated more
than once on same individual or material, under same
conditions.
Sometimes called reliability, precision or reproducibility.
Factors contributing to variation in test
results:
• Biological (intrasubject) variation :
• Changes in parameter observed with time.
• Variations in the way patients perceive their symptoms and
answers.
• Observer variation :
• Intra – observer variation.
• Inter – observer variation.
• Errors relating to technical methods
• Perception variation
25. Repeatability
• Can be assessed in various ways:
• Intrasubject (multiple screening tests) - means,
averages; paired t-tests
• Inter-observer or inter-instrument (multiple
observers or instruments)
– Dichotomous outcome with paired samples
– Percent agreement = a / (a + b + c)
– Kappa statistic (test agreement, not quantify
agreement)
– McNemar’s test - non parametric test of agreement of
paired samples
• Continuous outcome
– Differences in paired measurements
– Coefficient of variation
26. Validity (accuracy)
• To what extent the test accurately measures which it purports
to measure.
• Expresses ability of test to separate or distinguish those who
have the disease from who do not.
• Closeness with which measured values agree with true
values.
• Components of validity
oSensitivity : ability of test to identify correctly all those
who have the disease, i.e., true positives.
oSpecificity : ability of a test to identify correctly those
who do not have the disease, i.e., true negatives.
28. SCREENING TEST RESULT BY
DIAGNOSIS
SCREENIN
G TEST
RESULTS
DIAGNOSIS
TOTAL
DISEASED NOT
DISEASED
POSITIVE a+b
(all people with positive test results)
NEGATIVE c+d
(all negatives with negative test results)
29. SCREENING TEST RESULT BY
DIAGNOSIS
SCREENIN
G TEST
RESULTS
DIAGNOSIS
TOTAL
DISEASED NOT
DISEASED
POSITIVE
a
(True Positives)
b
(False
positives)
a+b PPV
NEGATIVE
c
(False
Negatives)
d
(True
Negatives)
c+d NPV
TOTAL
a+c b+d a+b+c+d
SENSITIVITY SPECIFICIT
Y
30. True
positive
False
positive
True
negativ
e
False
negative
True positives
All cases
Sensitivity =
b
a + c b + d
=
a
a + c
True negatives
All non-cases
Specificity =
=
d
b + d
a + b
c + d
TRUE DISEASE
CasSesTATUNSon-cases
Positiv
e
Negative
SCREENING
TEST
RESULTS
a
d
c
31. TRUE DISEASE
CasSesTATUNSon-cases
Positiv
e
Negative
SCREENING
TEST
RESULTS
a
d
1,000
b
c
60
Sensitivity =
True positives
All cases
200 20,000
=
140
200
Specificity = True negatives
All non-cases
=
= 70%
19,000
20,000
1,140
19,060
140
19,000
=
95%
32. PRINCIPLES SCREENING
PROGRAMMES
• An ideal screening test would be 100%
sensitive and 100% specific - that is there
would be no false positives and no false
negatives
• In practice, these are usually inversely related
• It is possible to vary the sensitivity and
specificity by varying the level at which the
test is considered positive 32
34. INTERPRETING TEST RESULTS:
PREDICTIVE VALUE
Probability (proportion) of those tested
who are correctly classified
Cases identified / all positive tests
Non cases identified / all negative tests
35. True
positive
False
positive
True
negativ
e
False
negative
PPV =
b
a + c b + d
True positives
All positives
=
a
a + b
NPV =
True negatives
All negatives
=
d
c + d
a +
b
c + d
TRUE DISEASE
CasSeTsATUNSon-cases
Positiv
e
Negative
SCREENING
TEST
RESULTS
a
d
c
36. TRUE DISEASE
CasSesTATUNSon-cases
Positiv
e
Negative
SCREENING
TEST
RESULTS
a
d
1,000
b
c
60
PPV =
200 20,000
True positives
All positives
=
140
1,140
NPV =
True negatives
All negatives
=
= 12.3%
19,000
19,060
1,140
19,060
140
19,000
=
99.7%
38. Relationship between disease prevalence and predictive value
in a test with 95% sensitivity and 95% specificity.
39. Amount of previously unrecognized disease that is
diagnosed as a result of screening effort.
Depends on :
Sensitivity
Specificity
prevalence and
participation of individuals.
Calculated by :
prevalence of disease
positive predictive value
Yield
40. Predictive accuracy
• Reflects diagnostic power of test.
• Depends upon sensitivity, specificity and disease
prevalence.
• Predictive value of a positive test (PPV): probability
that a patient with positive test has, in fact, the disease in
question.
• Predictive value of a negative test (NPV): probability
that a patient with negative test has does not have the
disease in question.
42. UNIMODAL DISTRIBUTION
BORDERLINE GROUP (C -- D)
If cut-off point is set at level of C, test will be highly sensitive, but
will yield many False Positives.
If cut-off is set at D, it will increase specificity if the test
44. Where do we set the cut-off for a screening test?
-The impact of high
number of false
positives:
anxiety, cost of
further testing
-Importance of not
missing a case:
seriousness of
disease, likelihood of re-screening
45. BASIS FOR CUT – OFF IN
SCREENING
Disease prevalence – highly prevalent –
screening level is set at lower level –
sensitivity increases
The disease – lethal disease – greater
sensitivity
prevalent disease -- but
treatment does not markedly alter outcome,
e.g., diabetes – high specificity.
PPV is useful index in making this decision.
46. ROC CURVE
• Receiver
operating
characteristic
curve.
• In a ROC curve
the true positive
rate (Sensitivity)
is plotted in
function of the
false positive rate
(1-Specificity) for
different cut-off
points.
47. • The dotted diagonal line corresponds to a test that is positive or negative
just by chance.
• A test with perfect discrimination (no overlap in the two distributions) has
a ROC plot that passes through the upper left corner (100% sensitivity,
100% specificity). Therefore the closer the ROC plot is to the upper left
corner, the higher the overall accuracy of the test
48. USES OF ROC CURVES
• For comparing two or more diagnostic
tests.
• For selecting cut-off levels for a test.
49. • To illustrate sensitivity and specificity and the
inter-relationship between them, let's look at
a real-life example using a fasting blood
glucose level as a screening test for diabetes.
• By choosing different values to define a
"positive" screening result, we can change
the sensitivity and specificity of the test.
• For diabetes, we can use the 2-Hour
Glucose Tolerance Test as the "gold
standard" to classify whether or not a person
has the disease.
49
50. 3 different levels defining a "positive"
test
(100)
(110)
(120)
50 Serum Glucose Levels (mg/dL)
Normal
Cut-off 1
Cut-off 2
Cut-off 3
Diabetes
53. USE OF MULTIPLE TESTS
INCREASING SENSITIVITY AND
SPECIFICITY
54. SEQUENTIAL (TWO-STAGE)
TESTING
• Use >1 test in sequence, stopping at the first
negative test.
• Diagnosis requires all tests to be positive.
• A cost saving measure.
• This strategy
– increases specificity above that of any of the
individual tests, but
– degrades sensitivity below that of any of them
singly.
• Serial test to rule-in disease
• When treatment is hazardous (surgery,
chemotherapy) we use serial testing to raise
specificity.(Blood test followed by more tests,
55. SIMULTANEOUS TESTING
• Use >1 test simultaneously, diagnosing if any test is
positive.
• Usual decision strategy diagnoses if any test
positive.
• This strategy
– increases sensitivity above that of any of the
individual tests, but
– degrades specificity below that of any individual
test.
• Parallel test to rule-out disease
• Used to rule-out serious but treatable conditions
(example, breast cancer screening frequently
employs a combination of mammography and breast
physical examination . Any positive is considered
56. BIAS IN SCREENING
TESTS
Arise when screen detected cases are compared
with cases detected by signs and symptoms.
57. • Lead time bias : overestimation of survival
duration among screen detected cases when
survival is measured from diagnosis.
58.
59. Length time bias:
• Overestimation of survival duration among
screen-detected cases due to the relative excess
of slowly progressing cases.
• These are disproportionally identified by
screening because the probability of detection is
directly proportional to the length of time during
which they are detectable.
60.
61. Over diagnosis bias :
• Over diagnosis occurs when all of these people with
harmless abnormalities are counted as "lives saved"
by the screening, rather than as "healthy people
needlessly harmed by over diagnosis".
• Screening may identify abnormalities that would
never cause a problem in a person's lifetime. For
example, prostate cancer screening; it has been
said that "more men die with prostate cancer than of
it".
• Issues unnecessary treatment.
62. Early detection may over-diagnose
Pre-detectable
Undetected
(no screening)
Mild or no
symptoms
Favorable
outcome
Pre-detectable
Survival time after diagnosis
Early detect,
diagnosis, &
treatment
Monitoring
for recurrence
Favorable
outcome
Survival time after dx
Age: 35 45 55 65 75
63. Selection bias:
• Not everyone will partake in a screening program.
• If people with a higher risk of a disease are more
likely to be screened, for instance women with a
family history of breast cancer are more likely than
other women to join a mammography program, then
a screening test will look worse than it really is:
negative outcomes among the screened population
will be higher than for a random sample.
• Selection bias may also make a screening test look
better than it really is, if a test is more available to young
and healthy people (for instance if people have to travel a
long distance to get checked).
64. DISADVANTAGES OF SCREENING
• The tests used in screening are not perfect, so there
are false positives and false negatives.
• Screening involves cost and use of medical
resources on a majority of people who do not need
treatment.
• Adverse effects of screening procedure (e.g. stress
and anxiety, discomfort, radiation & chemical
exposure).
• Unnecessary investigation and treatment of false
positive results.
• Stress and anxiety caused by prolonging knowledge
of an illness without any improvement in outcome.
• A false sense of security caused by false negatives,
65. EVALUATION OF SCREENING
PROGRAM
• Randomized control trials.
• Uncontrolled trials.
• Other methods: like, case control studies