Download as PDF, PPTX


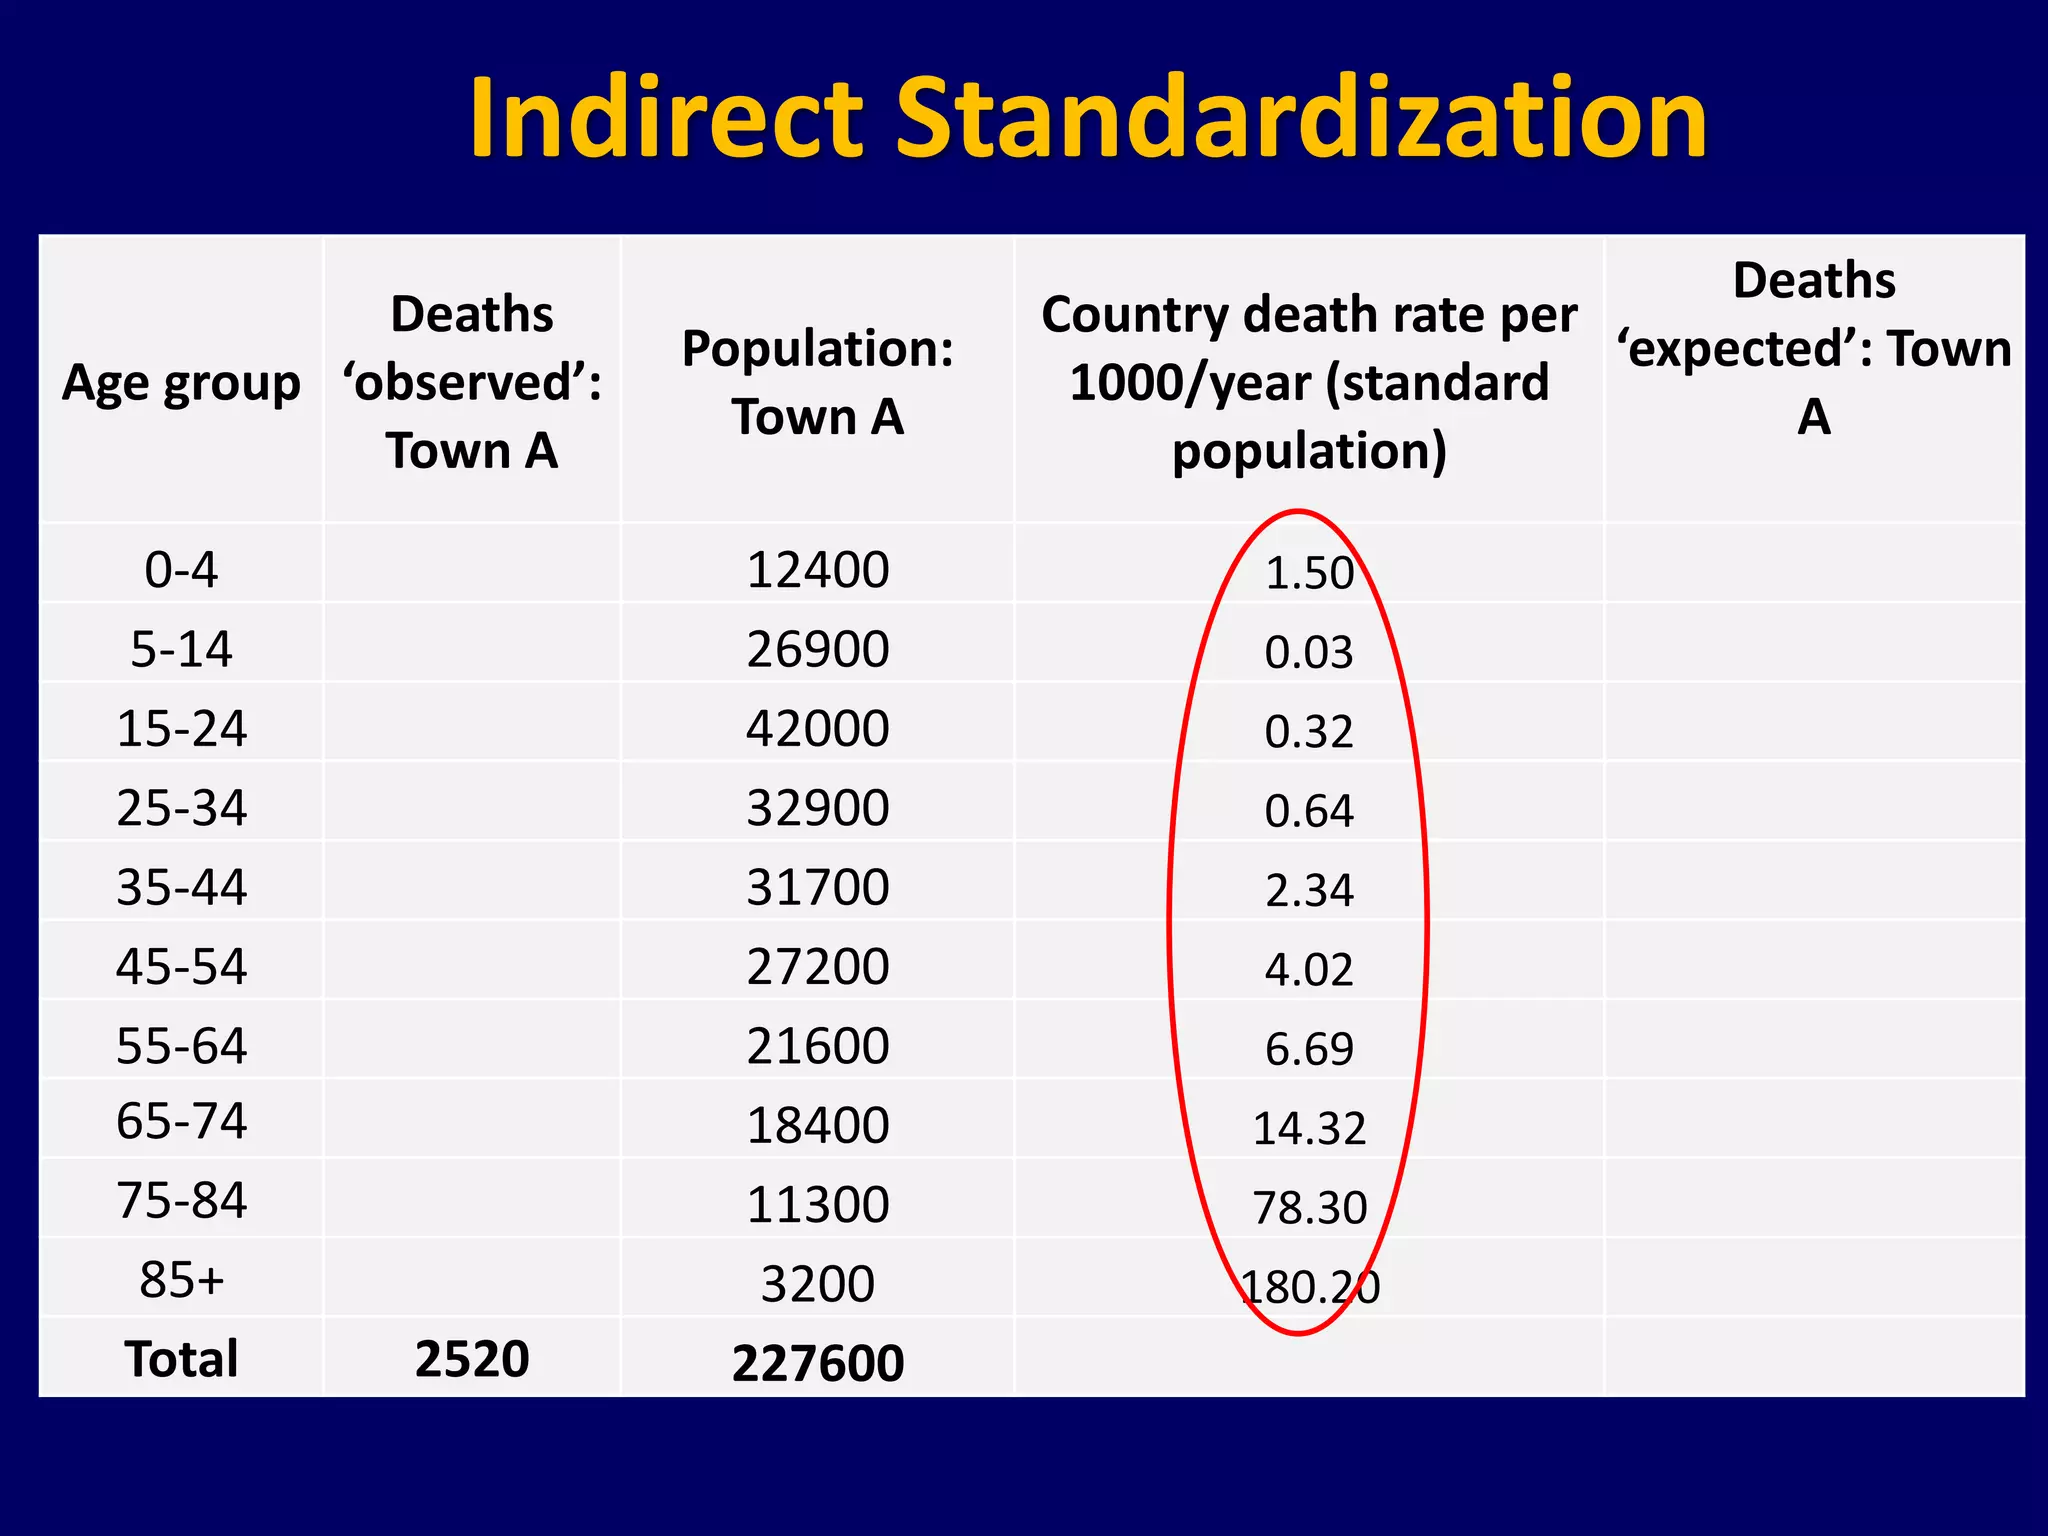
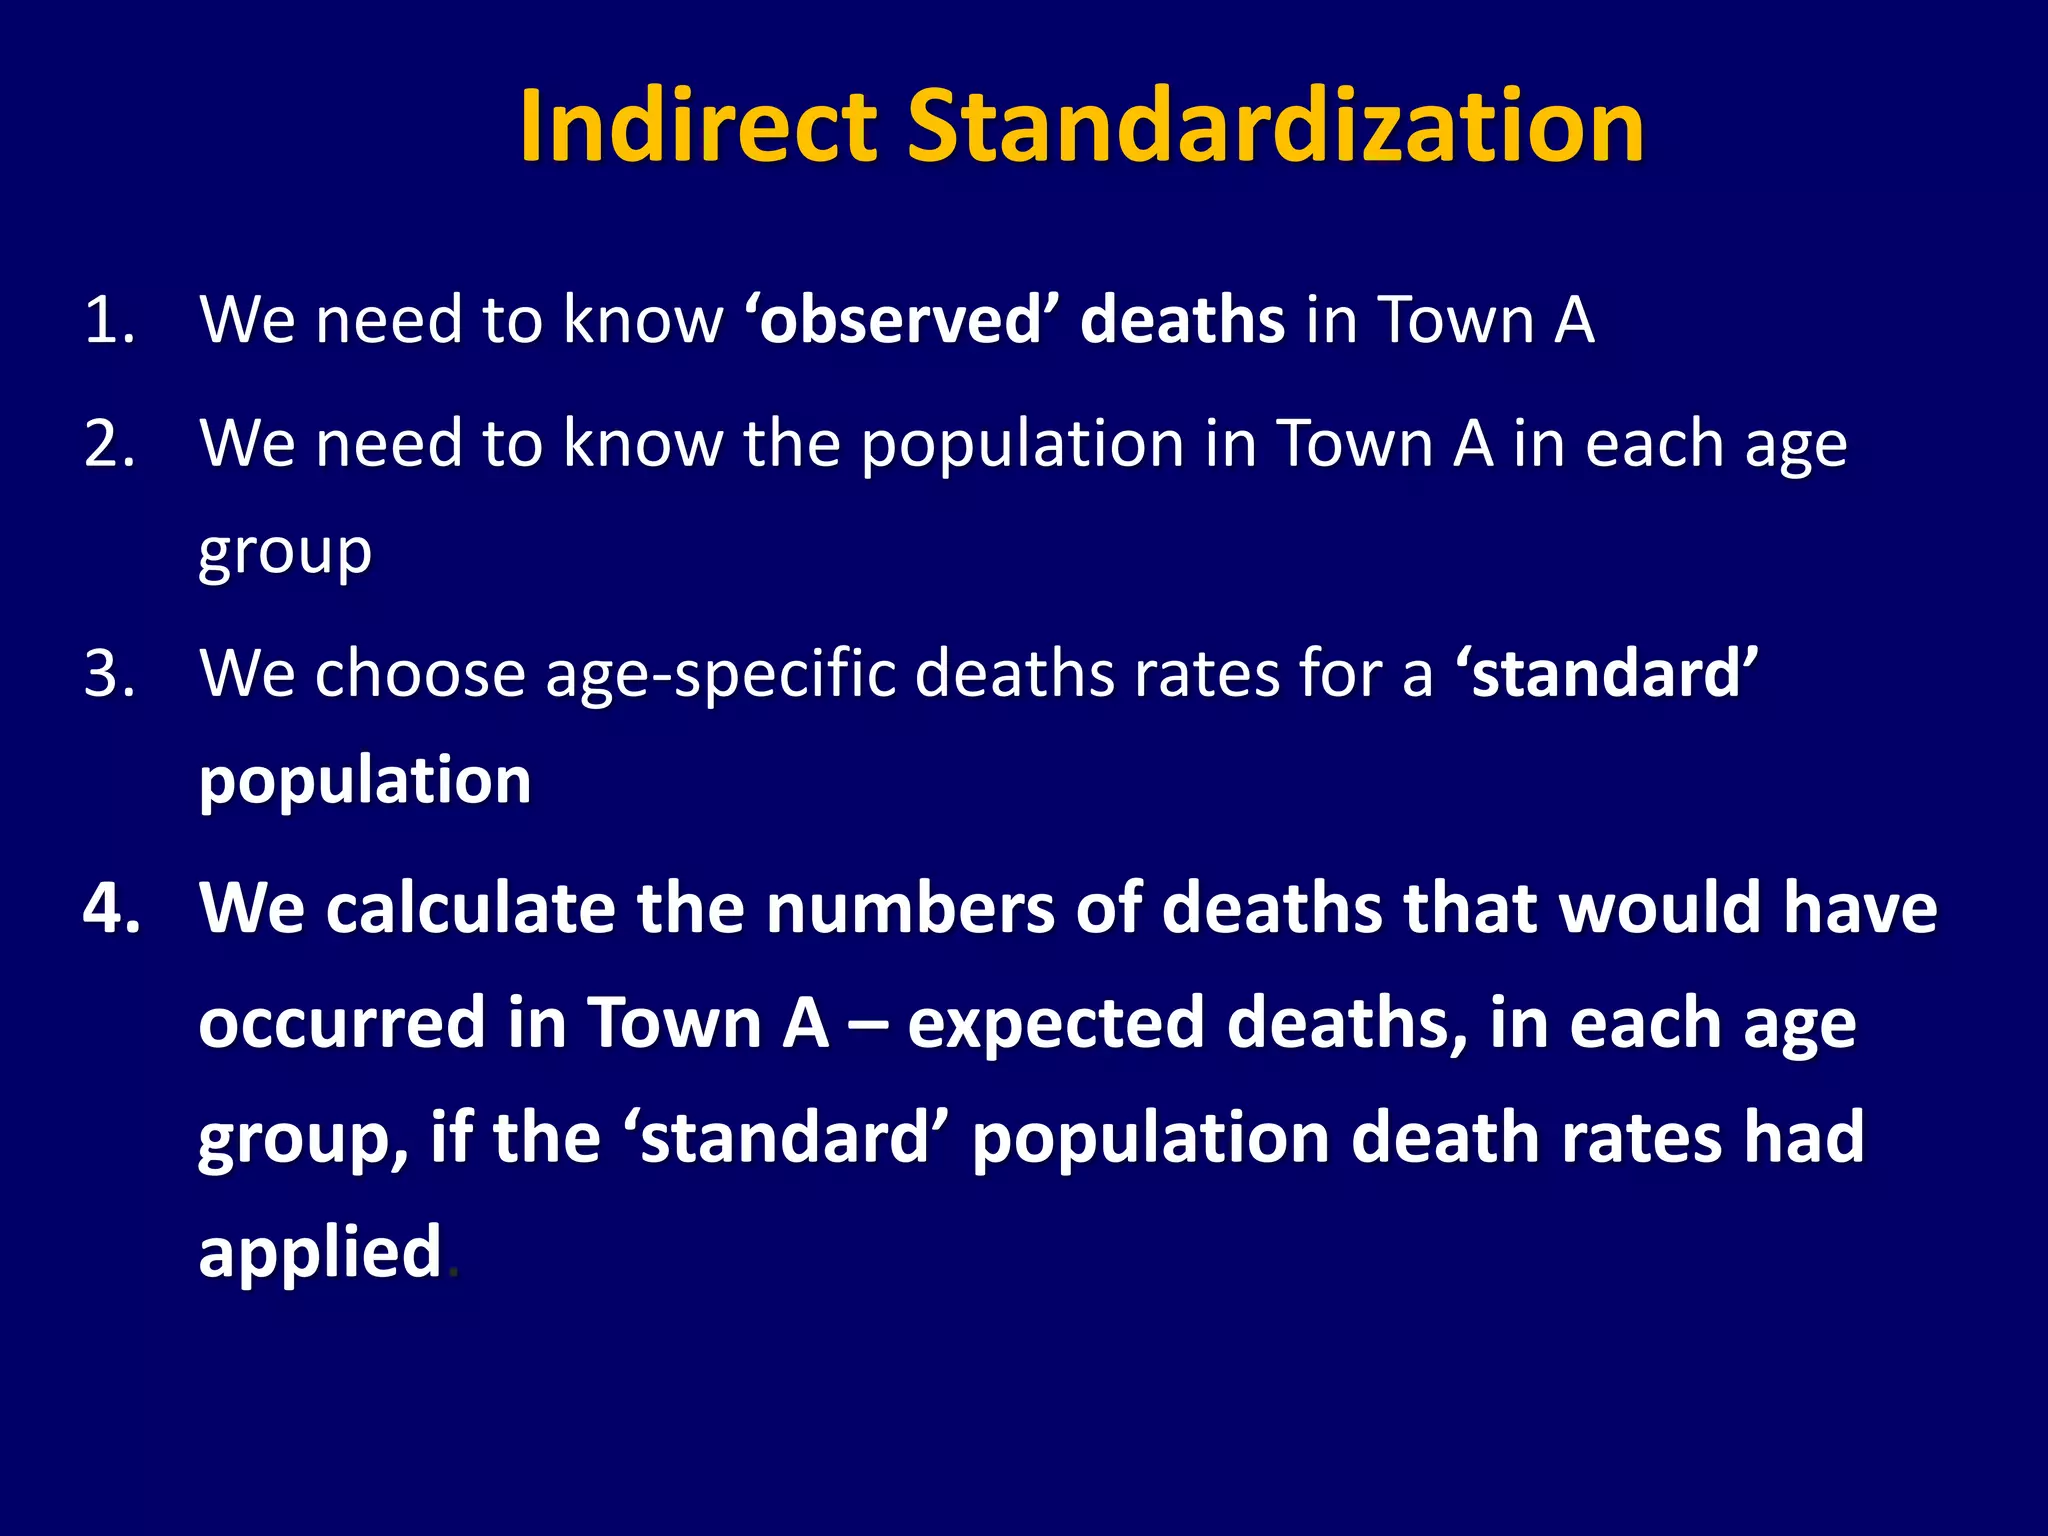

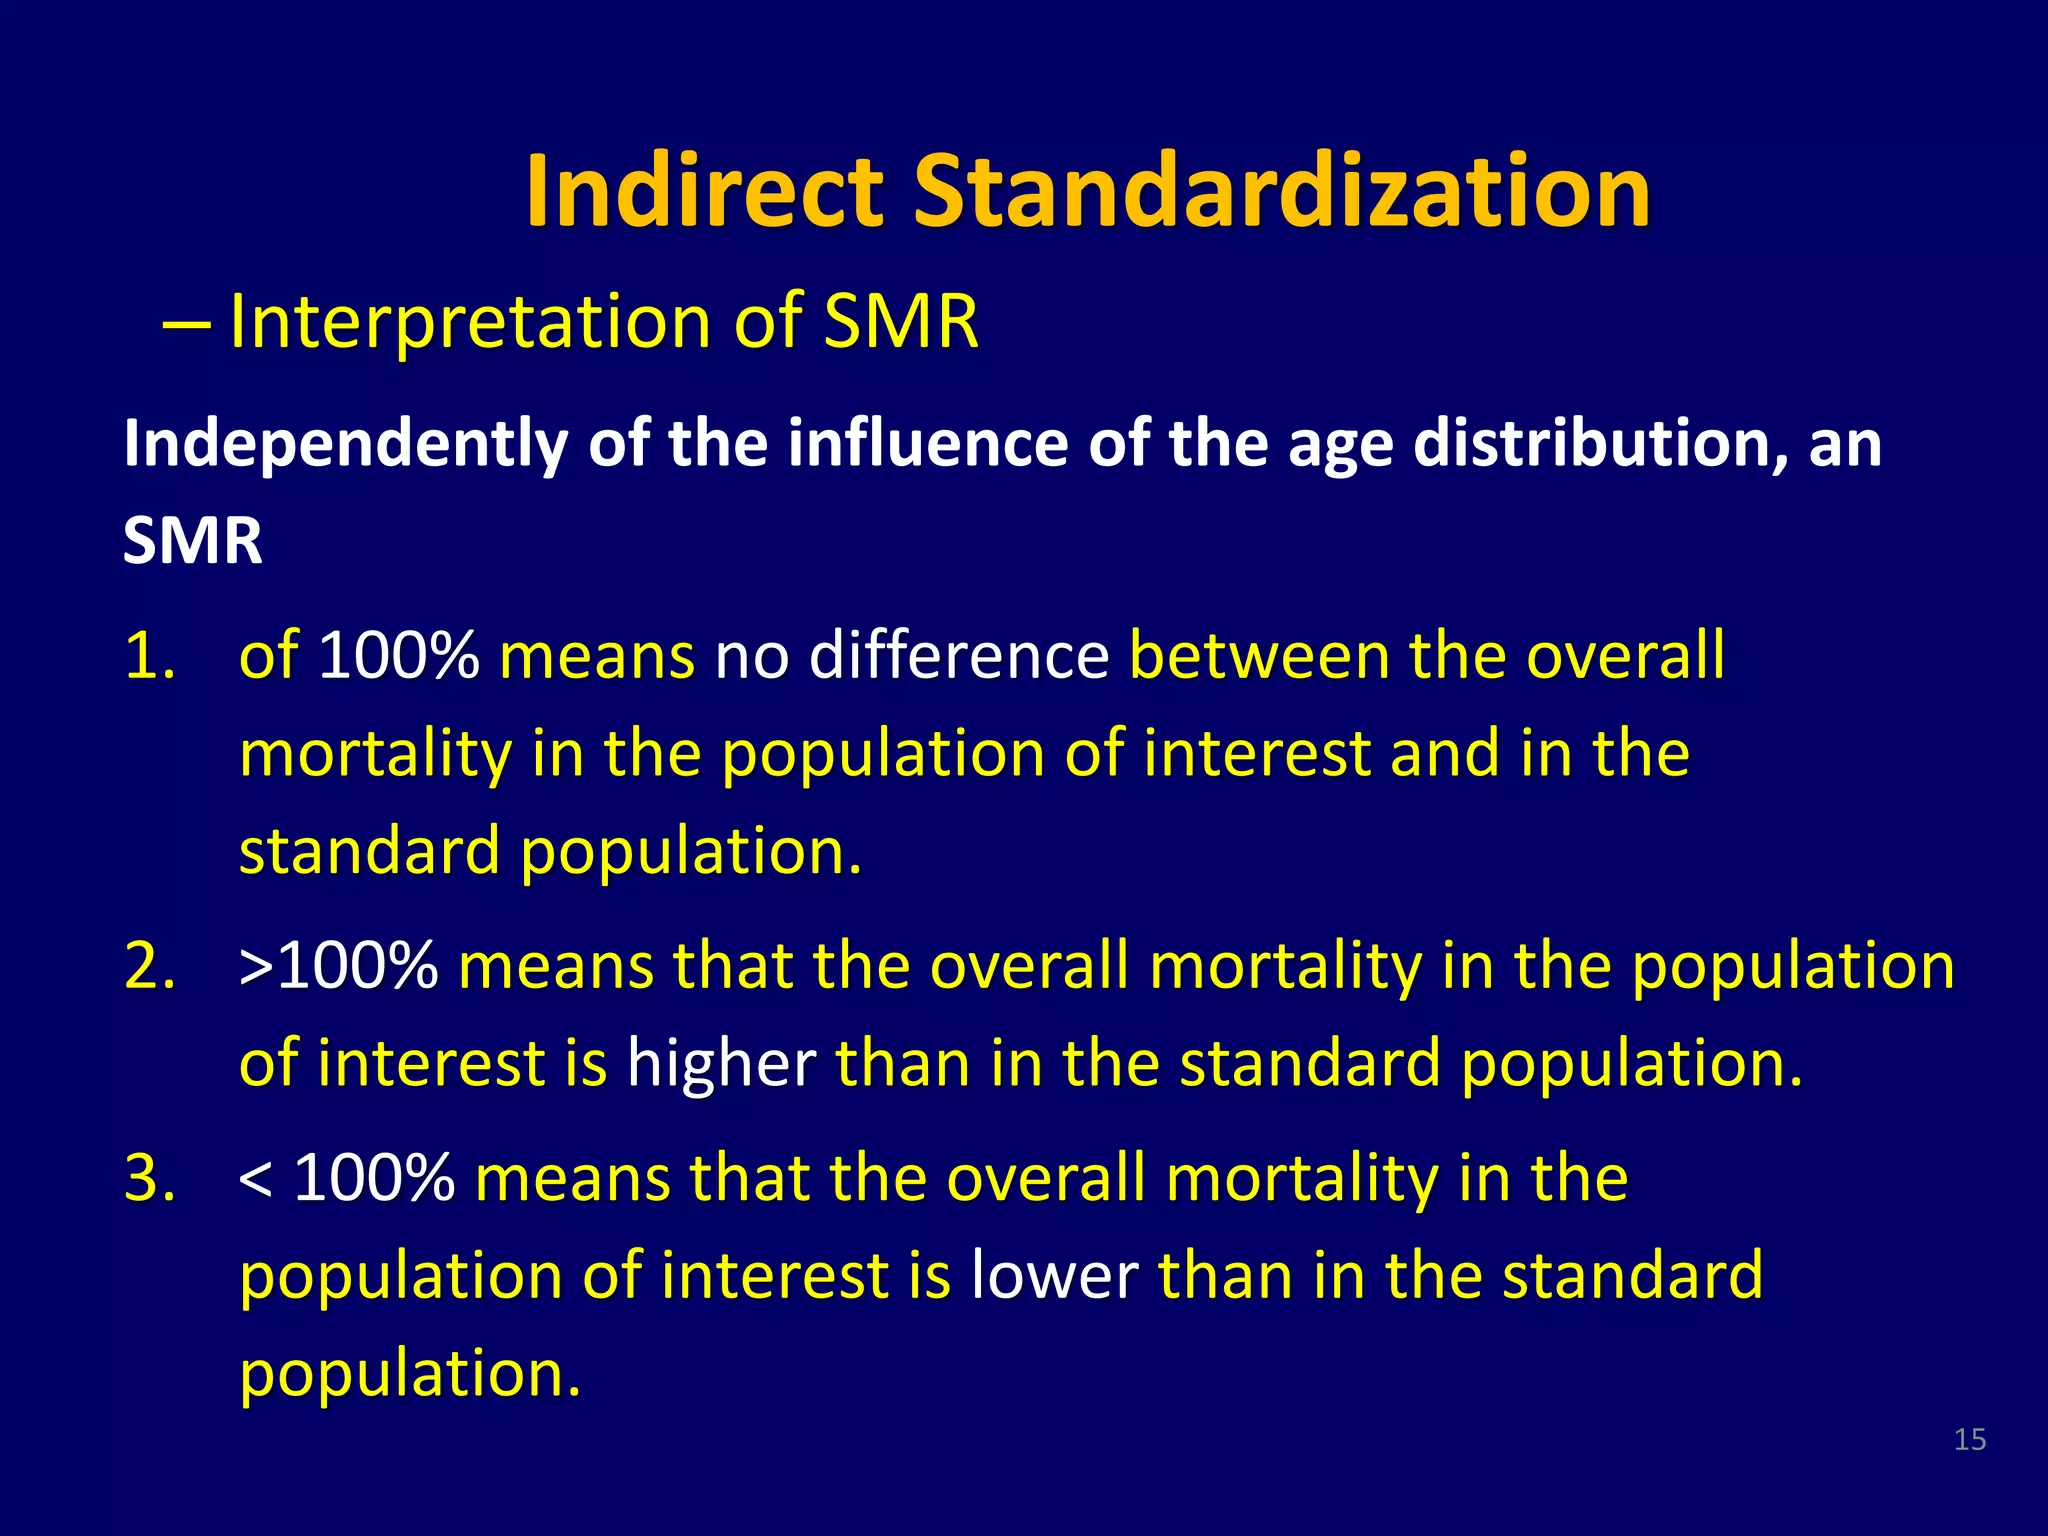


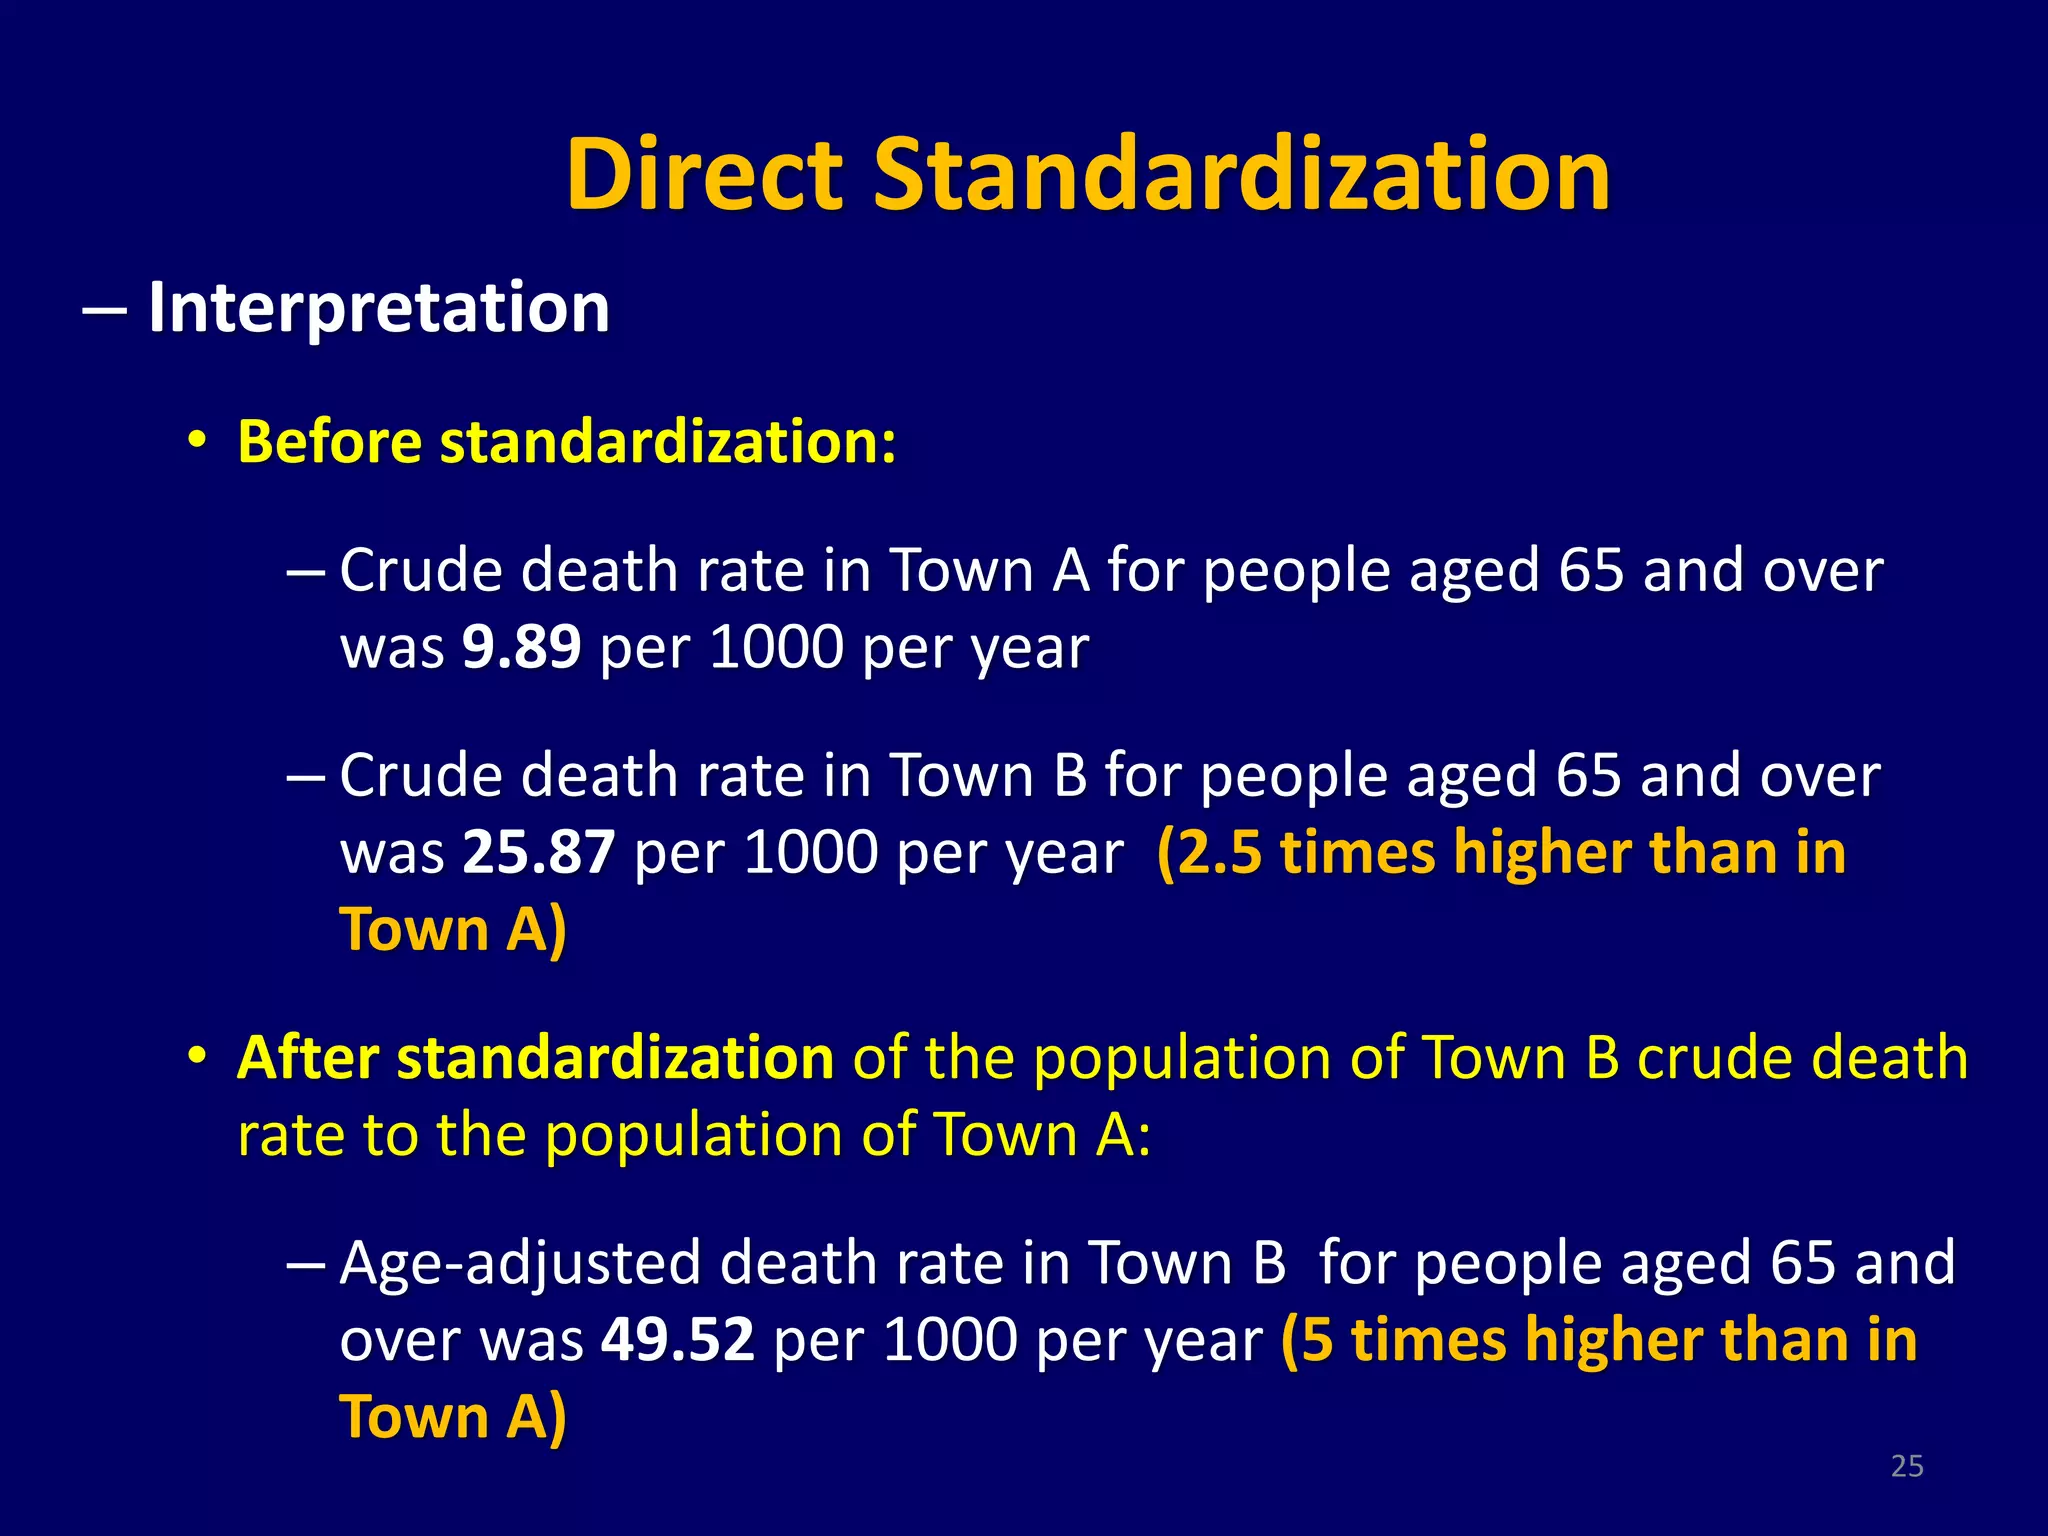
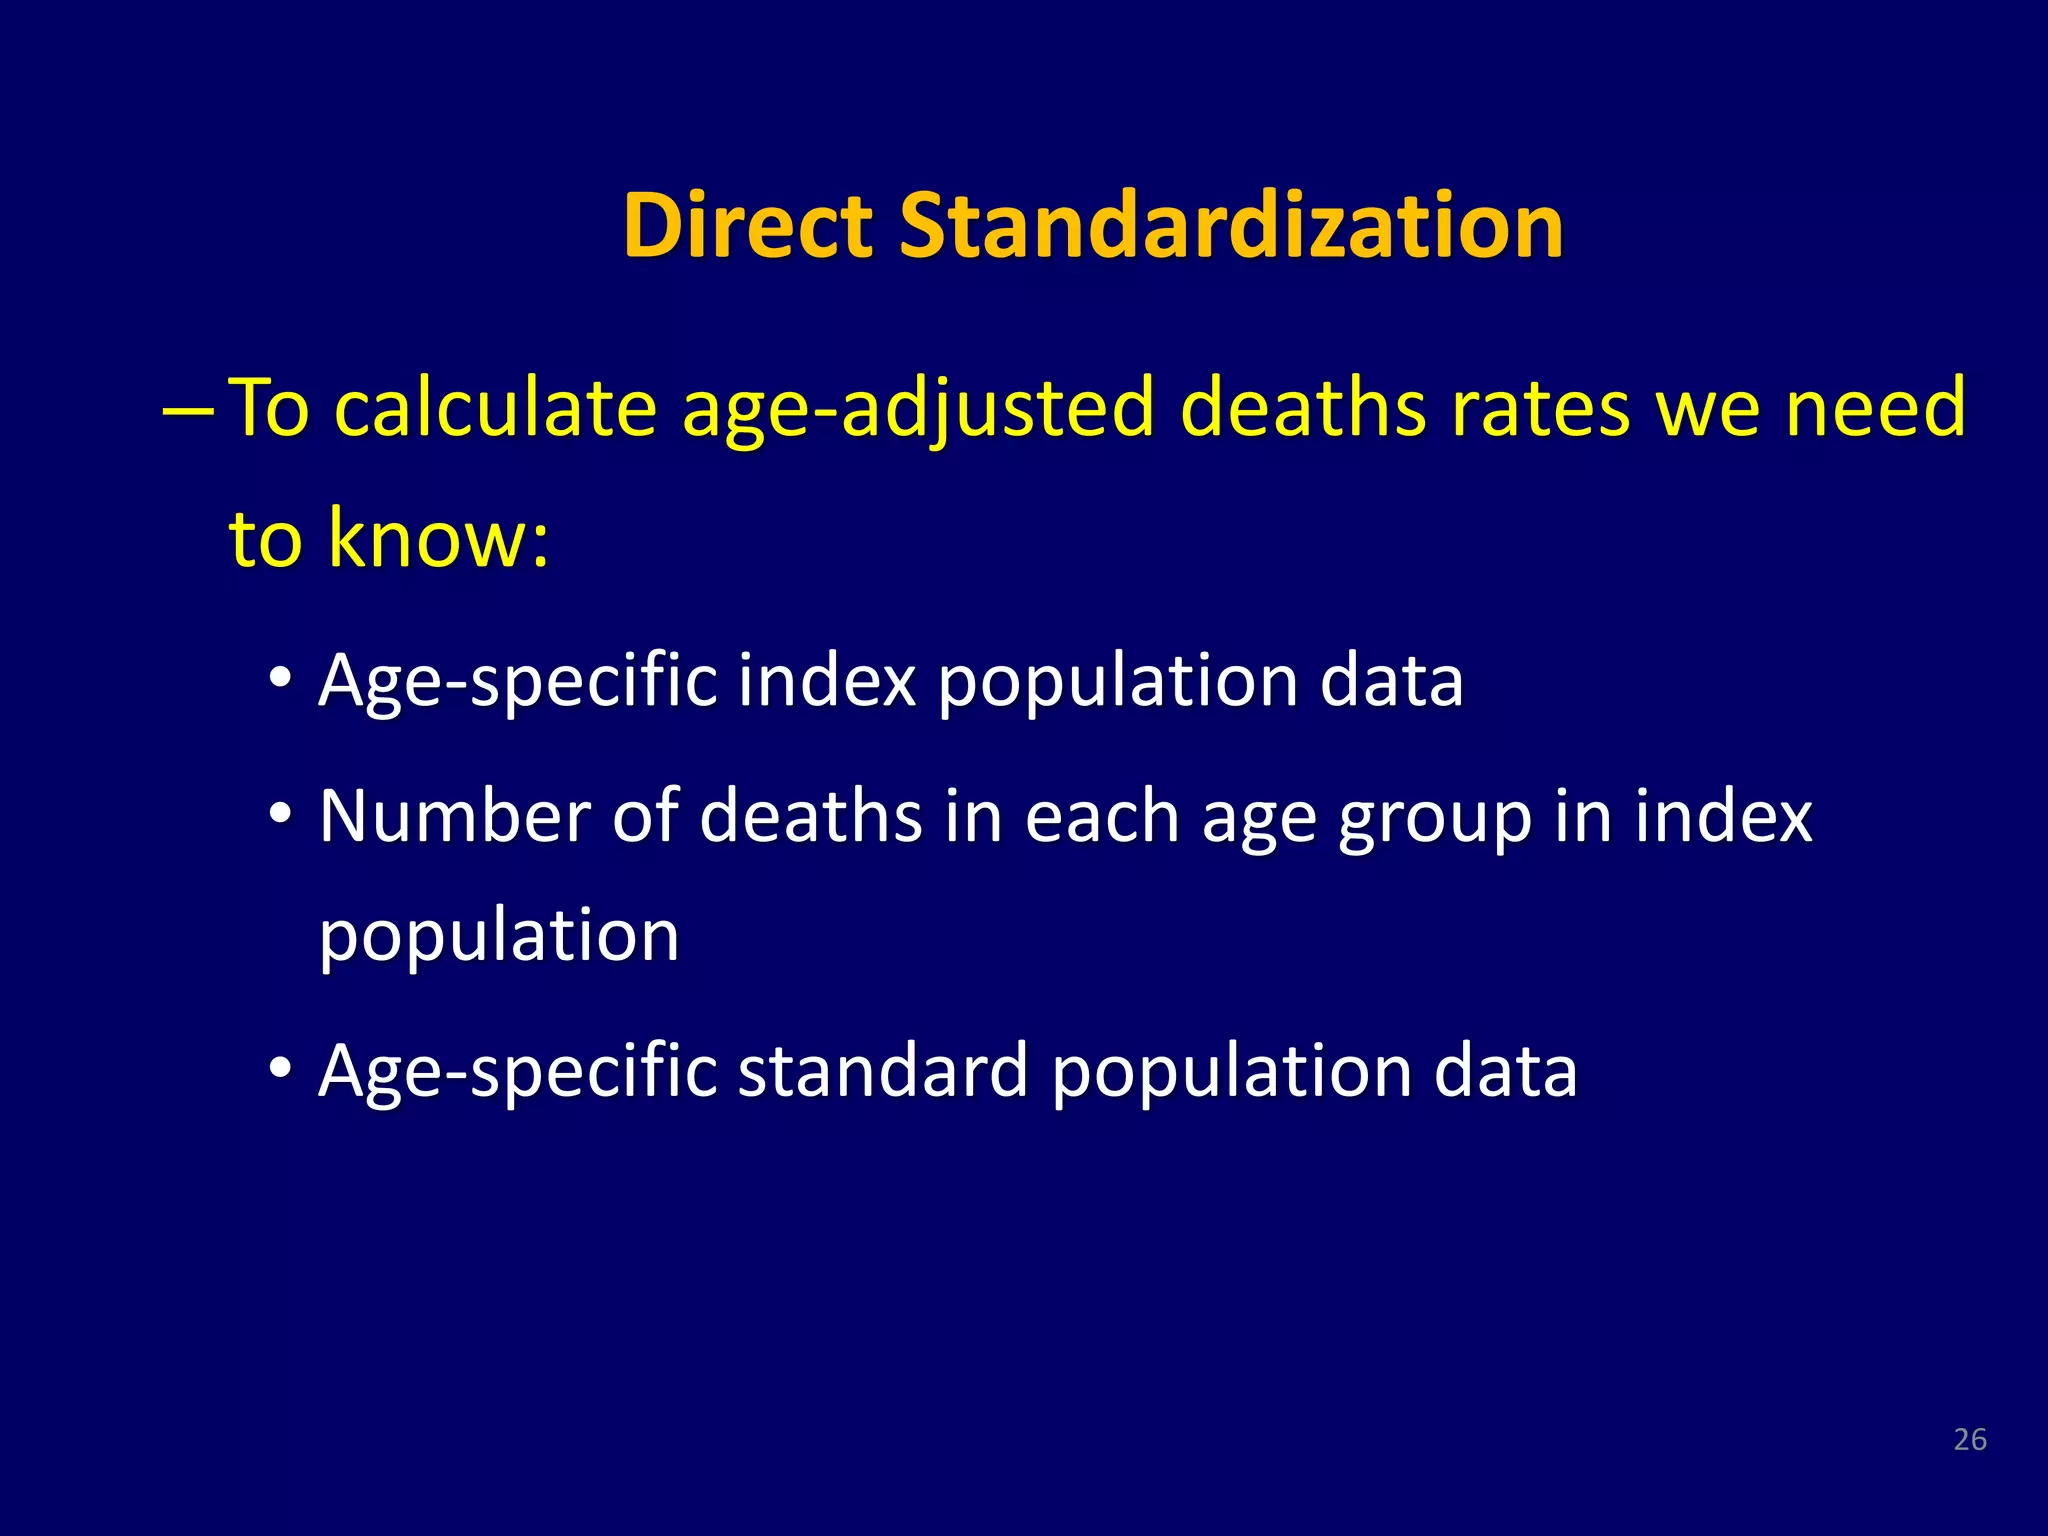

The document discusses the standardization of mortality rates between two towns with differing socioeconomic characteristics and age distributions. It explains indirect and direct methods of standardization to derive standardized mortality ratios (SMR) and age-adjusted death rates, concluding that town A has higher mortality compared to the country average, while town B's mortality is similar to the standard population. The document emphasizes the importance of standardization in comparing mortality rates effectively by adjusting for age and other factors.


