Health related statesor events.
• Disease (morbidity)
• Death (mortality)
• Births (natality)
• Effects of intervention, etc
4.
Counting disease (frequencies)
•The occurrence (frequency) of a
condition or event in the population
may be reported
– in absolute number (of limited use)
– As a fraction: ratio, proportion or rate
5.
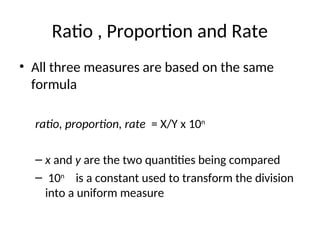
Ratio , Proportionand Rate
• All three measures are based on the same
formula
ratio, proportion, rate = X/Y x 10n
– x and y are the two quantities being compared
– 10n
is a constant used to transform the division
into a uniform measure
6.
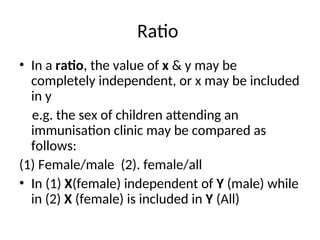
Ratio
• In aratio, the value of x & y may be
completely independent, or x may be included
in y
e.g. the sex of children attending an
immunisation clinic may be compared as
follows:
(1) Female/male (2). female/all
• In (1) X(female) independent of Y (male) while
in (2) X (female) is included in Y (All)
7.
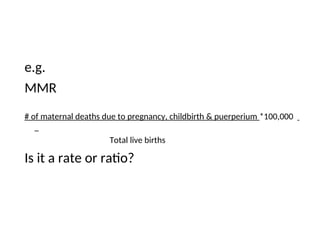
e.g.
MMR
# of maternaldeaths due to pregnancy, childbirth & puerperium *100,000
Total live births
Is it a rate or ratio?
8.
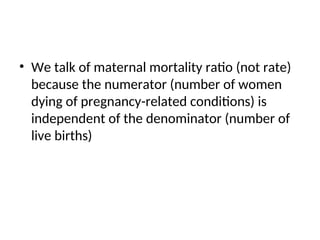
• We talkof maternal mortality ratio (not rate)
because the numerator (number of women
dying of pregnancy-related conditions) is
independent of the denominator (number of
live births)
9.
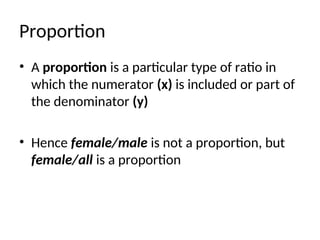
Proportion
• A proportionis a particular type of ratio in
which the numerator (x) is included or part of
the denominator (y)
• Hence female/male is not a proportion, but
female/all is a proportion
10.
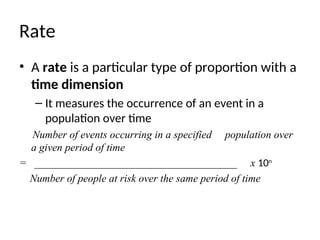
Rate
• A rateis a particular type of proportion with a
time dimension
– It measures the occurrence of an event in a
population over time
Number of events occurring in a specified population over
a given period of time
= ______________________________________ x 10n
Number of people at risk over the same period of time
11.
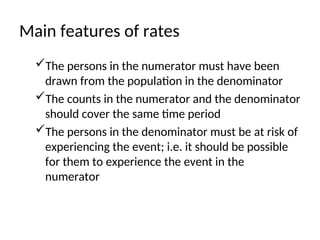
Main features ofrates
The persons in the numerator must have been
drawn from the population in the denominator
The counts in the numerator and the denominator
should cover the same time period
The persons in the denominator must be at risk of
experiencing the event; i.e. it should be possible
for them to experience the event in the
numerator
12.
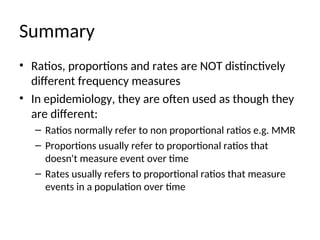
Summary
• Ratios, proportionsand rates are NOT distinctively
different frequency measures
• In epidemiology, they are often used as though they
are different:
– Ratios normally refer to non proportional ratios e.g. MMR
– Proportions usually refer to proportional ratios that
doesn't measure event over time
– Rates usually refers to proportional ratios that measure
events in a population over time
13.
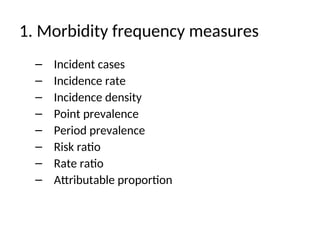
1. Morbidity frequencymeasures
– Incident cases
– Incidence rate
– Incidence density
– Point prevalence
– Period prevalence
– Risk ratio
– Rate ratio
– Attributable proportion
14.
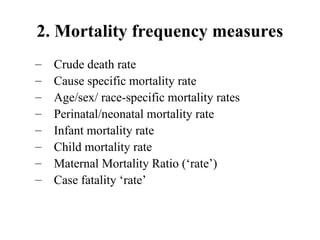
2. Mortality frequencymeasures
– Crude death rate
– Cause specific mortality rate
– Age/sex/ race-specific mortality rates
– Perinatal/neonatal mortality rate
– Infant mortality rate
– Child mortality rate
– Maternal Mortality Ratio (‘rate’)
– Case fatality ‘rate’
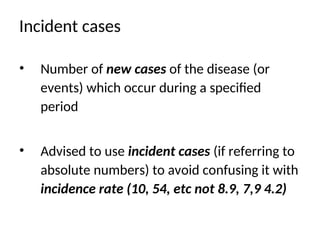
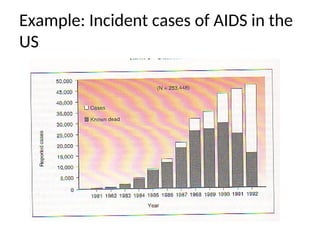
Incident cases
• Numberof new cases of the disease (or
events) which occur during a specified
period
• Advised to use incident cases (if referring to
absolute numbers) to avoid confusing it with
incidence rate (10, 54, etc not 8.9, 7,9 4.2)
17.
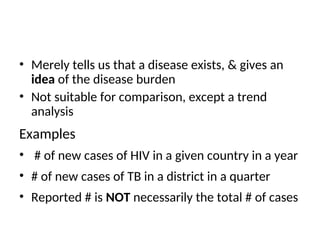
• Merely tellsus that a disease exists, & gives an
idea of the disease burden
• Not suitable for comparison, except a trend
analysis
Examples
• # of new cases of HIV in a given country in a year
• # of new cases of TB in a district in a quarter
• Reported # is NOT necessarily the total # of cases
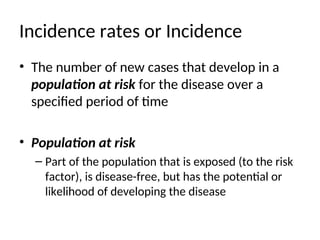
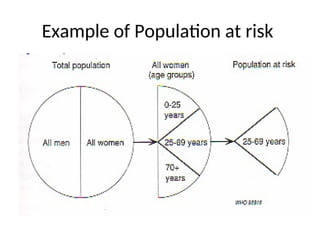
Incidence rates orIncidence
• The number of new cases that develop in a
population at risk for the disease over a
specified period of time
• Population at risk
– Part of the population that is exposed (to the risk
factor), is disease-free, but has the potential or
likelihood of developing the disease
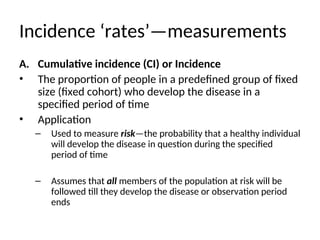
Incidence ‘rates’—measurements
A. Cumulativeincidence (CI) or Incidence
• The proportion of people in a predefined group of fixed
size (fixed cohort) who develop the disease in a
specified period of time
• Application
– Used to measure risk—the probability that a healthy individual
will develop the disease in question during the specified
period of time
– Assumes that all members of the population at risk will be
followed till they develop the disease or observation period
ends
22.
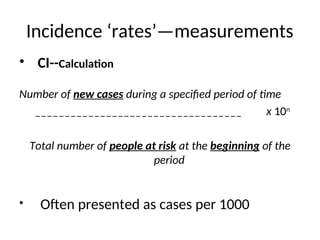
Incidence ‘rates’—measurements
• CI--Calculation
Numberof new cases during a specified period of time
___________________________________ x 10n
Total number of people at risk at the beginning of the
period
• Often presented as cases per 1000
23.
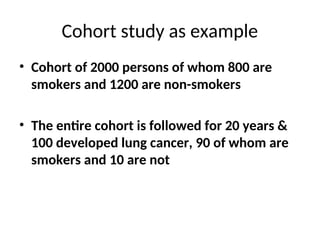
Cohort study asexample
• Cohort of 2000 persons of whom 800 are
smokers and 1200 are non-smokers
• The entire cohort is followed for 20 years &
100 developed lung cancer, 90 of whom are
smokers and 10 are not
24.
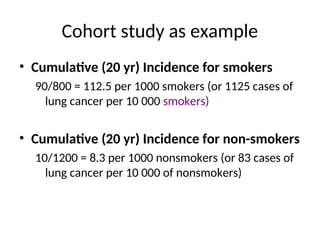
Cohort study asexample
• Cumulative (20 yr) Incidence for smokers
90/800 = 112.5 per 1000 smokers (or 1125 cases of
lung cancer per 10 000 smokers)
• Cumulative (20 yr) Incidence for non-smokers
10/1200 = 8.3 per 1000 nonsmokers (or 83 cases of
lung cancer per 10 000 of nonsmokers)
25.
Incidence ‘rates’—measurements
B. IncidenceDensity (ID)
• Also known as incidence rate, hazard rate or
force of morbidity or mortality)
• Refers to the rate at which new cases occur
in a population given that the population is
studied, and is at risk, for varying lengths of
time (real-life study situations)
26.
Incidence ‘rates’—measurements
B. Incidencedensity (ID)
• In real life, patients are continuously
enrolled in a study over a long period of
time. They may complete the study, drop
out or die of other causes
• Estimate of the average at which a disease
develops in a population over a specified
time period
27.
Incidence ‘rates’—measurements
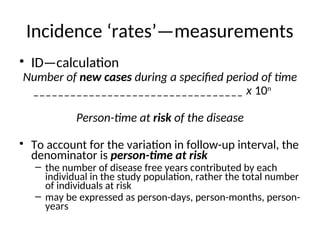
• ID—calculation
Numberof new cases during a specified period of time
__________________________________ x 10n
Person-time at risk of the disease
• To account for the variation in follow-up interval, the
denominator is person-time at risk
– the number of disease free years contributed by each
individual in the study population, rather the total number
of individuals at risk
– may be expressed as person-days, person-months, person-
years
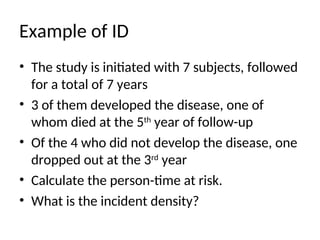
Example of ID
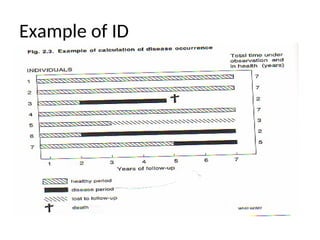
•The study is initiated with 7 subjects, followed
for a total of 7 years
• 3 of them developed the disease, one of
whom died at the 5th
year of follow-up
• Of the 4 who did not develop the disease, one
dropped out at the 3rd
year
• Calculate the person-time at risk.
• What is the incident density?
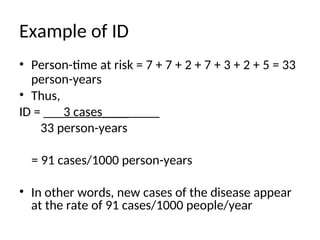
30.
Example of ID
•Person-time at risk = 7 + 7 + 2 + 7 + 3 + 2 + 5 = 33
person-years
• Thus,
ID = ___3 cases____
33 person-years
= 91 cases/1000 person-years
• In other words, new cases of the disease appear
at the rate of 91 cases/1000 people/year
31.
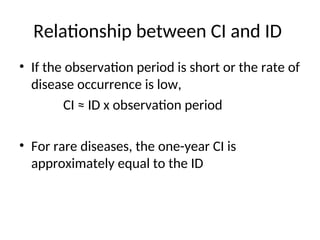
Relationship between CIand ID
• If the observation period is short or the rate of
disease occurrence is low,
CI ≈ ID x observation period
• For rare diseases, the one-year CI is
approximately equal to the ID
32.
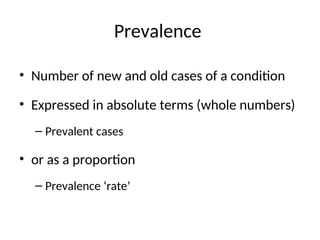
Prevalence
• Number ofnew and old cases of a condition
• Expressed in absolute terms (whole numbers)
– Prevalent cases
• or as a proportion
– Prevalence ‘rate’
33.
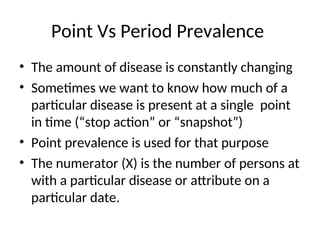
Point Vs PeriodPrevalence
• The amount of disease is constantly changing
• Sometimes we want to know how much of a
particular disease is present at a single point
in time (“stop action” or “snapshot”)
• Point prevalence is used for that purpose
• The numerator (X) is the number of persons at
with a particular disease or attribute on a
particular date.
34.
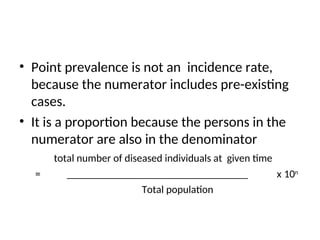
• Point prevalenceis not an incidence rate,
because the numerator includes pre-existing
cases.
• It is a proportion because the persons in the
numerator are also in the denominator
total number of diseased individuals at given time
= __________________________________ x 10n
Total population
35.
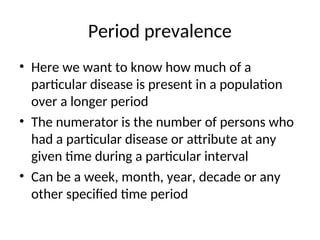
Period prevalence
• Herewe want to know how much of a
particular disease is present in a population
over a longer period
• The numerator is the number of persons who
had a particular disease or attribute at any
given time during a particular interval
• Can be a week, month, year, decade or any
other specified time period
36.
Period prevalence
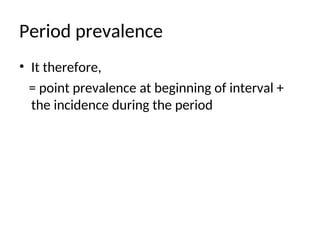
• Ittherefore,
= point prevalence at beginning of interval +
the incidence during the period
37.
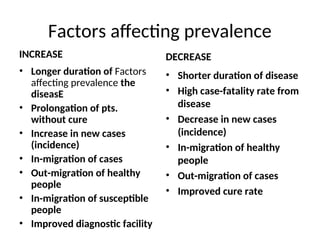
Factors affecting prevalence
INCREASE
•Longer duration of Factors
affecting prevalence the
diseasE
• Prolongation of pts.
without cure
• Increase in new cases
(incidence)
• In-migration of cases
• Out-migration of healthy
people
• In-migration of susceptible
people
• Improved diagnostic facility
DECREASE
• Shorter duration of disease
• High case-fatality rate from
disease
• Decrease in new cases
(incidence)
• In-migration of healthy
people
• Out-migration of cases
• Improved cure rate
38.
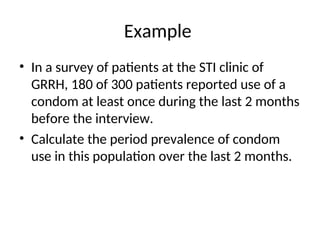
Example
• In asurvey of patients at the STI clinic of
GRRH, 180 of 300 patients reported use of a
condom at least once during the last 2 months
before the interview.
• Calculate the period prevalence of condom
use in this population over the last 2 months.
39.
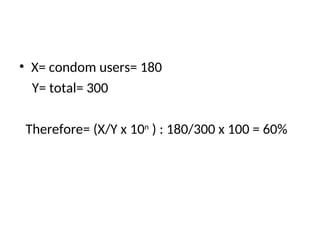
• X= condomusers= 180
Y= total= 300
Therefore= (X/Y x 10n
) : 180/300 x 100 = 60%
40.
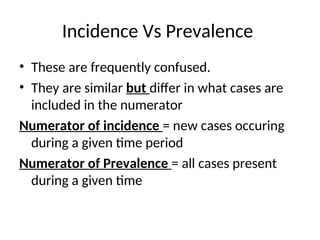
Incidence Vs Prevalence
•These are frequently confused.
• They are similar but differ in what cases are
included in the numerator
Numerator of incidence = new cases occuring
during a given time period
Numerator of Prevalence = all cases present
during a given time
41.
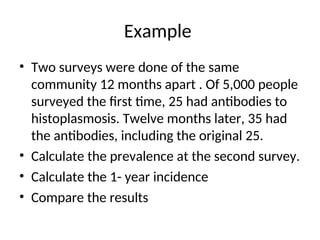
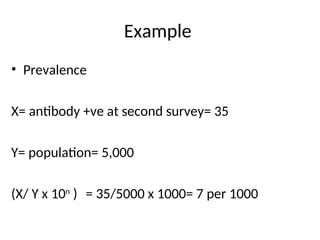
Example
• Two surveyswere done of the same
community 12 months apart . Of 5,000 people
surveyed the first time, 25 had antibodies to
histoplasmosis. Twelve months later, 35 had
the antibodies, including the original 25.
• Calculate the prevalence at the second survey.
• Calculate the 1- year incidence
• Compare the results
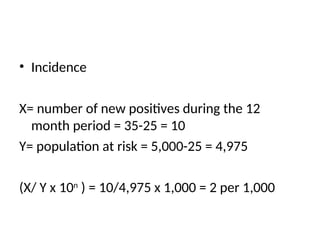
• Incidence
X= numberof new positives during the 12
month period = 35-25 = 10
Y= population at risk = 5,000-25 = 4,975
(X/ Y x 10n
) = 10/4,975 x 1,000 = 2 per 1,000
44.
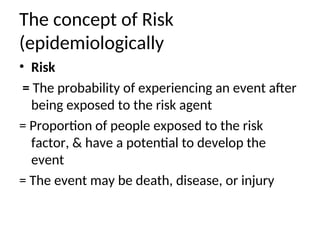
The concept ofRisk
(epidemiologically
• Risk
= The probability of experiencing an event after
being exposed to the risk agent
= Proportion of people exposed to the risk
factor, & have a potential to develop the
event
= The event may be death, disease, or injury
45.
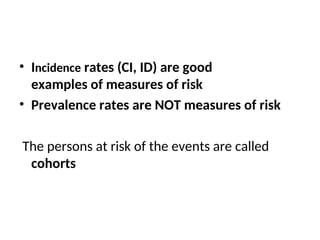
• Incidence rates(CI, ID) are good
examples of measures of risk
• Prevalence rates are NOT measures of risk
The persons at risk of the events are called
cohorts
46.
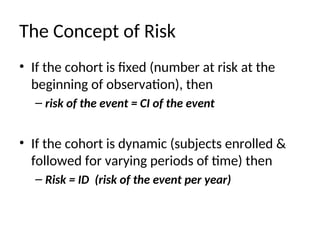
The Concept ofRisk
• If the cohort is fixed (number at risk at the
beginning of observation), then
– risk of the event = CI of the event
• If the cohort is dynamic (subjects enrolled &
followed for varying periods of time) then
– Risk = ID (risk of the event per year)
47.
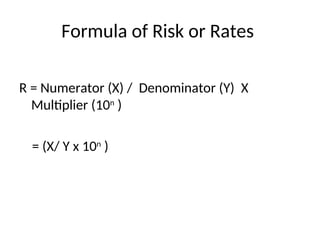
Formula of Riskor Rates
R = Numerator (X) / Denominator (Y) X
Multiplier (10n
)
= (X/ Y x 10n
)
48.
Risk and Rates
•When a constant multiplier is used, the value
of the numerator & the denominator are
multiplied by the same number so that the
value of the ratio is not changed
49.
Risk and Rates
Conditionsfor valid use of the term
• All the events counted in the numerator must
have happened to persons in the denominator.
• All the persons counted in the denominator
must have been at risk of the events in the
numerator (men can not be counted for CaCx.)
50.
Risk and Rates
Beforecomparing risks & rates
• Numerators for all groups must be defined or
diagnosed in the same way
• Constant multipliers must be the same
• The time interval must be the same