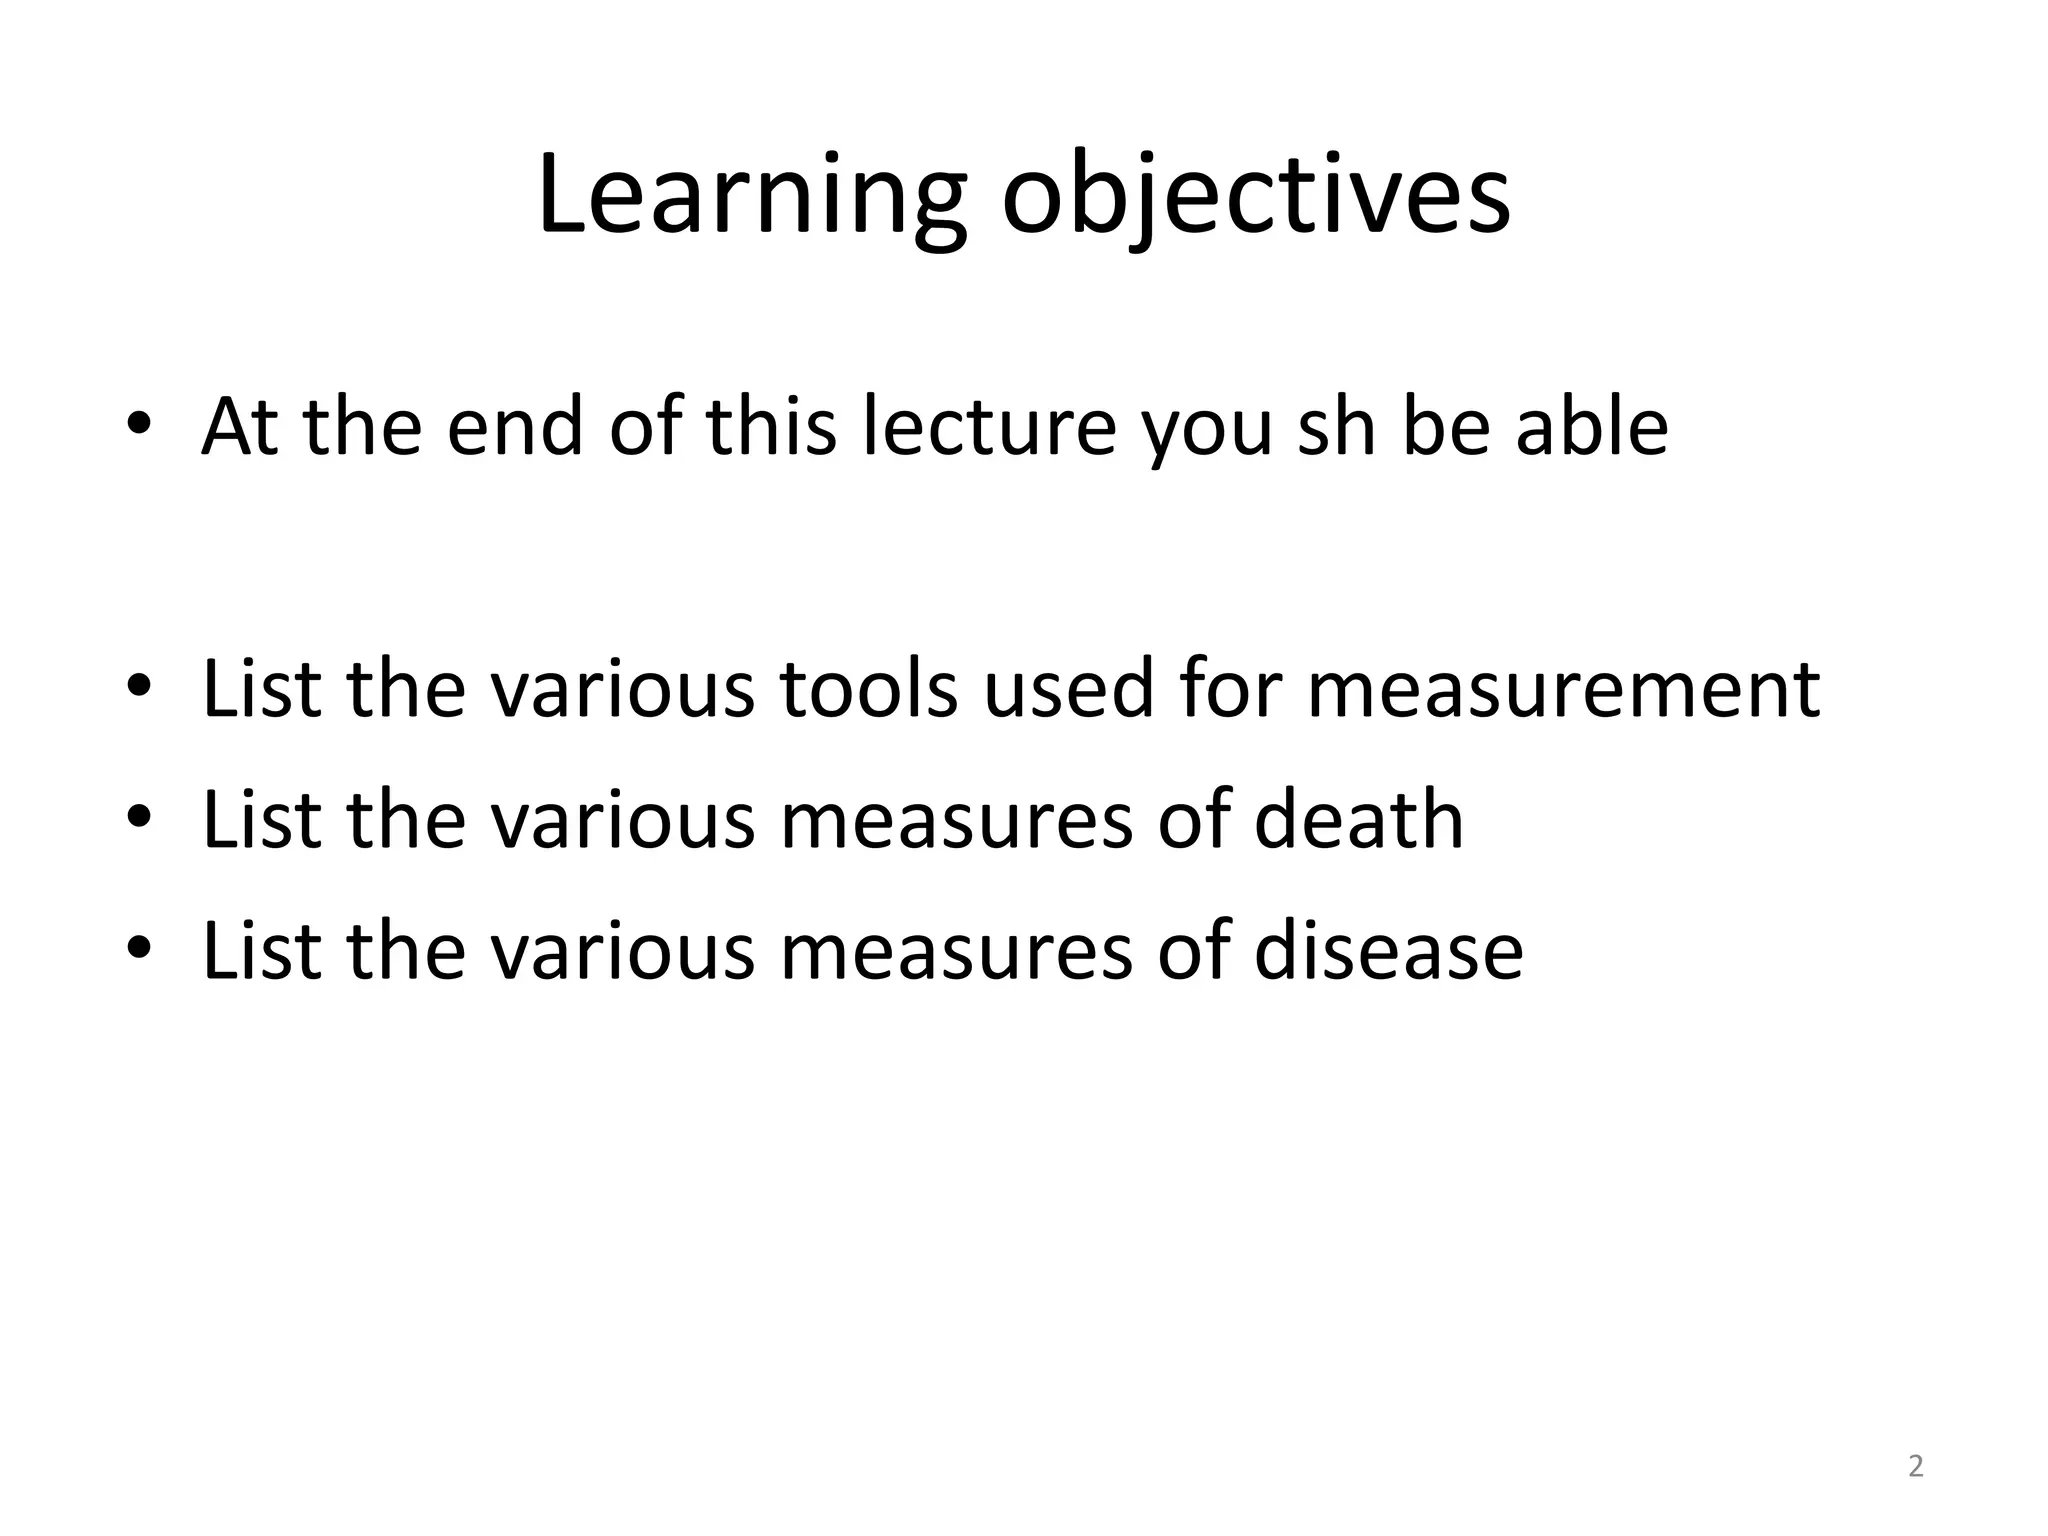
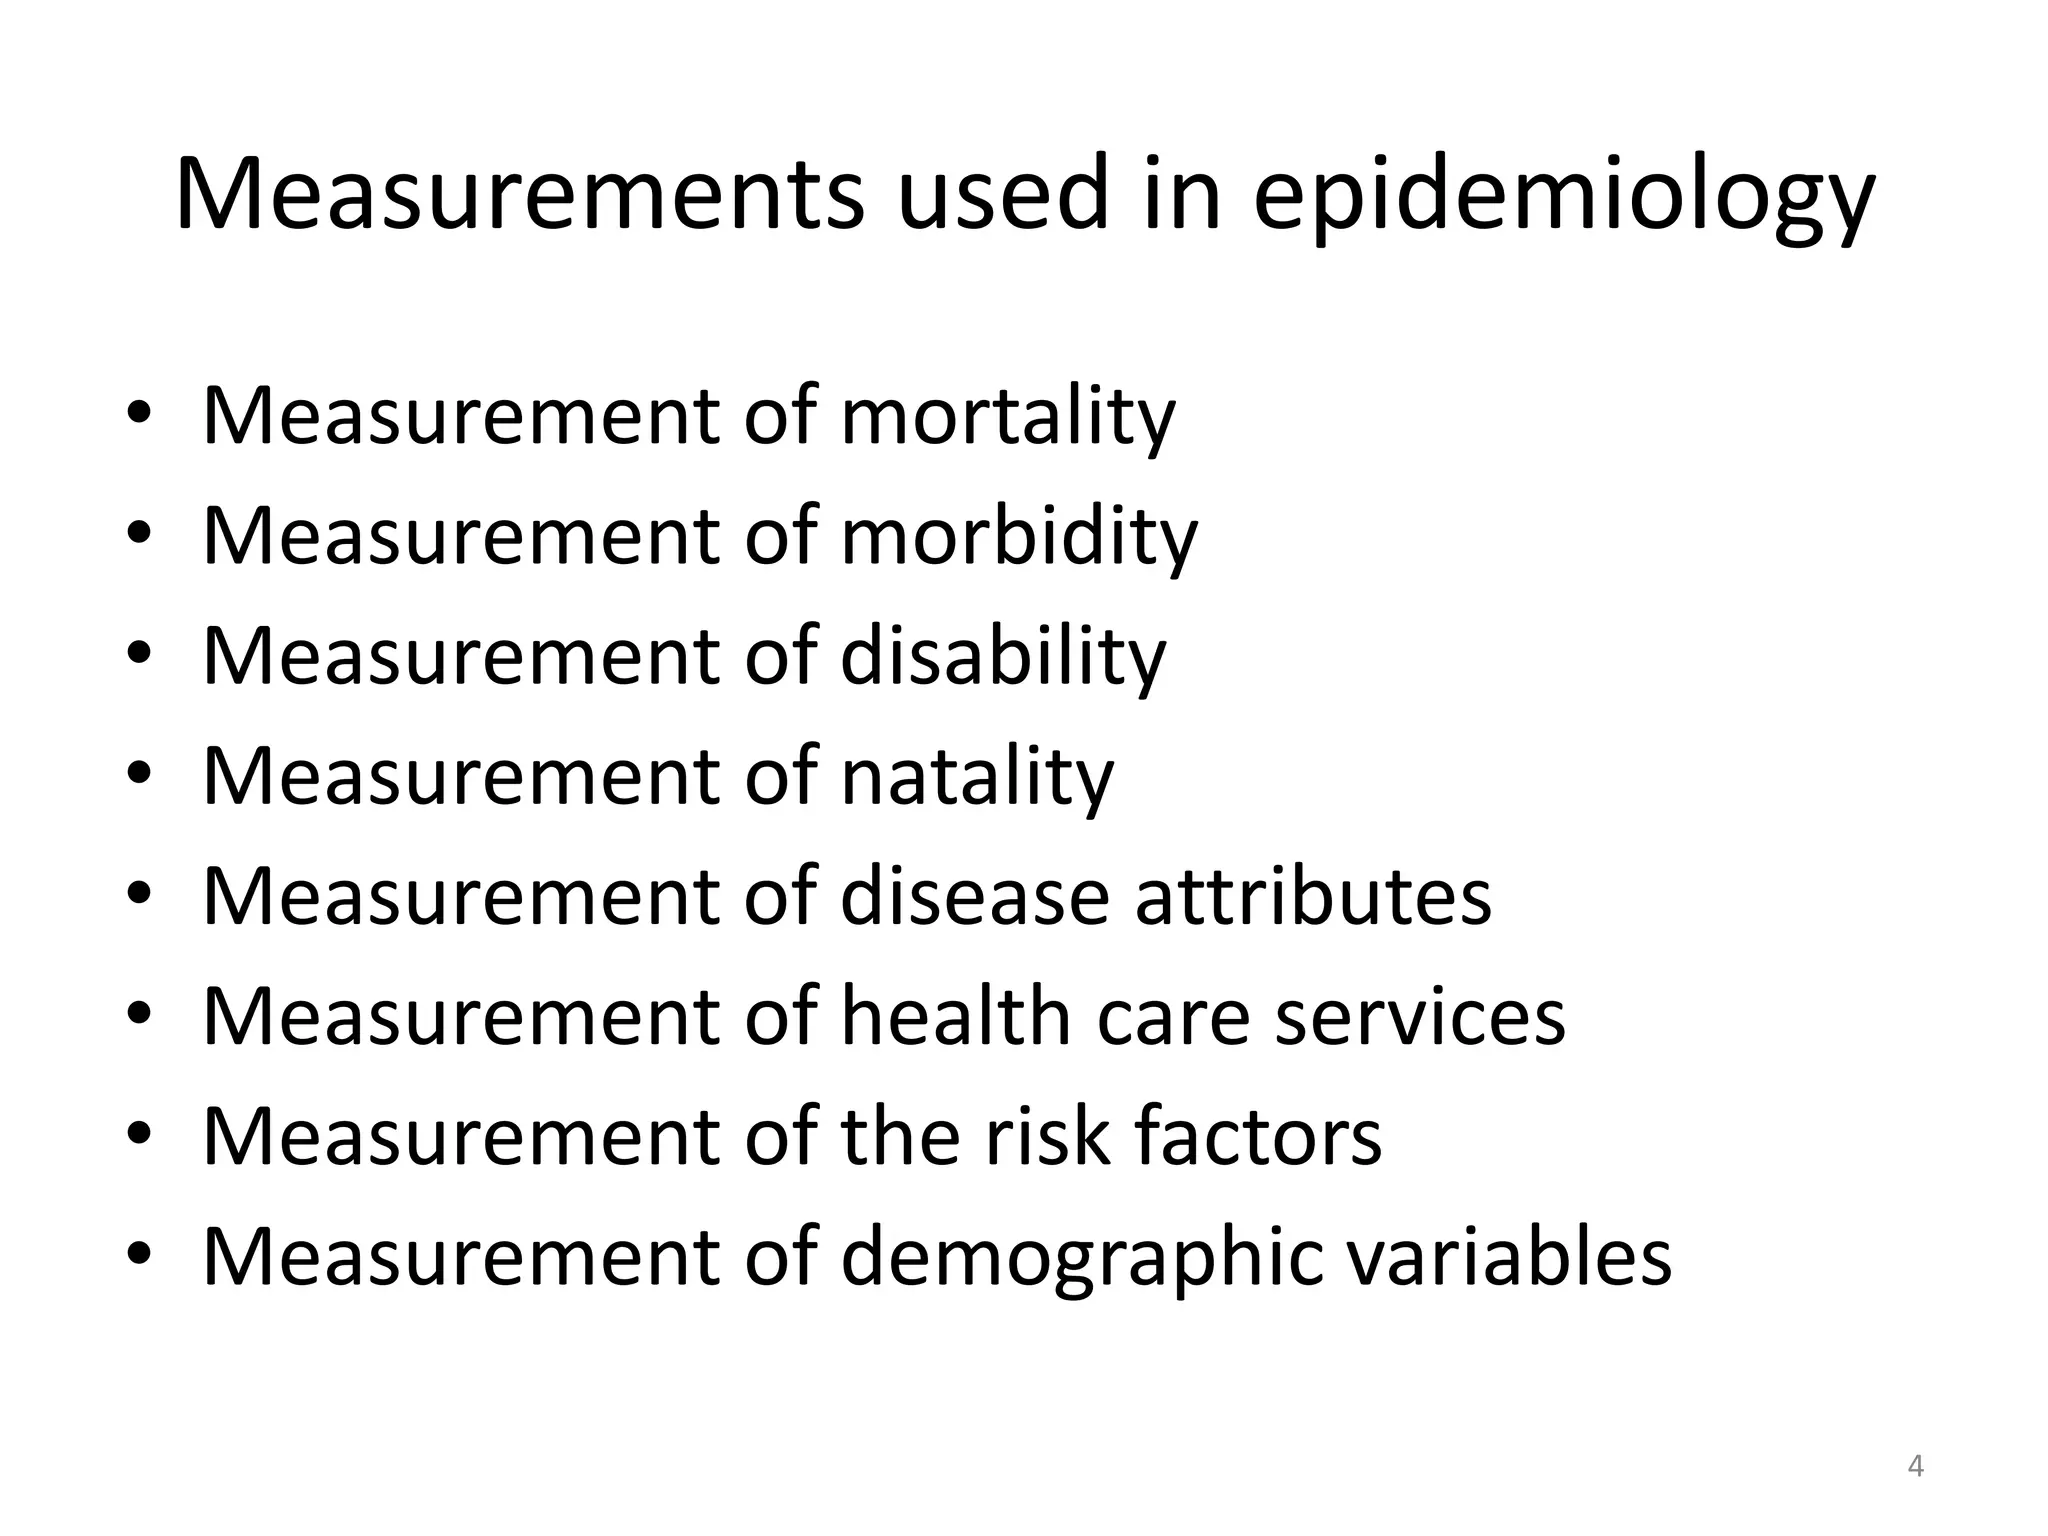
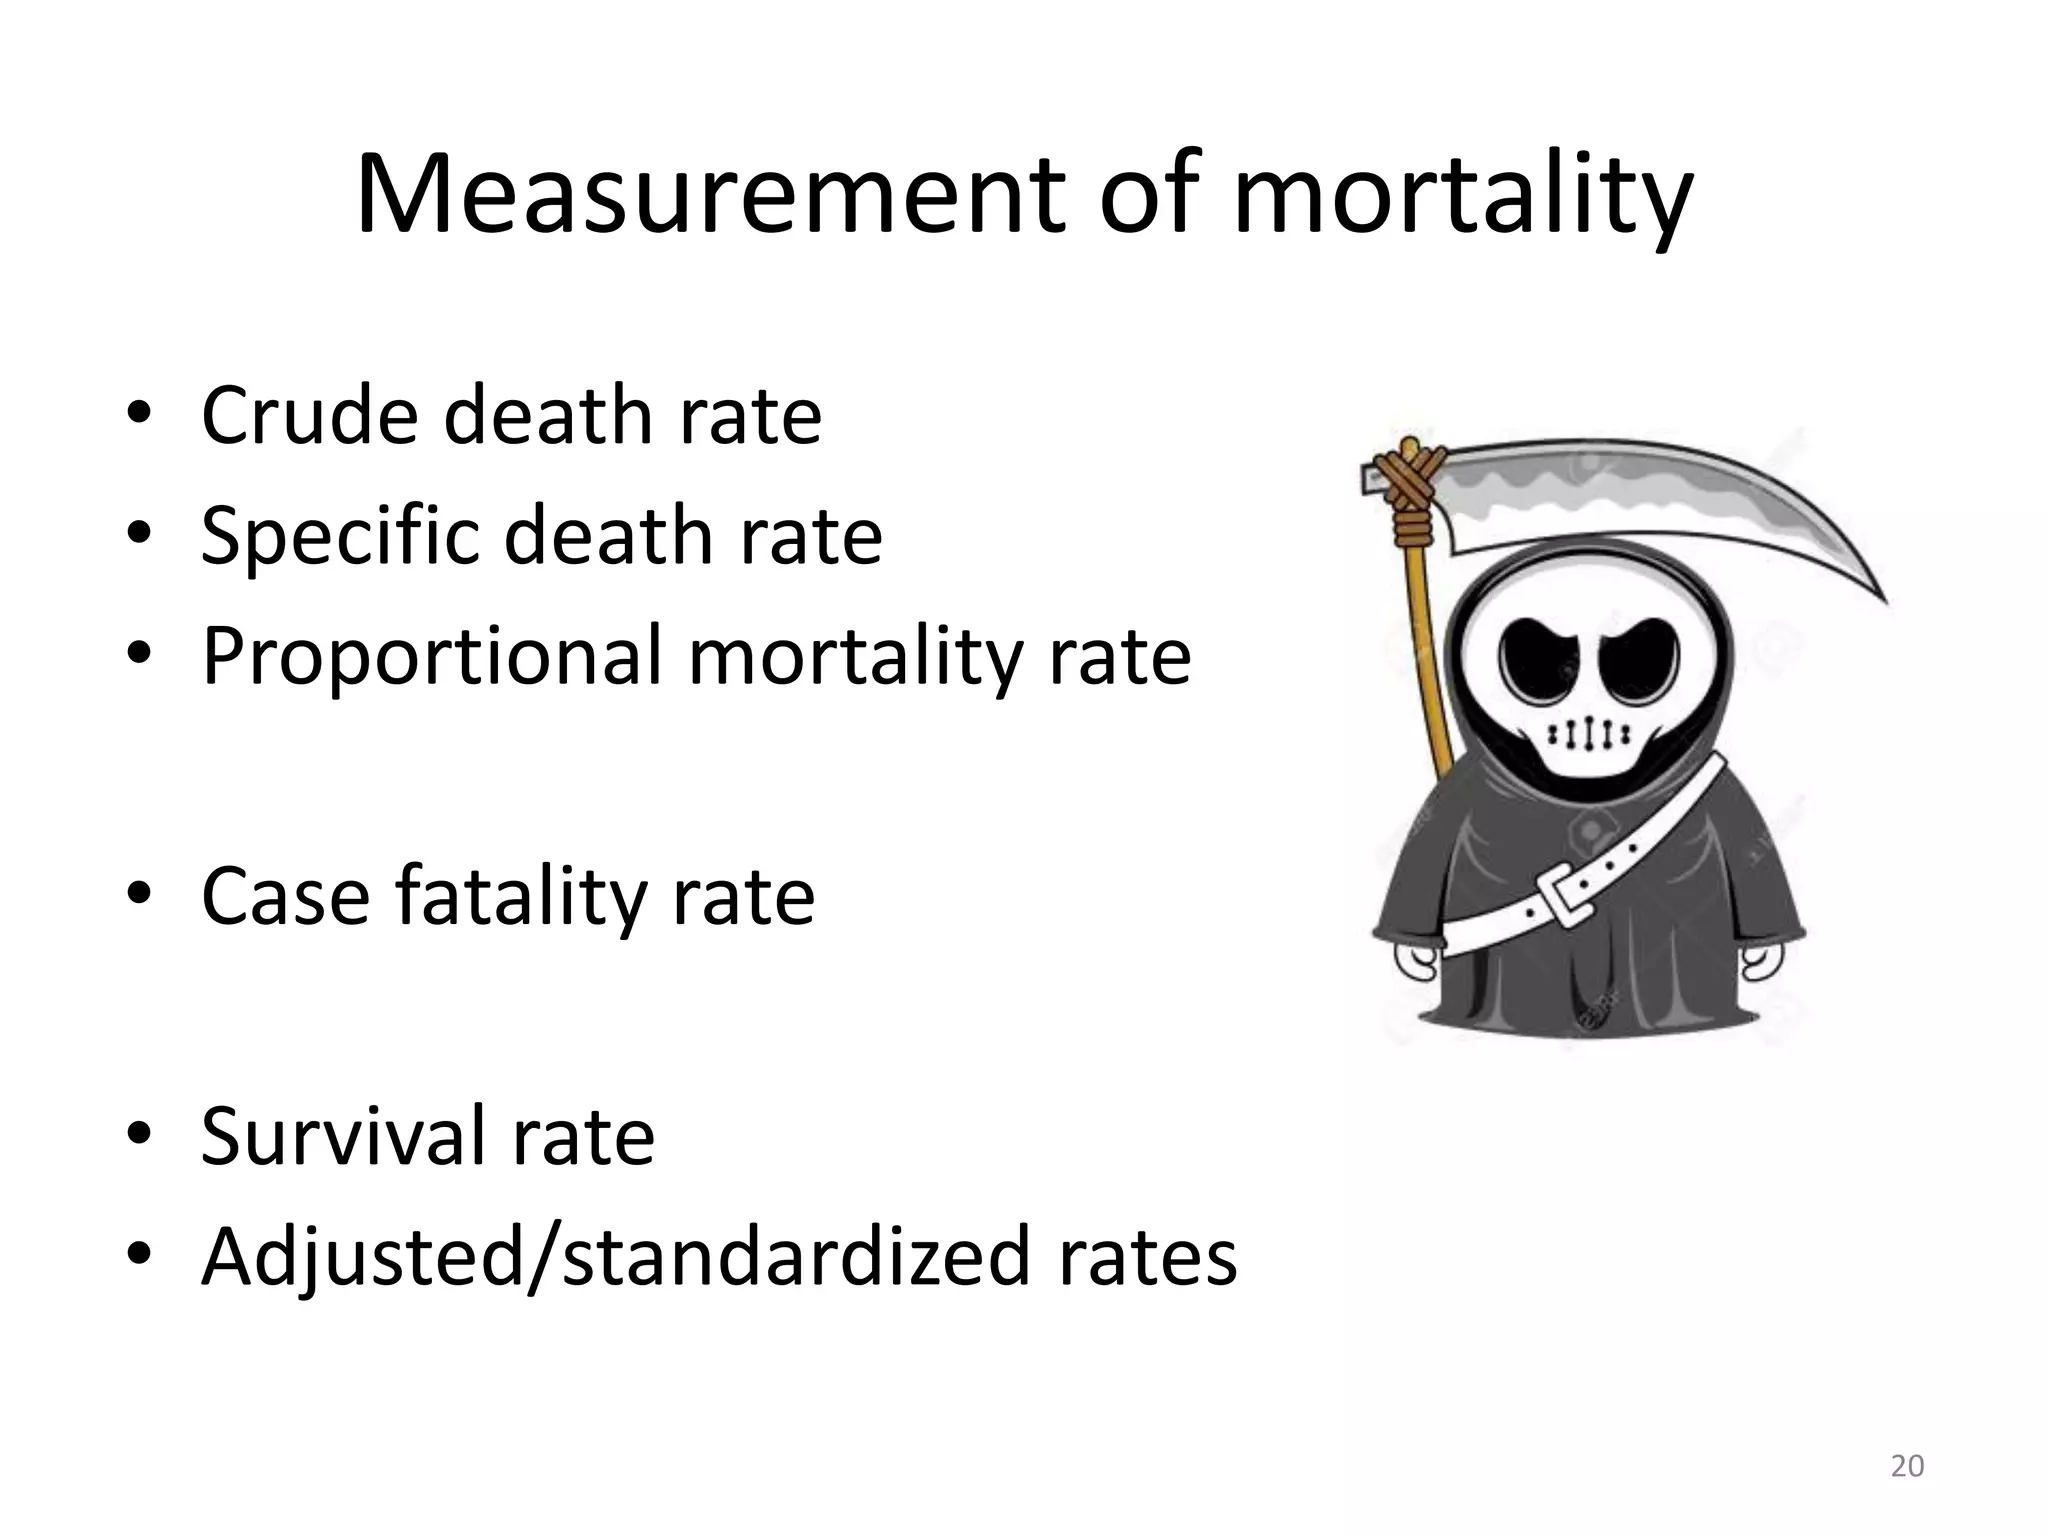
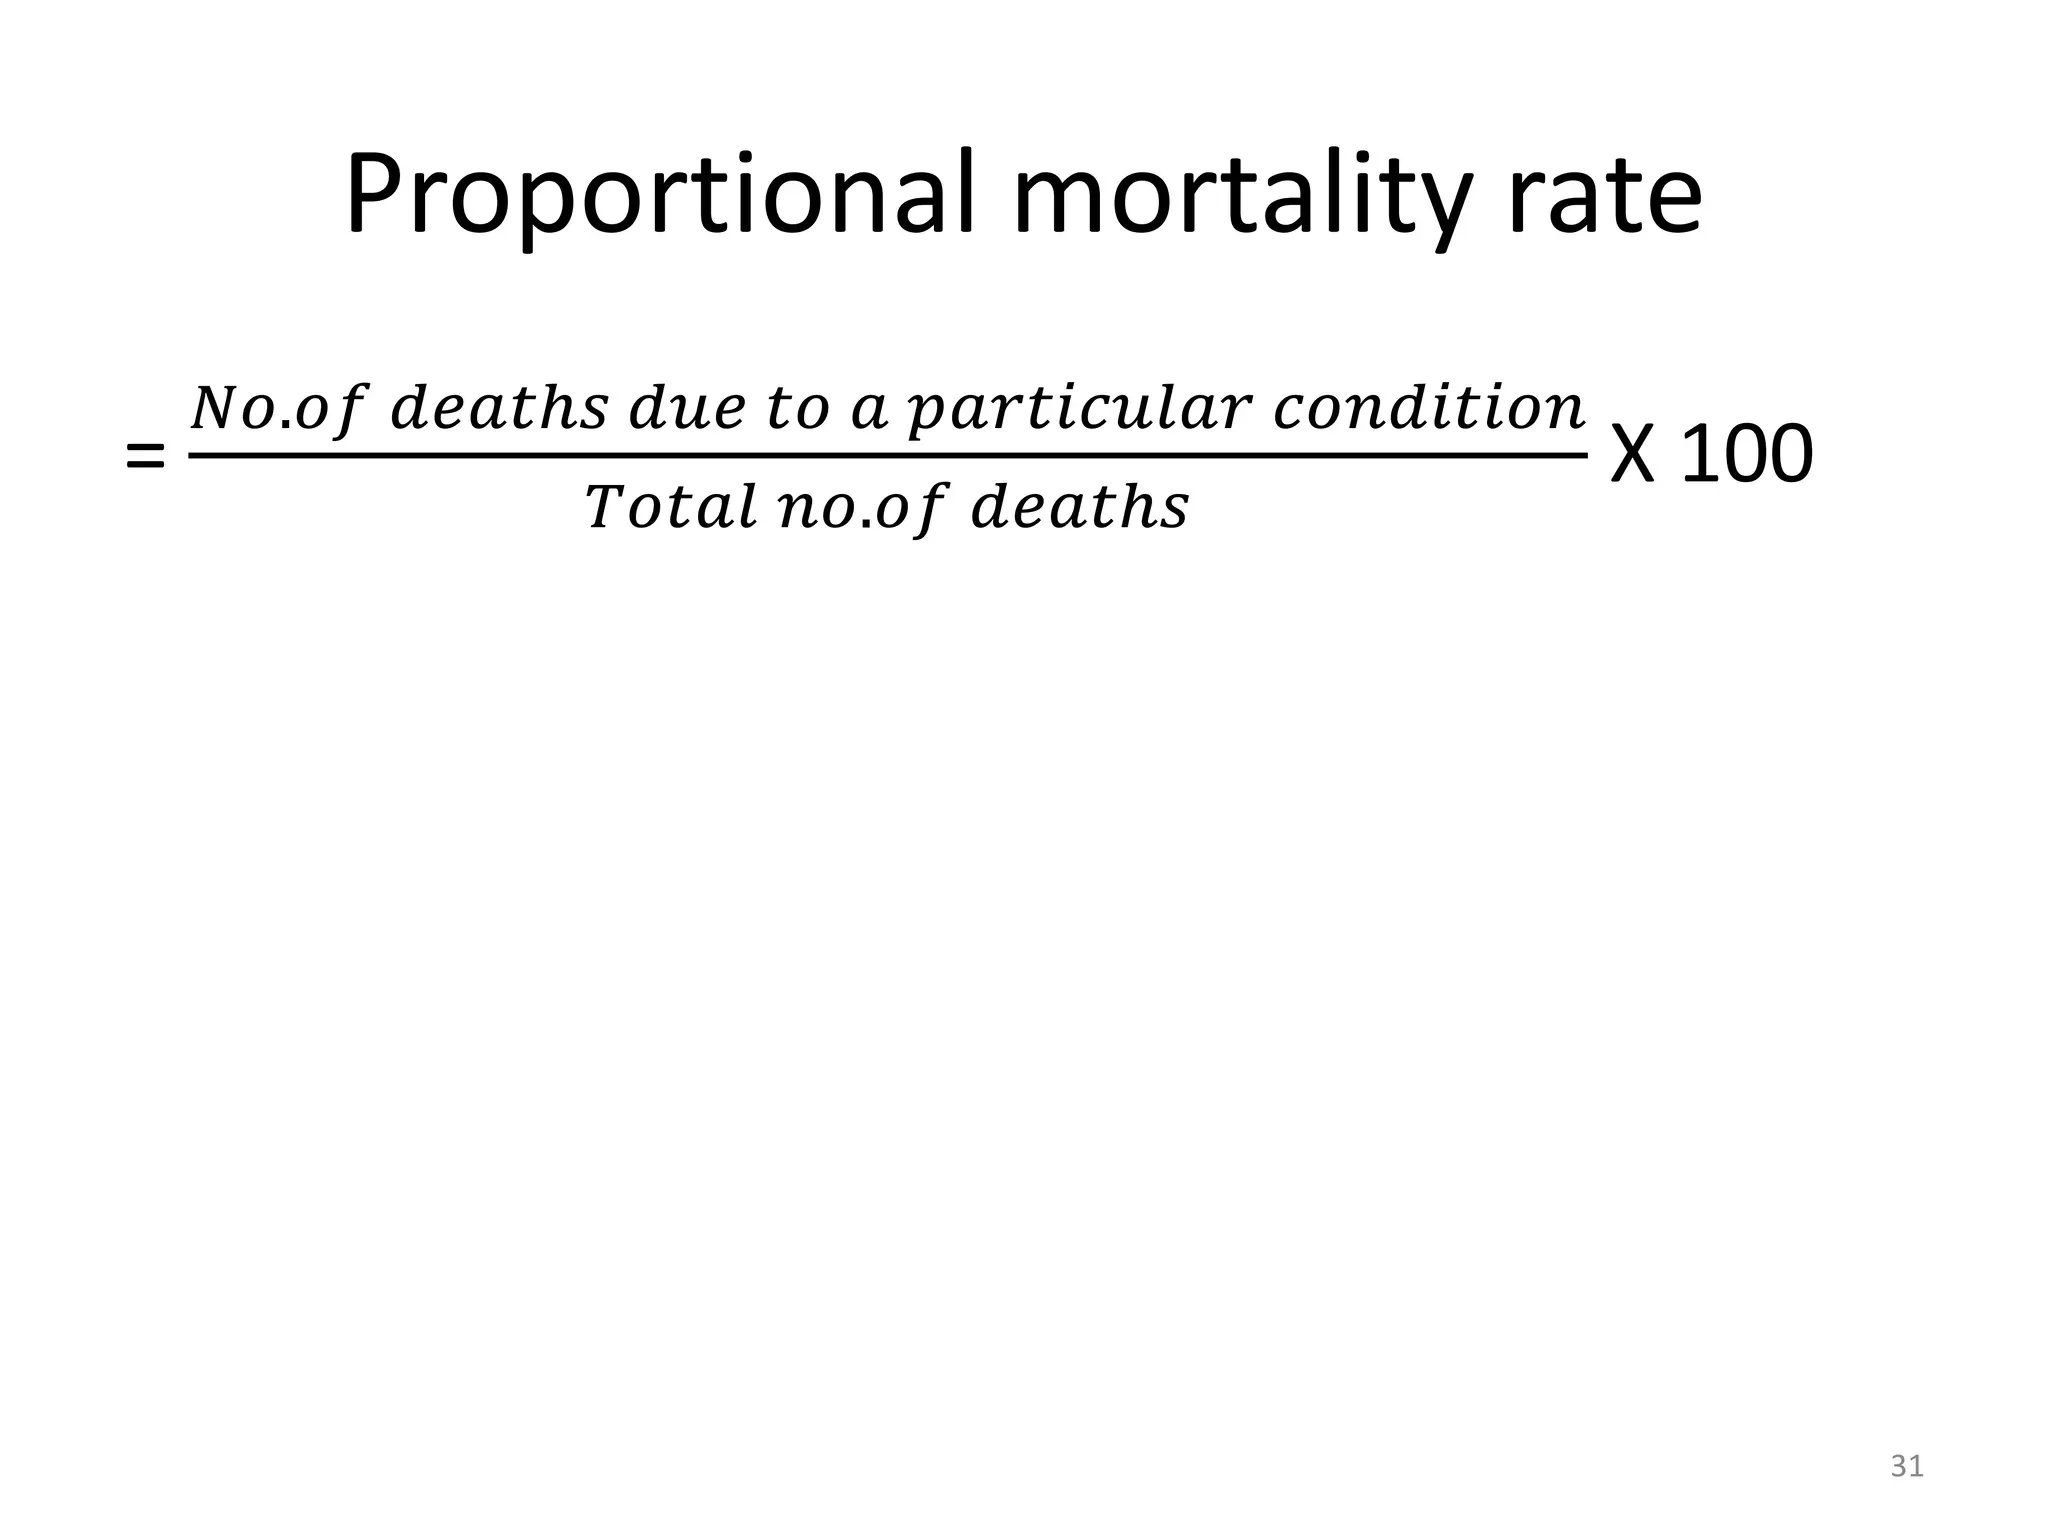
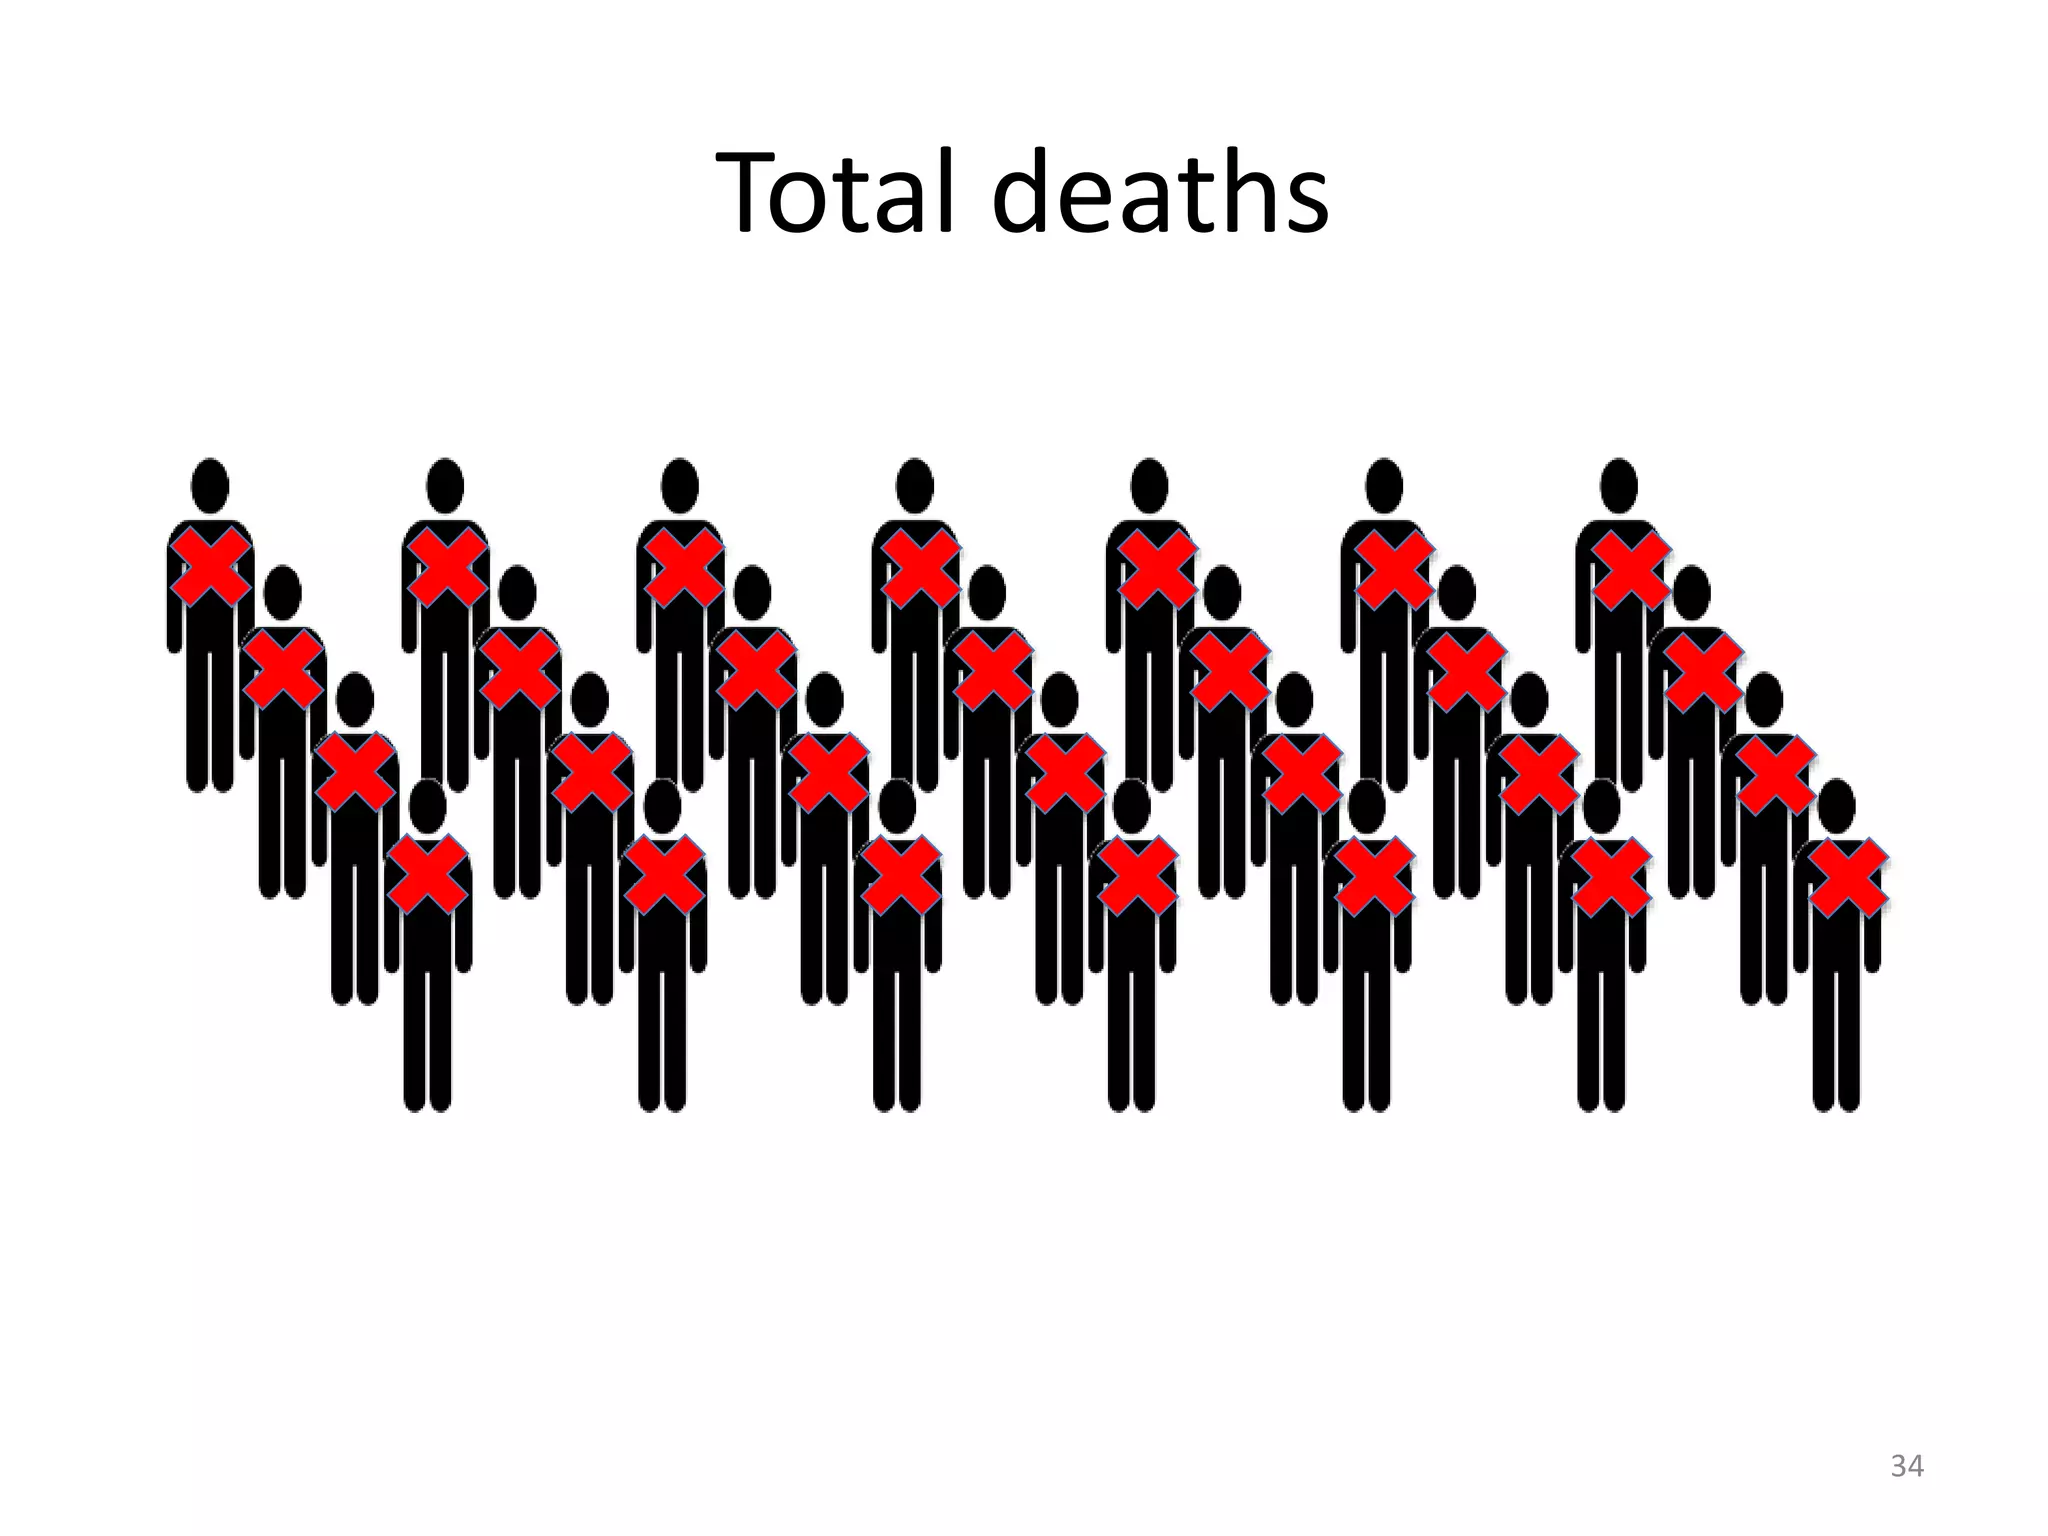
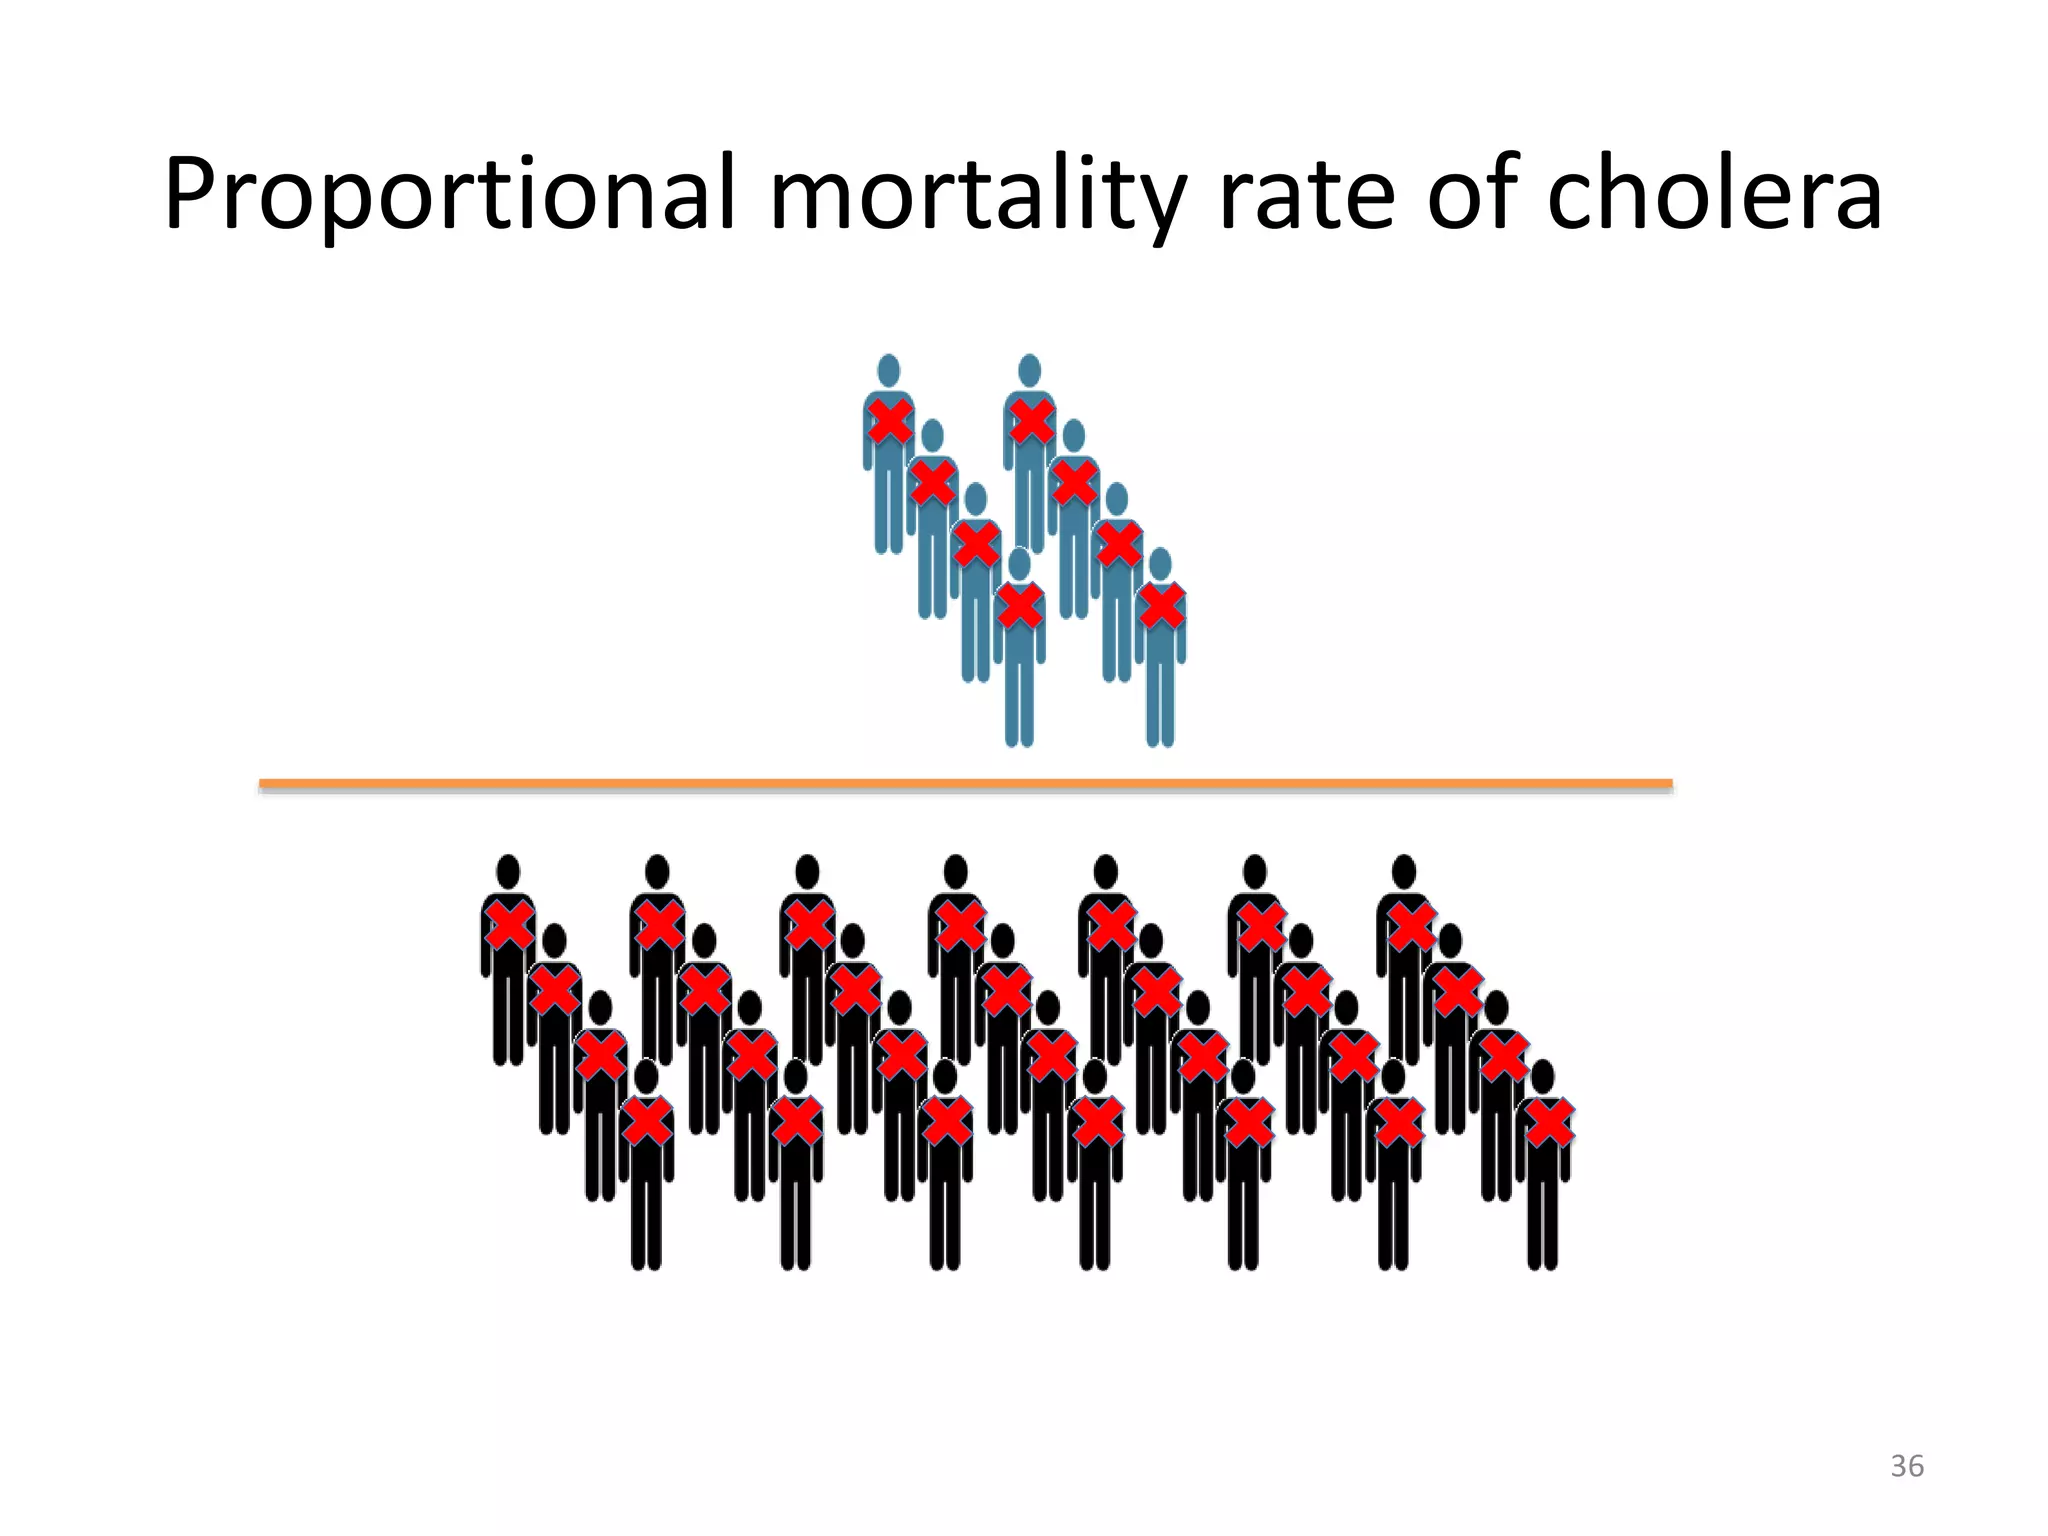
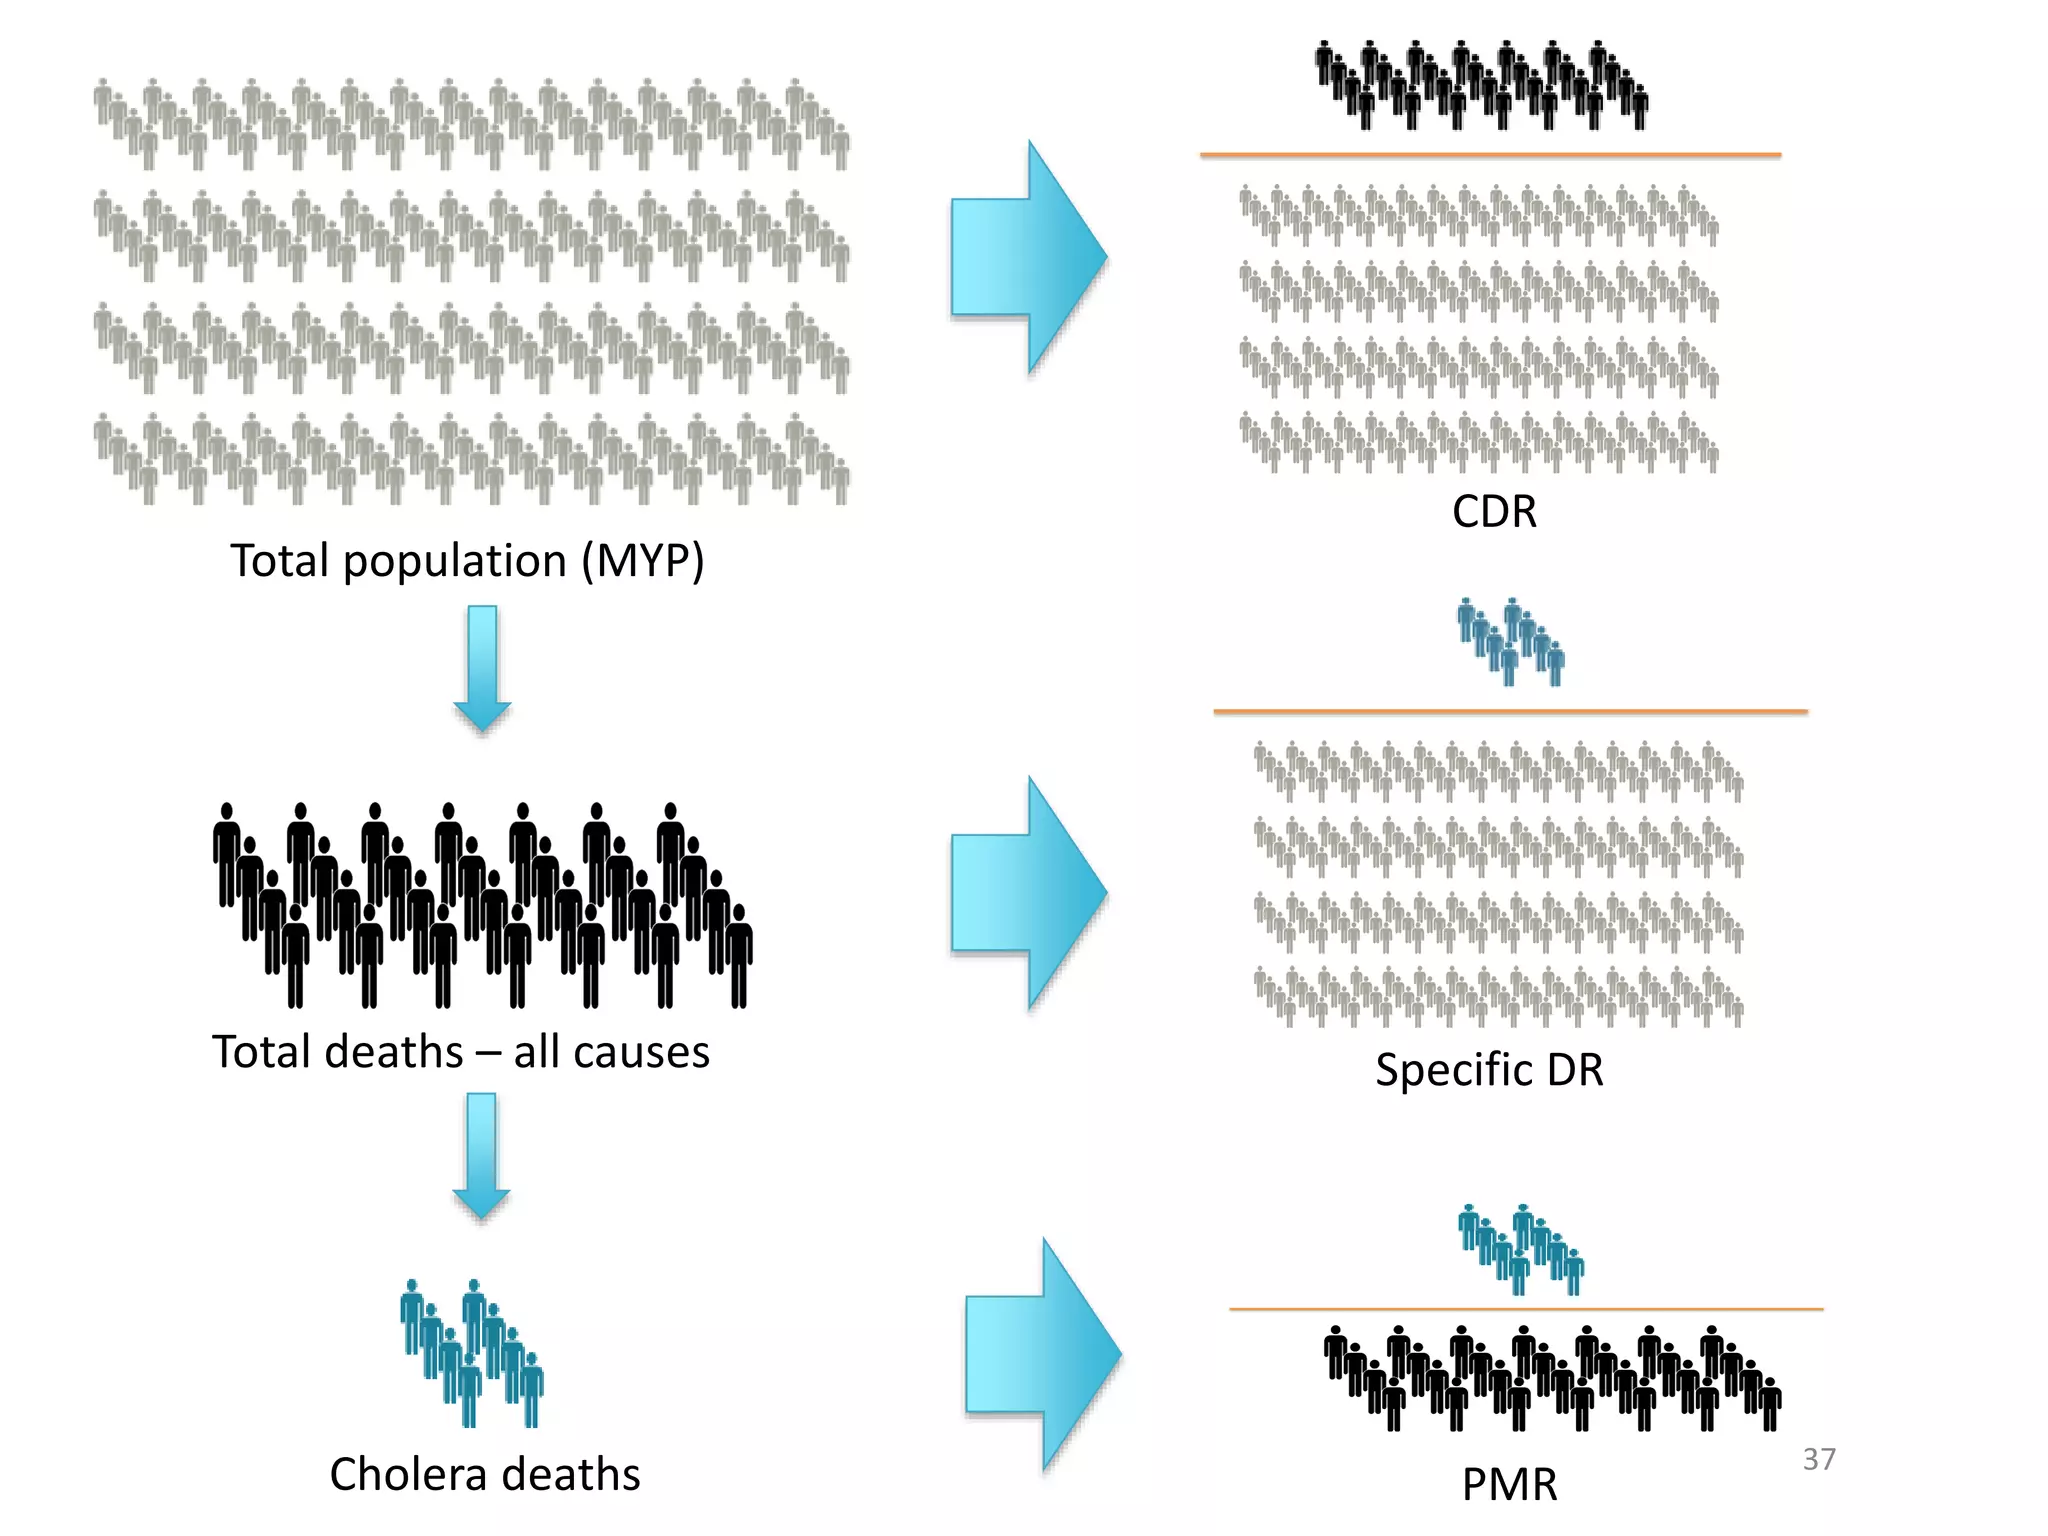
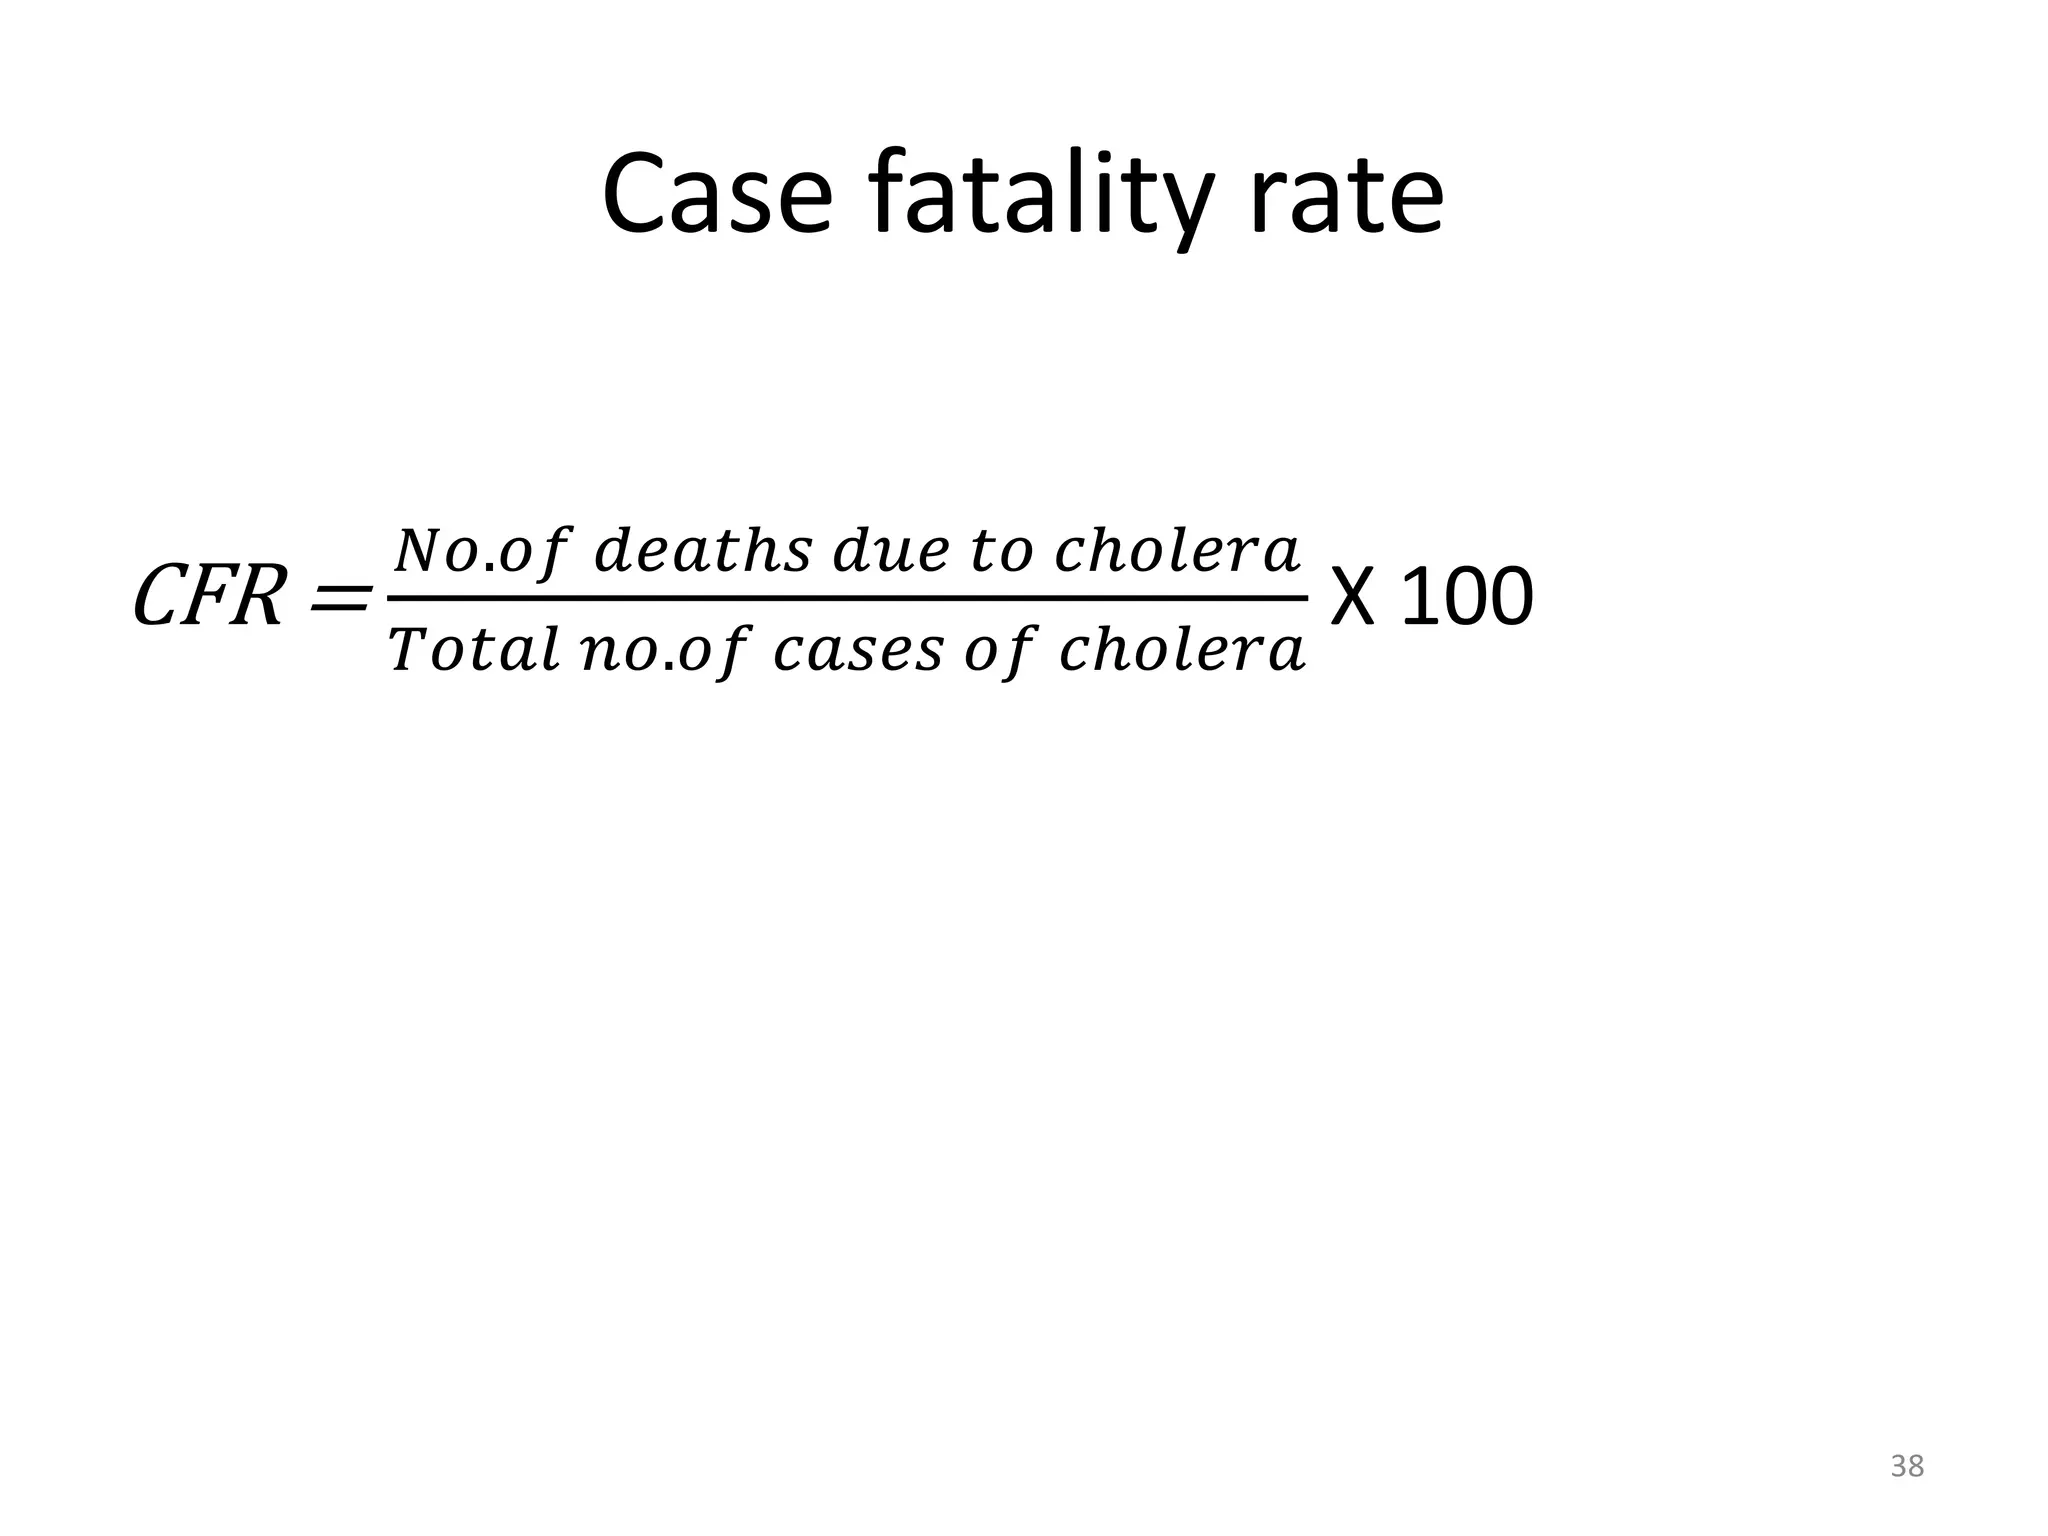
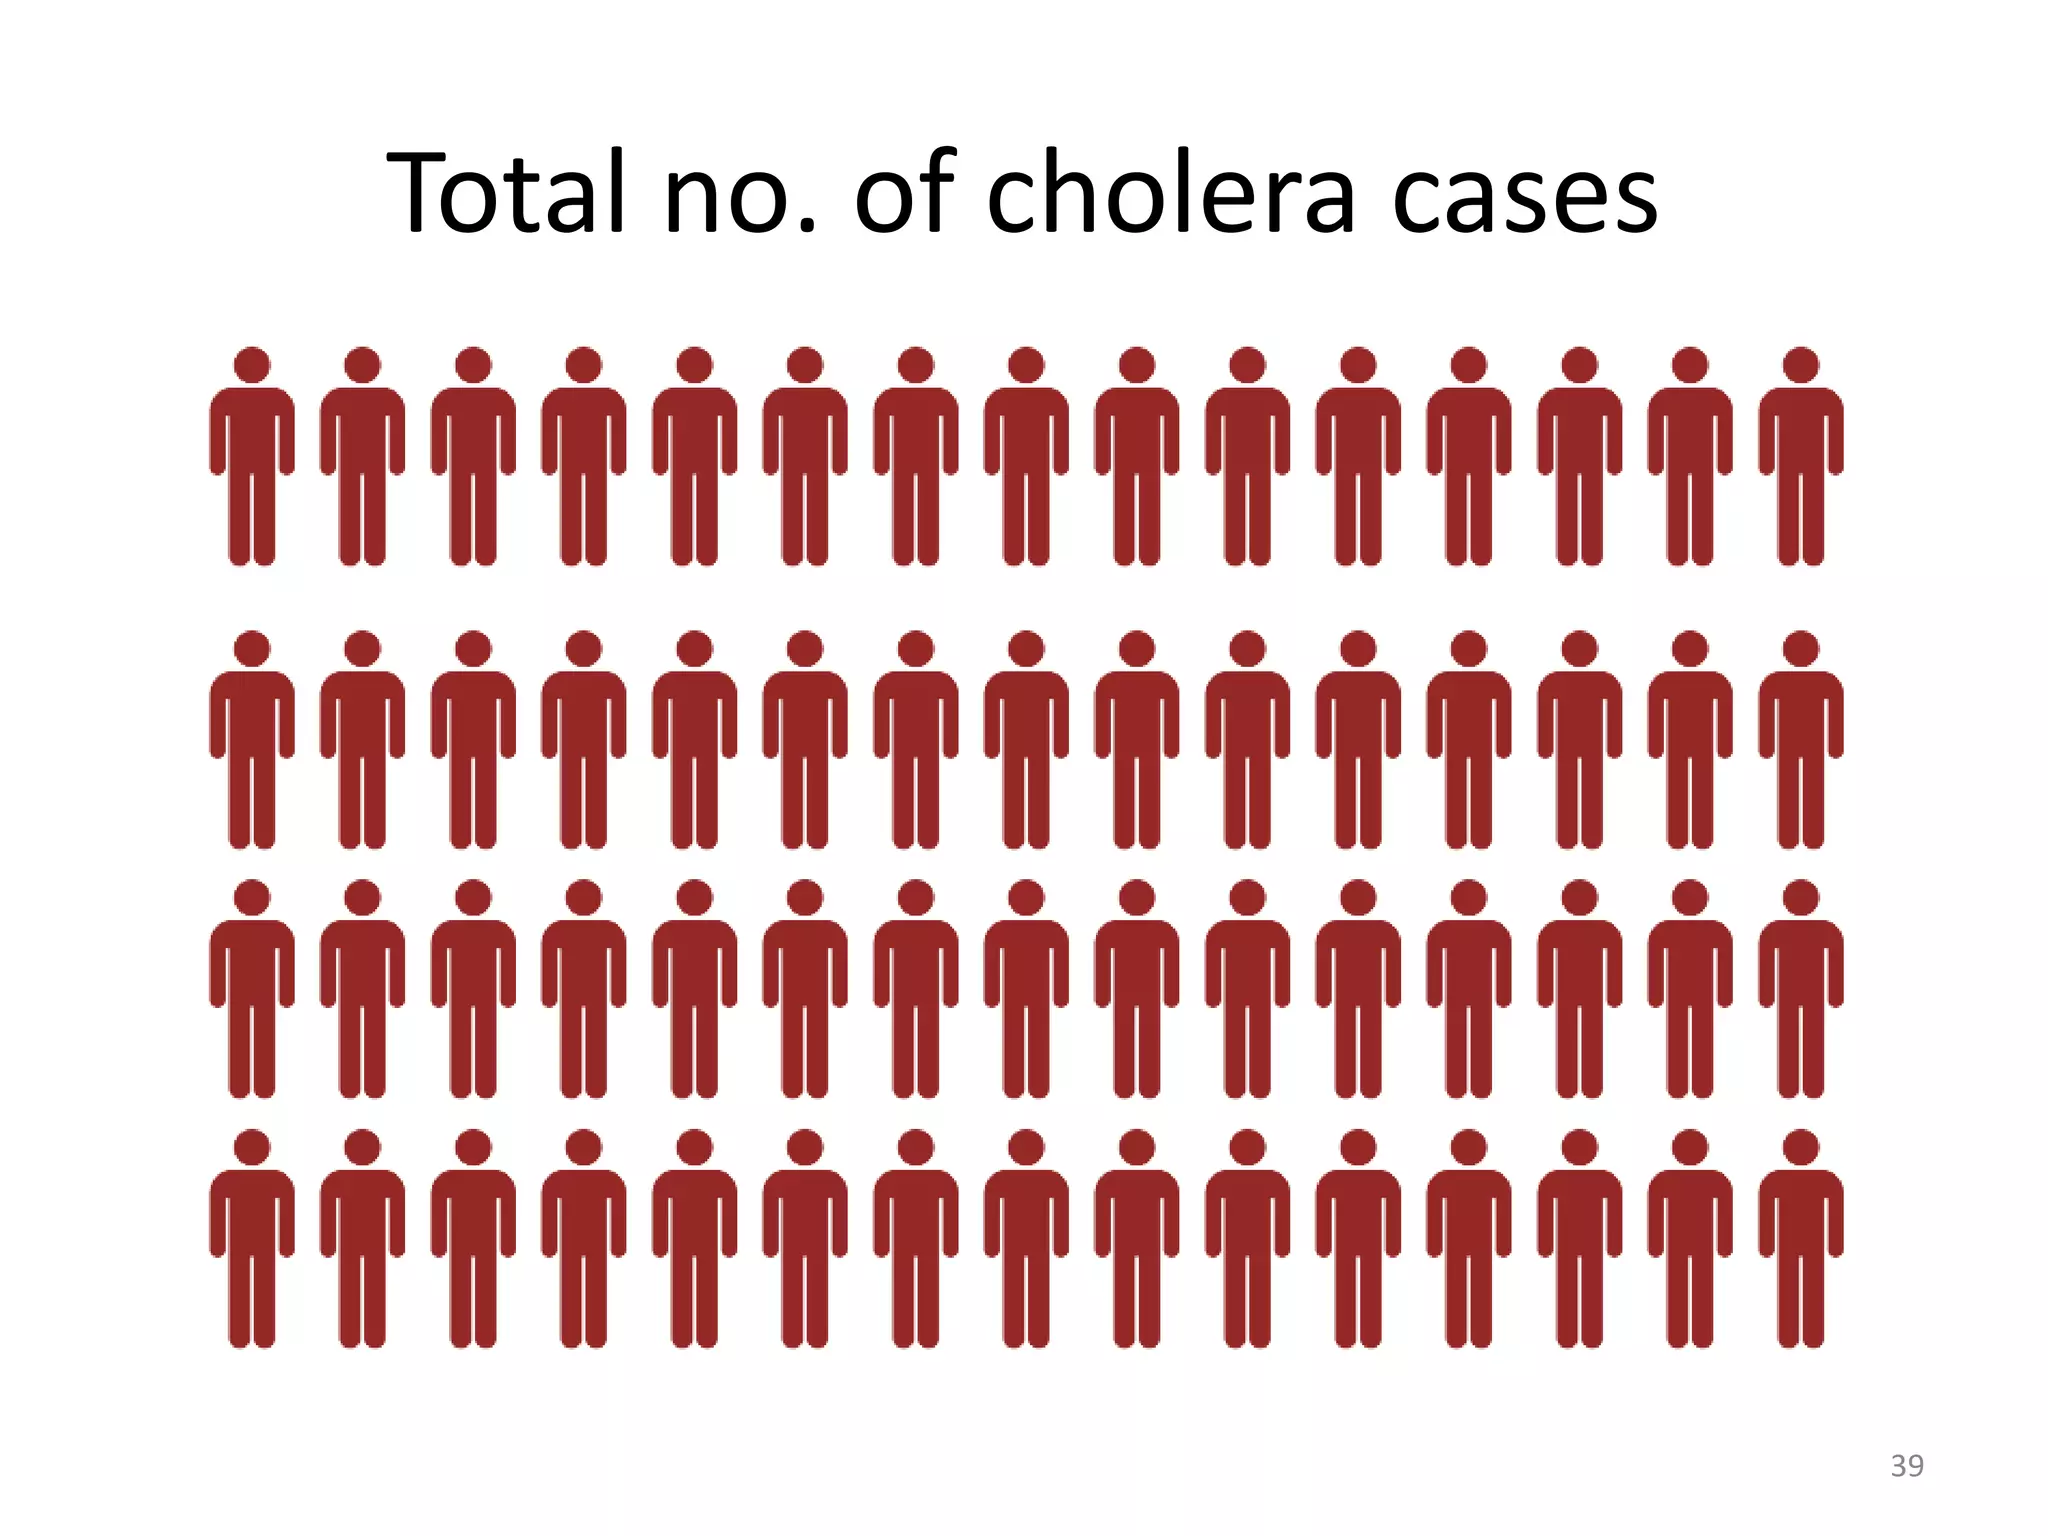
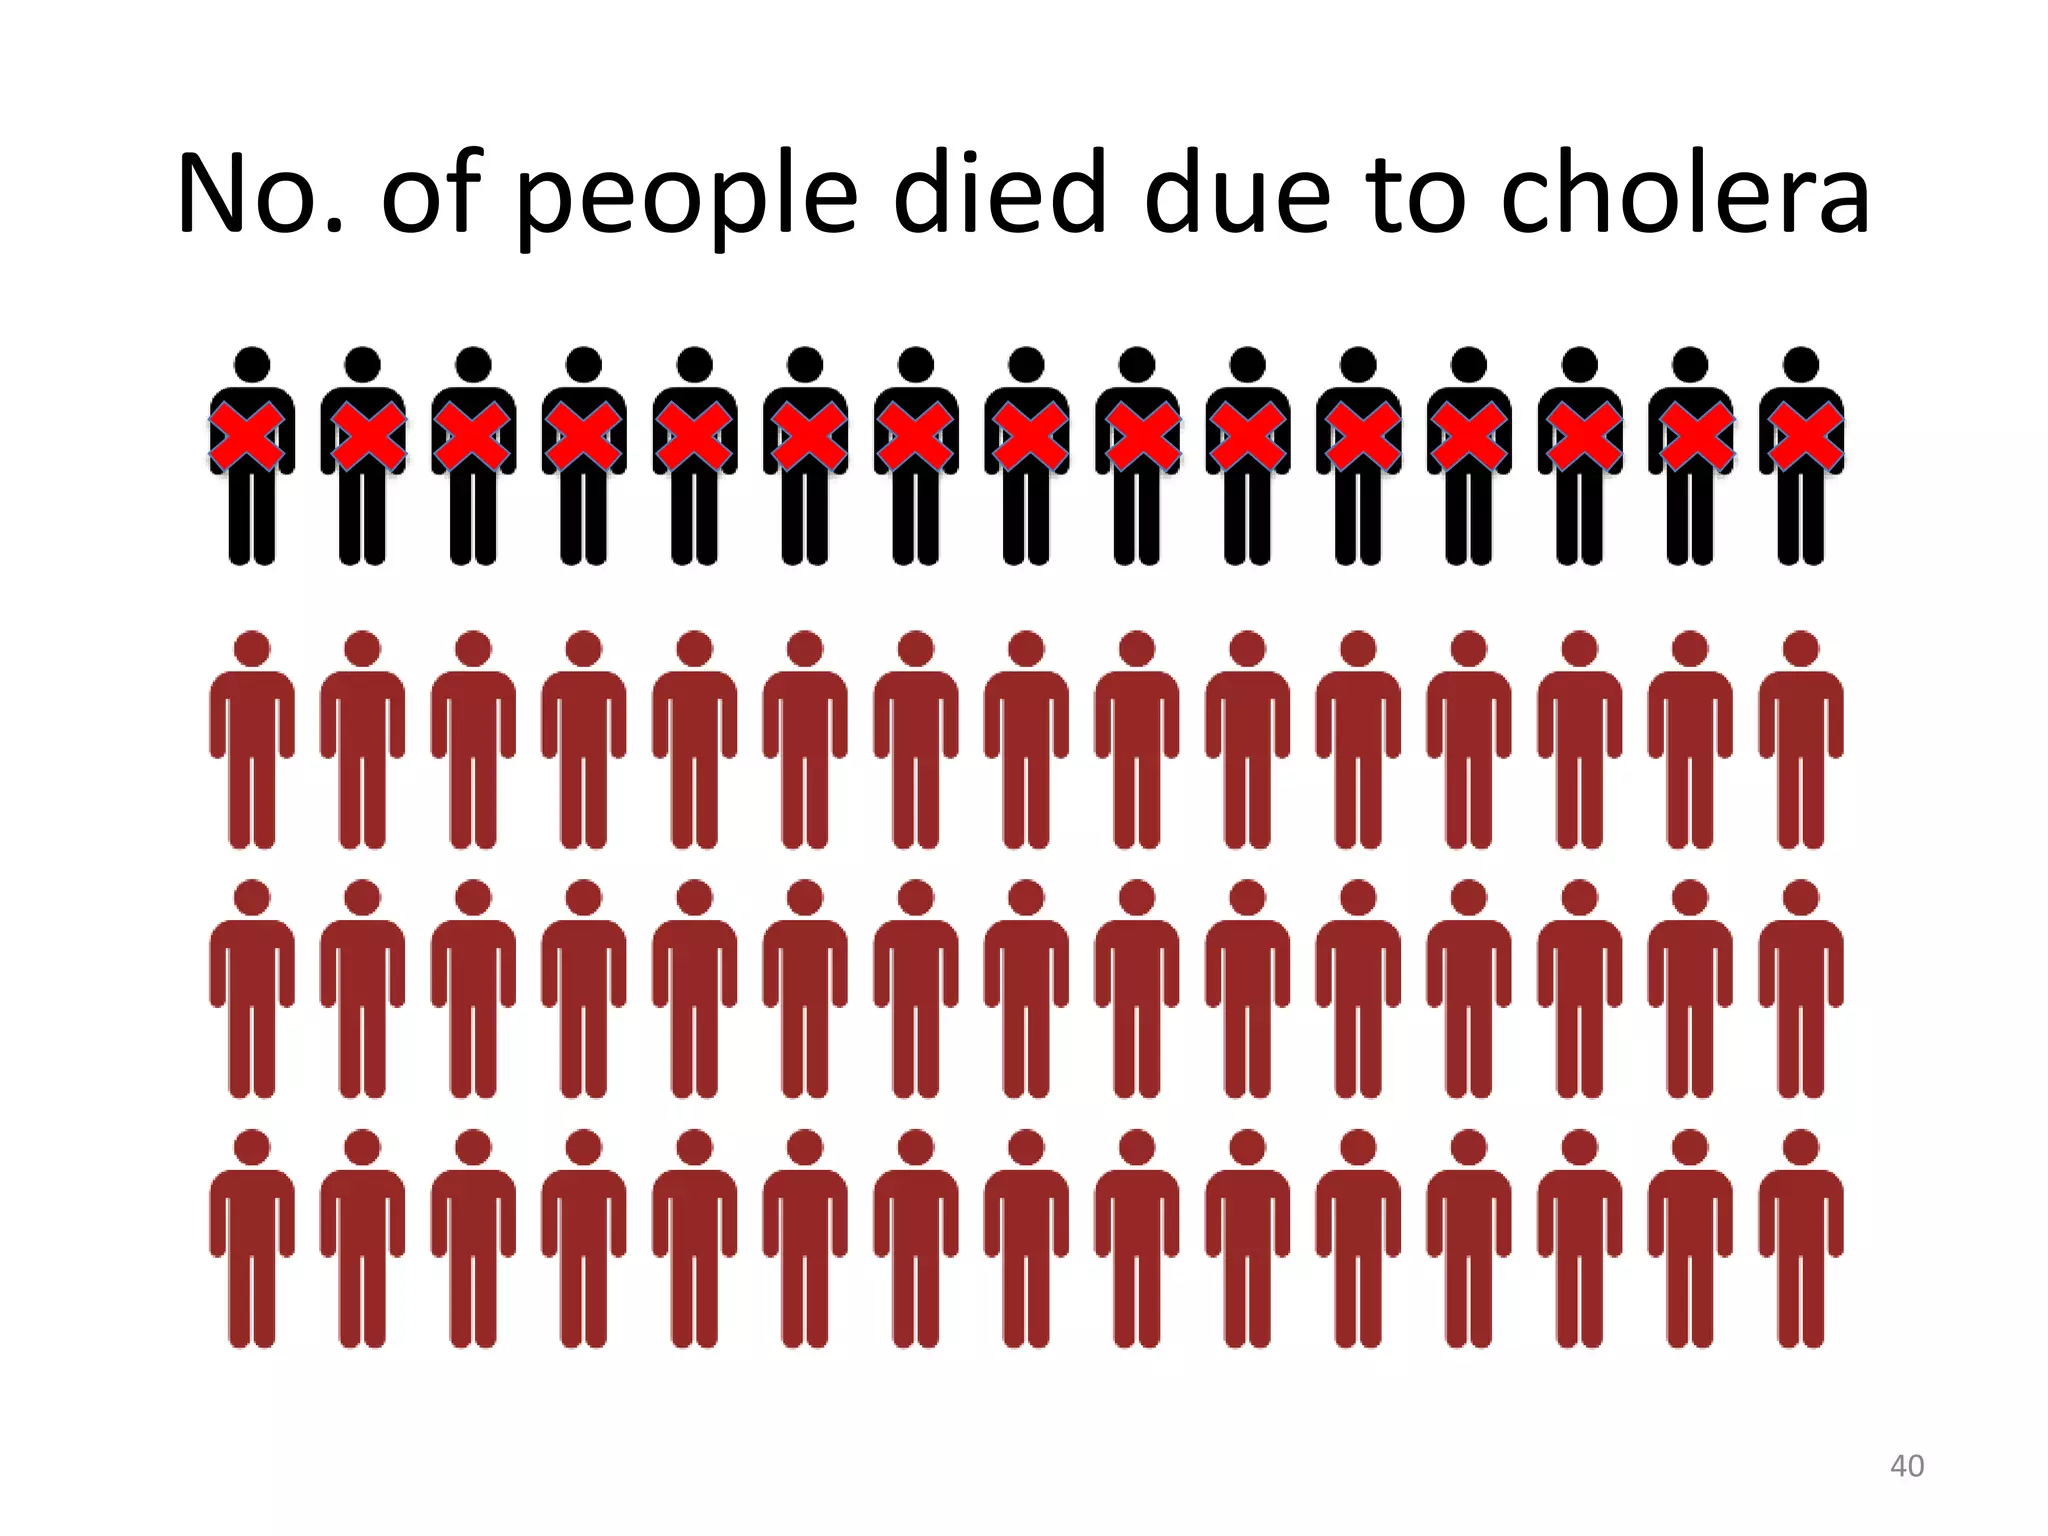
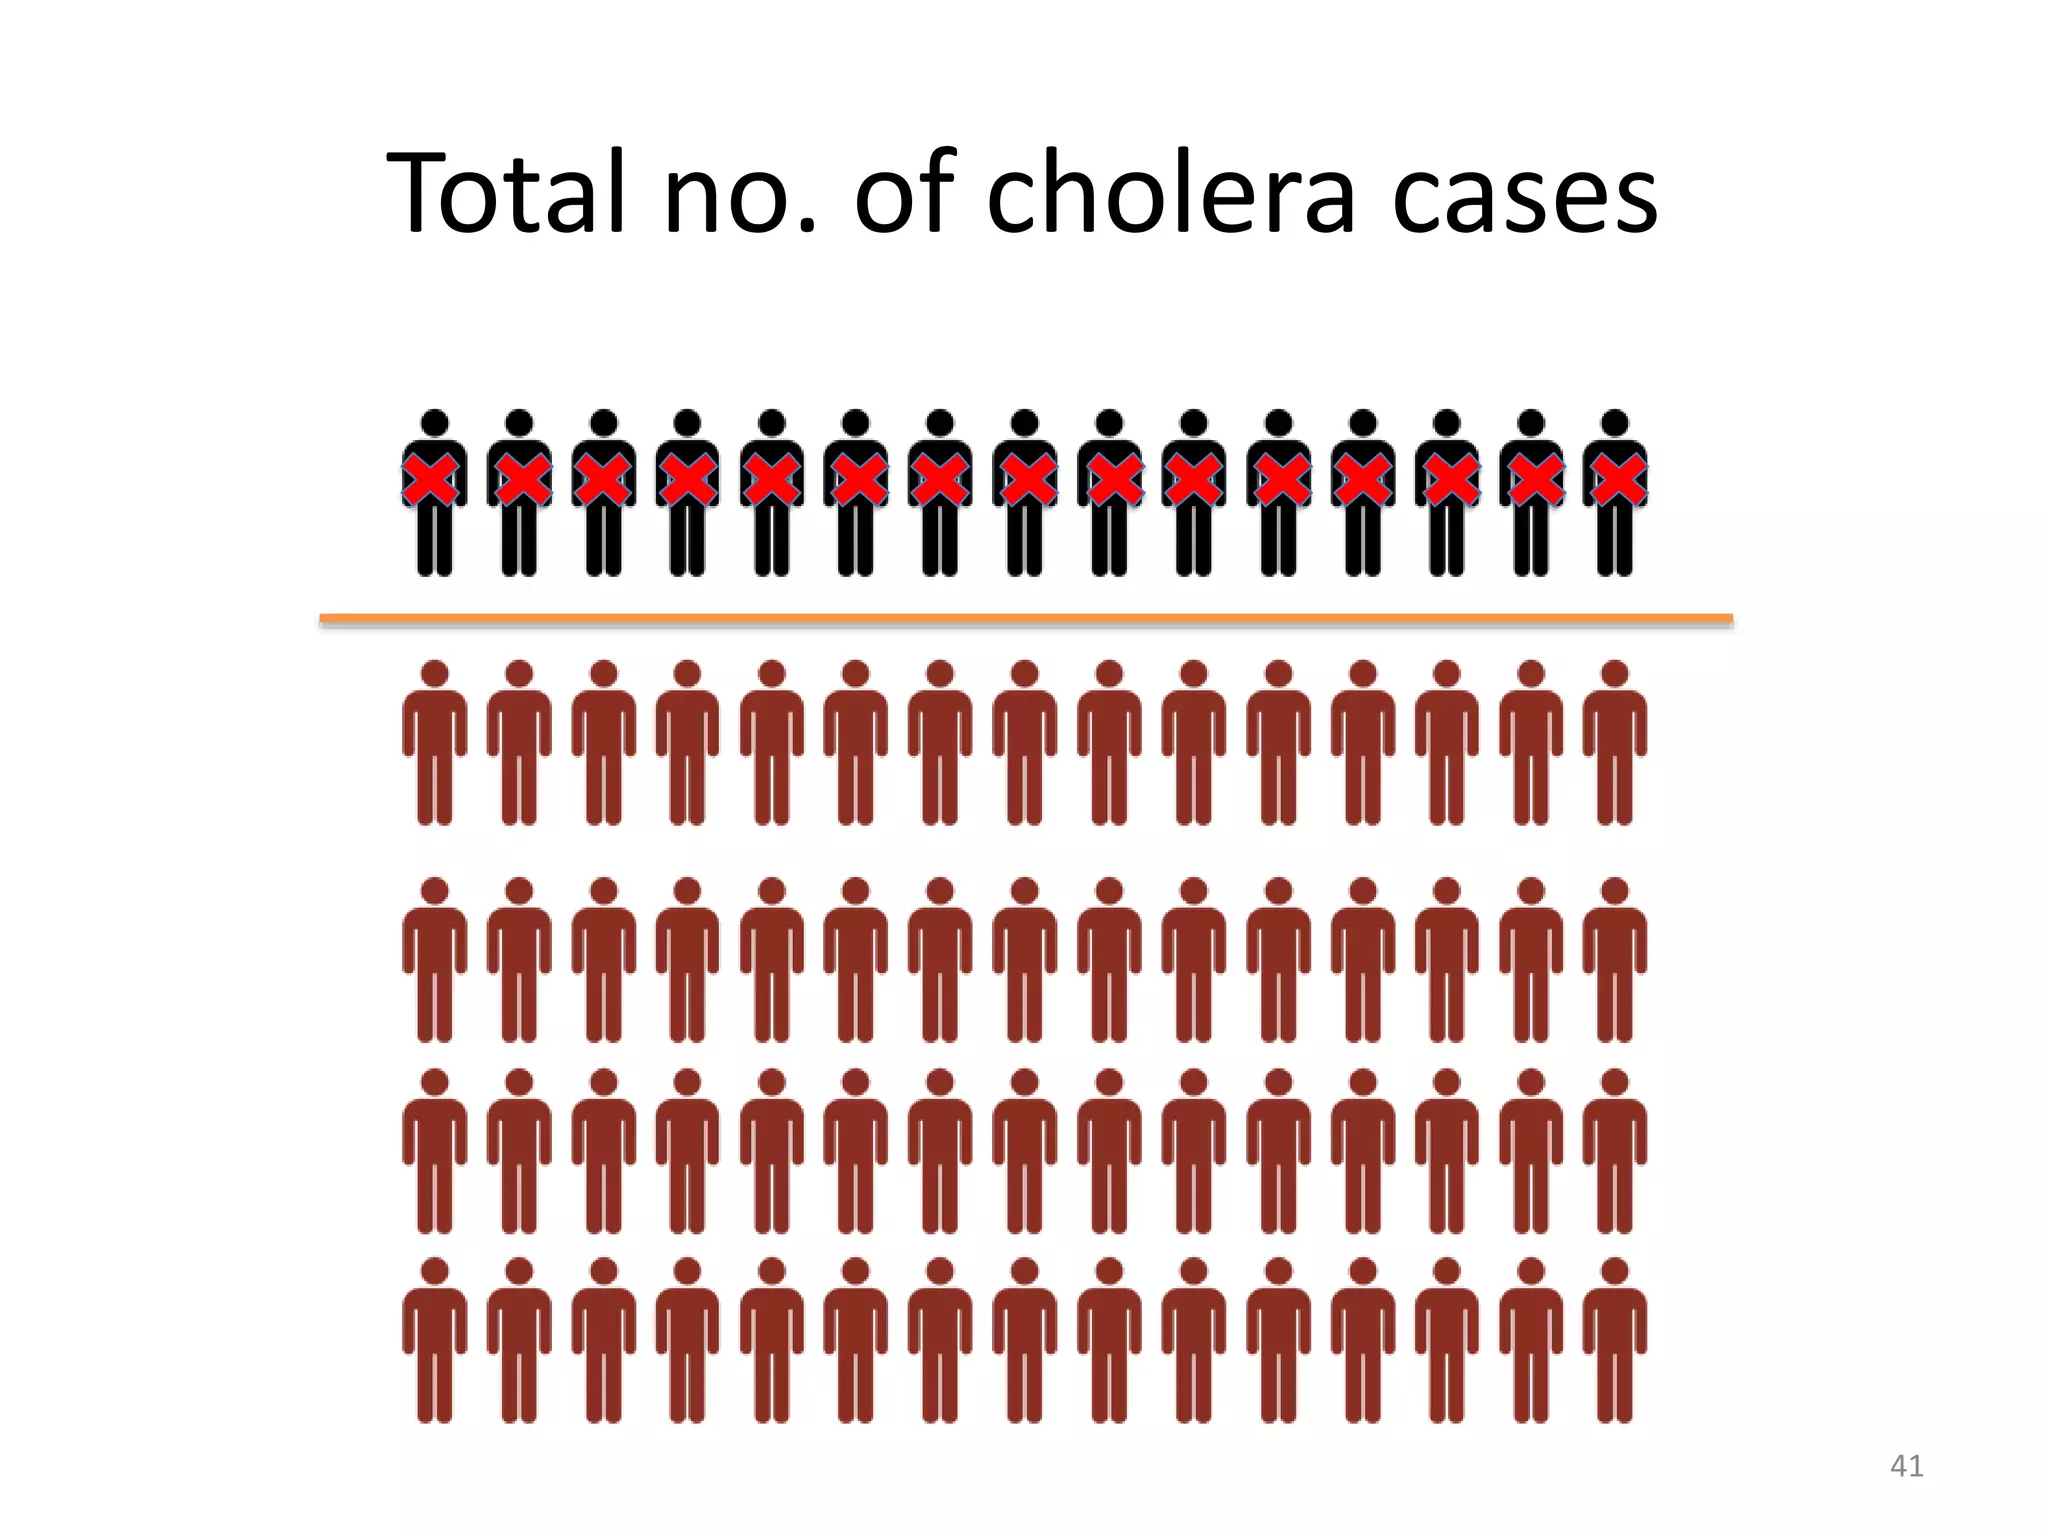
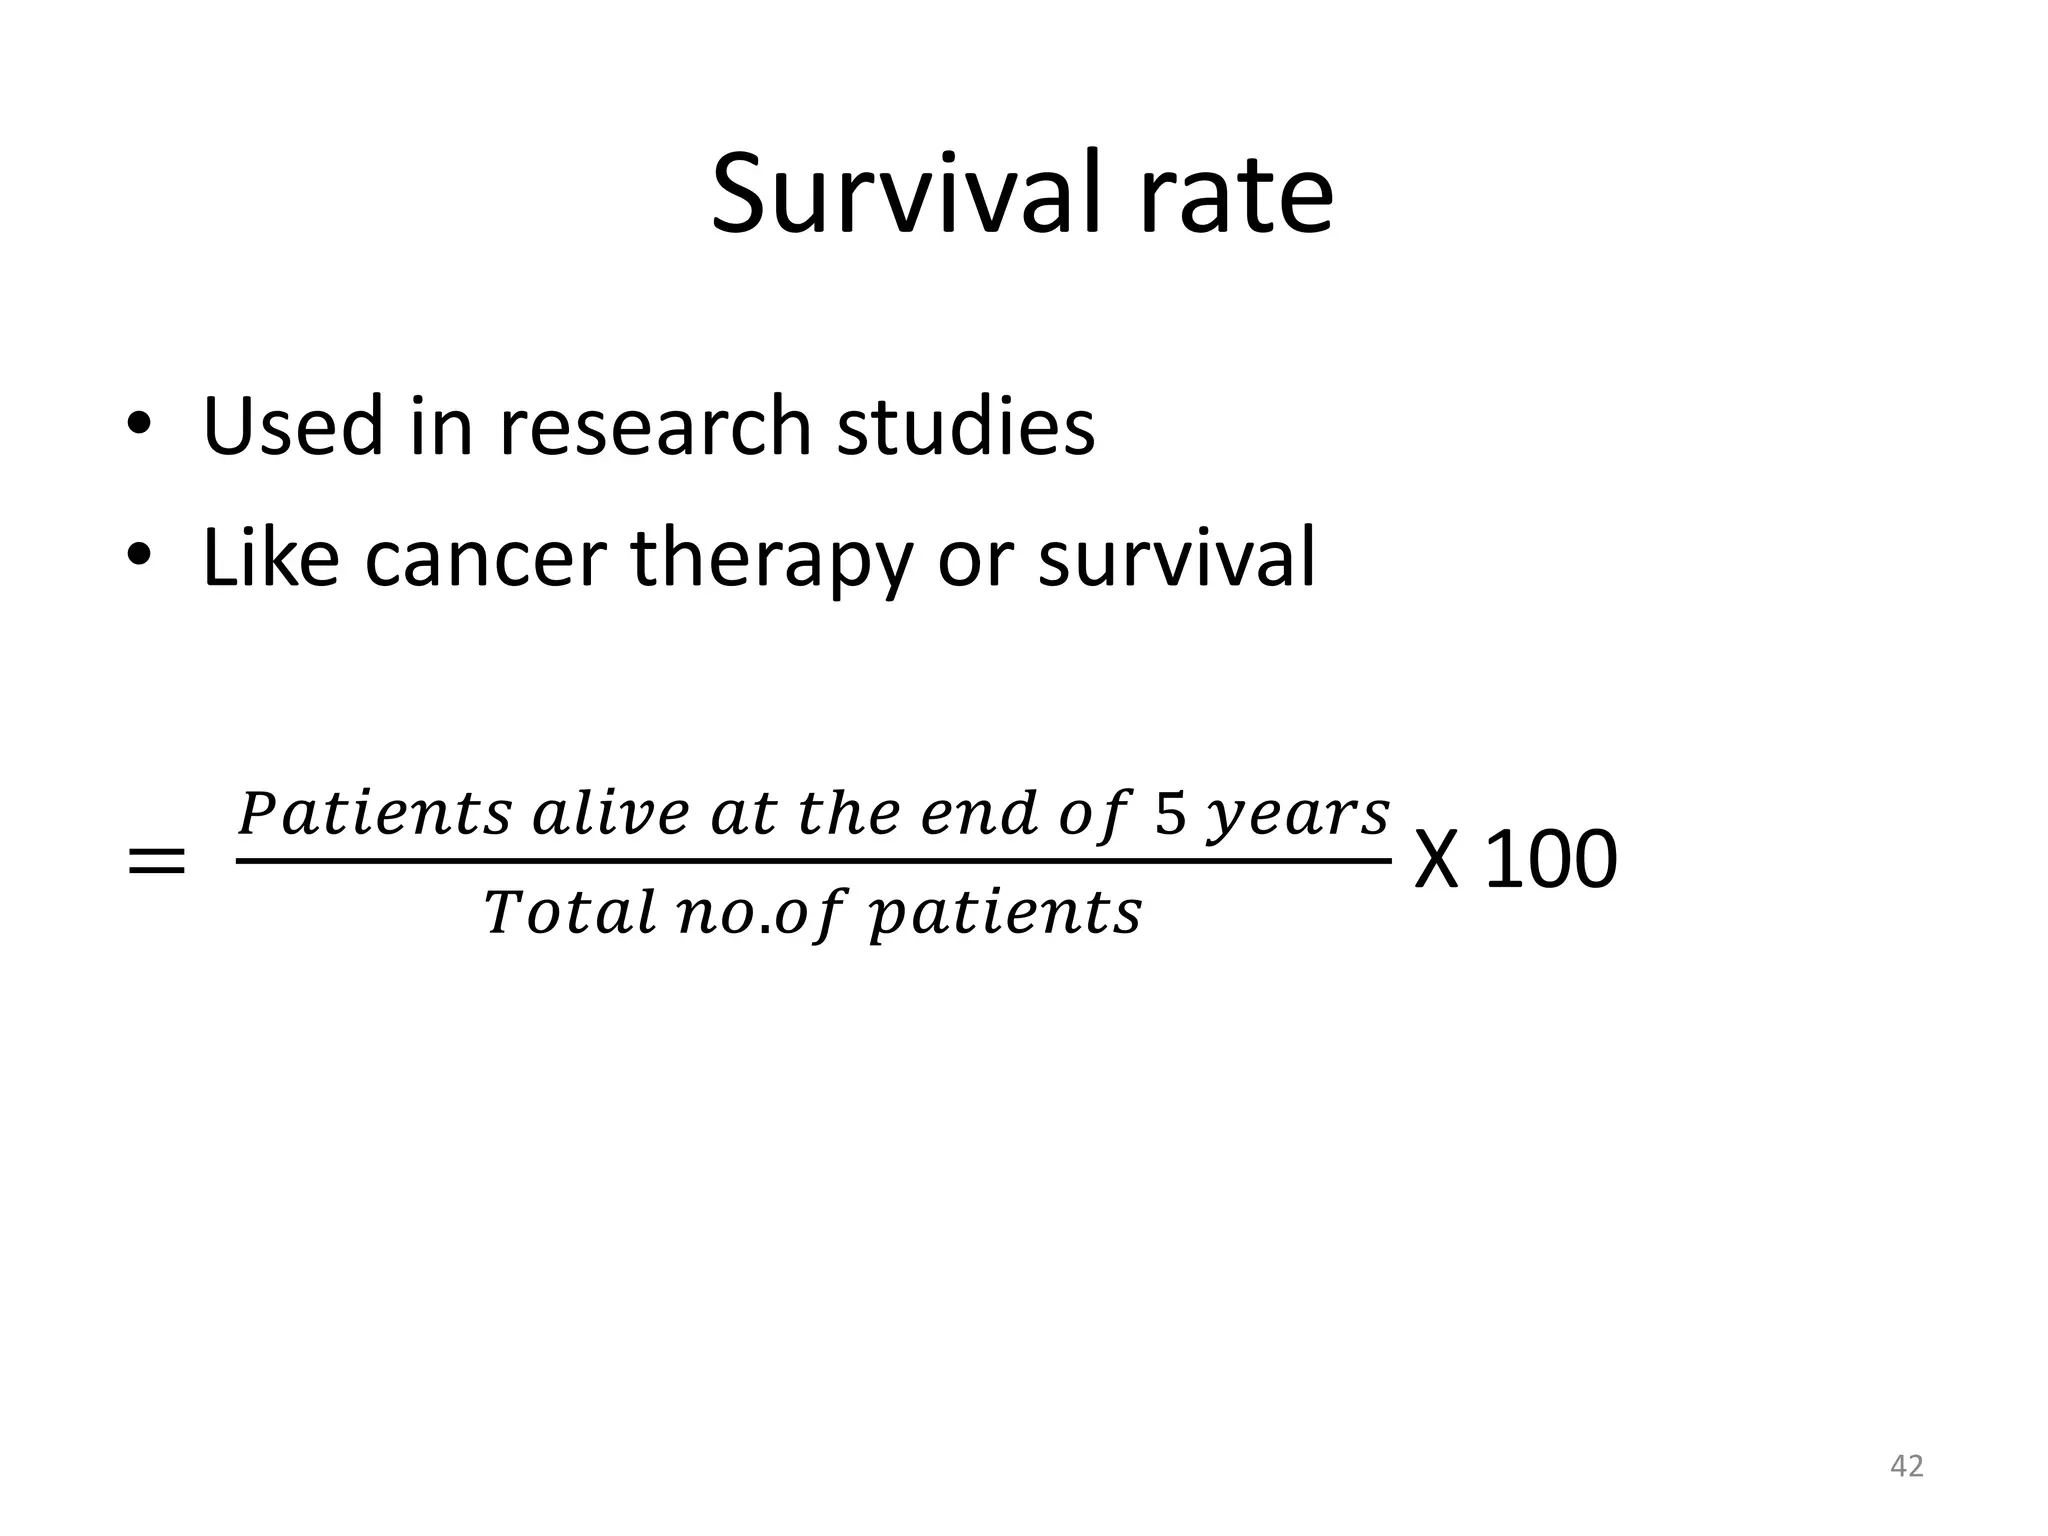
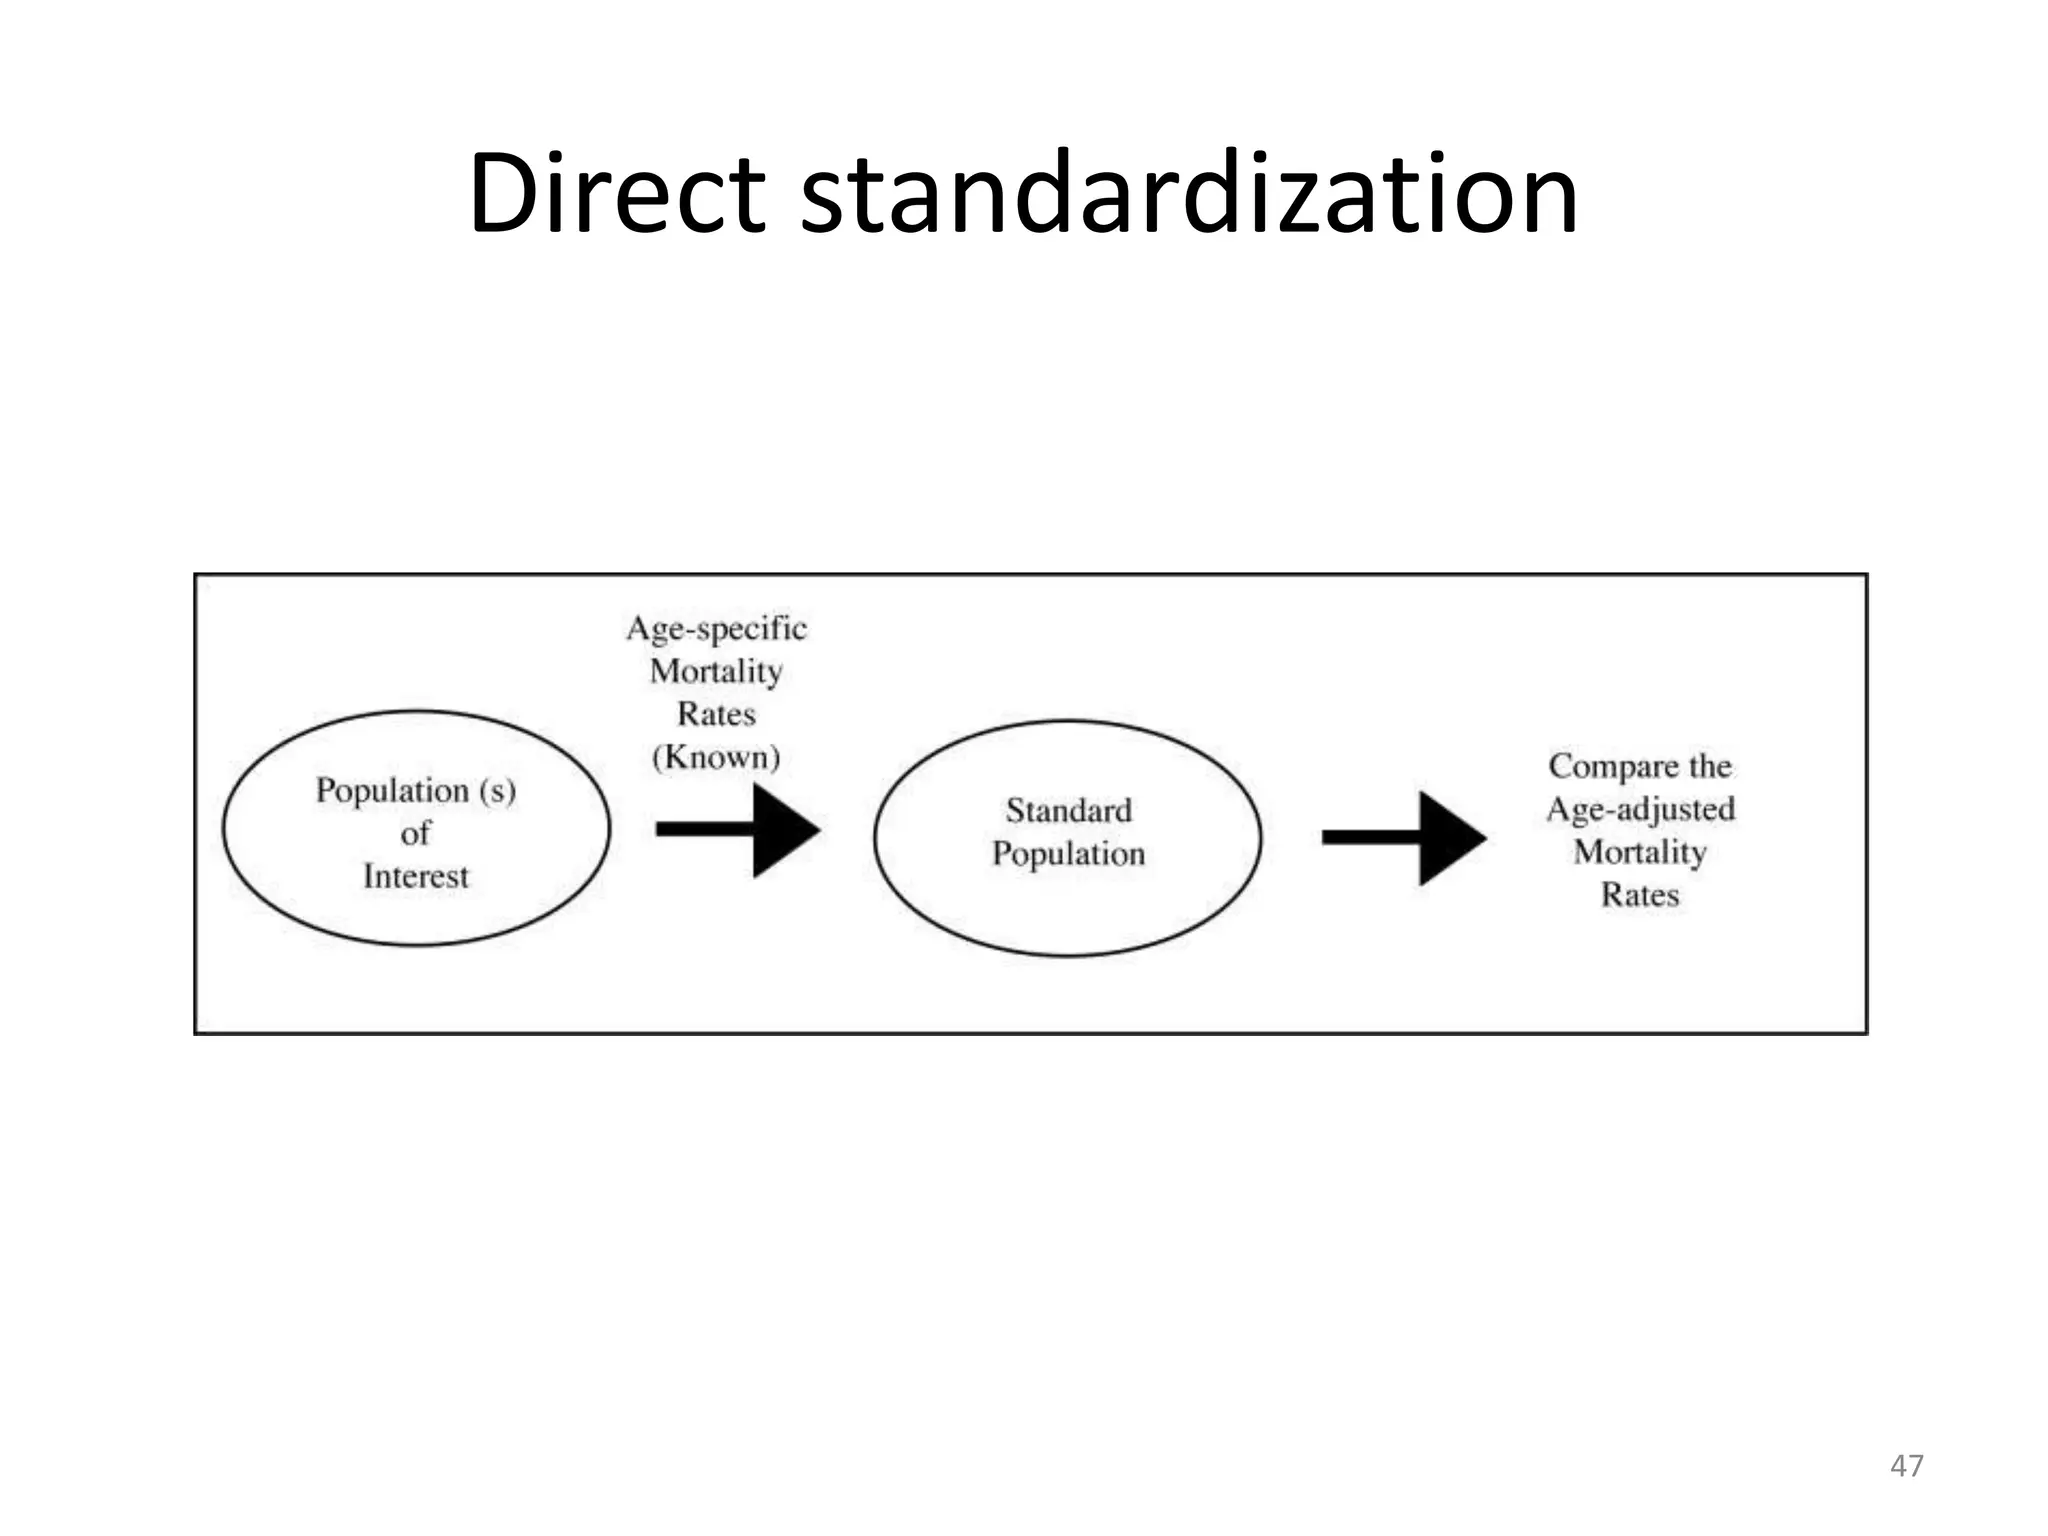
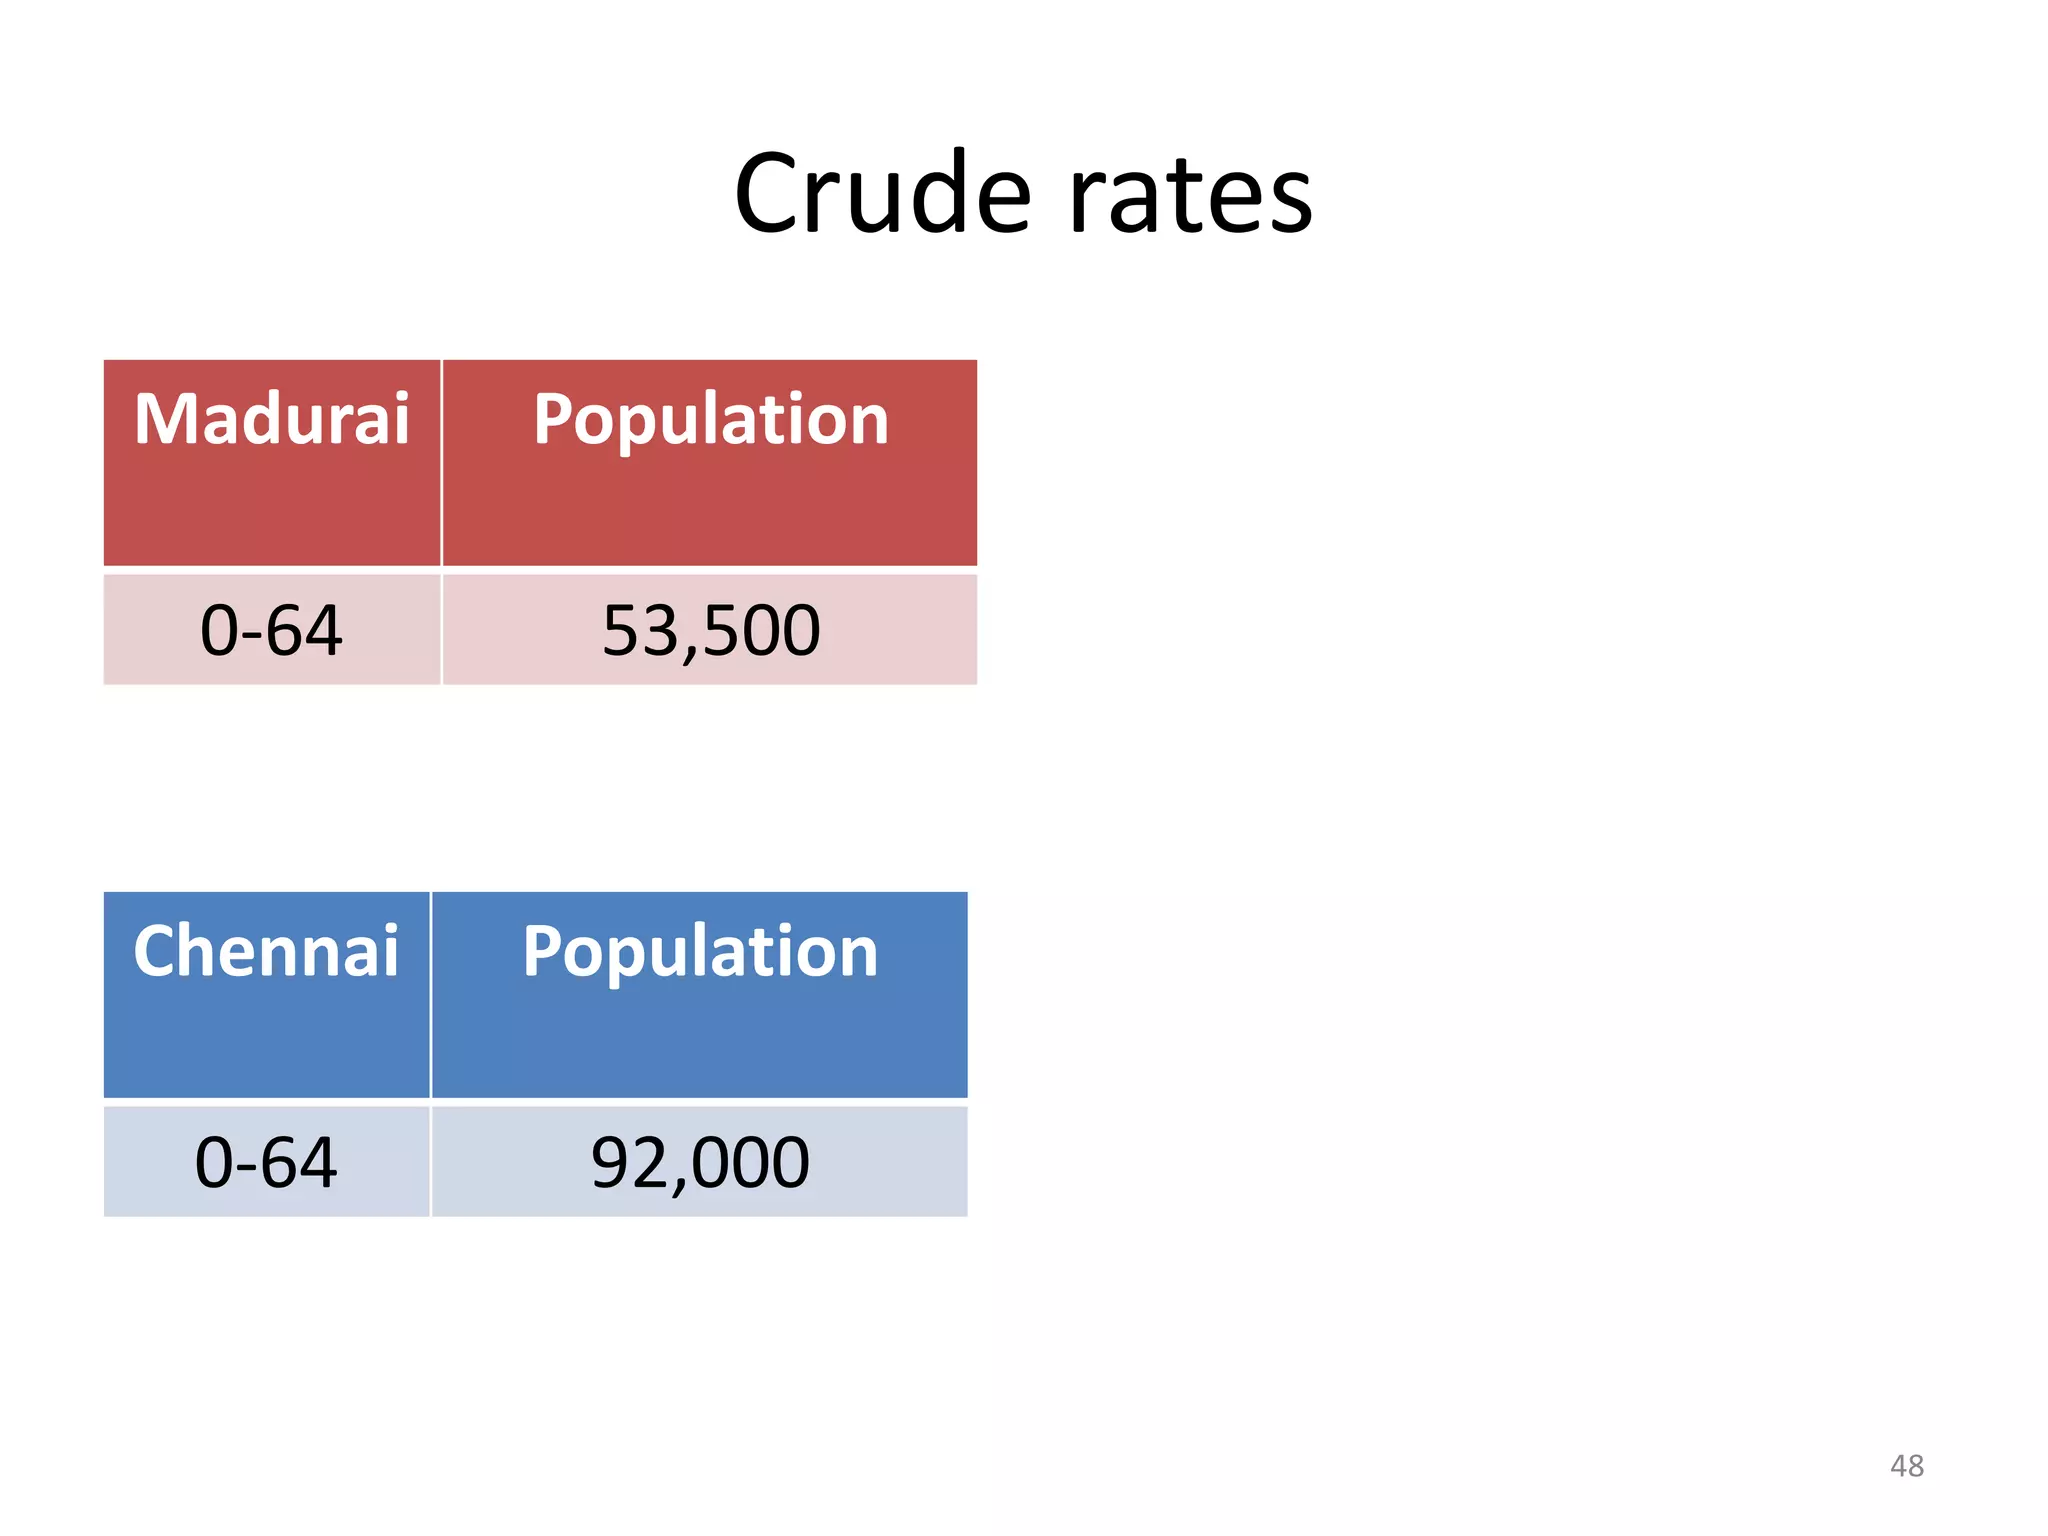
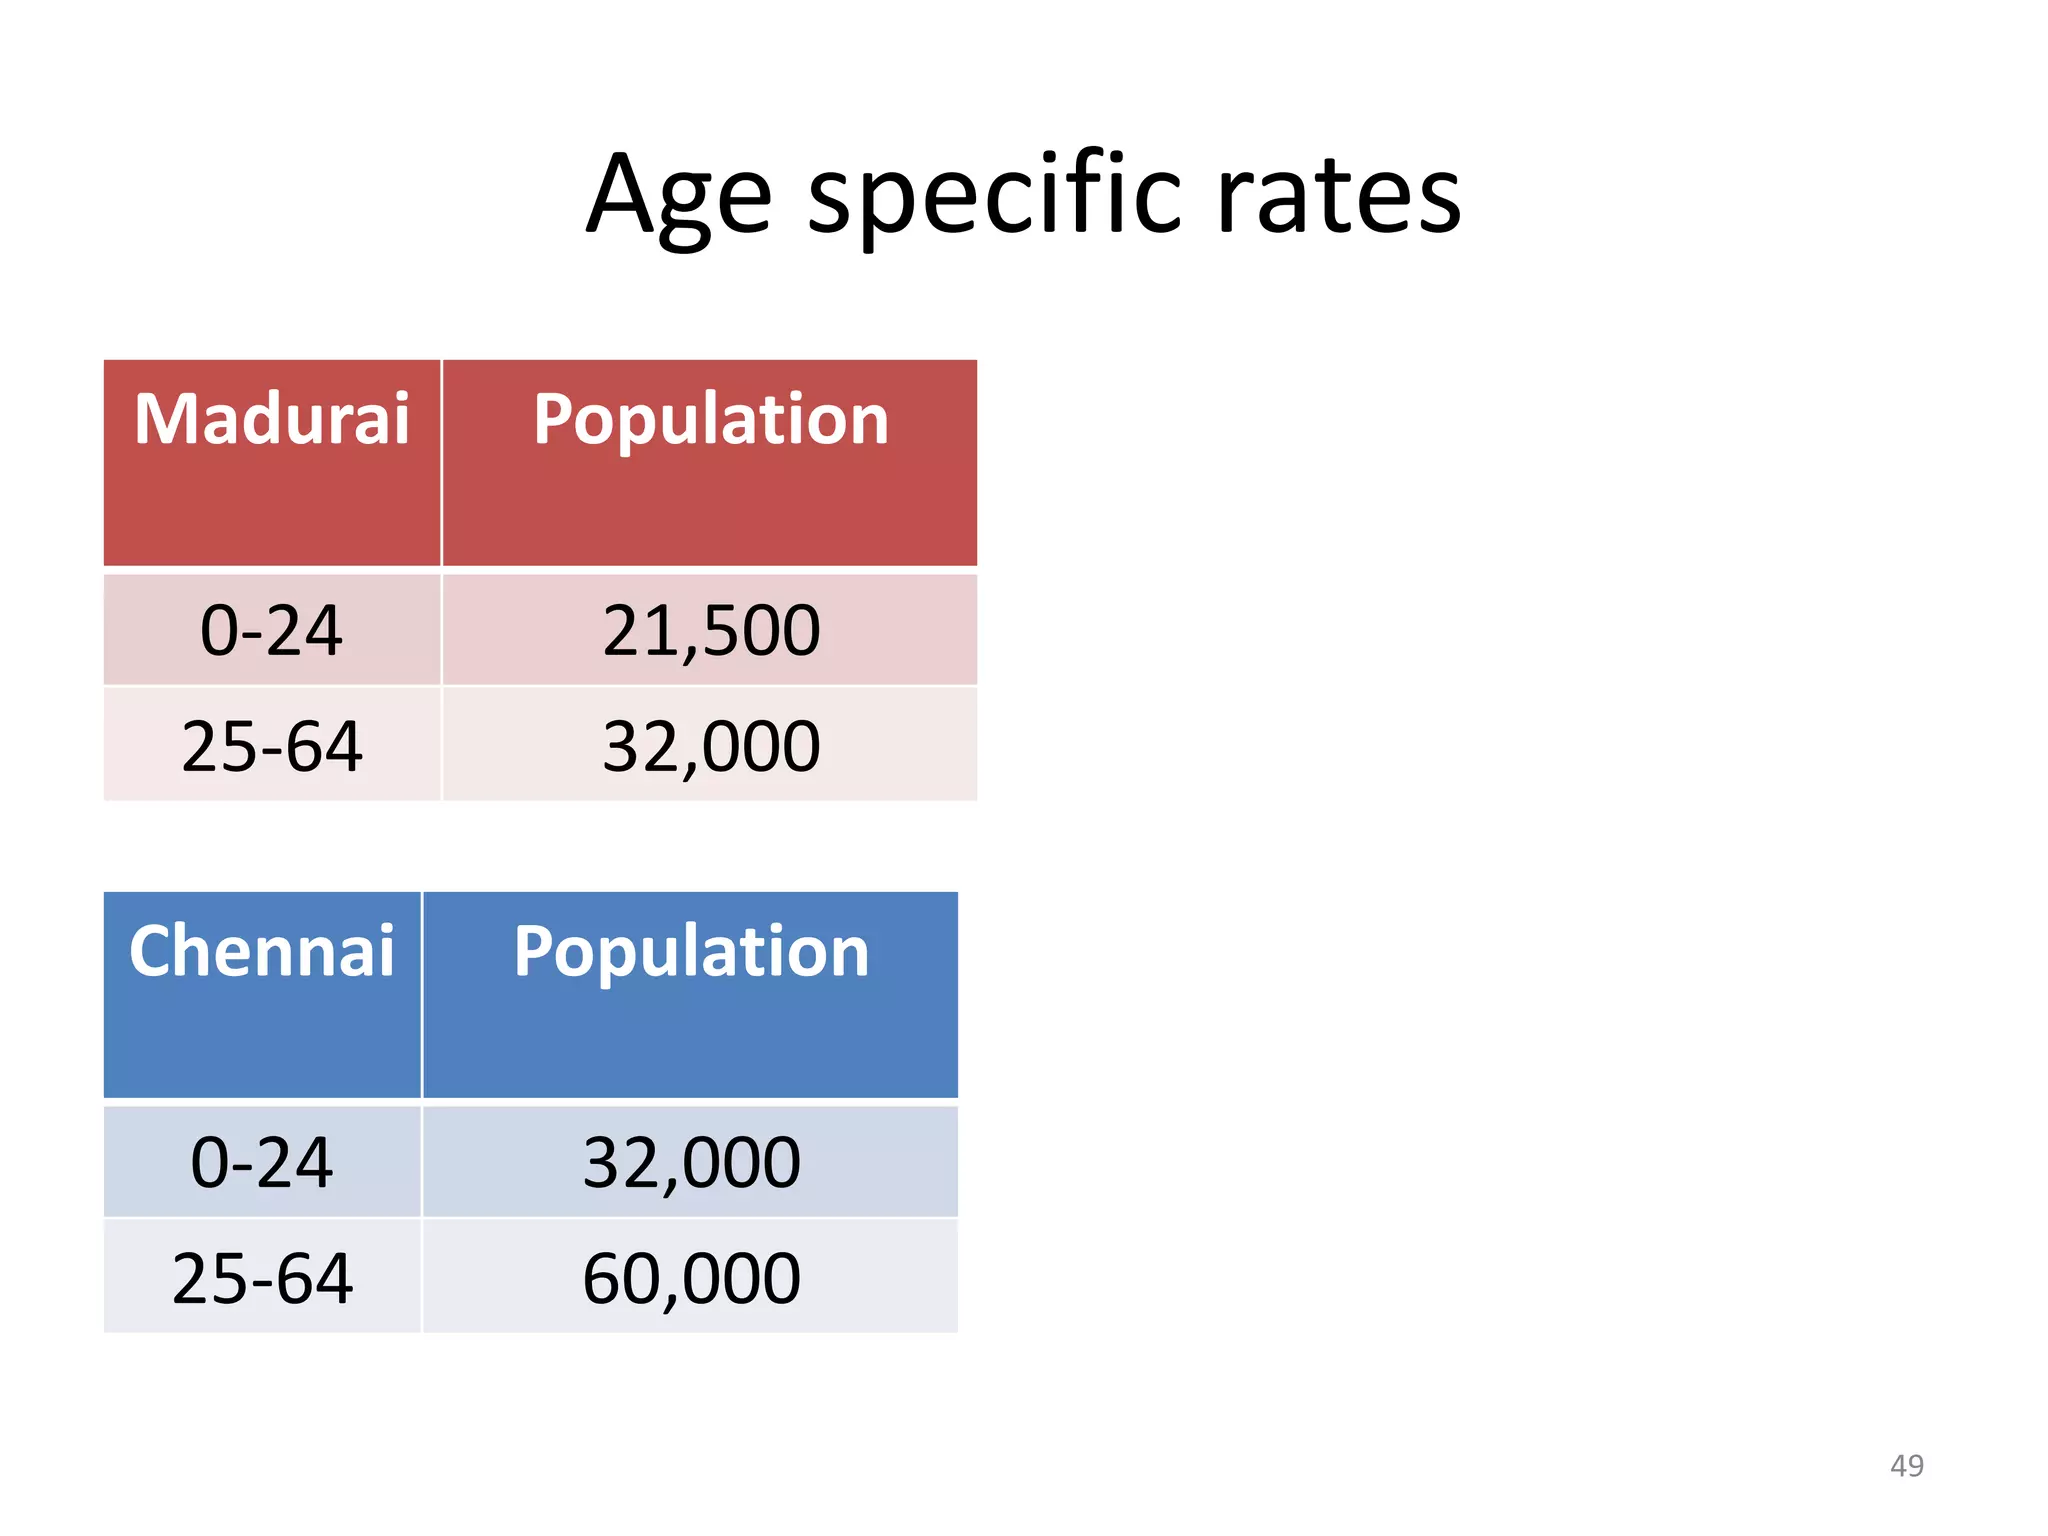
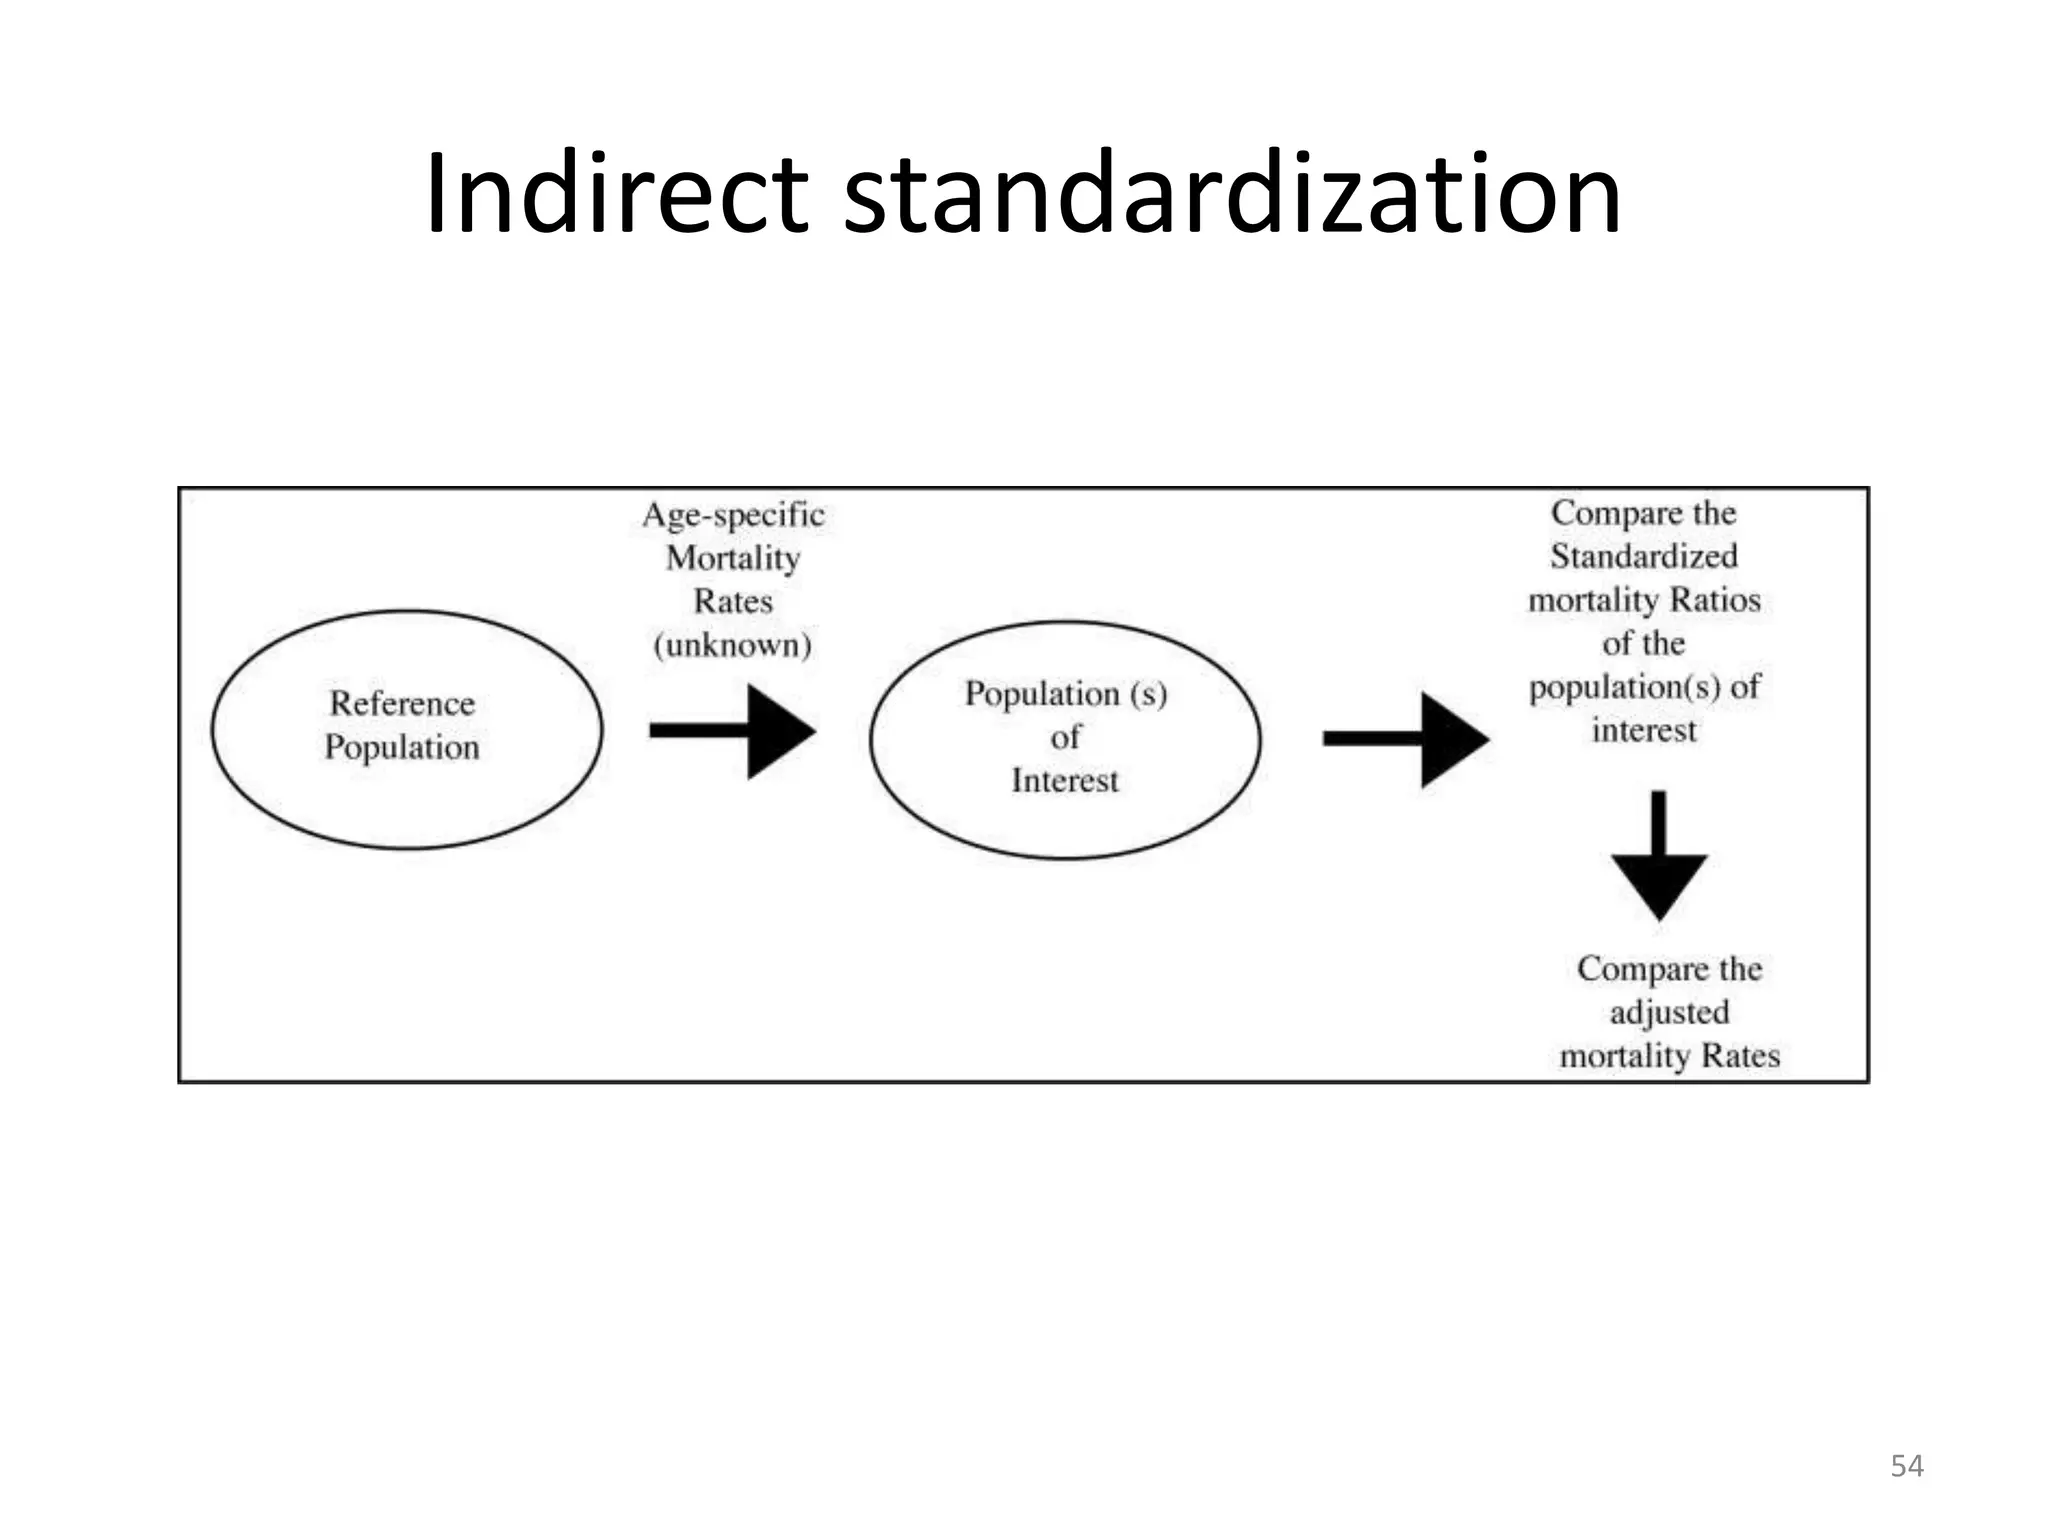
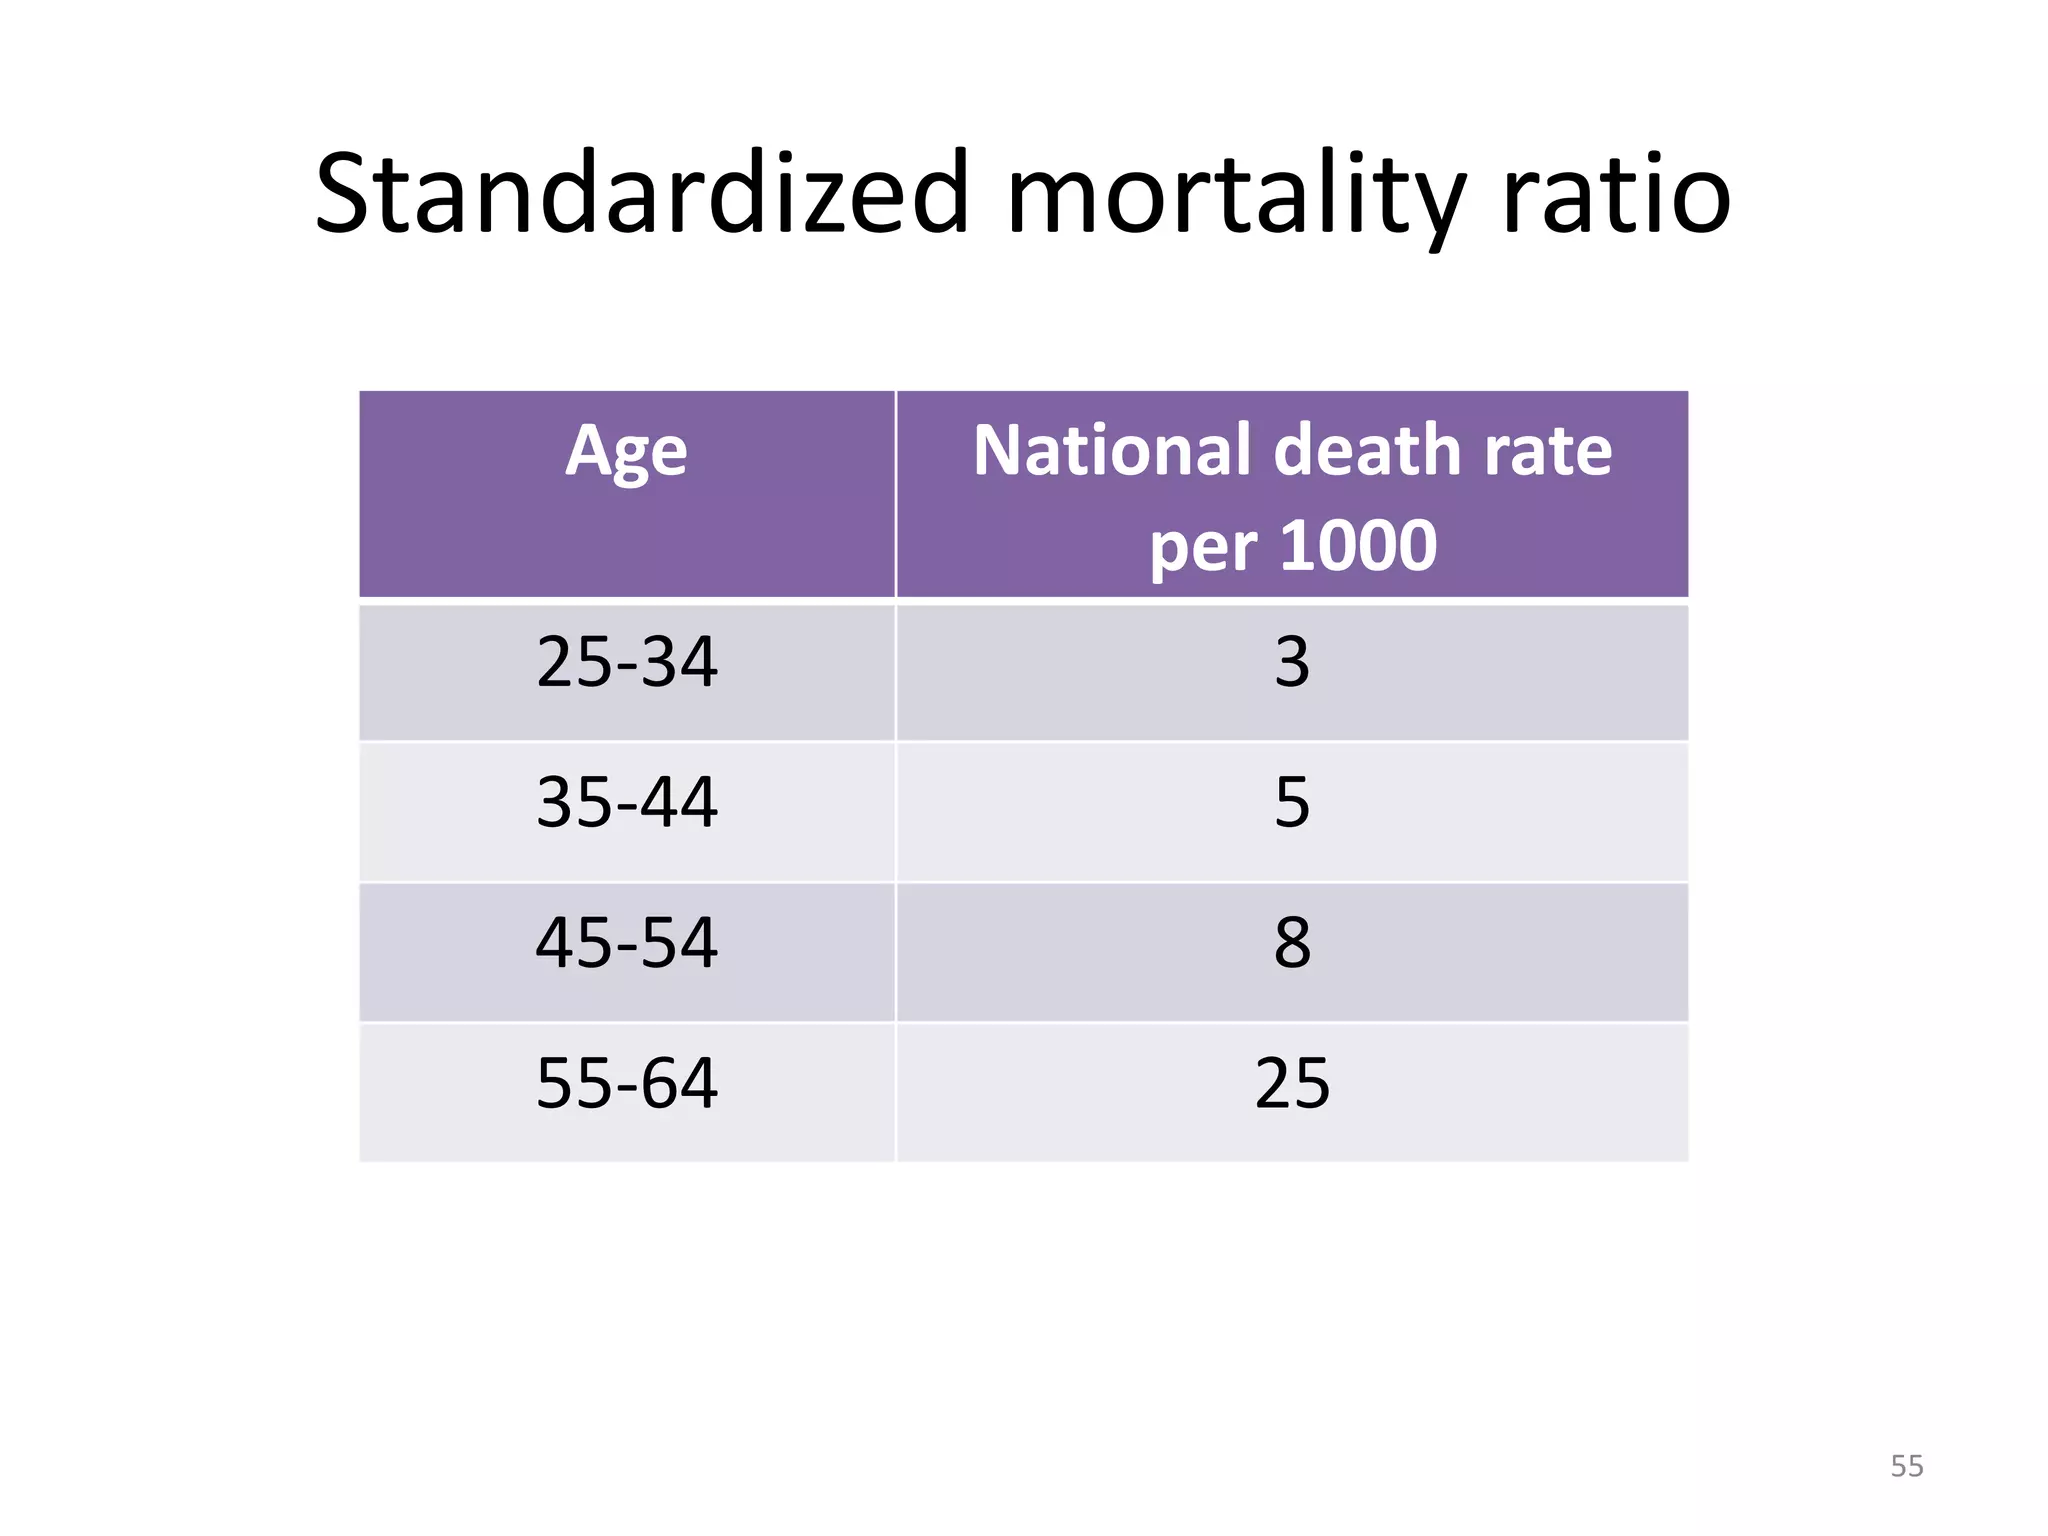
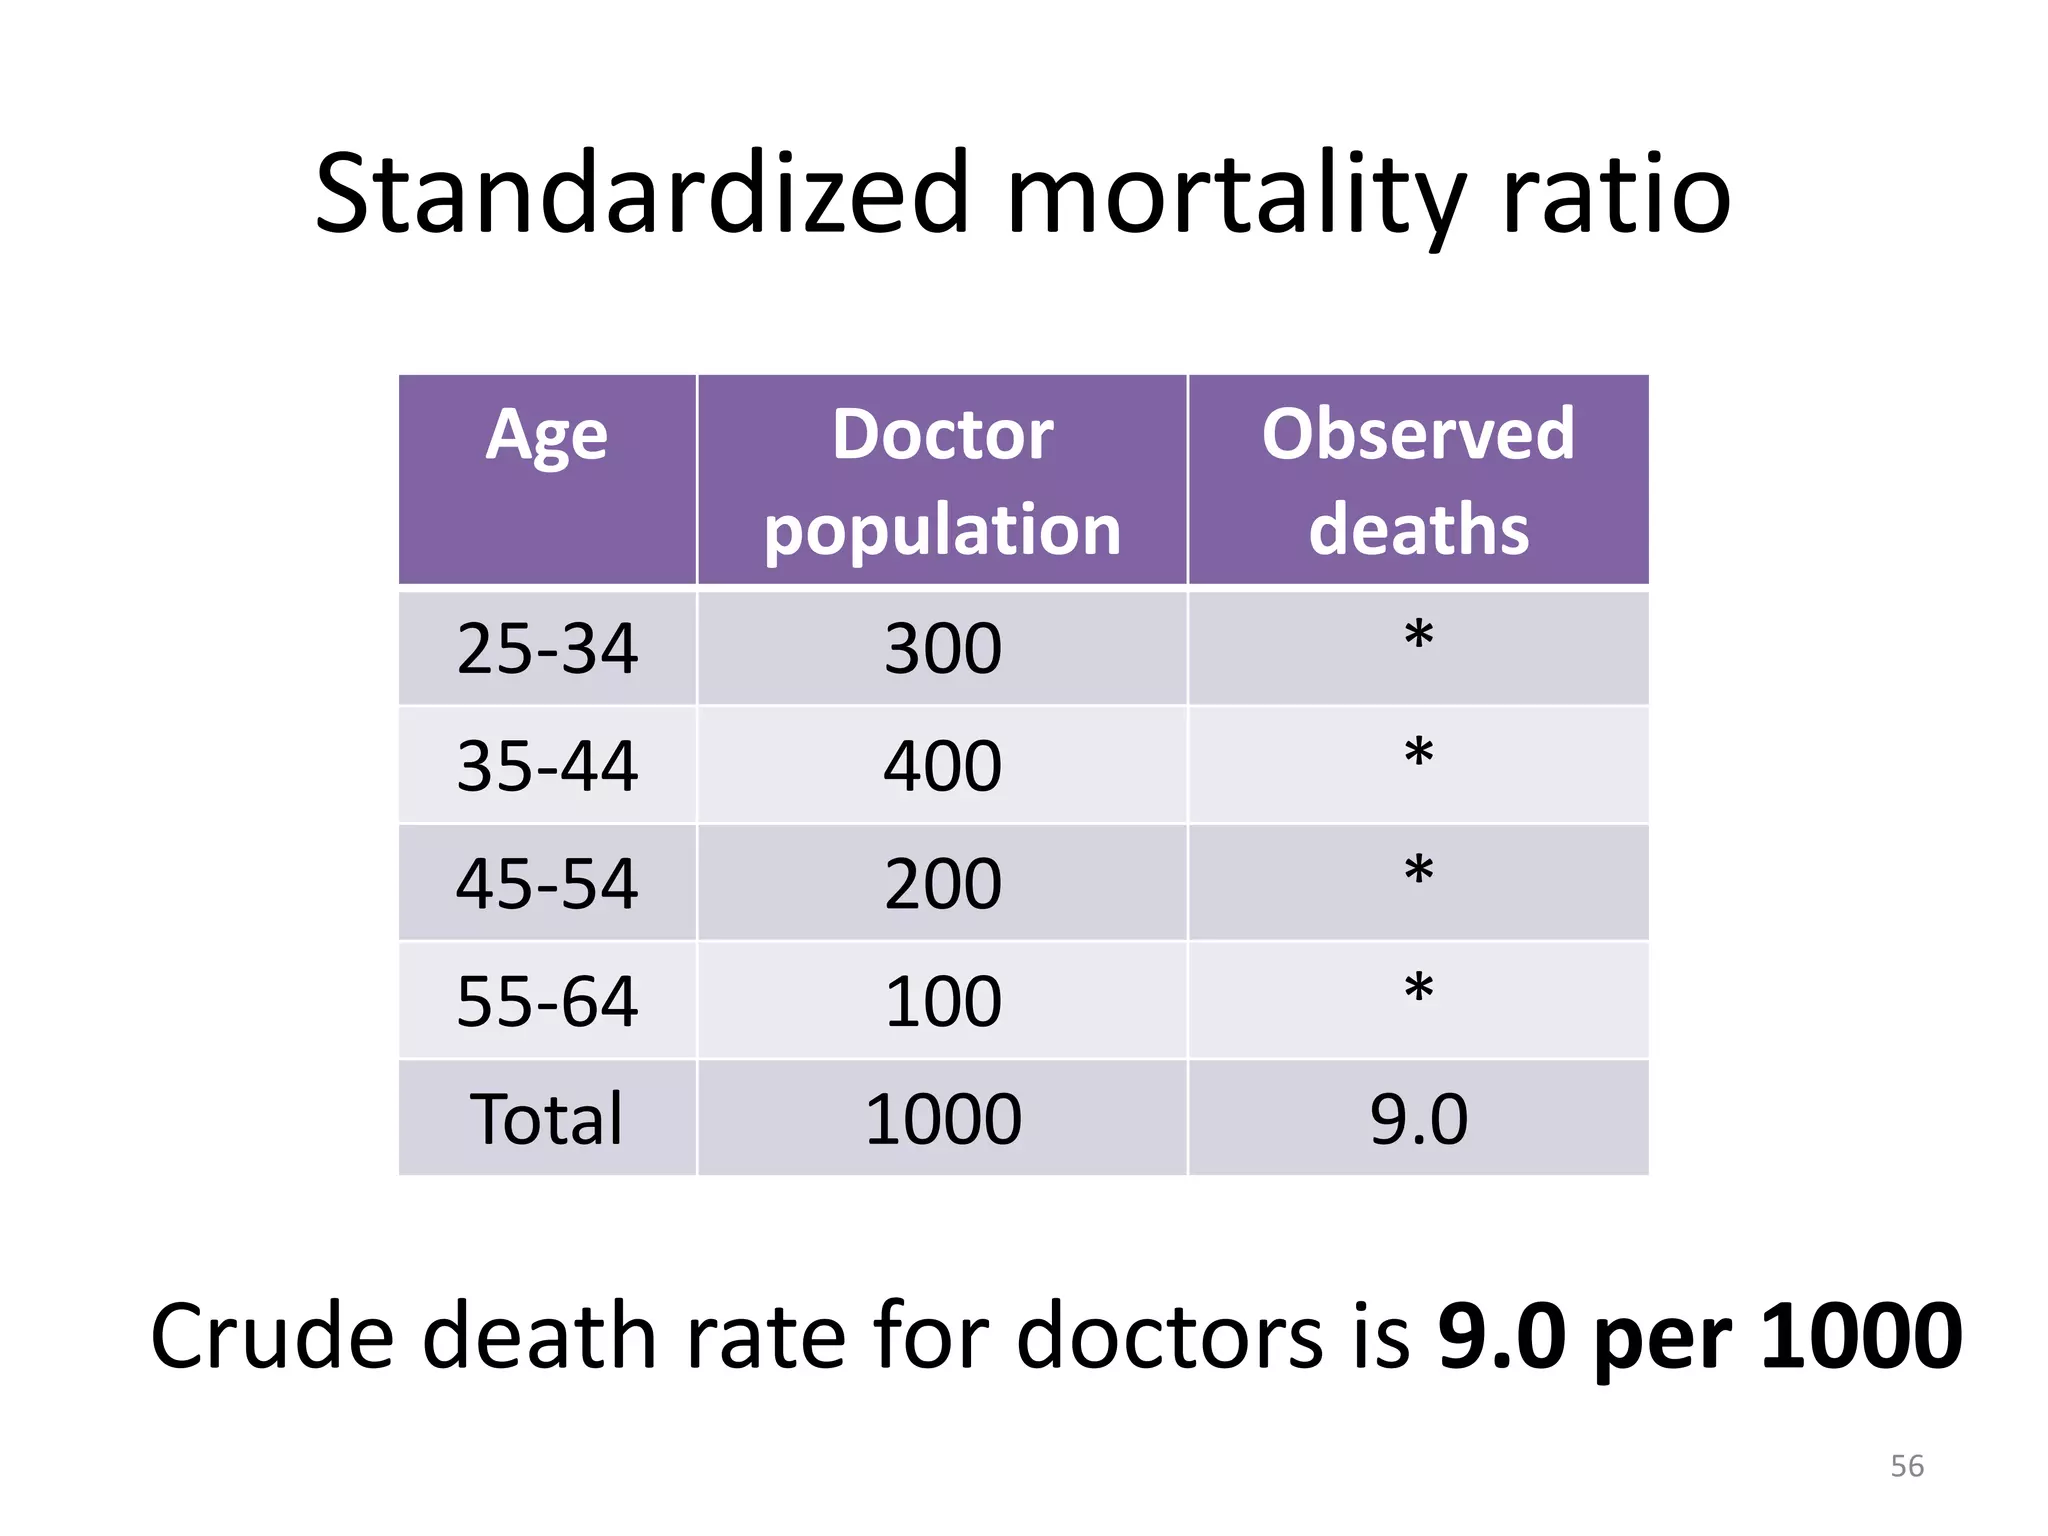
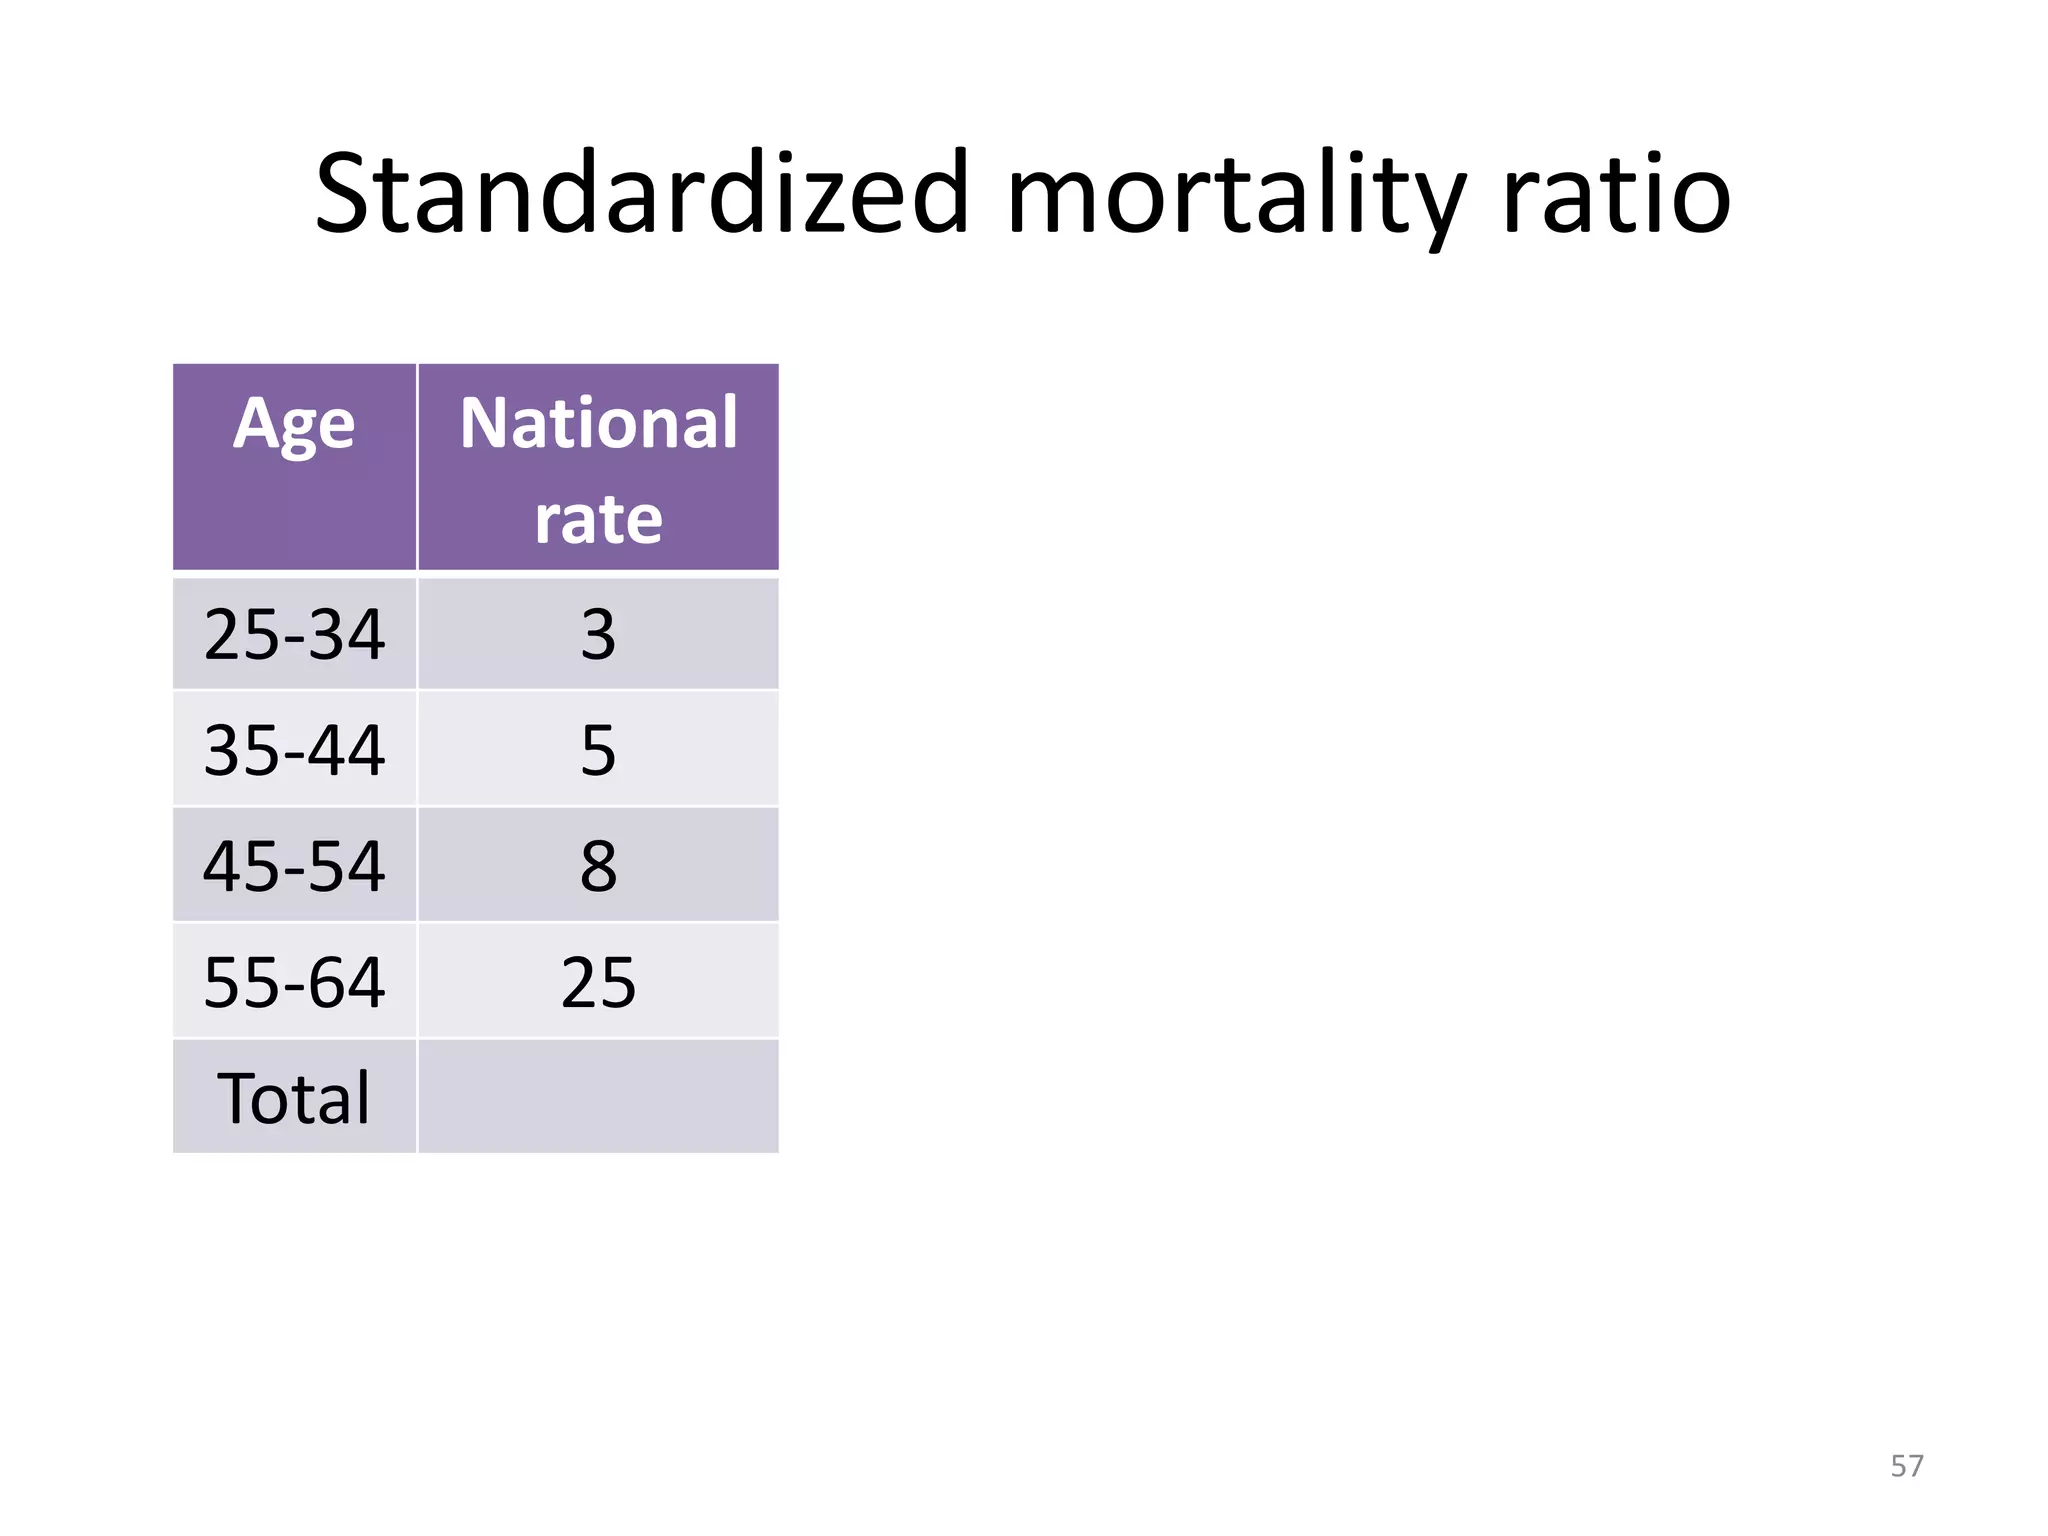
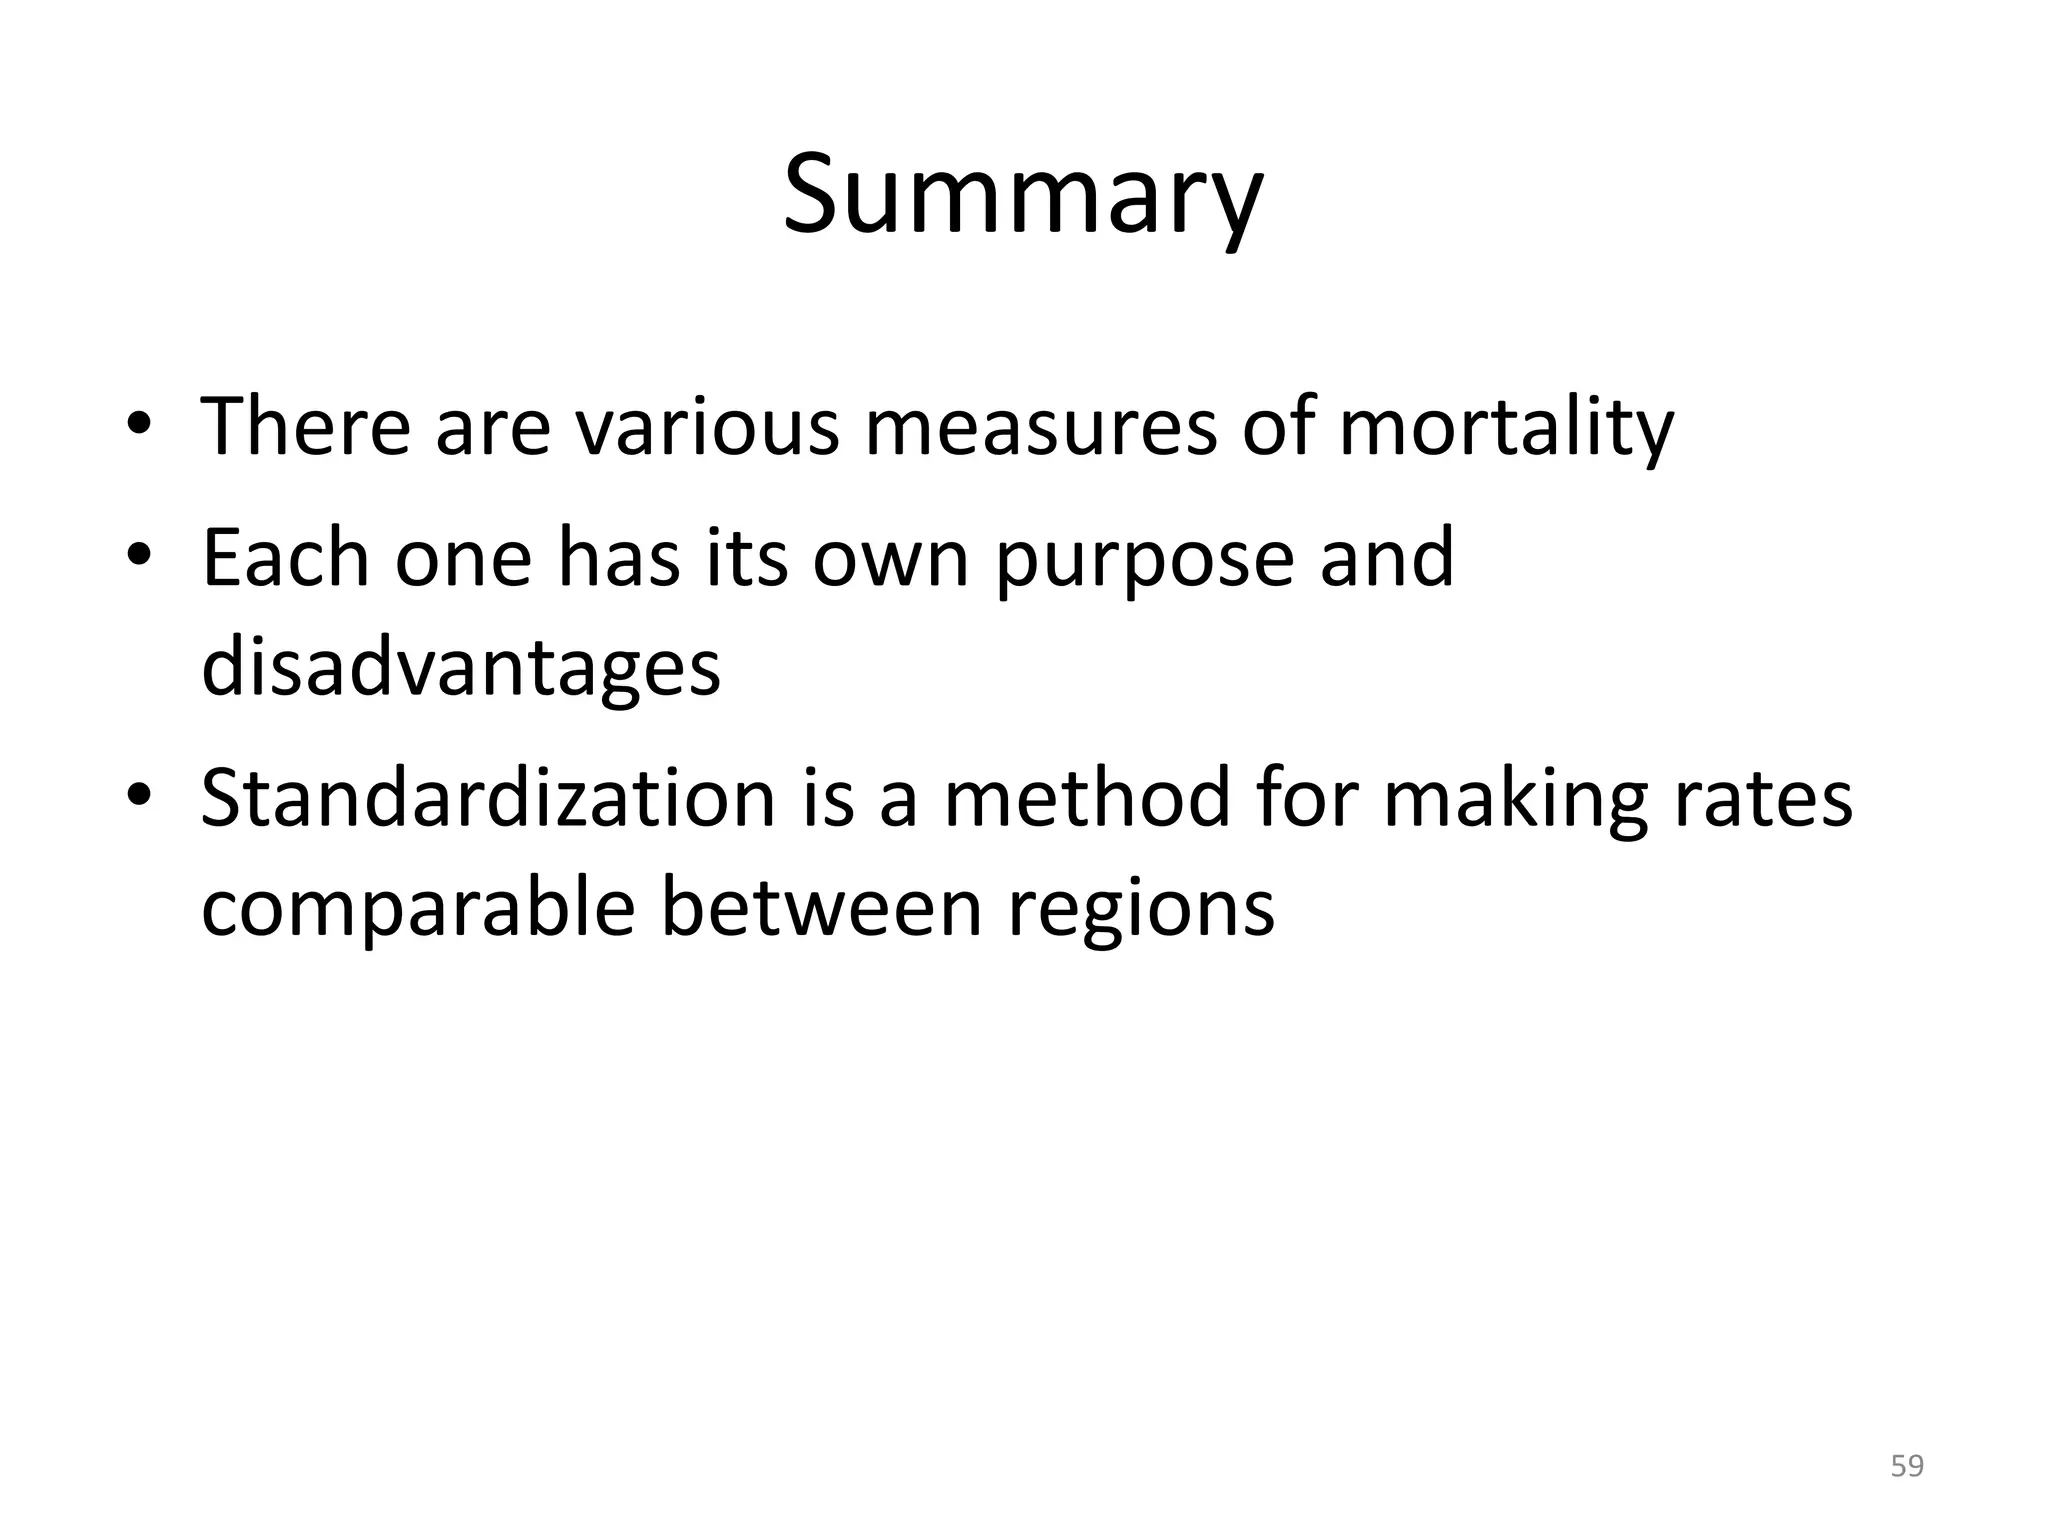
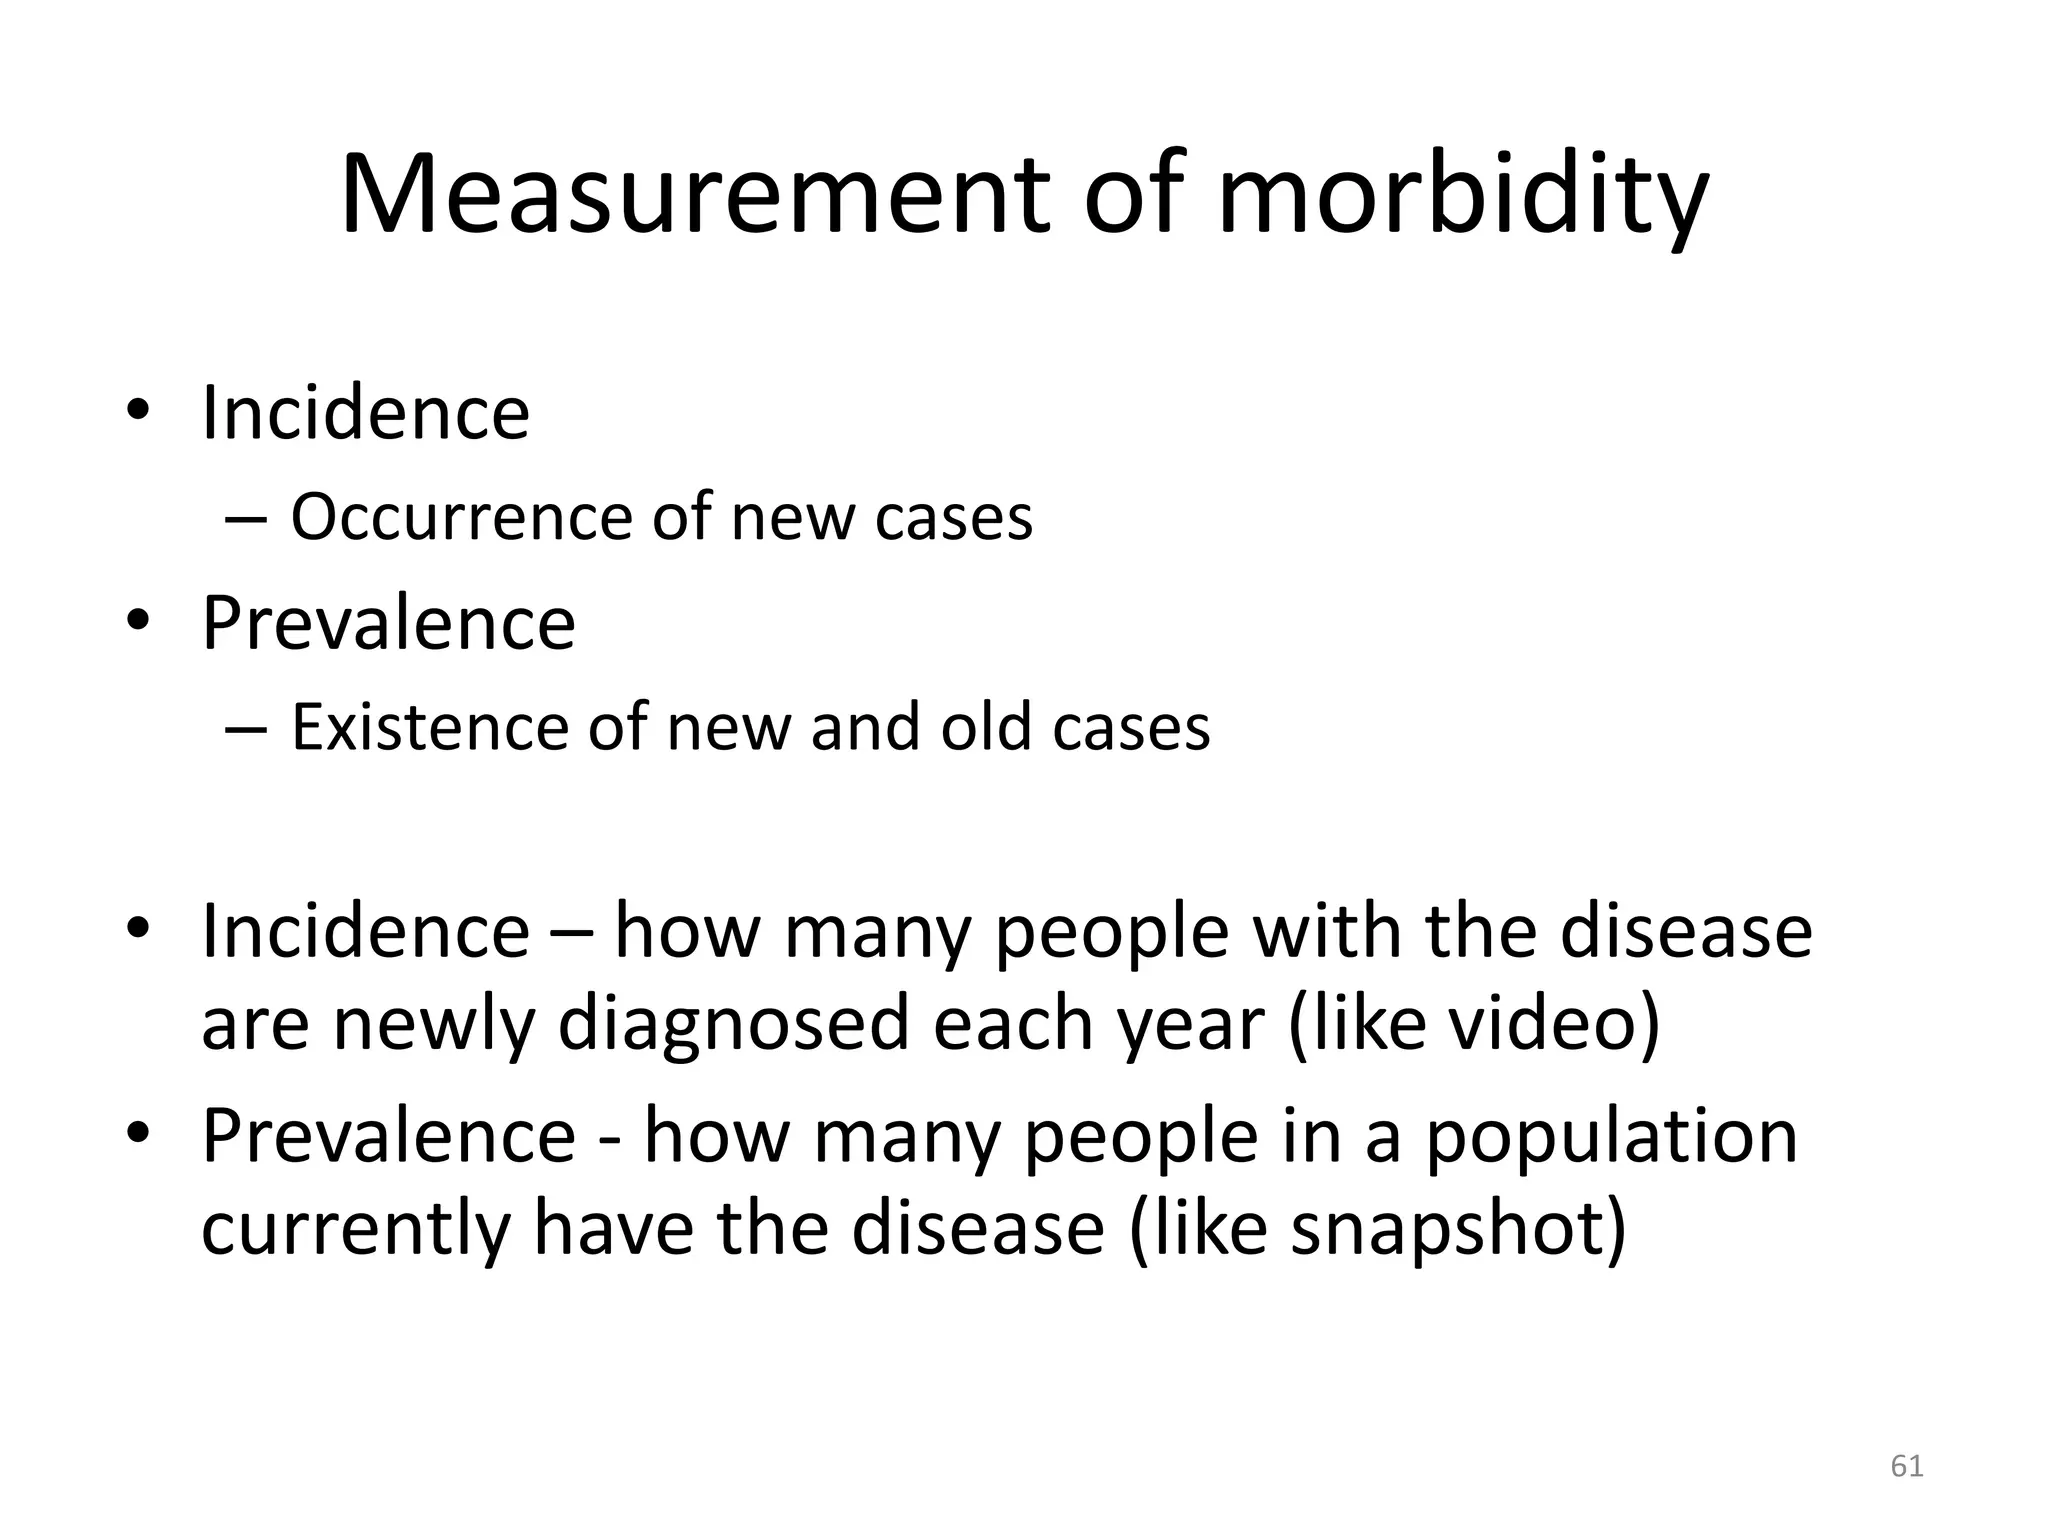
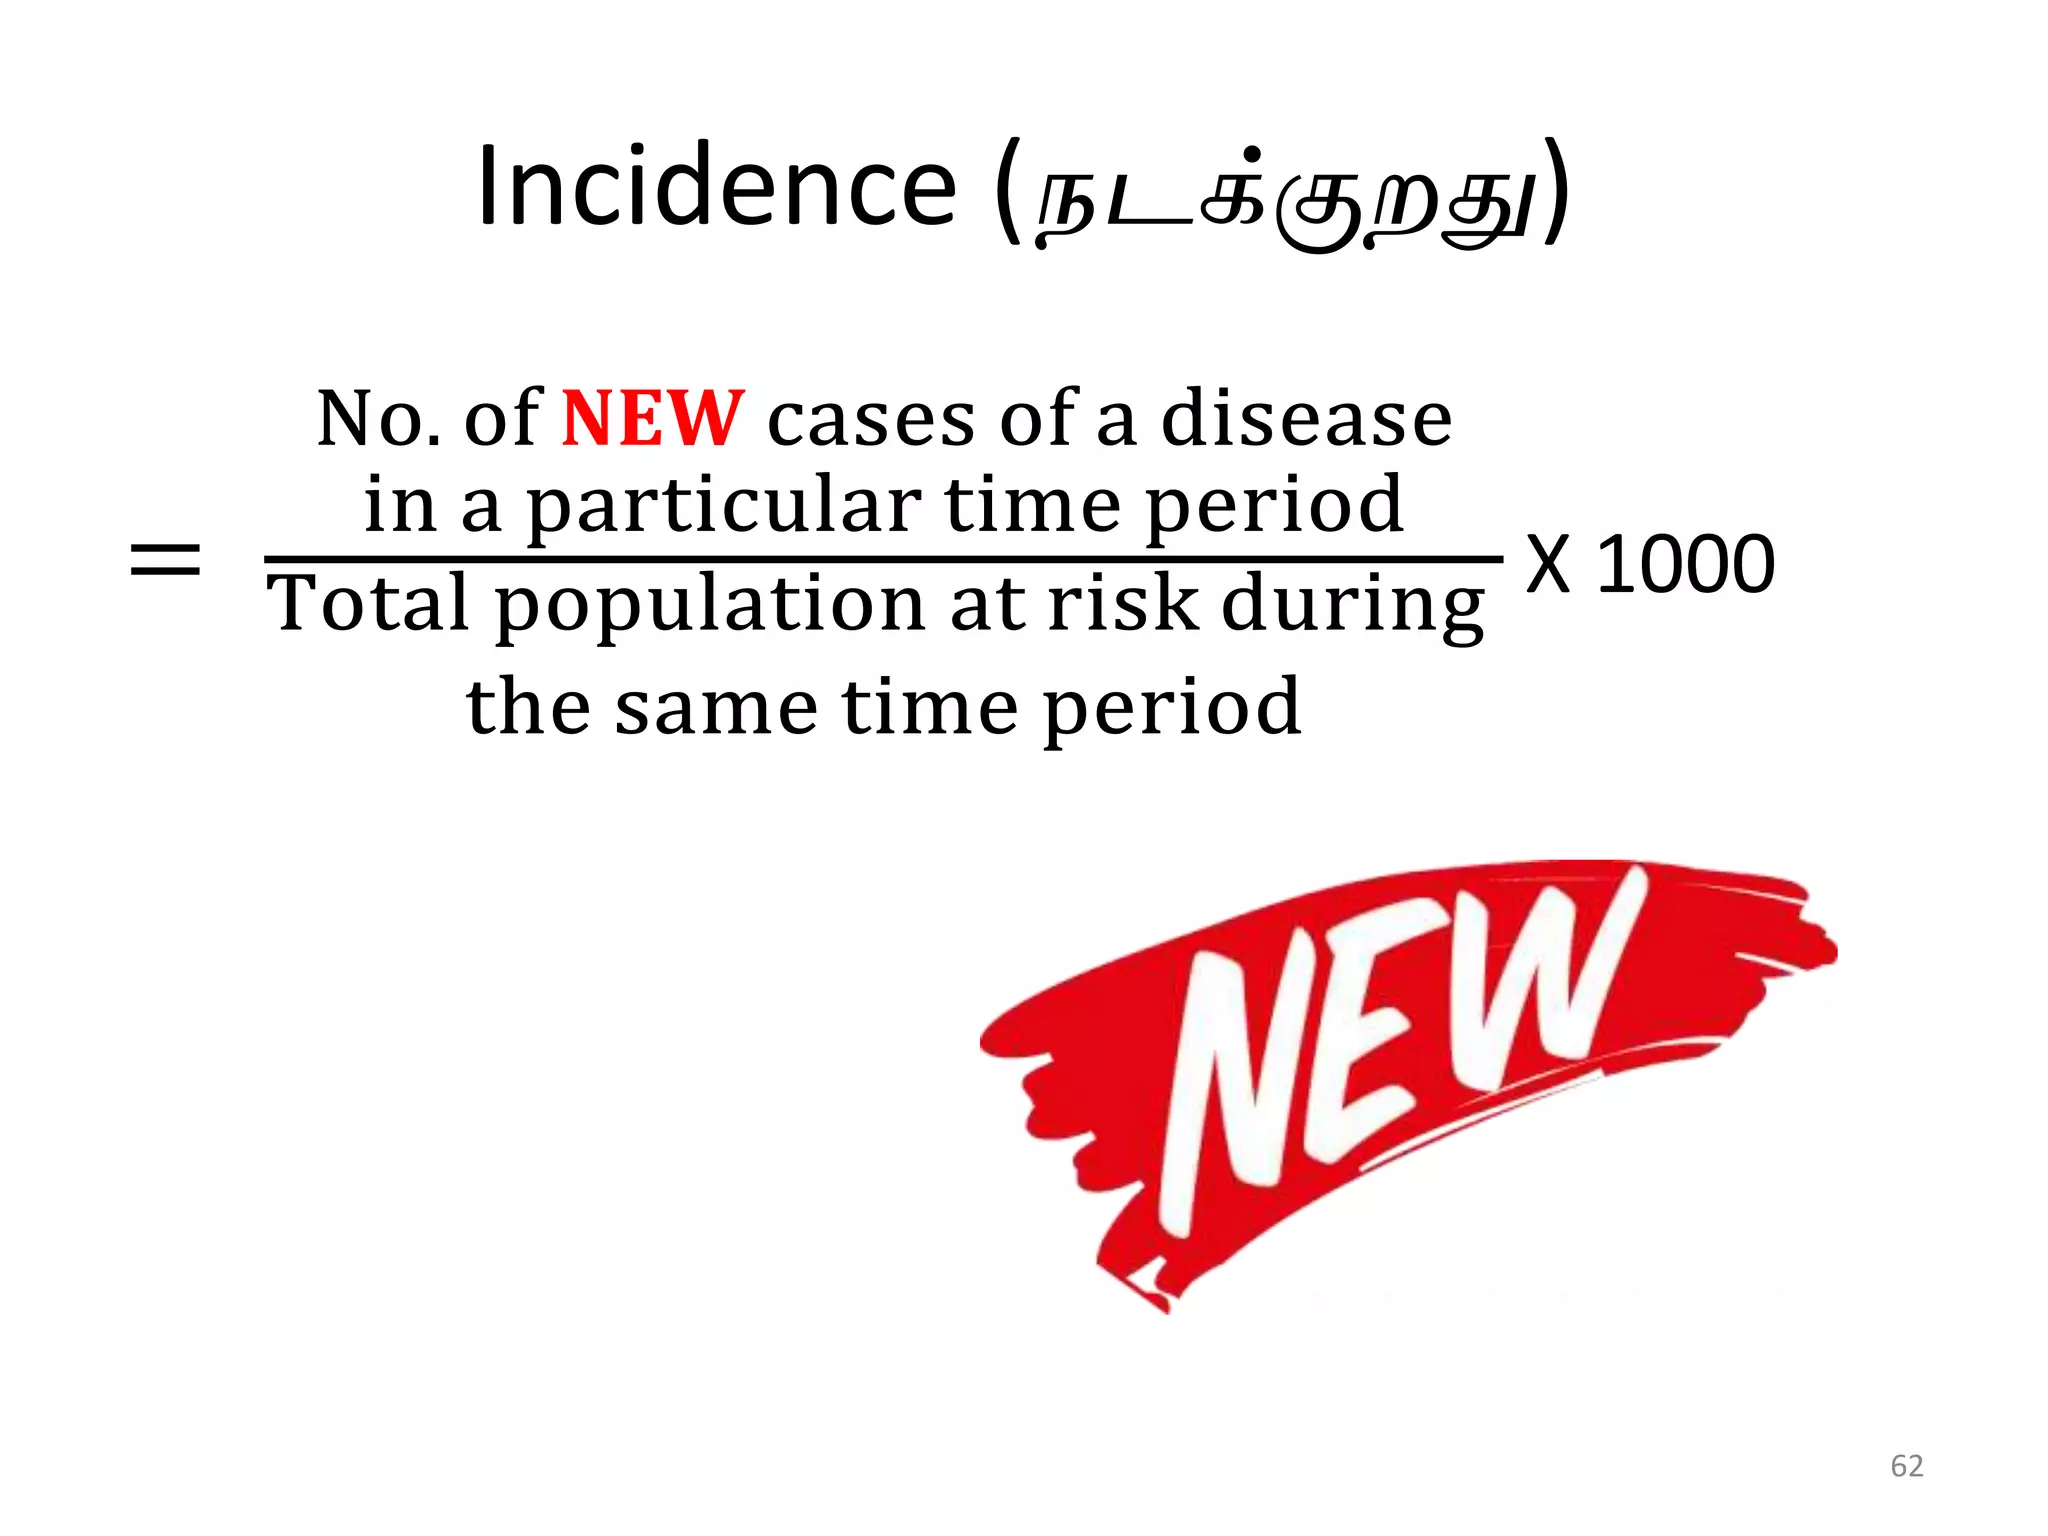
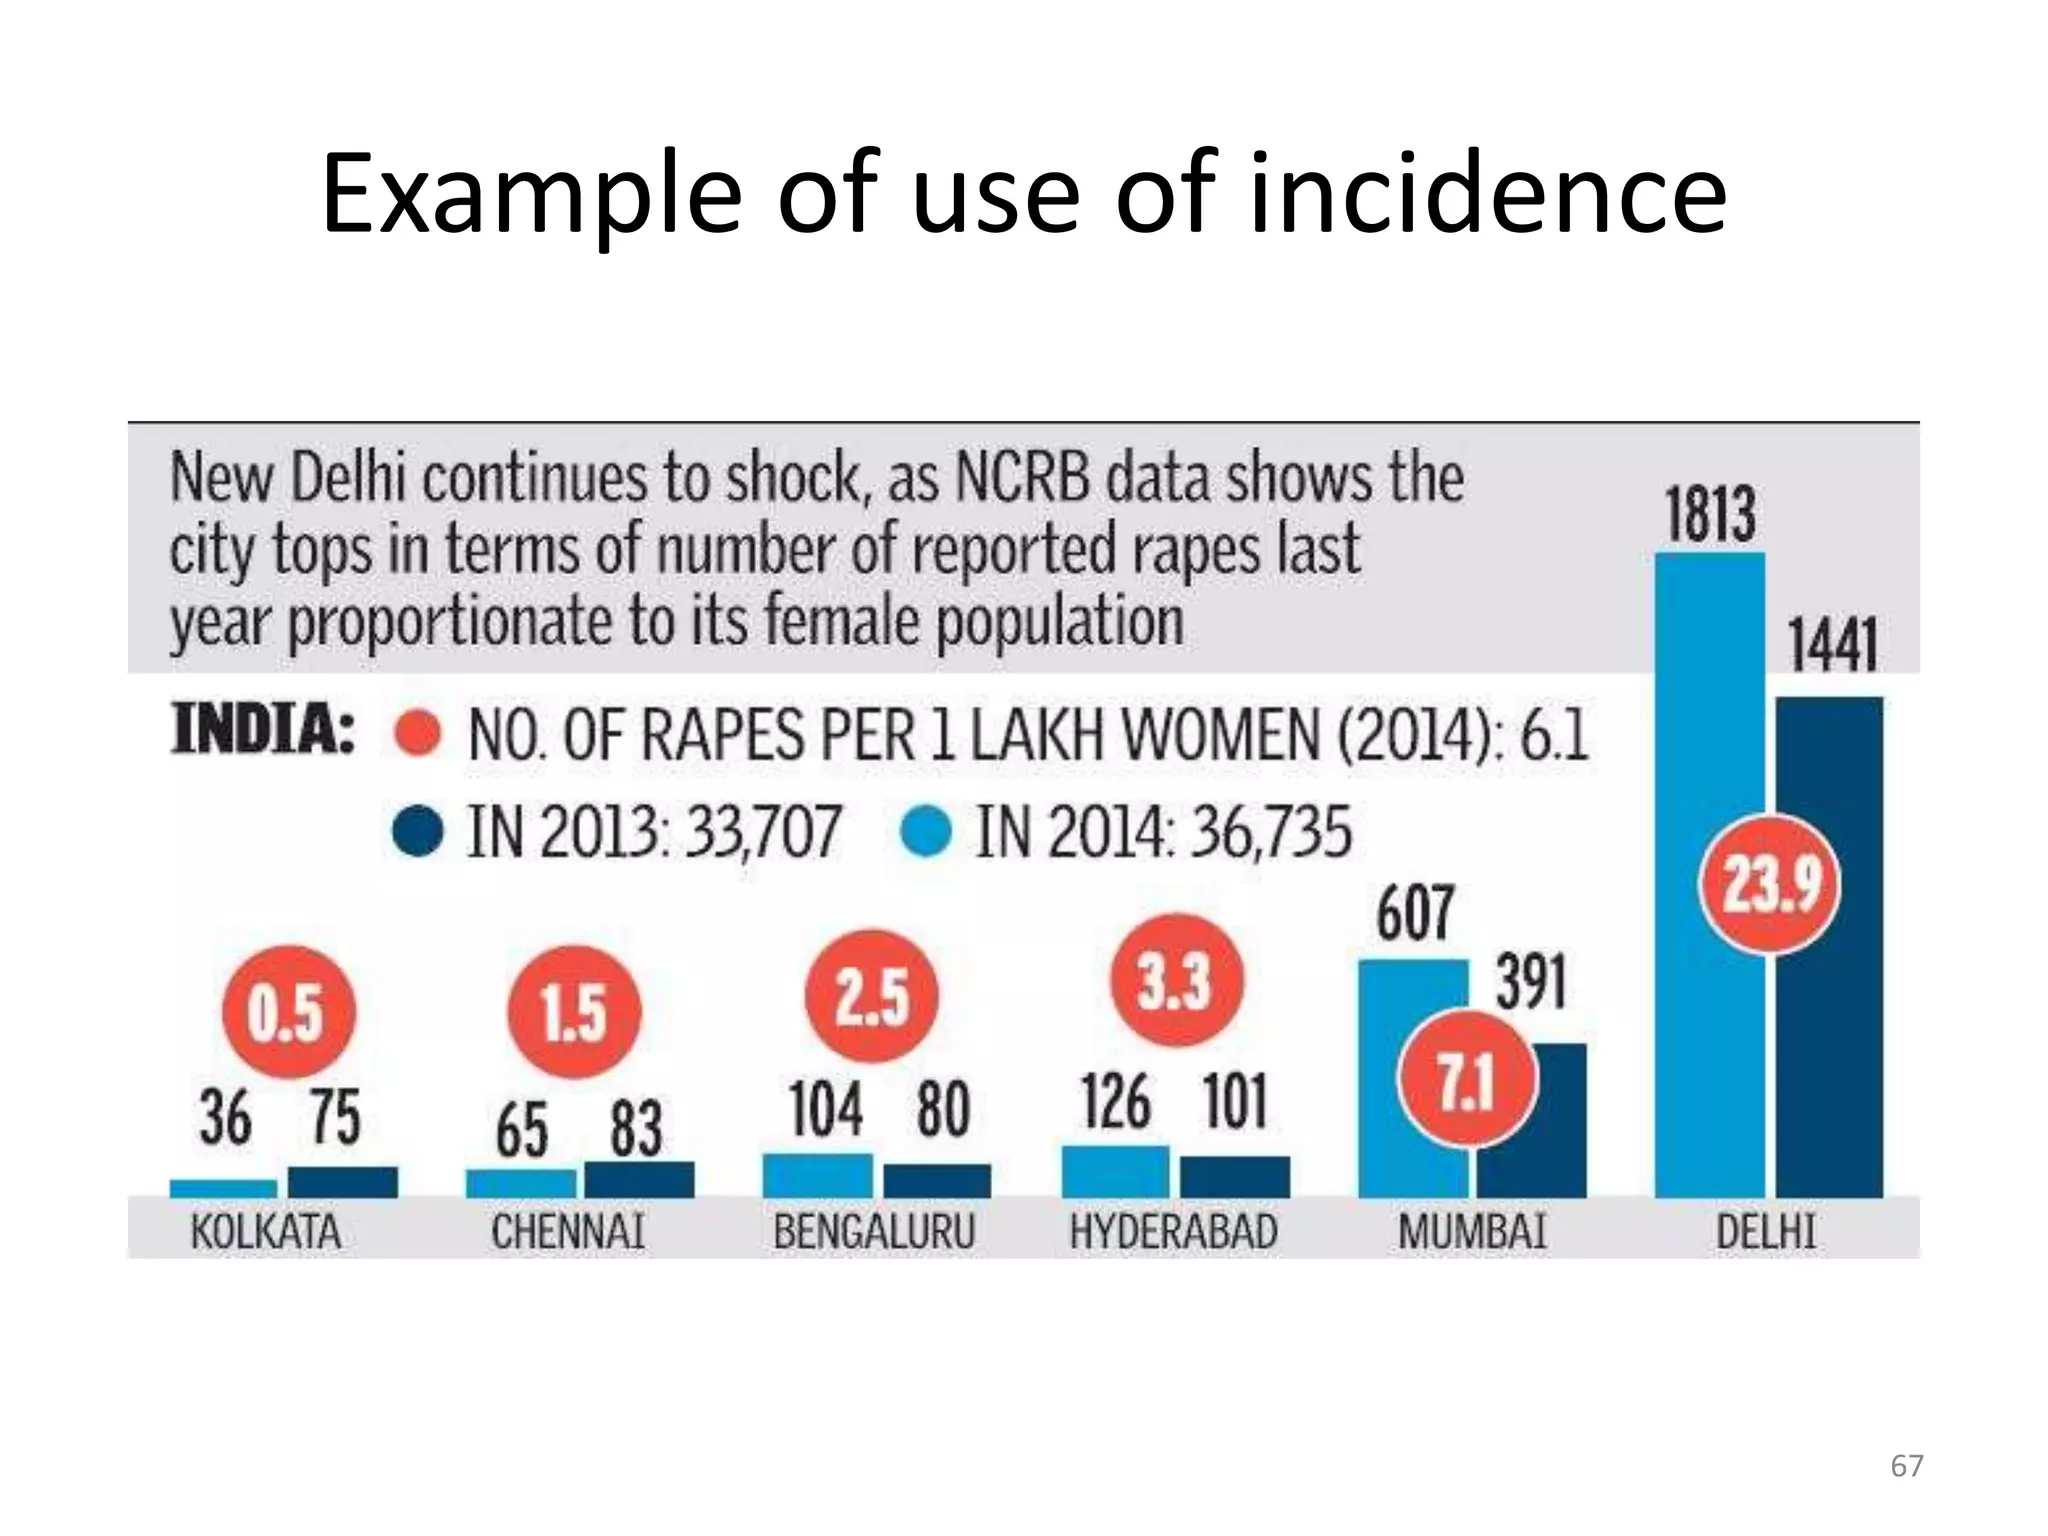
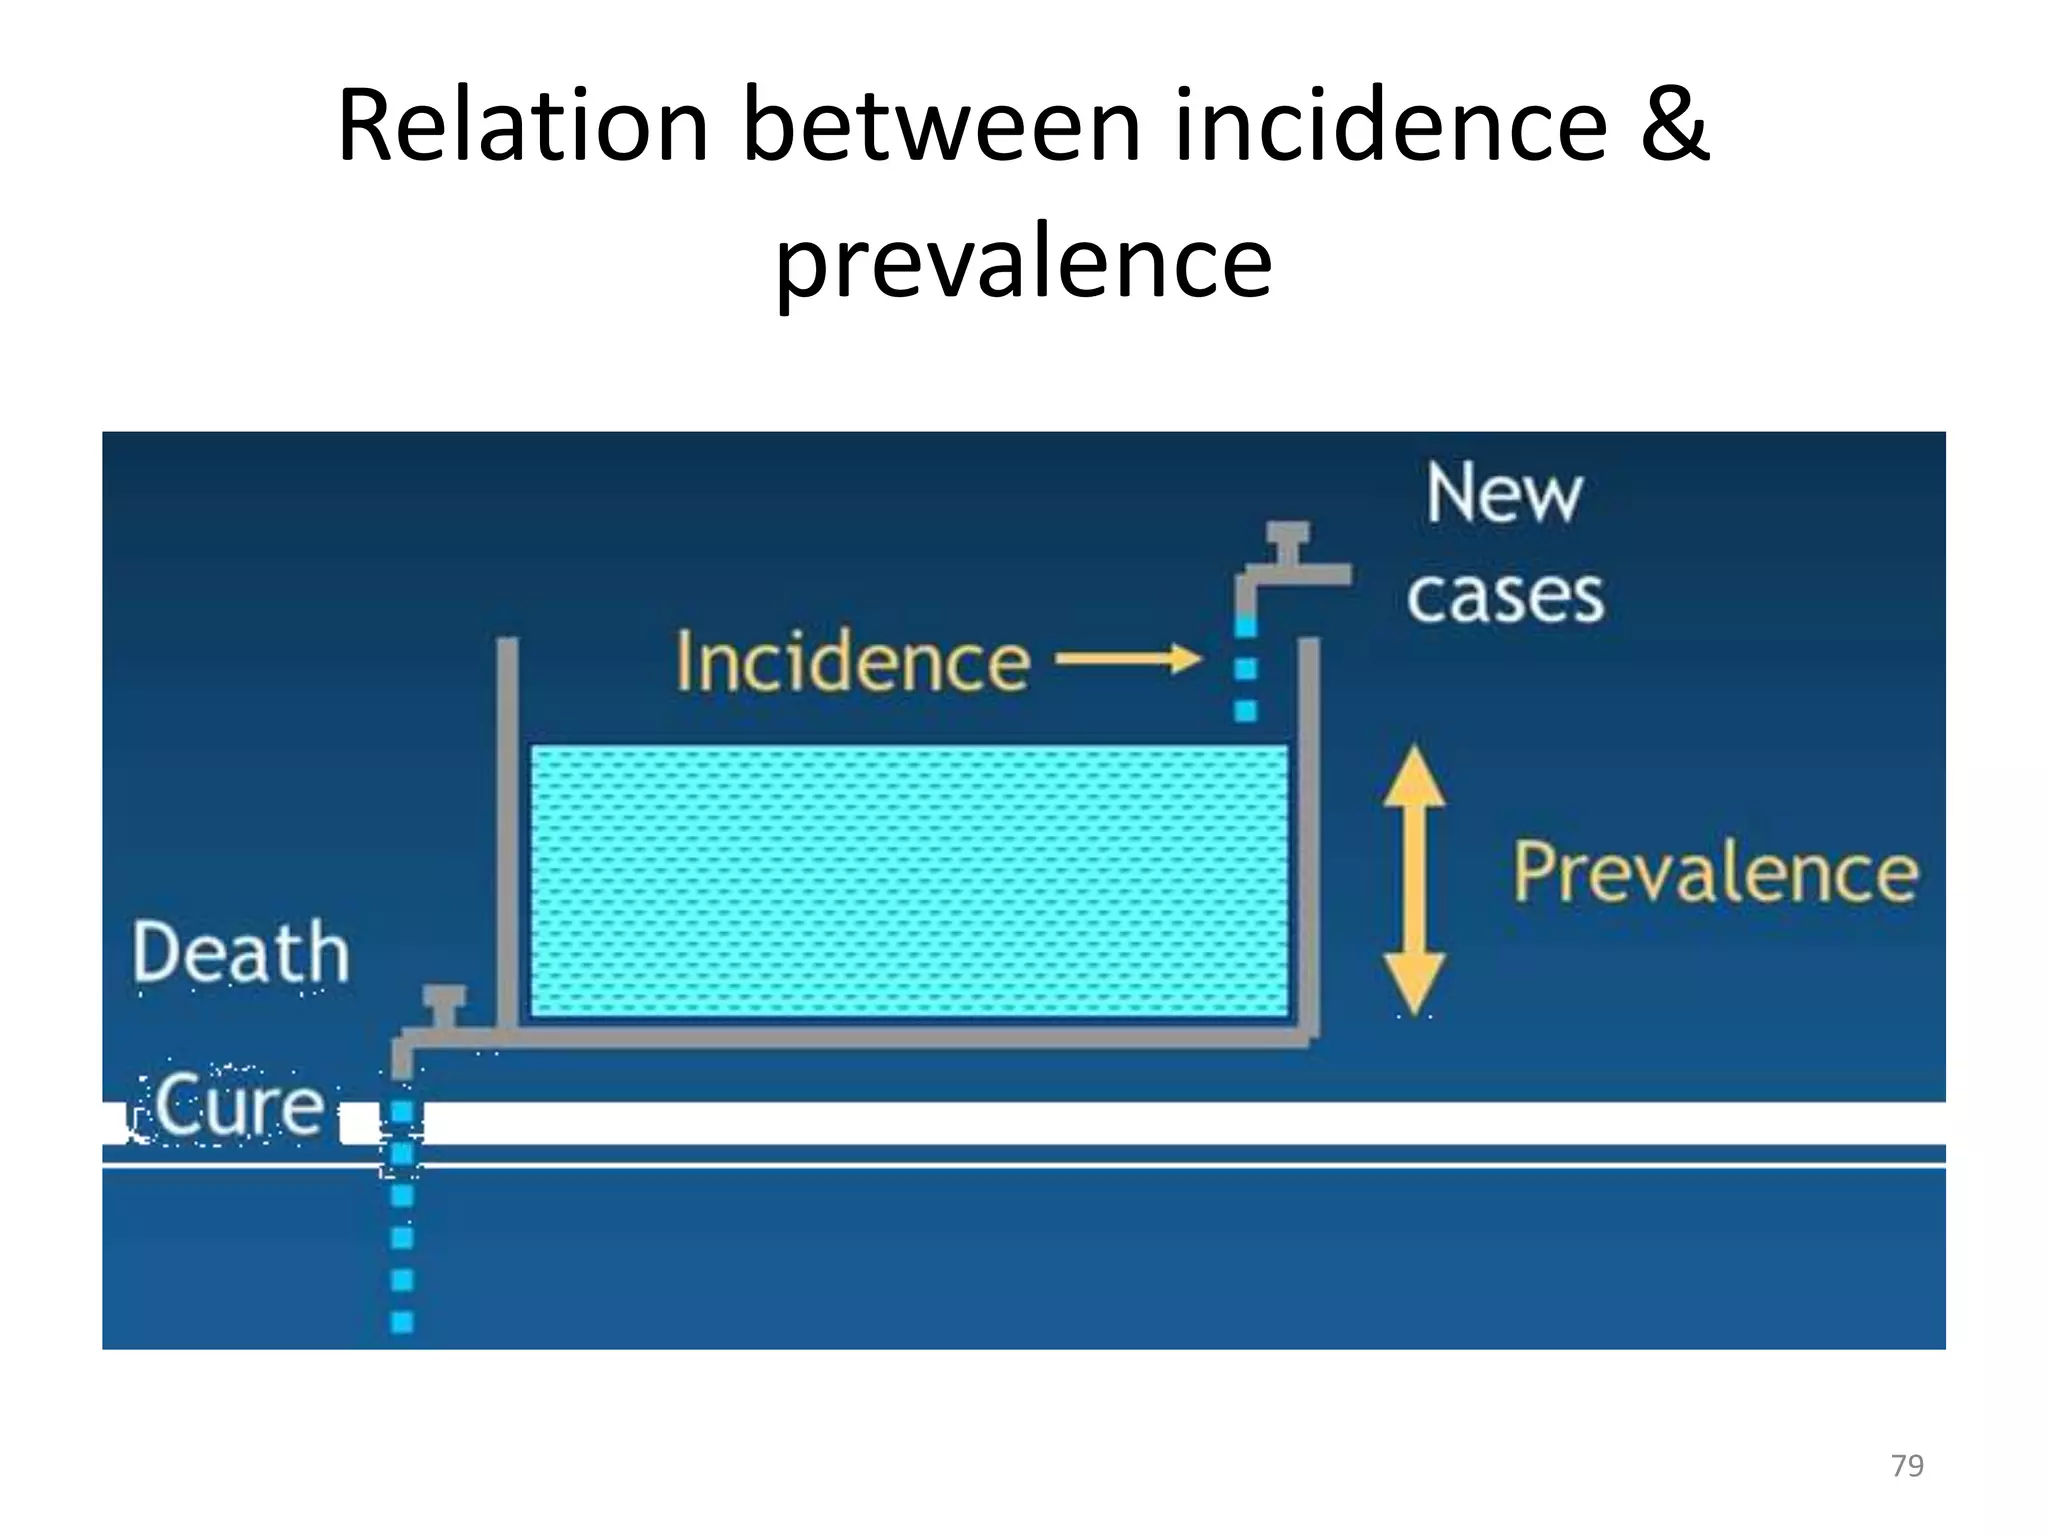
This document provides an overview of basic measurements used in epidemiology. It discusses tools like proportion, rate, and ratio. It also covers various measures of mortality like crude death rate, specific death rate, and proportional mortality rate. Measures of morbidity like incidence and prevalence are explained. The relationship between incidence and prevalence is described. Standardization techniques are introduced to make rates comparable between populations.
The Presentation explains basic models of disease causation, to understand the etiology or causes of disease & altered production and helps to understand the applicability of causal criteria applied to epidemiological studies.
Observingthedistributionofdiseaseorhealth related events in human population.
• Identify the characteristics with which the disease is associated.
• Basically 3 questions are asked who, when and where.
• Who means the person affected, where means the place and when is the time distribution.
Measurements of morbidity and mortality
At the end of the session, the students shall be able to
List the basic measurements in epidemiology
Select an appropriate tools of measurement
Measure morbidity & mortality
Perform standardization of rates
Standardization of rates by Dr. Basil TumainiBasil Tumaini
Standardization of rates by Dr. Basil Tumaini, presented during the residency at Muhimbili University of Health and Allied Sciences, Epidemiology class
As per John M. Last (1988) Epidemiology is the study of the distribution and determinants of health related states or events in specified populations, and the application of this study to the control of health problems.
An overview of a key statistical technique in epidemiology – standardization - is introduced. The process and application of both direct and indirect standardization in improving the validity of comparisons between populations are described.
This PPT discusses
Basics measurements in epidemiology
Basics requirements of measurements
Tools of measurements
Measures of morbidity
Measures of disability
Measures of mortality
Development over the centuries of Human Civilization concepts of disease causation remained transforming and still not reached the perfection.
Pre-modern era theories of Disease causation: Religions often attributed disease outbreaks or other misfortunes to divine retribution - punishment for mankind's sins.
and imbalance among four vital "humors“ within us. Hippocrates; Yellow Bile, Black Bile, Phlegm and Blood
Miasma Theory: 500 BC Miasmas are poisonous emanations from putrefying carcasses, vegetables, molds and also the invisible particles. This theory led to explanation of several outbreaks of cholera, plague and malaria (Mal-aria= bad air).
Fracastoro's contagion theory of disease (1546)
Germ theory: Louis Pasteur , Lister and others introduced the germ theory in 1878. In 1890 Robert Koch proposed specific criteria that should be met before concluding that a disease was caused by a particular bacterium. Only single germ is responsible for causation of a specific disease.
Webs of Causation: Epidemiological concept
This presentation will help to get an insight into Epidemiological methods and describes details of Descriptive epidemiology. It will be useful to medical researcher as an initial input.
Determinants of Fall Risk and Injury in Hispanic Elderly Living in El Paso Community
Guillermina Solis, PhD, RN, F/GNP
Vanessa Guerrero, RN
Mano y Corazón Binational Conference of Multicultural Health Care Solutions, El Paso, Texas, September 27-28, 2013
Report Back from SGO 2024: What’s the Latest in Cervical Cancer?bkling
Are you curious about what’s new in cervical cancer research or unsure what the findings mean? Join Dr. Emily Ko, a gynecologic oncologist at Penn Medicine, to learn about the latest updates from the Society of Gynecologic Oncology (SGO) 2024 Annual Meeting on Women’s Cancer. Dr. Ko will discuss what the research presented at the conference means for you and answer your questions about the new developments.
Title: Sense of Smell
Presenter: Dr. Faiza, Assistant Professor of Physiology
Qualifications:
MBBS (Best Graduate, AIMC Lahore)
FCPS Physiology
ICMT, CHPE, DHPE (STMU)
MPH (GC University, Faisalabad)
MBA (Virtual University of Pakistan)
Learning Objectives:
Describe the primary categories of smells and the concept of odor blindness.
Explain the structure and location of the olfactory membrane and mucosa, including the types and roles of cells involved in olfaction.
Describe the pathway and mechanisms of olfactory signal transmission from the olfactory receptors to the brain.
Illustrate the biochemical cascade triggered by odorant binding to olfactory receptors, including the role of G-proteins and second messengers in generating an action potential.
Identify different types of olfactory disorders such as anosmia, hyposmia, hyperosmia, and dysosmia, including their potential causes.
Key Topics:
Olfactory Genes:
3% of the human genome accounts for olfactory genes.
400 genes for odorant receptors.
Olfactory Membrane:
Located in the superior part of the nasal cavity.
Medially: Folds downward along the superior septum.
Laterally: Folds over the superior turbinate and upper surface of the middle turbinate.
Total surface area: 5-10 square centimeters.
Olfactory Mucosa:
Olfactory Cells: Bipolar nerve cells derived from the CNS (100 million), with 4-25 olfactory cilia per cell.
Sustentacular Cells: Produce mucus and maintain ionic and molecular environment.
Basal Cells: Replace worn-out olfactory cells with an average lifespan of 1-2 months.
Bowman’s Gland: Secretes mucus.
Stimulation of Olfactory Cells:
Odorant dissolves in mucus and attaches to receptors on olfactory cilia.
Involves a cascade effect through G-proteins and second messengers, leading to depolarization and action potential generation in the olfactory nerve.
Quality of a Good Odorant:
Small (3-20 Carbon atoms), volatile, water-soluble, and lipid-soluble.
Facilitated by odorant-binding proteins in mucus.
Membrane Potential and Action Potential:
Resting membrane potential: -55mV.
Action potential frequency in the olfactory nerve increases with odorant strength.
Adaptation Towards the Sense of Smell:
Rapid adaptation within the first second, with further slow adaptation.
Psychological adaptation greater than receptor adaptation, involving feedback inhibition from the central nervous system.
Primary Sensations of Smell:
Camphoraceous, Musky, Floral, Pepperminty, Ethereal, Pungent, Putrid.
Odor Detection Threshold:
Examples: Hydrogen sulfide (0.0005 ppm), Methyl-mercaptan (0.002 ppm).
Some toxic substances are odorless at lethal concentrations.
Characteristics of Smell:
Odor blindness for single substances due to lack of appropriate receptor protein.
Behavioral and emotional influences of smell.
Transmission of Olfactory Signals:
From olfactory cells to glomeruli in the olfactory bulb, involving lateral inhibition.
Primitive, less old, and new olfactory systems with different path
- Video recording of this lecture in English language: https://youtu.be/lK81BzxMqdo
- Video recording of this lecture in Arabic language: https://youtu.be/Ve4P0COk9OI
- Link to download the book free: https://nephrotube.blogspot.com/p/nephrotube-nephrology-books.html
- Link to NephroTube website: www.NephroTube.com
- Link to NephroTube social media accounts: https://nephrotube.blogspot.com/p/join-nephrotube-on-social-media.html
TEST BANK for Operations Management, 14th Edition by William J. Stevenson, Ve...kevinkariuki227
TEST BANK for Operations Management, 14th Edition by William J. Stevenson, Verified Chapters 1 - 19, Complete Newest Version.pdf
Pulmonary Thromboembolism - etilogy, types, medical- Surgical and nursing man...VarunMahajani
Disruption of blood supply to lung alveoli due to blockage of one or more pulmonary blood vessels is called as Pulmonary thromboembolism. In this presentation we will discuss its causes, types and its management in depth.
Explore natural remedies for syphilis treatment in Singapore. Discover alternative therapies, herbal remedies, and lifestyle changes that may complement conventional treatments. Learn about holistic approaches to managing syphilis symptoms and supporting overall health.
The prostate is an exocrine gland of the male mammalian reproductive system
It is a walnut-sized gland that forms part of the male reproductive system and is located in front of the rectum and just below the urinary bladder
Function is to store and secrete a clear, slightly alkaline fluid that constitutes 10-30% of the volume of the seminal fluid that along with the spermatozoa, constitutes semen
A healthy human prostate measures (4cm-vertical, by 3cm-horizontal, 2cm ant-post ).
It surrounds the urethra just below the urinary bladder. It has anterior, median, posterior and two lateral lobes
It’s work is regulated by androgens which are responsible for male sex characteristics
Generalised disease of the prostate due to hormonal derangement which leads to non malignant enlargement of the gland (increase in the number of epithelial cells and stromal tissue)to cause compression of the urethra leading to symptoms (LUTS
Ethanol (CH3CH2OH), or beverage alcohol, is a two-carbon alcohol
that is rapidly distributed in the body and brain. Ethanol alters many
neurochemical systems and has rewarding and addictive properties. It
is the oldest recreational drug and likely contributes to more morbidity,
mortality, and public health costs than all illicit drugs combined. The
5th edition of the Diagnostic and Statistical Manual of Mental Disorders
(DSM-5) integrates alcohol abuse and alcohol dependence into a single
disorder called alcohol use disorder (AUD), with mild, moderate,
and severe subclassifications (American Psychiatric Association, 2013).
In the DSM-5, all types of substance abuse and dependence have been
combined into a single substance use disorder (SUD) on a continuum
from mild to severe. A diagnosis of AUD requires that at least two of
the 11 DSM-5 behaviors be present within a 12-month period (mild
AUD: 2–3 criteria; moderate AUD: 4–5 criteria; severe AUD: 6–11 criteria).
The four main behavioral effects of AUD are impaired control over
drinking, negative social consequences, risky use, and altered physiological
effects (tolerance, withdrawal). This chapter presents an overview
of the prevalence and harmful consequences of AUD in the U.S.,
the systemic nature of the disease, neurocircuitry and stages of AUD,
comorbidities, fetal alcohol spectrum disorders, genetic risk factors, and
pharmacotherapies for AUD.
New Drug Discovery and Development .....NEHA GUPTA
The "New Drug Discovery and Development" process involves the identification, design, testing, and manufacturing of novel pharmaceutical compounds with the aim of introducing new and improved treatments for various medical conditions. This comprehensive endeavor encompasses various stages, including target identification, preclinical studies, clinical trials, regulatory approval, and post-market surveillance. It involves multidisciplinary collaboration among scientists, researchers, clinicians, regulatory experts, and pharmaceutical companies to bring innovative therapies to market and address unmet medical needs.
micro teaching on communication m.sc nursing.pdfAnurag Sharma
Microteaching is a unique model of practice teaching. It is a viable instrument for the. desired change in the teaching behavior or the behavior potential which, in specified types of real. classroom situations, tends to facilitate the achievement of specified types of objectives.
Ozempic: Preoperative Management of Patients on GLP-1 Receptor Agonists Saeid Safari
Preoperative Management of Patients on GLP-1 Receptor Agonists like Ozempic and Semiglutide
ASA GUIDELINE
NYSORA Guideline
2 Case Reports of Gastric Ultrasound
2. Learning objectives
• At the end of this lecture you sh be able
• List the various tools used for measurement
• List the various measures of death
• List the various measures of disease
2
4. Measurements used in epidemiology
• Measurement of mortality
• Measurement of morbidity
• Measurement of disability
• Measurement of natality
• Measurement of disease attributes
• Measurement of health care services
• Measurement of the risk factors
• Measurement of demographic variables
4
10. Proportion – ‘real’ example
• What proportion of the population is
suffering from diabetes?
10
11. Rate
Contains
• Numerator (which is part of denominator)
• Denominator
• Multiplier
• Time period
• Usually expressed per 100 / per 1000 population
• It has a time dimension, whereas a PROPORTION
does not
11
26. Specific death rate
• Cause specific
– Deaths due to cholera
• Age specific
– Infant deaths
• Sex specific
– Maternal deaths
• Time specific
– Weekly deaths
26
48. Crude rates
Madurai Population Deaths Death rate
per 1000
0-64 53,500 446 8.3
Chennai Population Deaths Death rate
per 1000
0-64 92,000 850 9.2
48
49. Age specific rates
Madurai Population Deaths Death rate
per 1000
0-24 21,500 123 5.7
25-64 32,000 323 10.0
Chennai Population Deaths Death rate
per 1000
0-24 32,000 150 4.6
25-64 60,000 700 11.6
49
51. Standardization for Madurai
Standard Population Madurai
rates
Expected
deaths
0-24 156,000 5.7 889
25-64 45,000 10.0 450
Total 201,000 1,339
Age Population Total deaths Standardized
crude rate
0-64 201,000 1,339 6.6
∂
∂ ∂ ∂
51
52. Standardization for Chennai
Standard Population Chennai
rates
Expected
deaths
0-24 156,000 4.6 718
25-64 45,000 11.6 522
Total 201,000 1,240
Age Population Total deaths Standardized
crude rate
0-64 201,000 1,240 6.1
∂
∂ ∂ ∂
52
53. Standardized rates
Madurai Population Deaths CDR per
1000
Std. DR
per 1000
0-64 53,500 446 8.3 6.6
Chennai Population Deaths CDR per
1000
Std. DR
per 1000
0-64 92,000 850 9.2 6.1
53
56. Standardized mortality ratio
Age Doctor
population
Observed
deaths
25-34 300 *
35-44 400 *
45-54 200 *
55-64 100 *
Total 1000 9.0
Crude death rate for doctors is 9.0 per 1000
56
57. Standardized mortality ratio
Age National
rate
Doctor
population
Observed
deaths
Expected
deaths
25-34 3 300 * 0.9
35-44 5 400 * 2.0
45-54 8 200 * 1.6
55-64 25 100 * 2.5
Total 1000 9.0 7.0
57
58. Standardized mortality ratio
SMR =
Observed deaths
Expected deaths
X 100
SMR = 9/7 X 100 = 129
It means doctors experience 29% more
mortality than the general population
58
59. Summary
• There are various measures of mortality
• Each one has its own purpose and
disadvantages
• Standardization is a method for making rates
comparable between regions
59
61. Measurement of morbidity
• Incidence
– Occurrence of new cases
• Prevalence
– Existence of new and old cases
• Incidence – how many people with the disease
are newly diagnosed each year (like video)
• Prevalence - how many people in a population
currently have the disease (like snapshot)
61
62. Incidence (நடக்குறது)
62
=
No. of 𝐍𝐄𝐖 cases of a disease
in a particular time period
Total population at risk during
the same time period
X 1000
68. Points to remember about incidence
• Refers only to new cases
• Not influenced by duration of disease
• Refers to a particular time period
• Denominator is people at risk
68
69. Prevalence (இருக்குறது)
=
No.of 𝐎𝐋𝐃 𝐚𝐧𝐝 𝐍𝐄𝐖 cases of a disease
in a particular time point/period
Total population at risk during
the same time period
X 1000
69
73. Prevalence increases
• Longer duration of disease
• Prolongation of life with treatment
• Increase in incidence
• Immigration of new cases
• Better reporting of cases
• Emigration of healthy people
73
74. Prevalence decreases
• Shorter duration of diseases
• Improved cure rate
• Decrease in incidence
• Emigration of new cases
• Under reporting of cases
• Immigration of healthy people
74
75. Uses of prevalence
• Magnitude of disease problems
• Identify potential high-risk populations
• Administrative and planning purposes, e.g.,
hospital beds, manpower needs, rehabilitation
facilities
75
78. Points to remember about prevalence
• Refers to new and old cases
• Influenced by duration of disease
• Refers to a particular time period
• Denominator is people at risk
78
80. Relation between incidence &
prevalence
• Prevalence = Incidence X duration
• Incidence = 10 cases/1000 population/year
• Mean duration of disease = 5 years
• Prevalence = 10 x 5 = 50 per 1000 population
80
81. Summary
• Incidence and prevalence are finer
measurements of health as compared to
death rates
• They help us to measure the effectiveness of
disease control measures
81
82. Take home messages
• Proportion, rate and ratio – basic tools
• CDR is a simple measure of death/health
• Standardization is needed for comparability
• Incidence reflects new cases only
• Prevalence reflects new and old cases
• Incidence and prevalence are related
• Mortality measures are important, morbidity
measures give a better idea of health
82
83. Review 1
• It was reported that the incidence of dengue
was increasing every year in Madurai. This
could mean all EXCEPT,
a) Control of mosquitoes has failed
b) Reporting of dengue cases has improved
c) Treatment for dengue has failed
d) Public awareness on dengue has increased
83
84. Review 2
• Prevalence of Diabetes is increasing every year in
India. This could mean all EXCEPT,
a) Incidence of DM is increasing
b) Reporting of diabetes has increased
c) Diabetic patients are surviving longer due to
better treatment
d) Public awareness on diabetes has increased
e) None of the above
84
85. Review 3
• Examples of a disease with high incidence but
low prevalence include (multiple options)
a) Acute respiratory infection
b) Acute diarrhoea
c) TB
d) Leprosy
85
86. Review 4
• Examples of a disease with low incidence but
high prevalence include (multiple options)
a) Acute respiratory infection
b) Acute diarrhoea
c) TB
d) Leprosy
86
87. Review 5
• A new diabetes control programme was
introduced in Madurai. After 1 year, the
incidence and prevalence of Diabetes
increased. This means
a) The programme did not work
b) The programme worked
c) Data not sufficient
87
88. Review 6
• Disadvantages of crude death rate include
(multiple options)
a) Simple measure
b) Influenced by the age composition
c) Not comparable between countries
d) All of the above
88
89. Review 7
• Proportional mortality is useful for all EXCEPT
a) Understanding relative importance of diseases
as a cause of death
b) Determining measures for reducing preventable
mortality
c) Indicating the risk for population from dying due
to a particular cause
d) All of the above
89
90. Review 8
• Standardized rates can be calculated for
a) Age
b) Sex
c) Race
d) Literacy rate
e) All the above
90
91. Review 9
• Standardized mortality ratio requires all
EXCEPT
a) Age specific denom. for interest pop.
b) Age specific death rates for standard pop.
c) Age specific death rates for interest pop.
d) Crude death rate in interest pop.
91
92. Review 10
• A patient with Atherosclerotic heart disease for 7
years developed Acute myocardial infarction last
week and died today as a result of myocardial
rupture. What is the immediate cause of death?
a) Acute myocardial infarction
b) Atherosclerotic heart disease
c) Cardiac arrest
d) Rupture of myocardium
92
93. Review 11
• Mid year population is not the denominator
for (multiple options)
a) Age specific death rate
b) Cause specific death rate
c) Crude death rate
d) Proportional mortality rate
e) Case fatality rate
93
94. THANK YOU
You can find this presentation on
Email your queries to sarizwan1986@outlook.com