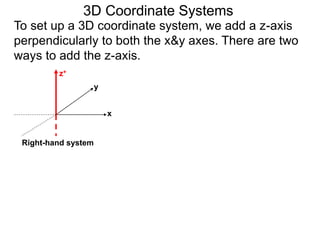
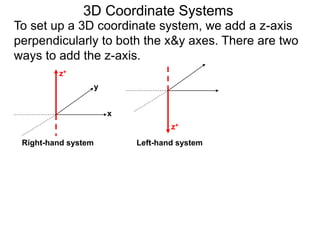
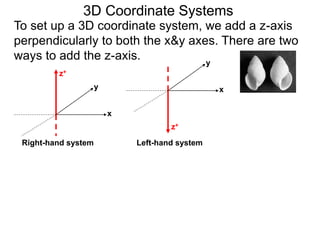
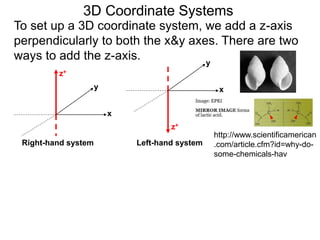
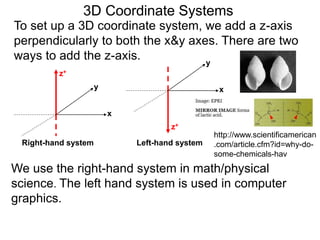
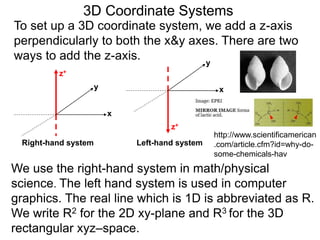
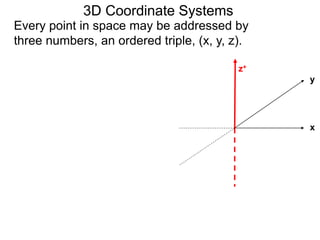
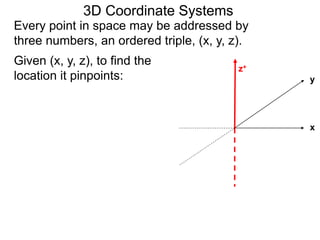
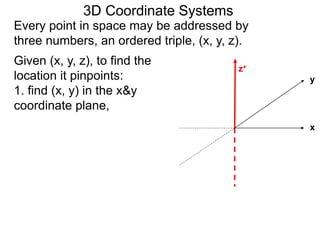
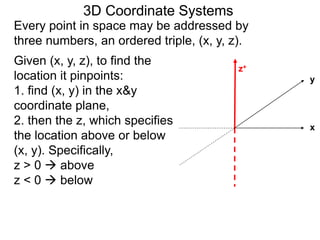
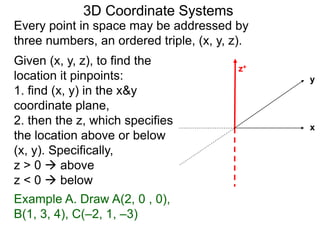
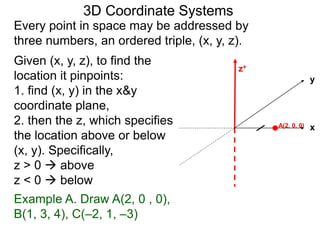
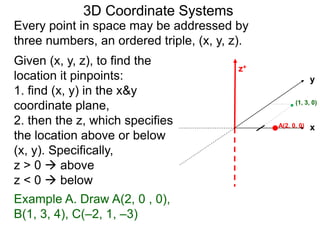
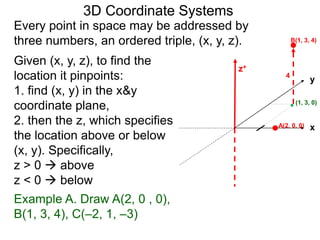
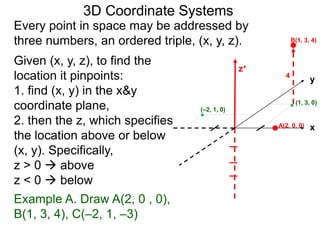
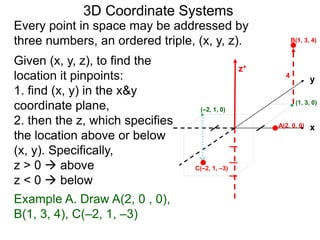
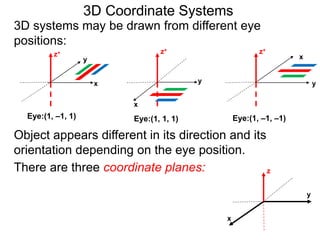
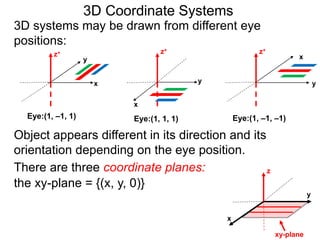
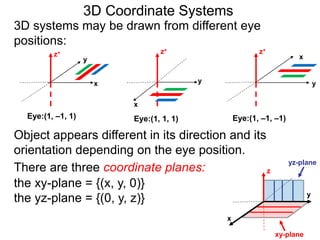
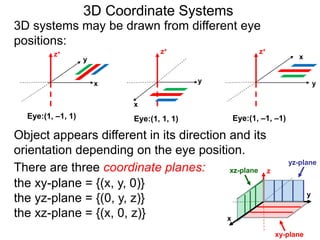
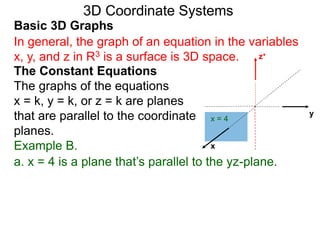
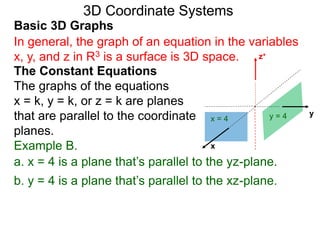
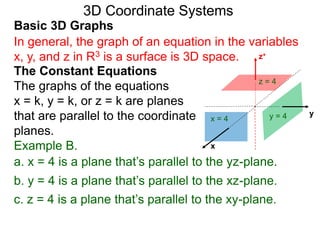
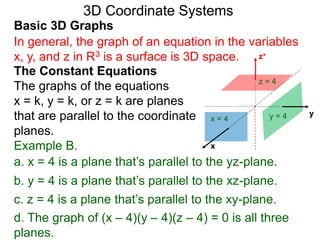
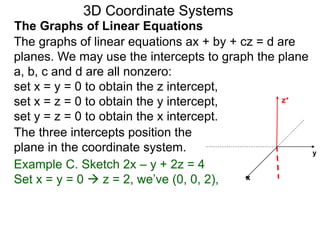
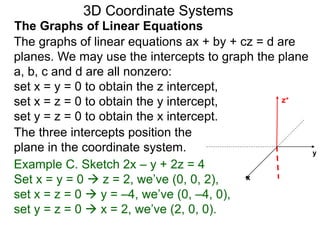
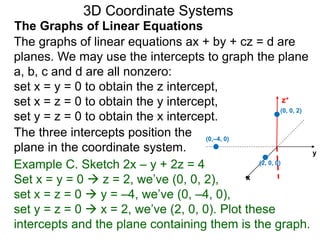
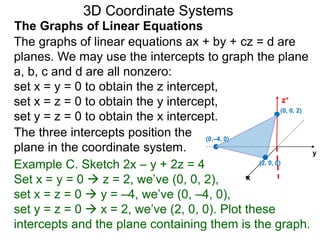
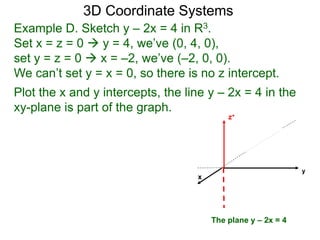
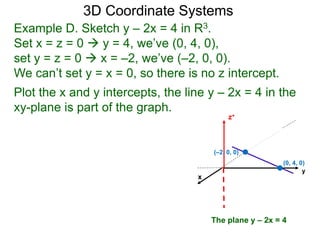
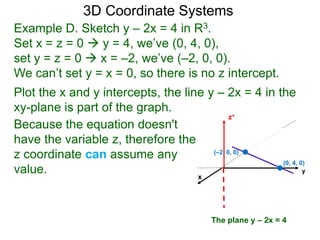
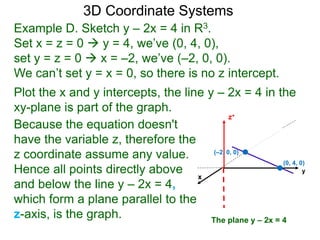
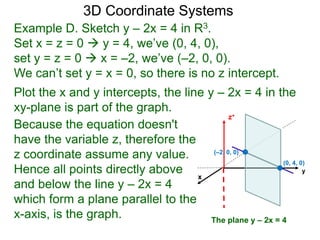
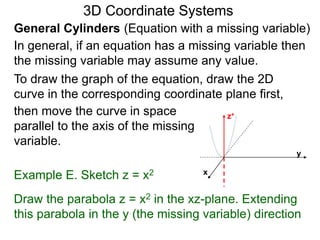
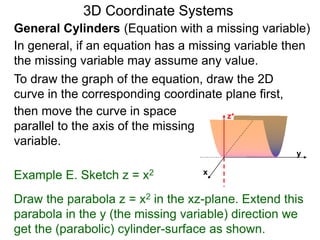
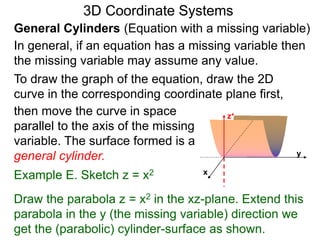
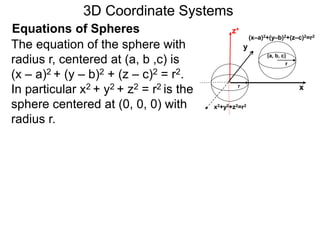
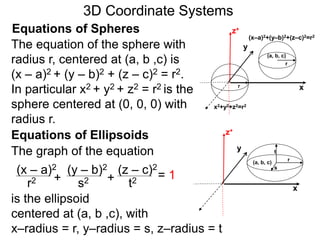
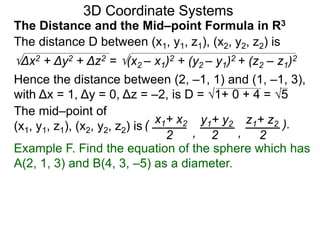
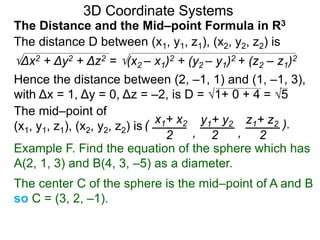
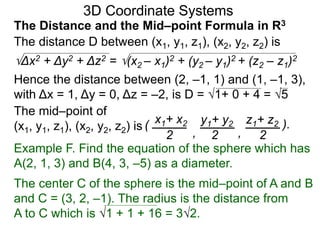
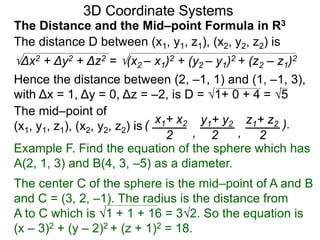
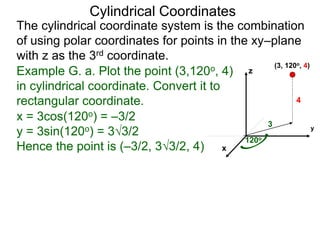
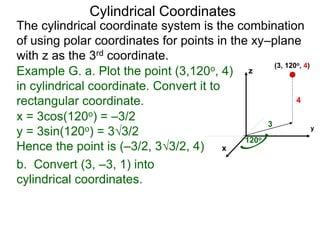
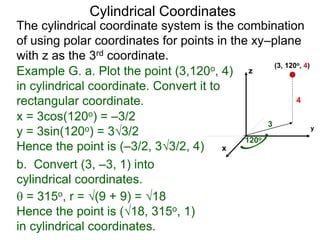
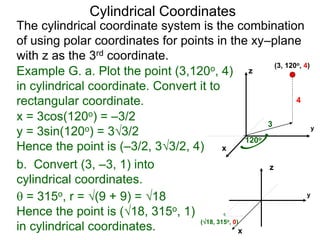
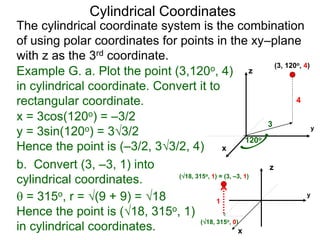
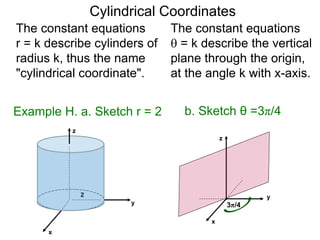
3D Coordinate Systems
To set up a 3D coordinate system, we add a z-axis
perpendicularly to both the x&y axes.
3D Coordinate Systems
To set up a 3D coordinate system, we add a z-axis
perpendicularly to both the x&y axes. There are two
ways to add the z-axis.
3D Coordinate Systems
To set up a 3D coordinate system, we add a z-axis
perpendicularly to both the x&y axes. There are two
ways to add the z-axis.
x
y
z+
Right-hand system
3D Coordinate Systems
To set up a 3D coordinate system, we add a z-axis
perpendicularly to both the x&y axes. There are two
ways to add the z-axis.
x
y
z+
z+
Right-hand system Left-hand system
3D Coordinate Systems
To set up a 3D coordinate system, we add a z-axis
perpendicularly to both the x&y axes. There are two
ways to add the z-axis.
x
y
z+
x
y
z+
Right-hand system Left-hand system
3D Coordinate Systems
To set up a 3D coordinate system, we add a z-axis
perpendicularly to both the x&y axes. There are two
ways to add the z-axis.
x
y
z+
x
y
z+
Right-hand system Left-hand system
http://www.scientificamerican
.com/article.cfm?id=why-do-
some-chemicals-hav
3D Coordinate Systems
We use the right-hand system in math/physical
science. The left hand system is used in computer
graphics.
To set up a 3D coordinate system, we add a z-axis
perpendicularly to both the x&y axes. There are two
ways to add the z-axis.
x
y
z+
x
y
z+
Right-hand system Left-hand system
http://www.scientificamerican
.com/article.cfm?id=why-do-
some-chemicals-hav
3D Coordinate Systems
We use the right-hand system in math/physical
science. The left hand system is used in computer
graphics. The real line which is 1D is abbreviated as R.
We write R2 for the 2D xy-plane and R3 for the 3D
rectangular xyz–space.
To set up a 3D coordinate system, we add a z-axis
perpendicularly to both the x&y axes. There are two
ways to add the z-axis.
x
y
z+
x
y
z+
Right-hand system Left-hand system
http://www.scientificamerican
.com/article.cfm?id=why-do-
some-chemicals-hav
Every point in space may be addressed by
three numbers, an ordered triple, (x, y, z).
3D Coordinate Systems
y
z+
x
Every point in space may be addressed by
three numbers, an ordered triple, (x, y, z).
Given (x, y, z), to find the
location it pinpoints:
3D Coordinate Systems
y
z+
x
Every point in space may be addressed by
three numbers, an ordered triple, (x, y, z).
Given (x, y, z), to find the
location it pinpoints:
1. find (x, y) in the x&y
coordinate plane,
3D Coordinate Systems
y
z+
x
Every point in space may be addressed by
three numbers, an ordered triple, (x, y, z).
Given (x, y, z), to find the
location it pinpoints:
1. find (x, y) in the x&y
coordinate plane,
2. then the z, which specifies
the location above or below
(x, y). Specifically,
z > 0  above
z < 0  below
Example A. Draw A(2, 0 , 0),
B(1, 3, 4), C(–2, 1, –3)
3D Coordinate Systems
y
z+
x
y
z+
Example A. Draw A(2, 0 , 0),
B(1, 3, 4), C(–2, 1, –3)
3D Coordinate Systems
xA(2, 0, 0)
Given (x, y, z), to find the
location it pinpoints:
1. find (x, y) in the x&y
coordinate plane,
2. then the z, which specifies
the location above or below
(x, y). Specifically,
z > 0  above
z < 0  below
Every point in space may be addressed by
three numbers, an ordered triple, (x, y, z).
y
z+
Example A. Draw A(2, 0 , 0),
B(1, 3, 4), C(–2, 1, –3)
3D Coordinate Systems
xA(2, 0, 0)
(1, 3, 0)
B(1, 3, 4)
4
Given (x, y, z), to find the
location it pinpoints:
1. find (x, y) in the x&y
coordinate plane,
2. then the z, which specifies
the location above or below
(x, y). Specifically,
z > 0  above
z < 0  below
Every point in space may be addressed by
three numbers, an ordered triple, (x, y, z).
y
z+
Example A. Draw A(2, 0 , 0),
B(1, 3, 4), C(–2, 1, –3)
3D Coordinate Systems
xA(2, 0, 0)
(–2, 1, 0)
4
Given (x, y, z), to find the
location it pinpoints:
1. find (x, y) in the x&y
coordinate plane,
2. then the z, which specifies
the location above or below
(x, y). Specifically,
z > 0  above
z < 0  below
Every point in space may be addressed by
three numbers, an ordered triple, (x, y, z).
(1, 3, 0)
B(1, 3, 4)
y
z+
Example A. Draw A(2, 0 , 0),
B(1, 3, 4), C(–2, 1, –3)
3D Coordinate Systems
xA(2, 0, 0)
(–2, 1, 0)
4
C(–2, 1, –3)
Given (x, y, z), to find the
location it pinpoints:
1. find (x, y) in the x&y
coordinate plane,
2. then the z, which specifies
the location above or below
(x, y). Specifically,
z > 0  above
z < 0  below
Every point in space may be addressed by
three numbers, an ordered triple, (x, y, z).
(1, 3, 0)
B(1, 3, 4)
3D systems may be drawn from different eye
positions:
3D Coordinate Systems
3D systems may be drawn from different eye
positions:
x
y
z+
Eye:(1, –1, 1)
3D Coordinate Systems
Object appears different in its direction and its
orientation depending on the eye position.
3D systems may be drawn from different eye
positions:
x
y
z+
x
y
z+
Eye:(1, –1, 1) Eye:(1, 1, 1)
3D Coordinate Systems
Object appears different in its direction and its
orientation depending on the eye position.
3D systems may be drawn from different eye
positions:
x
y
z+
x
y
z+
x
y
z+
Eye:(1, –1, 1) Eye:(1, 1, 1) Eye:(1, –1, –1)
3D Coordinate Systems
Object appears different in its direction and its
orientation depending on the eye position.
3D systems may be drawn from different eye
positions:
x
y
z+
x
y
z+
x
y
z+
Eye:(1, –1, 1) Eye:(1, 1, 1) Eye:(1, –1, –1)
x
y
z
3D Coordinate Systems
There are three coordinate planes:
Object appears different in its direction and its
orientation depending on the eye position.
3D systems may be drawn from different eye
positions:
x
y
z+
x
y
z+
x
y
z+
Eye:(1, –1, 1) Eye:(1, 1, 1) Eye:(1, –1, –1)
the xy-plane = {(x, y, 0)}
x
y
z
xy-plane
3D Coordinate Systems
There are three coordinate planes:
Object appears different in its direction and its
orientation depending on the eye position.
3D systems may be drawn from different eye
positions:
x
y
z+
x
y
z+
x
y
z+
Eye:(1, –1, 1) Eye:(1, 1, 1) Eye:(1, –1, –1)
the xy-plane = {(x, y, 0)}
the yz-plane = {(0, y, z)}
x
y
z
xy-plane
yz-plane
3D Coordinate Systems
There are three coordinate planes:
Object appears different in its direction and its
orientation depending on the eye position.
3D systems may be drawn from different eye
positions:
x
y
z+
x
y
z+
x
y
z+
Eye:(1, –1, 1) Eye:(1, 1, 1) Eye:(1, –1, –1)
the xy-plane = {(x, y, 0)}
the yz-plane = {(0, y, z)}
the xz-plane = {(x, 0, z)} x
y
z
xy-plane
xz-plane
3D Coordinate Systems
There are three coordinate planes:
Object appears different in its direction and its
orientation depending on the eye position.
yz-plane
Basic 3D Graphs
3D Coordinate Systems
Basic 3D Graphs
3D Coordinate Systems
In general, the graph of an equation in the variables
x, y, and z in R3 is a surface is 3D space.
Basic 3D Graphs
The Constant Equations
3D Coordinate Systems
In general, the graph of an equation in the variables
x, y, and z in R3 is a surface is 3D space.
Basic 3D Graphs
The Constant Equations
The graphs of the equations
x = k, y = k, or z = k are planes
that are parallel to the coordinate
planes.
3D Coordinate Systems
In general, the graph of an equation in the variables
x, y, and z in R3 is a surface is 3D space.
Basic 3D Graphs
The Constant Equations
The graphs of the equations
x = k, y = k, or z = k are planes
that are parallel to the coordinate
planes.
3D Coordinate Systems
In general, the graph of an equation in the variables
x, y, and z in R3 is a surface is 3D space.
x
z+
a. x = 4 is a plane that’s parallel to the yz-plane.
x = 4
y
Basic 3D Graphs
The Constant Equations
The graphs of the equations
x = k, y = k, or z = k are planes
that are parallel to the coordinate
planes.
3D Coordinate Systems
In general, the graph of an equation in the variables
x, y, and z in R3 is a surface is 3D space.
Example B.
x
z+
a. x = 4 is a plane that’s parallel to the yz-plane.
x = 4
b. y = 4 is a plane that’s parallel to the xz-plane.
yy = 4
c. z = 4 is a plane that’s parallel to the xy-plane.
z = 4
Basic 3D Graphs
The Constant Equations
The graphs of the equations
x = k, y = k, or z = k are planes
that are parallel to the coordinate
planes.
3D Coordinate Systems
In general, the graph of an equation in the variables
x, y, and z in R3 is a surface is 3D space.
Example B.
d. The graph of (x – 4)(y – 4)(z – 4) = 0 is all three
planes.
3D Coordinate Systems
The Graphs of Linear Equations
The graphs of linear equations ax + by + cz = d are
planes.
3D Coordinate Systems
The Graphs of Linear Equations
The graphs of linear equations ax + by + cz = d are
planes. We may use the intercepts to graph the plane.
a, b, c and d are all nonzero:
3D Coordinate Systems
The Graphs of Linear Equations
The graphs of linear equations ax + by + cz = d are
planes. We may use the intercepts to graph the plane
a, b, c and d are all nonzero:
set x = y = 0 to obtain the z intercept,
set x = z = 0 to obtain the y intercept,
set y = z = 0 to obtain the x intercept.
3D Coordinate Systems
The Graphs of Linear Equations
The three intercepts position the
plane in the coordinate system.
The graphs of linear equations ax + by + cz = d are
planes. We may use the intercepts to graph the plane
a, b, c and d are all nonzero:
set x = y = 0 to obtain the z intercept,
set x = z = 0 to obtain the y intercept,
set y = z = 0 to obtain the x intercept.
Example C. Sketch 2x – y + 2z = 4.
3D Coordinate Systems
The Graphs of Linear Equations
The three intercepts position the
plane in the coordinate system.
x
z+
The graphs of linear equations ax + by + cz = d are
planes. We may use the intercepts to graph the plane
a, b, c and d are all nonzero:
set x = y = 0 to obtain the z intercept,
set x = z = 0 to obtain the y intercept,
set y = z = 0 to obtain the x intercept.
Example C. Sketch 2x – y + 2z = 4
Set x = y = 0  z = 2, we’ve (0, 0, 2),
y
3D Coordinate Systems
The Graphs of Linear Equations
The three intercepts position the
plane in the coordinate system.
x
z+
The graphs of linear equations ax + by + cz = d are
planes. We may use the intercepts to graph the plane
a, b, c and d are all nonzero:
set x = y = 0 to obtain the z intercept,
set x = z = 0 to obtain the y intercept,
set y = z = 0 to obtain the x intercept.
Example C. Sketch 2x – y + 2z = 4
Set x = y = 0  z = 2, we’ve (0, 0, 2),
set x = z = 0  y = –4, we’ve (0, –4, 0),
set y = z = 0  x = 2, we’ve (2, 0, 0).
y
3D Coordinate Systems
The Graphs of Linear Equations
The three intercepts position the
plane in the coordinate system.
x
z+
The graphs of linear equations ax + by + cz = d are
planes. We may use the intercepts to graph the plane
a, b, c and d are all nonzero:
set x = y = 0 to obtain the z intercept,
set x = z = 0 to obtain the y intercept,
set y = z = 0 to obtain the x intercept.
Example C. Sketch 2x – y + 2z = 4
Set x = y = 0  z = 2, we’ve (0, 0, 2),
set x = z = 0  y = –4, we’ve (0, –4, 0),
set y = z = 0  x = 2, we’ve (2, 0, 0). Plot these
intercepts and the plane containing them is the graph.
y
3D Coordinate Systems
The Graphs of Linear Equations
The three intercepts position the
plane in the coordinate system.
(0,–4, 0)
(2, 0, 0)
(0, 0, 2)
x
z+
The graphs of linear equations ax + by + cz = d are
planes. We may use the intercepts to graph the plane
a, b, c and d are all nonzero:
set x = y = 0 to obtain the z intercept,
set x = z = 0 to obtain the y intercept,
set y = z = 0 to obtain the x intercept.
Example C. Sketch 2x – y + 2z = 4
Set x = y = 0  z = 2, we’ve (0, 0, 2),
set x = z = 0  y = –4, we’ve (0, –4, 0),
set y = z = 0  x = 2, we’ve (2, 0, 0). Plot these
intercepts and the plane containing them is the graph.
y
3D Coordinate Systems
The Graphs of Linear Equations
The three intercepts position the
plane in the coordinate system.
(0, 0, 2)
(0,–4, 0)
(2, 0, 0)
Example D. Sketch y – 2x = 4 in R3.
3D Coordinate Systems
Example D. Sketch y – 2x = 4 in R3.
Set x = z = 0  y = 4, we’ve (0, 4, 0),
set y = z = 0  x = –2, we’ve (–2, 0, 0).
3D Coordinate Systems
Example D. Sketch y – 2x = 4 in R3.
Set x = z = 0  y = 4, we’ve (0, 4, 0),
set y = z = 0  x = –2, we’ve (–2, 0, 0).
We can’t set y = x = 0, so there is no z intercept.
3D Coordinate Systems
Example D. Sketch y – 2x = 4 in R3.
Set x = z = 0  y = 4, we’ve (0, 4, 0),
set y = z = 0  x = –2, we’ve (–2, 0, 0).
We can’t set y = x = 0, so there is no z intercept.
Plot the x and y intercepts, the line y – 2x = 4 in the
xy-plane is part of the graph.
3D Coordinate Systems
x
z+
Example D. Sketch y – 2x = 4 in R3.
Set x = z = 0  y = 4, we’ve (0, 4, 0),
set y = z = 0  x = –2, we’ve (–2, 0, 0).
We can’t set y = x = 0, so there is no z intercept.
Plot the x and y intercepts, the line y – 2x = 4 in the
xy-plane is part of the graph.
3D Coordinate Systems
The plane y – 2x = 4
y
(0, 4, 0)
(–2, 0, 0)
x
z+
Example D. Sketch y – 2x = 4 in R3.
Set x = z = 0  y = 4, we’ve (0, 4, 0),
set y = z = 0  x = –2, we’ve (–2, 0, 0).
We can’t set y = x = 0, so there is no z intercept.
Because the equation doesn't
have the variable z, therefore the
z coordinate can assume any
value.
Plot the x and y intercepts, the line y – 2x = 4 in the
xy-plane is part of the graph.
3D Coordinate Systems
The plane y – 2x = 4
y
(0, 4, 0)
(–2, 0, 0)
x
z+
Example D. Sketch y – 2x = 4 in R3.
Set x = z = 0  y = 4, we’ve (0, 4, 0),
set y = z = 0  x = –2, we’ve (–2, 0, 0).
We can’t set y = x = 0, so there is no z intercept.
Because the equation doesn't
have the variable z, therefore the
z coordinate assume any value.
Hence all points directly above
and below the line y – 2x = 4,
which form a plane parallel to the
z-axis, is the graph.
Plot the x and y intercepts, the line y – 2x = 4 in the
xy-plane is part of the graph.
3D Coordinate Systems
The plane y – 2x = 4
y
(0, 4, 0)
(–2, 0, 0)
x
z+
Example D. Sketch y – 2x = 4 in R3.
Set x = z = 0  y = 4, we’ve (0, 4, 0),
set y = z = 0  x = –2, we’ve (–2, 0, 0).
We can’t set y = x = 0, so there is no z intercept.
Because the equation doesn't
have the variable z, therefore the
z coordinate assume any value.
Hence all points directly above
and below the line y – 2x = 4
which form a plane parallel to the
x-axis, is the graph.
Plot the x and y intercepts, the line y – 2x = 4 in the
xy-plane is part of the graph.
3D Coordinate Systems
(–2, 0, 0)
(0, 4, 0)
The plane y – 2x = 4
y
General Cylinders (Equation with a missing variable)
3D Coordinate Systems
General Cylinders (Equation with a missing variable)
3D Coordinate Systems
In general, if an equation has a missing variable then
the missing variable may assume any value.
Example E. Sketch z = x2
General Cylinders (Equation with a missing variable)
3D Coordinate Systems
In general, if an equation has a missing variable then
the missing variable may assume any value.
Example E. Sketch z = x2
General Cylinders (Equation with a missing variable)
3D Coordinate Systems
In general, if an equation has a missing variable then
the missing variable may assume any value.
To draw the graph of the equation, draw the 2D
curve in the corresponding coordinate plane first,
Example E. Sketch z = x2
General Cylinders (Equation with a missing variable)
3D Coordinate Systems
Draw the parabola z = x2 in the xz-plane.
In general, if an equation has a missing variable then
the missing variable may assume any value.
To draw the graph of the equation, draw the 2D
curve in the corresponding coordinate plane first,
z+
x
y
Example E. Sketch z = x2
General Cylinders (Equation with a missing variable)
then move the curve in space
parallel to the axis of the missing
variable.
3D Coordinate Systems
Draw the parabola z = x2 in the xz-plane. Extending
this parabola in the y (the missing variable) direction
In general, if an equation has a missing variable then
the missing variable may assume any value.
To draw the graph of the equation, draw the 2D
curve in the corresponding coordinate plane first,
z+
x
y
Example E. Sketch z = x2
General Cylinders (Equation with a missing variable)
then move the curve in space
parallel to the axis of the missing
variable.
3D Coordinate Systems
Draw the parabola z = x2 in the xz-plane. Extend this
parabola in the y (the missing variable) direction we
get the (parabolic) cylinder-surface as shown.
In general, if an equation has a missing variable then
the missing variable may assume any value.
x
z+
y
To draw the graph of the equation, draw the 2D
curve in the corresponding coordinate plane first,
Example E. Sketch z = x2
General Cylinders (Equation with a missing variable)
then move the curve in space
parallel to the axis of the missing
variable. The surface formed is a
general cylinder.
3D Coordinate Systems
Draw the parabola z = x2 in the xz-plane. Extend this
parabola in the y (the missing variable) direction we
get the (parabolic) cylinder-surface as shown.
In general, if an equation has a missing variable then
the missing variable may assume any value.
x
z+
y
To draw the graph of the equation, draw the 2D
curve in the corresponding coordinate plane first,
x
z+Equations of Spheres
yThe equation of the sphere with
radius r, centered at (a, b ,c) is
(x – a)2 + (y – b)2 + (z – c)2 = r2.
In particular x2 + y2 + z2 = r2 is the
sphere centered at (0, 0, 0) with
radius r.
(a, b, c)
r
r
(x–a)2+(y–b)2+(z–c)2=r2
x2+y2+z2=r2
3D Coordinate Systems
x
z+Equations of Spheres
yThe equation of the sphere with
radius r, centered at (a, b ,c) is
(x – a)2 + (y – b)2 + (z – c)2 = r2.
In particular x2 + y2 + z2 = r2 is the
sphere centered at (0, 0, 0) with
radius r.
(a, b, c)
r
r
(x–a)2+(y–b)2+(z–c)2=r2
x2+y2+z2=r2
Equations of Ellipsoids
The graph of the equation
is the ellipsoid
centered at (a, b ,c), with
x–radius = r, y–radius = s, z–radius = t
(x – a)2 (y – b)2 (z – c)2
r2 s2 t2
= 1++
x
z+
y
(a, b, c)
r
s
t
3D Coordinate Systems
The distance D between (x1, y1, z1), (x2, y2, z2) is
Δx2 + Δy2 + Δz2 = (x2 – x1)2 + (y2 – y1)2 + (z2 – z1)2
3D Coordinate Systems
The Distance and the Mid–point Formula in R3
The distance D between (x1, y1, z1), (x2, y2, z2) is
Δx2 + Δy2 + Δz2 = (x2 – x1)2 + (y2 – y1)2 + (z2 – z1)2
Hence the distance between (2, –1, 1) and (1, –1, 3),
with Δx = 1, Δy = 0, Δz = –2, is D = 1+ 0 + 4 = 5
3D Coordinate Systems
The Distance and the Mid–point Formula in R3
The distance D between (x1, y1, z1), (x2, y2, z2) is
Δx2 + Δy2 + Δz2 = (x2 – x1)2 + (y2 – y1)2 + (z2 – z1)2
Hence the distance between (2, –1, 1) and (1, –1, 3),
with Δx = 1, Δy = 0, Δz = –2, is D = 1+ 0 + 4 = 5
The mid–point of
(x1, y1, z1), (x2, y2, z2) is ( x1+ x2 y1+ y2 z1+ z2
2 2 2, ,
).
3D Coordinate Systems
The Distance and the Mid–point Formula in R3
Example F. Find the equation of the sphere which has
A(2, 1, 3) and B(4, 3, –5) as a diameter.
The center C of the sphere is the mid–point of A and B
so C = (3, 2, –1).
The distance D between (x1, y1, z1), (x2, y2, z2) is
Δx2 + Δy2 + Δz2 = (x2 – x1)2 + (y2 – y1)2 + (z2 – z1)2
Hence the distance between (2, –1, 1) and (1, –1, 3),
with Δx = 1, Δy = 0, Δz = –2, is D = 1+ 0 + 4 = 5
The mid–point of
(x1, y1, z1), (x2, y2, z2) is ( x1+ x2 y1+ y2 z1+ z2
2 2 2, ,
).
3D Coordinate Systems
The Distance and the Mid–point Formula in R3
Example F. Find the equation of the sphere which has
A(2, 1, 3) and B(4, 3, –5) as a diameter.
The center C of the sphere is the mid–point of A and B
and C = (3, 2, –1). The radius is the distance from
A to C which is 1 + 1 + 16 = 32.
The distance D between (x1, y1, z1), (x2, y2, z2) is
Δx2 + Δy2 + Δz2 = (x2 – x1)2 + (y2 – y1)2 + (z2 – z1)2
Hence the distance between (2, –1, 1) and (1, –1, 3),
with Δx = 1, Δy = 0, Δz = –2, is D = 1+ 0 + 4 = 5
The mid–point of
(x1, y1, z1), (x2, y2, z2) is ( x1+ x2 y1+ y2 z1+ z2
2 2 2, ,
).
3D Coordinate Systems
The Distance and the Mid–point Formula in R3
Example F. Find the equation of the sphere which has
A(2, 1, 3) and B(4, 3, –5) as a diameter.
The center C of the sphere is the mid–point of A and B
and C = (3, 2, –1). The radius is the distance from
A to C which is 1 + 1 + 16 = 32. So the equation is
(x – 3)2 + (y – 2)2 + (z + 1)2 = 18.
Cylindrical Coordinates
The cylindrical coordinate system is the combination
of using polar coordinates for points in the xy–plane
with z as the 3rd coordinate.
Example G. a. Plot the point (3,120o, 4)
in cylindrical coordinates. Convert it to
rectangular coordinates.
Cylindrical Coordinates
The cylindrical coordinate system is the combination
of using polar coordinates for points in the xy–plane
with z as the 3rd coordinate.
Example G. a. Plot the point (3,120o, 4)
in cylindrical coordinate. Convert it to
rectangular coordinate.
3
120o
x
y
z
Cylindrical Coordinates
The cylindrical coordinate system is the combination
of using polar coordinates for points in the xy–plane
with z as the 3rd coordinate.
Example G. a. Plot the point (3,120o, 4)
in cylindrical coordinate. Convert it to
rectangular coordinate.
3
120o
4
x
y
z
(3, 120o, 4)
Cylindrical Coordinates
The cylindrical coordinate system is the combination
of using polar coordinates for points in the xy–plane
with z as the 3rd coordinate.
Example G. a. Plot the point (3,120o, 4)
in cylindrical coordinate. Convert it to
rectangular coordinate.
3
120o
4
x
y
z
(3, 120o, 4)
x = 3cos(120o) = –3/2
y = 3sin(120o) = 33/2
Hence the point is (–3/2, 33/2, 4)
Cylindrical Coordinates
The cylindrical coordinate system is the combination
of using polar coordinates for points in the xy–plane
with z as the 3rd coordinate.
Example G. a. Plot the point (3,120o, 4)
in cylindrical coordinate. Convert it to
rectangular coordinate.
3
120o
4
x
y
z
(3, 120o, 4)
Cylindrical Coordinates
The cylindrical coordinate system is the combination
of using polar coordinates for points in the xy–plane
with z as the 3rd coordinate.
x = 3cos(120o) = –3/2
y = 3sin(120o) = 33/2
Hence the point is (–3/2, 33/2, 4)
b. Convert (3, –3, 1) into
cylindrical coordinates.
Example G. a. Plot the point (3,120o, 4)
in cylindrical coordinate. Convert it to
rectangular coordinate.
3
120o
4
x
y
z
(3, 120o, 4)
 = 315o, r = (9 + 9) = 18
Hence the point is (18, 315o, 1)
in cylindrical coordinates.
Cylindrical Coordinates
The cylindrical coordinate system is the combination
of using polar coordinates for points in the xy–plane
with z as the 3rd coordinate.
x = 3cos(120o) = –3/2
y = 3sin(120o) = 33/2
Hence the point is (–3/2, 33/2, 4)
b. Convert (3, –3, 1) into
cylindrical coordinates.
Example G. a. Plot the point (3,120o, 4)
in cylindrical coordinate. Convert it to
rectangular coordinate.
3
120o
4
x
y
z
(3, 120o, 4)
(18, 315o, 0)
x
y
Cylindrical Coordinates
z
The cylindrical coordinate system is the combination
of using polar coordinates for points in the xy–plane
with z as the 3rd coordinate.
b. Convert (3, –3, 1) into
cylindrical coordinates.
x = 3cos(120o) = –3/2
y = 3sin(120o) = 33/2
Hence the point is (–3/2, 33/2, 4)
 = 315o, r = (9 + 9) = 18
Hence the point is (18, 315o, 1)
in cylindrical coordinates.
Example G. a. Plot the point (3,120o, 4)
in cylindrical coordinate. Convert it to
rectangular coordinate.
3
120o
4
x
y
z
(3, 120o, 4)
(18, 315o, 0)
x
y
Cylindrical Coordinates
z
(18, 315o, 1) = (3, –3, 1)
1
The cylindrical coordinate system is the combination
of using polar coordinates for points in the xy–plane
with z as the 3rd coordinate.
b. Convert (3, –3, 1) into
cylindrical coordinates.
x = 3cos(120o) = –3/2
y = 3sin(120o) = 33/2
Hence the point is (–3/2, 33/2, 4)
 = 315o, r = (9 + 9) = 18
Hence the point is (18, 315o, 1)
in cylindrical coordinates.
Cylindrical Coordinates
The constant equations
r = k describe cylinders of
radius k, thus the name
"cylindrical coordinate".
The constant equations
r = k describe cylinders of
radius k, thus the name
"cylindrical coordinate".
Example H. a. Sketch r = 2
2
Cylindrical Coordinates
x
y
z
The constant equations
r = k describe cylinders of
radius k, thus the name
"cylindrical coordinate".
x
y
Example H. a. Sketch r = 2
2
The constant equations
 = k describe the vertical
planes through the origin,
at the angle k with x-axis.
b. Sketch θ =3π/4
3π/4
Cylindrical Coordinates
z
x
y
z
The constant equations
r = k describe cylinders of
radius k, thus the name
"cylindrical coordinate".
x
y
Example H. a. Sketch r = 2
2
The constant equations
 = k describe the vertical
plane through the origin,
at the angle k with x-axis.
b. Sketch θ =3π/4
3π/4
Cylindrical Coordinates
z
x
y
z

267 1 3 d coordinate system-n

  • 1.
  • 2.
    3D Coordinate Systems Toset up a 3D coordinate system, we add a z-axis perpendicularly to both the x&y axes.
  • 3.
    3D Coordinate Systems Toset up a 3D coordinate system, we add a z-axis perpendicularly to both the x&y axes. There are two ways to add the z-axis.
  • 4.
    3D Coordinate Systems Toset up a 3D coordinate system, we add a z-axis perpendicularly to both the x&y axes. There are two ways to add the z-axis. x y z+ Right-hand system
  • 5.
    3D Coordinate Systems Toset up a 3D coordinate system, we add a z-axis perpendicularly to both the x&y axes. There are two ways to add the z-axis. x y z+ z+ Right-hand system Left-hand system
  • 6.
    3D Coordinate Systems Toset up a 3D coordinate system, we add a z-axis perpendicularly to both the x&y axes. There are two ways to add the z-axis. x y z+ x y z+ Right-hand system Left-hand system
  • 7.
    3D Coordinate Systems Toset up a 3D coordinate system, we add a z-axis perpendicularly to both the x&y axes. There are two ways to add the z-axis. x y z+ x y z+ Right-hand system Left-hand system http://www.scientificamerican .com/article.cfm?id=why-do- some-chemicals-hav
  • 8.
    3D Coordinate Systems Weuse the right-hand system in math/physical science. The left hand system is used in computer graphics. To set up a 3D coordinate system, we add a z-axis perpendicularly to both the x&y axes. There are two ways to add the z-axis. x y z+ x y z+ Right-hand system Left-hand system http://www.scientificamerican .com/article.cfm?id=why-do- some-chemicals-hav
  • 9.
    3D Coordinate Systems Weuse the right-hand system in math/physical science. The left hand system is used in computer graphics. The real line which is 1D is abbreviated as R. We write R2 for the 2D xy-plane and R3 for the 3D rectangular xyz–space. To set up a 3D coordinate system, we add a z-axis perpendicularly to both the x&y axes. There are two ways to add the z-axis. x y z+ x y z+ Right-hand system Left-hand system http://www.scientificamerican .com/article.cfm?id=why-do- some-chemicals-hav
  • 10.
    Every point inspace may be addressed by three numbers, an ordered triple, (x, y, z). 3D Coordinate Systems y z+ x
  • 11.
    Every point inspace may be addressed by three numbers, an ordered triple, (x, y, z). Given (x, y, z), to find the location it pinpoints: 3D Coordinate Systems y z+ x
  • 12.
    Every point inspace may be addressed by three numbers, an ordered triple, (x, y, z). Given (x, y, z), to find the location it pinpoints: 1. find (x, y) in the x&y coordinate plane, 3D Coordinate Systems y z+ x
  • 13.
    Every point inspace may be addressed by three numbers, an ordered triple, (x, y, z). Given (x, y, z), to find the location it pinpoints: 1. find (x, y) in the x&y coordinate plane, 2. then the z, which specifies the location above or below (x, y). Specifically, z > 0  above z < 0  below 3D Coordinate Systems y z+ x
  • 14.
    Every point inspace may be addressed by three numbers, an ordered triple, (x, y, z). Given (x, y, z), to find the location it pinpoints: 1. find (x, y) in the x&y coordinate plane, 2. then the z, which specifies the location above or below (x, y). Specifically, z > 0  above z < 0  below Example A. Draw A(2, 0 , 0), B(1, 3, 4), C(–2, 1, –3) 3D Coordinate Systems y z+ x
  • 15.
    y z+ Example A. DrawA(2, 0 , 0), B(1, 3, 4), C(–2, 1, –3) 3D Coordinate Systems xA(2, 0, 0) Given (x, y, z), to find the location it pinpoints: 1. find (x, y) in the x&y coordinate plane, 2. then the z, which specifies the location above or below (x, y). Specifically, z > 0  above z < 0  below Every point in space may be addressed by three numbers, an ordered triple, (x, y, z).
  • 16.
    y z+ Example A. DrawA(2, 0 , 0), B(1, 3, 4), C(–2, 1, –3) 3D Coordinate Systems xA(2, 0, 0) (1, 3, 0) Given (x, y, z), to find the location it pinpoints: 1. find (x, y) in the x&y coordinate plane, 2. then the z, which specifies the location above or below (x, y). Specifically, z > 0  above z < 0  below Every point in space may be addressed by three numbers, an ordered triple, (x, y, z).
  • 17.
    y z+ Example A. DrawA(2, 0 , 0), B(1, 3, 4), C(–2, 1, –3) 3D Coordinate Systems xA(2, 0, 0) (1, 3, 0) B(1, 3, 4) 4 Given (x, y, z), to find the location it pinpoints: 1. find (x, y) in the x&y coordinate plane, 2. then the z, which specifies the location above or below (x, y). Specifically, z > 0  above z < 0  below Every point in space may be addressed by three numbers, an ordered triple, (x, y, z).
  • 18.
    y z+ Example A. DrawA(2, 0 , 0), B(1, 3, 4), C(–2, 1, –3) 3D Coordinate Systems xA(2, 0, 0) (–2, 1, 0) 4 Given (x, y, z), to find the location it pinpoints: 1. find (x, y) in the x&y coordinate plane, 2. then the z, which specifies the location above or below (x, y). Specifically, z > 0  above z < 0  below Every point in space may be addressed by three numbers, an ordered triple, (x, y, z). (1, 3, 0) B(1, 3, 4)
  • 19.
    y z+ Example A. DrawA(2, 0 , 0), B(1, 3, 4), C(–2, 1, –3) 3D Coordinate Systems xA(2, 0, 0) (–2, 1, 0) 4 C(–2, 1, –3) Given (x, y, z), to find the location it pinpoints: 1. find (x, y) in the x&y coordinate plane, 2. then the z, which specifies the location above or below (x, y). Specifically, z > 0  above z < 0  below Every point in space may be addressed by three numbers, an ordered triple, (x, y, z). (1, 3, 0) B(1, 3, 4)
  • 20.
    3D systems maybe drawn from different eye positions: 3D Coordinate Systems
  • 21.
    3D systems maybe drawn from different eye positions: x y z+ Eye:(1, –1, 1) 3D Coordinate Systems Object appears different in its direction and its orientation depending on the eye position.
  • 22.
    3D systems maybe drawn from different eye positions: x y z+ x y z+ Eye:(1, –1, 1) Eye:(1, 1, 1) 3D Coordinate Systems Object appears different in its direction and its orientation depending on the eye position.
  • 23.
    3D systems maybe drawn from different eye positions: x y z+ x y z+ x y z+ Eye:(1, –1, 1) Eye:(1, 1, 1) Eye:(1, –1, –1) 3D Coordinate Systems Object appears different in its direction and its orientation depending on the eye position.
  • 24.
    3D systems maybe drawn from different eye positions: x y z+ x y z+ x y z+ Eye:(1, –1, 1) Eye:(1, 1, 1) Eye:(1, –1, –1) x y z 3D Coordinate Systems There are three coordinate planes: Object appears different in its direction and its orientation depending on the eye position.
  • 25.
    3D systems maybe drawn from different eye positions: x y z+ x y z+ x y z+ Eye:(1, –1, 1) Eye:(1, 1, 1) Eye:(1, –1, –1) the xy-plane = {(x, y, 0)} x y z xy-plane 3D Coordinate Systems There are three coordinate planes: Object appears different in its direction and its orientation depending on the eye position.
  • 26.
    3D systems maybe drawn from different eye positions: x y z+ x y z+ x y z+ Eye:(1, –1, 1) Eye:(1, 1, 1) Eye:(1, –1, –1) the xy-plane = {(x, y, 0)} the yz-plane = {(0, y, z)} x y z xy-plane yz-plane 3D Coordinate Systems There are three coordinate planes: Object appears different in its direction and its orientation depending on the eye position.
  • 27.
    3D systems maybe drawn from different eye positions: x y z+ x y z+ x y z+ Eye:(1, –1, 1) Eye:(1, 1, 1) Eye:(1, –1, –1) the xy-plane = {(x, y, 0)} the yz-plane = {(0, y, z)} the xz-plane = {(x, 0, z)} x y z xy-plane xz-plane 3D Coordinate Systems There are three coordinate planes: Object appears different in its direction and its orientation depending on the eye position. yz-plane
  • 28.
    Basic 3D Graphs 3DCoordinate Systems
  • 29.
    Basic 3D Graphs 3DCoordinate Systems In general, the graph of an equation in the variables x, y, and z in R3 is a surface is 3D space.
  • 30.
    Basic 3D Graphs TheConstant Equations 3D Coordinate Systems In general, the graph of an equation in the variables x, y, and z in R3 is a surface is 3D space.
  • 31.
    Basic 3D Graphs TheConstant Equations The graphs of the equations x = k, y = k, or z = k are planes that are parallel to the coordinate planes. 3D Coordinate Systems In general, the graph of an equation in the variables x, y, and z in R3 is a surface is 3D space.
  • 32.
    Basic 3D Graphs TheConstant Equations The graphs of the equations x = k, y = k, or z = k are planes that are parallel to the coordinate planes. 3D Coordinate Systems In general, the graph of an equation in the variables x, y, and z in R3 is a surface is 3D space.
  • 33.
    x z+ a. x =4 is a plane that’s parallel to the yz-plane. x = 4 y Basic 3D Graphs The Constant Equations The graphs of the equations x = k, y = k, or z = k are planes that are parallel to the coordinate planes. 3D Coordinate Systems In general, the graph of an equation in the variables x, y, and z in R3 is a surface is 3D space. Example B.
  • 34.
    x z+ a. x =4 is a plane that’s parallel to the yz-plane. x = 4 b. y = 4 is a plane that’s parallel to the xz-plane. yy = 4 Basic 3D Graphs The Constant Equations The graphs of the equations x = k, y = k, or z = k are planes that are parallel to the coordinate planes. 3D Coordinate Systems In general, the graph of an equation in the variables x, y, and z in R3 is a surface is 3D space. Example B.
  • 35.
    x z+ a. x =4 is a plane that’s parallel to the yz-plane. x = 4 b. y = 4 is a plane that’s parallel to the xz-plane. yy = 4 c. z = 4 is a plane that’s parallel to the xy-plane. z = 4 Basic 3D Graphs The Constant Equations The graphs of the equations x = k, y = k, or z = k are planes that are parallel to the coordinate planes. 3D Coordinate Systems In general, the graph of an equation in the variables x, y, and z in R3 is a surface is 3D space. Example B.
  • 36.
    x z+ a. x =4 is a plane that’s parallel to the yz-plane. x = 4 b. y = 4 is a plane that’s parallel to the xz-plane. yy = 4 c. z = 4 is a plane that’s parallel to the xy-plane. z = 4 Basic 3D Graphs The Constant Equations The graphs of the equations x = k, y = k, or z = k are planes that are parallel to the coordinate planes. 3D Coordinate Systems In general, the graph of an equation in the variables x, y, and z in R3 is a surface is 3D space. Example B. d. The graph of (x – 4)(y – 4)(z – 4) = 0 is all three planes.
  • 37.
    3D Coordinate Systems TheGraphs of Linear Equations
  • 38.
    The graphs oflinear equations ax + by + cz = d are planes. 3D Coordinate Systems The Graphs of Linear Equations
  • 39.
    The graphs oflinear equations ax + by + cz = d are planes. We may use the intercepts to graph the plane. a, b, c and d are all nonzero: 3D Coordinate Systems The Graphs of Linear Equations
  • 40.
    The graphs oflinear equations ax + by + cz = d are planes. We may use the intercepts to graph the plane a, b, c and d are all nonzero: set x = y = 0 to obtain the z intercept, set x = z = 0 to obtain the y intercept, set y = z = 0 to obtain the x intercept. 3D Coordinate Systems The Graphs of Linear Equations
  • 41.
    The graphs oflinear equations ax + by + cz = d are planes. We may use the intercepts to graph the plane a, b, c and d are all nonzero: set x = y = 0 to obtain the z intercept, set x = z = 0 to obtain the y intercept, set y = z = 0 to obtain the x intercept. 3D Coordinate Systems The Graphs of Linear Equations The three intercepts position the plane in the coordinate system.
  • 42.
    The graphs oflinear equations ax + by + cz = d are planes. We may use the intercepts to graph the plane a, b, c and d are all nonzero: set x = y = 0 to obtain the z intercept, set x = z = 0 to obtain the y intercept, set y = z = 0 to obtain the x intercept. Example C. Sketch 2x – y + 2z = 4. 3D Coordinate Systems The Graphs of Linear Equations The three intercepts position the plane in the coordinate system.
  • 43.
    x z+ The graphs oflinear equations ax + by + cz = d are planes. We may use the intercepts to graph the plane a, b, c and d are all nonzero: set x = y = 0 to obtain the z intercept, set x = z = 0 to obtain the y intercept, set y = z = 0 to obtain the x intercept. Example C. Sketch 2x – y + 2z = 4 Set x = y = 0  z = 2, we’ve (0, 0, 2), y 3D Coordinate Systems The Graphs of Linear Equations The three intercepts position the plane in the coordinate system.
  • 44.
    x z+ The graphs oflinear equations ax + by + cz = d are planes. We may use the intercepts to graph the plane a, b, c and d are all nonzero: set x = y = 0 to obtain the z intercept, set x = z = 0 to obtain the y intercept, set y = z = 0 to obtain the x intercept. Example C. Sketch 2x – y + 2z = 4 Set x = y = 0  z = 2, we’ve (0, 0, 2), set x = z = 0  y = –4, we’ve (0, –4, 0), set y = z = 0  x = 2, we’ve (2, 0, 0). y 3D Coordinate Systems The Graphs of Linear Equations The three intercepts position the plane in the coordinate system.
  • 45.
    x z+ The graphs oflinear equations ax + by + cz = d are planes. We may use the intercepts to graph the plane a, b, c and d are all nonzero: set x = y = 0 to obtain the z intercept, set x = z = 0 to obtain the y intercept, set y = z = 0 to obtain the x intercept. Example C. Sketch 2x – y + 2z = 4 Set x = y = 0  z = 2, we’ve (0, 0, 2), set x = z = 0  y = –4, we’ve (0, –4, 0), set y = z = 0  x = 2, we’ve (2, 0, 0). Plot these intercepts and the plane containing them is the graph. y 3D Coordinate Systems The Graphs of Linear Equations The three intercepts position the plane in the coordinate system. (0,–4, 0) (2, 0, 0) (0, 0, 2)
  • 46.
    x z+ The graphs oflinear equations ax + by + cz = d are planes. We may use the intercepts to graph the plane a, b, c and d are all nonzero: set x = y = 0 to obtain the z intercept, set x = z = 0 to obtain the y intercept, set y = z = 0 to obtain the x intercept. Example C. Sketch 2x – y + 2z = 4 Set x = y = 0  z = 2, we’ve (0, 0, 2), set x = z = 0  y = –4, we’ve (0, –4, 0), set y = z = 0  x = 2, we’ve (2, 0, 0). Plot these intercepts and the plane containing them is the graph. y 3D Coordinate Systems The Graphs of Linear Equations The three intercepts position the plane in the coordinate system. (0, 0, 2) (0,–4, 0) (2, 0, 0)
  • 47.
    Example D. Sketchy – 2x = 4 in R3. 3D Coordinate Systems
  • 48.
    Example D. Sketchy – 2x = 4 in R3. Set x = z = 0  y = 4, we’ve (0, 4, 0), set y = z = 0  x = –2, we’ve (–2, 0, 0). 3D Coordinate Systems
  • 49.
    Example D. Sketchy – 2x = 4 in R3. Set x = z = 0  y = 4, we’ve (0, 4, 0), set y = z = 0  x = –2, we’ve (–2, 0, 0). We can’t set y = x = 0, so there is no z intercept. 3D Coordinate Systems
  • 50.
    Example D. Sketchy – 2x = 4 in R3. Set x = z = 0  y = 4, we’ve (0, 4, 0), set y = z = 0  x = –2, we’ve (–2, 0, 0). We can’t set y = x = 0, so there is no z intercept. Plot the x and y intercepts, the line y – 2x = 4 in the xy-plane is part of the graph. 3D Coordinate Systems
  • 51.
    x z+ Example D. Sketchy – 2x = 4 in R3. Set x = z = 0  y = 4, we’ve (0, 4, 0), set y = z = 0  x = –2, we’ve (–2, 0, 0). We can’t set y = x = 0, so there is no z intercept. Plot the x and y intercepts, the line y – 2x = 4 in the xy-plane is part of the graph. 3D Coordinate Systems The plane y – 2x = 4 y
  • 52.
    x z+ Example D. Sketchy – 2x = 4 in R3. Set x = z = 0  y = 4, we’ve (0, 4, 0), set y = z = 0  x = –2, we’ve (–2, 0, 0). We can’t set y = x = 0, so there is no z intercept. Plot the x and y intercepts, the line y – 2x = 4 in the xy-plane is part of the graph. 3D Coordinate Systems The plane y – 2x = 4 y (0, 4, 0) (–2, 0, 0)
  • 53.
    x z+ Example D. Sketchy – 2x = 4 in R3. Set x = z = 0  y = 4, we’ve (0, 4, 0), set y = z = 0  x = –2, we’ve (–2, 0, 0). We can’t set y = x = 0, so there is no z intercept. Because the equation doesn't have the variable z, therefore the z coordinate can assume any value. Plot the x and y intercepts, the line y – 2x = 4 in the xy-plane is part of the graph. 3D Coordinate Systems The plane y – 2x = 4 y (0, 4, 0) (–2, 0, 0)
  • 54.
    x z+ Example D. Sketchy – 2x = 4 in R3. Set x = z = 0  y = 4, we’ve (0, 4, 0), set y = z = 0  x = –2, we’ve (–2, 0, 0). We can’t set y = x = 0, so there is no z intercept. Because the equation doesn't have the variable z, therefore the z coordinate assume any value. Hence all points directly above and below the line y – 2x = 4, which form a plane parallel to the z-axis, is the graph. Plot the x and y intercepts, the line y – 2x = 4 in the xy-plane is part of the graph. 3D Coordinate Systems The plane y – 2x = 4 y (0, 4, 0) (–2, 0, 0)
  • 55.
    x z+ Example D. Sketchy – 2x = 4 in R3. Set x = z = 0  y = 4, we’ve (0, 4, 0), set y = z = 0  x = –2, we’ve (–2, 0, 0). We can’t set y = x = 0, so there is no z intercept. Because the equation doesn't have the variable z, therefore the z coordinate assume any value. Hence all points directly above and below the line y – 2x = 4 which form a plane parallel to the x-axis, is the graph. Plot the x and y intercepts, the line y – 2x = 4 in the xy-plane is part of the graph. 3D Coordinate Systems (–2, 0, 0) (0, 4, 0) The plane y – 2x = 4 y
  • 56.
    General Cylinders (Equationwith a missing variable) 3D Coordinate Systems
  • 57.
    General Cylinders (Equationwith a missing variable) 3D Coordinate Systems In general, if an equation has a missing variable then the missing variable may assume any value.
  • 58.
    Example E. Sketchz = x2 General Cylinders (Equation with a missing variable) 3D Coordinate Systems In general, if an equation has a missing variable then the missing variable may assume any value.
  • 59.
    Example E. Sketchz = x2 General Cylinders (Equation with a missing variable) 3D Coordinate Systems In general, if an equation has a missing variable then the missing variable may assume any value. To draw the graph of the equation, draw the 2D curve in the corresponding coordinate plane first,
  • 60.
    Example E. Sketchz = x2 General Cylinders (Equation with a missing variable) 3D Coordinate Systems Draw the parabola z = x2 in the xz-plane. In general, if an equation has a missing variable then the missing variable may assume any value. To draw the graph of the equation, draw the 2D curve in the corresponding coordinate plane first, z+ x y
  • 61.
    Example E. Sketchz = x2 General Cylinders (Equation with a missing variable) then move the curve in space parallel to the axis of the missing variable. 3D Coordinate Systems Draw the parabola z = x2 in the xz-plane. In general, if an equation has a missing variable then the missing variable may assume any value. To draw the graph of the equation, draw the 2D curve in the corresponding coordinate plane first, z+ x y
  • 62.
    Example E. Sketchz = x2 General Cylinders (Equation with a missing variable) then move the curve in space parallel to the axis of the missing variable. 3D Coordinate Systems Draw the parabola z = x2 in the xz-plane. Extending this parabola in the y (the missing variable) direction In general, if an equation has a missing variable then the missing variable may assume any value. To draw the graph of the equation, draw the 2D curve in the corresponding coordinate plane first, z+ x y
  • 63.
    Example E. Sketchz = x2 General Cylinders (Equation with a missing variable) then move the curve in space parallel to the axis of the missing variable. 3D Coordinate Systems Draw the parabola z = x2 in the xz-plane. Extend this parabola in the y (the missing variable) direction we get the (parabolic) cylinder-surface as shown. In general, if an equation has a missing variable then the missing variable may assume any value. x z+ y To draw the graph of the equation, draw the 2D curve in the corresponding coordinate plane first,
  • 64.
    Example E. Sketchz = x2 General Cylinders (Equation with a missing variable) then move the curve in space parallel to the axis of the missing variable. The surface formed is a general cylinder. 3D Coordinate Systems Draw the parabola z = x2 in the xz-plane. Extend this parabola in the y (the missing variable) direction we get the (parabolic) cylinder-surface as shown. In general, if an equation has a missing variable then the missing variable may assume any value. x z+ y To draw the graph of the equation, draw the 2D curve in the corresponding coordinate plane first,
  • 65.
    x z+Equations of Spheres yTheequation of the sphere with radius r, centered at (a, b ,c) is (x – a)2 + (y – b)2 + (z – c)2 = r2. In particular x2 + y2 + z2 = r2 is the sphere centered at (0, 0, 0) with radius r. (a, b, c) r r (x–a)2+(y–b)2+(z–c)2=r2 x2+y2+z2=r2 3D Coordinate Systems
  • 66.
    x z+Equations of Spheres yTheequation of the sphere with radius r, centered at (a, b ,c) is (x – a)2 + (y – b)2 + (z – c)2 = r2. In particular x2 + y2 + z2 = r2 is the sphere centered at (0, 0, 0) with radius r. (a, b, c) r r (x–a)2+(y–b)2+(z–c)2=r2 x2+y2+z2=r2 Equations of Ellipsoids The graph of the equation is the ellipsoid centered at (a, b ,c), with x–radius = r, y–radius = s, z–radius = t (x – a)2 (y – b)2 (z – c)2 r2 s2 t2 = 1++ x z+ y (a, b, c) r s t 3D Coordinate Systems
  • 67.
    The distance Dbetween (x1, y1, z1), (x2, y2, z2) is Δx2 + Δy2 + Δz2 = (x2 – x1)2 + (y2 – y1)2 + (z2 – z1)2 3D Coordinate Systems The Distance and the Mid–point Formula in R3
  • 68.
    The distance Dbetween (x1, y1, z1), (x2, y2, z2) is Δx2 + Δy2 + Δz2 = (x2 – x1)2 + (y2 – y1)2 + (z2 – z1)2 Hence the distance between (2, –1, 1) and (1, –1, 3), with Δx = 1, Δy = 0, Δz = –2, is D = 1+ 0 + 4 = 5 3D Coordinate Systems The Distance and the Mid–point Formula in R3
  • 69.
    The distance Dbetween (x1, y1, z1), (x2, y2, z2) is Δx2 + Δy2 + Δz2 = (x2 – x1)2 + (y2 – y1)2 + (z2 – z1)2 Hence the distance between (2, –1, 1) and (1, –1, 3), with Δx = 1, Δy = 0, Δz = –2, is D = 1+ 0 + 4 = 5 The mid–point of (x1, y1, z1), (x2, y2, z2) is ( x1+ x2 y1+ y2 z1+ z2 2 2 2, , ). 3D Coordinate Systems The Distance and the Mid–point Formula in R3
  • 70.
    The distance Dbetween (x1, y1, z1), (x2, y2, z2) is Δx2 + Δy2 + Δz2 = (x2 – x1)2 + (y2 – y1)2 + (z2 – z1)2 Hence the distance between (2, –1, 1) and (1, –1, 3), with Δx = 1, Δy = 0, Δz = –2, is D = 1+ 0 + 4 = 5 The mid–point of (x1, y1, z1), (x2, y2, z2) is ( x1+ x2 y1+ y2 z1+ z2 2 2 2, , ). 3D Coordinate Systems The Distance and the Mid–point Formula in R3 Example F. Find the equation of the sphere which has A(2, 1, 3) and B(4, 3, –5) as a diameter.
  • 71.
    The distance Dbetween (x1, y1, z1), (x2, y2, z2) is Δx2 + Δy2 + Δz2 = (x2 – x1)2 + (y2 – y1)2 + (z2 – z1)2 Hence the distance between (2, –1, 1) and (1, –1, 3), with Δx = 1, Δy = 0, Δz = –2, is D = 1+ 0 + 4 = 5 The mid–point of (x1, y1, z1), (x2, y2, z2) is ( x1+ x2 y1+ y2 z1+ z2 2 2 2, , ). 3D Coordinate Systems The Distance and the Mid–point Formula in R3 Example F. Find the equation of the sphere which has A(2, 1, 3) and B(4, 3, –5) as a diameter. The center C of the sphere is the mid–point of A and B so C = (3, 2, –1).
  • 72.
    The distance Dbetween (x1, y1, z1), (x2, y2, z2) is Δx2 + Δy2 + Δz2 = (x2 – x1)2 + (y2 – y1)2 + (z2 – z1)2 Hence the distance between (2, –1, 1) and (1, –1, 3), with Δx = 1, Δy = 0, Δz = –2, is D = 1+ 0 + 4 = 5 The mid–point of (x1, y1, z1), (x2, y2, z2) is ( x1+ x2 y1+ y2 z1+ z2 2 2 2, , ). 3D Coordinate Systems The Distance and the Mid–point Formula in R3 Example F. Find the equation of the sphere which has A(2, 1, 3) and B(4, 3, –5) as a diameter. The center C of the sphere is the mid–point of A and B and C = (3, 2, –1). The radius is the distance from A to C which is 1 + 1 + 16 = 32.
  • 73.
    The distance Dbetween (x1, y1, z1), (x2, y2, z2) is Δx2 + Δy2 + Δz2 = (x2 – x1)2 + (y2 – y1)2 + (z2 – z1)2 Hence the distance between (2, –1, 1) and (1, –1, 3), with Δx = 1, Δy = 0, Δz = –2, is D = 1+ 0 + 4 = 5 The mid–point of (x1, y1, z1), (x2, y2, z2) is ( x1+ x2 y1+ y2 z1+ z2 2 2 2, , ). 3D Coordinate Systems The Distance and the Mid–point Formula in R3 Example F. Find the equation of the sphere which has A(2, 1, 3) and B(4, 3, –5) as a diameter. The center C of the sphere is the mid–point of A and B and C = (3, 2, –1). The radius is the distance from A to C which is 1 + 1 + 16 = 32. So the equation is (x – 3)2 + (y – 2)2 + (z + 1)2 = 18.
  • 74.
    Cylindrical Coordinates The cylindricalcoordinate system is the combination of using polar coordinates for points in the xy–plane with z as the 3rd coordinate.
  • 75.
    Example G. a.Plot the point (3,120o, 4) in cylindrical coordinates. Convert it to rectangular coordinates. Cylindrical Coordinates The cylindrical coordinate system is the combination of using polar coordinates for points in the xy–plane with z as the 3rd coordinate.
  • 76.
    Example G. a.Plot the point (3,120o, 4) in cylindrical coordinate. Convert it to rectangular coordinate. 3 120o x y z Cylindrical Coordinates The cylindrical coordinate system is the combination of using polar coordinates for points in the xy–plane with z as the 3rd coordinate.
  • 77.
    Example G. a.Plot the point (3,120o, 4) in cylindrical coordinate. Convert it to rectangular coordinate. 3 120o 4 x y z (3, 120o, 4) Cylindrical Coordinates The cylindrical coordinate system is the combination of using polar coordinates for points in the xy–plane with z as the 3rd coordinate.
  • 78.
    Example G. a.Plot the point (3,120o, 4) in cylindrical coordinate. Convert it to rectangular coordinate. 3 120o 4 x y z (3, 120o, 4) x = 3cos(120o) = –3/2 y = 3sin(120o) = 33/2 Hence the point is (–3/2, 33/2, 4) Cylindrical Coordinates The cylindrical coordinate system is the combination of using polar coordinates for points in the xy–plane with z as the 3rd coordinate.
  • 79.
    Example G. a.Plot the point (3,120o, 4) in cylindrical coordinate. Convert it to rectangular coordinate. 3 120o 4 x y z (3, 120o, 4) Cylindrical Coordinates The cylindrical coordinate system is the combination of using polar coordinates for points in the xy–plane with z as the 3rd coordinate. x = 3cos(120o) = –3/2 y = 3sin(120o) = 33/2 Hence the point is (–3/2, 33/2, 4) b. Convert (3, –3, 1) into cylindrical coordinates.
  • 80.
    Example G. a.Plot the point (3,120o, 4) in cylindrical coordinate. Convert it to rectangular coordinate. 3 120o 4 x y z (3, 120o, 4)  = 315o, r = (9 + 9) = 18 Hence the point is (18, 315o, 1) in cylindrical coordinates. Cylindrical Coordinates The cylindrical coordinate system is the combination of using polar coordinates for points in the xy–plane with z as the 3rd coordinate. x = 3cos(120o) = –3/2 y = 3sin(120o) = 33/2 Hence the point is (–3/2, 33/2, 4) b. Convert (3, –3, 1) into cylindrical coordinates.
  • 81.
    Example G. a.Plot the point (3,120o, 4) in cylindrical coordinate. Convert it to rectangular coordinate. 3 120o 4 x y z (3, 120o, 4) (18, 315o, 0) x y Cylindrical Coordinates z The cylindrical coordinate system is the combination of using polar coordinates for points in the xy–plane with z as the 3rd coordinate. b. Convert (3, –3, 1) into cylindrical coordinates. x = 3cos(120o) = –3/2 y = 3sin(120o) = 33/2 Hence the point is (–3/2, 33/2, 4)  = 315o, r = (9 + 9) = 18 Hence the point is (18, 315o, 1) in cylindrical coordinates.
  • 82.
    Example G. a.Plot the point (3,120o, 4) in cylindrical coordinate. Convert it to rectangular coordinate. 3 120o 4 x y z (3, 120o, 4) (18, 315o, 0) x y Cylindrical Coordinates z (18, 315o, 1) = (3, –3, 1) 1 The cylindrical coordinate system is the combination of using polar coordinates for points in the xy–plane with z as the 3rd coordinate. b. Convert (3, –3, 1) into cylindrical coordinates. x = 3cos(120o) = –3/2 y = 3sin(120o) = 33/2 Hence the point is (–3/2, 33/2, 4)  = 315o, r = (9 + 9) = 18 Hence the point is (18, 315o, 1) in cylindrical coordinates.
  • 83.
    Cylindrical Coordinates The constantequations r = k describe cylinders of radius k, thus the name "cylindrical coordinate".
  • 84.
    The constant equations r= k describe cylinders of radius k, thus the name "cylindrical coordinate". Example H. a. Sketch r = 2 2 Cylindrical Coordinates x y z
  • 85.
    The constant equations r= k describe cylinders of radius k, thus the name "cylindrical coordinate". x y Example H. a. Sketch r = 2 2 The constant equations  = k describe the vertical planes through the origin, at the angle k with x-axis. b. Sketch θ =3π/4 3π/4 Cylindrical Coordinates z x y z
  • 86.
    The constant equations r= k describe cylinders of radius k, thus the name "cylindrical coordinate". x y Example H. a. Sketch r = 2 2 The constant equations  = k describe the vertical plane through the origin, at the angle k with x-axis. b. Sketch θ =3π/4 3π/4 Cylindrical Coordinates z x y z