This document introduces three-dimensional coordinate systems and graphs in three dimensions. It defines the three perpendicular axes (x, y, z) used to locate points in three-dimensional space. Points are represented by ordered triples (a,b,c) indicating their distances from each axis. Equations in three variables determine surfaces in three-dimensional space that can be graphed and analyzed. The document also introduces the distance formula for calculating distances between points in three-dimensional space and defines spheres using this formula. It provides examples of describing, sketching, and finding equations for various three-dimensional surfaces and regions.
Cylindrical and spherical coordinates shalinishalini singh
In this Presentation, I have explained the co-ordinate system in three plain. ie Cylindrical, Spherical, Cartesian(Rectangular) along with its Differential formulas for length, area &volume.
Computer graphics are pictures and movies created using computers - usually referring to image data created by a computer specifically with help from specialized graphical hardware and software. It is a vast and recent area in computer science.The phrase was coined by computer graphics researchers Verne Hudson and William Fetter of Boeing in 1960. Another name for the field is computer-generated imagery, or simply CGI.
Important topics in computer graphics include user interface design, sprite graphics, vector graphics, 3D modeling, shaders, GPU design, and computer vision, among others. The overall methodology depends heavily on the underlying sciences of geometry, optics, and physics. Computer graphics is responsible for displaying art and image data effectively and beautifully to the user, and processing image data received from the physical world. The interaction and understanding of computers and interpretation of data has been made easier because of computer graphics. Computer graphic development has had a significant impact on many types of media and has revolutionized animation, movies, advertising, video games, and graphic design generally.
This presentation gives some details about graph representation through touching domains. It is also known as kissing disk representation or circle packing. I tried to prove that Koebe's Theorem holds by using Brouwer Fixed-Point Theorem.
TIU CET Review Math Session 4 Coordinate Geometryyoungeinstein
College Entrance Test Review
Math Session 4 Coordinate Geometry
Formulas for the Slope of a line, Midpoint, Distance between any two points,
Equations of a Line
The branch of mathematics which deals with location of objects in 2-D (dimensional) plane is called coordinate geometry. Need to present your work in most impressive & informative manner i.e. through Power Point Presentation call us at skype Id: kumar_sukh79 or mail us: clintech2011@gmail.com for using my service.
Chapter 12
Section 12.1: Three-Dimensional Coordinate Systems
We locate a point on a number line as one coordinate, in the plane as an ordered pair, and in
space as an ordered triple. So we call number line as one dimensional, plane as two
dimensional, and space as three dimensional co – ordinate system.
In three dimensional, there is origin (0, 0, 0) and there are three axes – x -, y - , and z – axis. X –
and y – axes are horizontal and z – axis is vertical. These three axes divide the space into eight
equal parts, called the octants. In addition, these three axes divide the space into three
coordinate planes.
– The xy-plane contains the x- and y-axes. The equation is z = 0.
– The yz-plane contains the y- and z-axes. The equation is x = 0.
– The xz-plane contains the x- and z-axes. The equation is y = 0.
If P is any point in space, let:
– a be the (directed) distance from the yz-plane to P.
– b be the distance from the xz-plane to P.
– c be the distance from the xy-plane to P.
Then the point P by the ordered triple of real numbers (a, b, c), where a, b, and c are the
coordinates of P.
– a is the x-coordinate.
– b is the y-coordinate.
– c is the z-coordinate.
– Thus, to locate a point (a, b, c) in space, start from the origin (0, 0, 0) and move a
units along the x-axis. Then, move b units parallel to the y-axis. Finally, move c
units parallel to the z-axis.
The three dimensional Cartesian co – ordinate system follows the right hand rule.
Examples:
Plot the points (2,3,4), (2, -3, 4), (-2, -3, 4), (2, -3, -4), and (-2, -3, -4).
The Cartesian product x x = {(x, y, z) | x, y, z in } is the set of all ordered triples of
real numbers and is denoted by 3 .
Note:
1. In 2 – dimension, an equation in x and y represents a curve in the plane 2 . In 3 –
dimension, an equation in x, y, and z represents a surface in space 3 .
2. When we see an equation, we must understand from the context that it is a curve in the
plane or a surface in space. For example, y = 5 is a line in 2 �but it is a plane in 3 �
������
3. in space, if k, l, & m are constants, then
– x = k represents a plane parallel to the yz-plane ( a vertical plane).
– y = k is a plane parallel to the xz-plane ( a vertical plane).
– z = k is a plane parallel to the xy-plane ( a horizontal plane).
– x = k & y = l is a line.
– x = k & z = m is a line.
– y = l & z = m is a line.
– x = k, y = l and z = m is a point.
Examples: Describe and sketch y = x in 3
Example:
Solve:
Which of the points P(6, 2, 3), Q(-5, -1, 4), and R(0, 3, 8) is closest to the xz – plane? Which point
lies in the yz – plane?
Distance between two points in space:
We simply extend the formula from 2 to . 3 . The distance |p1 p2 | between the points
P1(x1,y1, z1) and P2(x2, y2, z2) is: 2 2 21 2 2 1 ...
Mathematics (from Greek μάθημα máthēma, “knowledge, study, learning”) is the study of topics such as quantity (numbers), structure, space, and change. There is a range of views among mathematicians and philosophers as to the exact scope and definition of mathematics
LF Energy Webinar: Electrical Grid Modelling and Simulation Through PowSyBl -...DanBrown980551
Do you want to learn how to model and simulate an electrical network from scratch in under an hour?
Then welcome to this PowSyBl workshop, hosted by Rte, the French Transmission System Operator (TSO)!
During the webinar, you will discover the PowSyBl ecosystem as well as handle and study an electrical network through an interactive Python notebook.
PowSyBl is an open source project hosted by LF Energy, which offers a comprehensive set of features for electrical grid modelling and simulation. Among other advanced features, PowSyBl provides:
- A fully editable and extendable library for grid component modelling;
- Visualization tools to display your network;
- Grid simulation tools, such as power flows, security analyses (with or without remedial actions) and sensitivity analyses;
The framework is mostly written in Java, with a Python binding so that Python developers can access PowSyBl functionalities as well.
What you will learn during the webinar:
- For beginners: discover PowSyBl's functionalities through a quick general presentation and the notebook, without needing any expert coding skills;
- For advanced developers: master the skills to efficiently apply PowSyBl functionalities to your real-world scenarios.
Epistemic Interaction - tuning interfaces to provide information for AI supportAlan Dix
Paper presented at SYNERGY workshop at AVI 2024, Genoa, Italy. 3rd June 2024
https://alandix.com/academic/papers/synergy2024-epistemic/
As machine learning integrates deeper into human-computer interactions, the concept of epistemic interaction emerges, aiming to refine these interactions to enhance system adaptability. This approach encourages minor, intentional adjustments in user behaviour to enrich the data available for system learning. This paper introduces epistemic interaction within the context of human-system communication, illustrating how deliberate interaction design can improve system understanding and adaptation. Through concrete examples, we demonstrate the potential of epistemic interaction to significantly advance human-computer interaction by leveraging intuitive human communication strategies to inform system design and functionality, offering a novel pathway for enriching user-system engagements.
UiPath Test Automation using UiPath Test Suite series, part 4DianaGray10
Welcome to UiPath Test Automation using UiPath Test Suite series part 4. In this session, we will cover Test Manager overview along with SAP heatmap.
The UiPath Test Manager overview with SAP heatmap webinar offers a concise yet comprehensive exploration of the role of a Test Manager within SAP environments, coupled with the utilization of heatmaps for effective testing strategies.
Participants will gain insights into the responsibilities, challenges, and best practices associated with test management in SAP projects. Additionally, the webinar delves into the significance of heatmaps as a visual aid for identifying testing priorities, areas of risk, and resource allocation within SAP landscapes. Through this session, attendees can expect to enhance their understanding of test management principles while learning practical approaches to optimize testing processes in SAP environments using heatmap visualization techniques
What will you get from this session?
1. Insights into SAP testing best practices
2. Heatmap utilization for testing
3. Optimization of testing processes
4. Demo
Topics covered:
Execution from the test manager
Orchestrator execution result
Defect reporting
SAP heatmap example with demo
Speaker:
Deepak Rai, Automation Practice Lead, Boundaryless Group and UiPath MVP
Smart TV Buyer Insights Survey 2024 by 91mobiles.pdf91mobiles
91mobiles recently conducted a Smart TV Buyer Insights Survey in which we asked over 3,000 respondents about the TV they own, aspects they look at on a new TV, and their TV buying preferences.
Accelerate your Kubernetes clusters with Varnish CachingThijs Feryn
A presentation about the usage and availability of Varnish on Kubernetes. This talk explores the capabilities of Varnish caching and shows how to use the Varnish Helm chart to deploy it to Kubernetes.
This presentation was delivered at K8SUG Singapore. See https://feryn.eu/presentations/accelerate-your-kubernetes-clusters-with-varnish-caching-k8sug-singapore-28-2024 for more details.
Builder.ai Founder Sachin Dev Duggal's Strategic Approach to Create an Innova...Ramesh Iyer
In today's fast-changing business world, Companies that adapt and embrace new ideas often need help to keep up with the competition. However, fostering a culture of innovation takes much work. It takes vision, leadership and willingness to take risks in the right proportion. Sachin Dev Duggal, co-founder of Builder.ai, has perfected the art of this balance, creating a company culture where creativity and growth are nurtured at each stage.
DevOps and Testing slides at DASA ConnectKari Kakkonen
My and Rik Marselis slides at 30.5.2024 DASA Connect conference. We discuss about what is testing, then what is agile testing and finally what is Testing in DevOps. Finally we had lovely workshop with the participants trying to find out different ways to think about quality and testing in different parts of the DevOps infinity loop.
Securing your Kubernetes cluster_ a step-by-step guide to success !KatiaHIMEUR1
Today, after several years of existence, an extremely active community and an ultra-dynamic ecosystem, Kubernetes has established itself as the de facto standard in container orchestration. Thanks to a wide range of managed services, it has never been so easy to set up a ready-to-use Kubernetes cluster.
However, this ease of use means that the subject of security in Kubernetes is often left for later, or even neglected. This exposes companies to significant risks.
In this talk, I'll show you step-by-step how to secure your Kubernetes cluster for greater peace of mind and reliability.
Securing your Kubernetes cluster_ a step-by-step guide to success !
returika
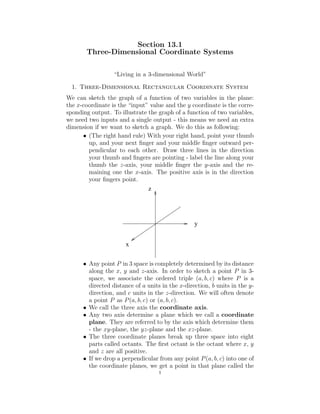
1. Section 13.1
Three-Dimensional Coordinate Systems
“Living in a 3-dimensional World”
1. Three-Dimensional Rectangular Coordinate System
We can sketch the graph of a function of two variables in the plane:
the x-coordinate is the “input” value and the y coordinate is the corre-
sponding output. To illustrate the graph of a function of two variables,
we need two inputs and a single output - this means we need an extra
dimension if we want to sketch a graph. We do this as following:
• (The right hand rule) With your right hand, point your thumb
up, and your next finger and your middle finger outward per-
pendicular to each other. Draw three lines in the direction
your thumb and fingers are pointing - label the line along your
thumb the z-axis, your middle finger the y-axis and the re-
maining one the x-axis. The positive axis is in the direction
your fingers point.
z
x
y
• Any point P in 3 space is completely determined by its distance
along the x, y and z-axis. In order to sketch a point P in 3-
space, we associate the ordered triple (a, b, c) where P is a
directed distance of a units in the x-direction, b units in the y-
direction, and c units in the z-direction. We will often denote
a point P as P(a, b, c) or (a, b, c).
• We call the three axis the coordinate axis.
• Any two axis determine a plane which we call a coordinate
plane. They are referred to by the axis which determine them
- the xy-plane, the yz-plane and the xz-plane.
• The three coordinate planes break up three space into eight
parts called octants. The first octant is the octant where x, y
and z are all positive.
• If we drop a perpendicular from any point P(a, b, c) into one of
the coordinate planes, we get a point in that plane called the
1
2. 2
projection into that plane. We have (0, b, c) as the projection
into the yz-plane, we have (a, 0, c) as the projection into the
xz-plane, and (a, b, 0) as the projection into the xy-plane.
Just as with two dimensions, any equations in 3-dimensions determine
a graph in 3-space. Being able to recognize and sketch graphs in 3-space
will be very important.
Example 1.1.
Describe and sketch the surface represented by z = 2.
This is all points with a z value of 2, so will be a horizontal plane at
z = 2.
Describe and sketch the surface represented by y =
√
x.
At z = 0, the equation y =
√
x will simply be the graph of y =
√
x in
the xy-plane. Since there are no conditions on z, we can extend this
graph out vertically, and we the equation y =
√
x will still be satisfied.
Therefore, this will be the graph of y =
√
x in the xy-plane extended
vertically (in the z-direction) infinitely.
Describe and sketch the surface represented by z = y.
Similar to the previous example, at x = 0, the equation z = y will
simply be the graph of z = y in the zy-plane. Since there are no
conditions on x, we can extend this graph out in the x-direction, and
we the equation z = y will still be satisfied. Therefore, this will be
the graph of z = y in the zy-plane extended horizontally (in the x-
direction) infinitely. In particular, it will be a plane.
Example 1.2.
If you are stood at (3, 2, 1) and are looking at (1, 2, 3), are you looking
up or down?
Up since the z value at the point you are looking at is higher than the
point you are stood at.
If you lift the xy-plane up so it has z-coordinate 1, what will be the
equation for this surface?
The xy-plane has equation z = 0. If we move it up 1, then it will have
equation z = 1.
Write down the equation for a surface which when you move in the
positive x-direction, z grows exponentially, but z stays fixed in the
y-direction.
An example of such an equation would be z = ex
.
3. 3
2. The Distance Formula and the Equation for a Sphere
To find the distance between any two points in three space, we use
a very similar formula to that in 2-space. The idea is to generalize
Pythagoras theorem.
Result 2.1. The distance |P1P2| between P1(x1, y1, z1) and P2(x2, y2, z2)
is
|P1P2| = (x1 − x2)2 + (y1 − y2)2 + (z1 − z2)2.
The distance formula is simple to apply to find the distance between
points.
Example 2.2. (i) Find the shortest distance from point P(3, 8, −2)
to the xy-plane.
This will just be the distance between the projection of P
onto the xy-plane and the point P.
(ii) Find the shortest distance from the point (3, 8, −2) to the z-
axis.
This will just be the absolute value of the z coordinate.
A sphere of radius R centered at the point (a, b, c) is by definition the
set of all points a distance R from the point (a, b, c) in 3-space. We can
use the distance formula to determine a formula for such a sphere.
Result 2.3. An equation of a sphere with center (a, b, c) and radius R
is
(x − a)2
+ (y − b)2
+ (z − c)2
= r2
.
Example 2.4. Show that the graph of the equation x2
+y2
+z2
−6x+
4y − 2z = 11 is a sphere and find its radius and center.
To show it is a sphere, we complete the square in all three variables:
x2
+y2
+z2
−6x+4y−2z = (x−3)2
−9+(y+2)2
−4+(z−1)2
−1 = 11
so
(x − 3)2
+ (y + 2)2
+ (z − 1)2
= 25.
Thus it is a sphere of radius 5 and center (3, −2, 1).
3. Regions in 3-Space
We know how to bound regions in 2-space. Being able to bound regions
in 3-space is also important. We illustrate with a couple of examples.
Example 3.1. (i) Sketch the region represented by the inequali-
ties x2
+ y2
+ z2
1, x 1/2.
This is the “scalp” of a sphere pointing in the x-direction.
4. 4
(ii) Find bounds for the region which consists of a hollow ball with
outer radius 5 and inner radius 4 centered at (1, 2, 3).
Outer ball equation is (x−1)2
+(y −2)2
+(z −3)2
= 25 and
the inner ball equation is (x − 1)2
+ (y − 2)2
+ (z − 3)2
= 16.
We want it to be smaller than the outer ball and larger than
the inner ball, so we get (x − 1)2
+ (y − 2)2
+ (z − 3)2
25
and (x − 1)2
+ (y − 2)2
+ (z − 3)2
16