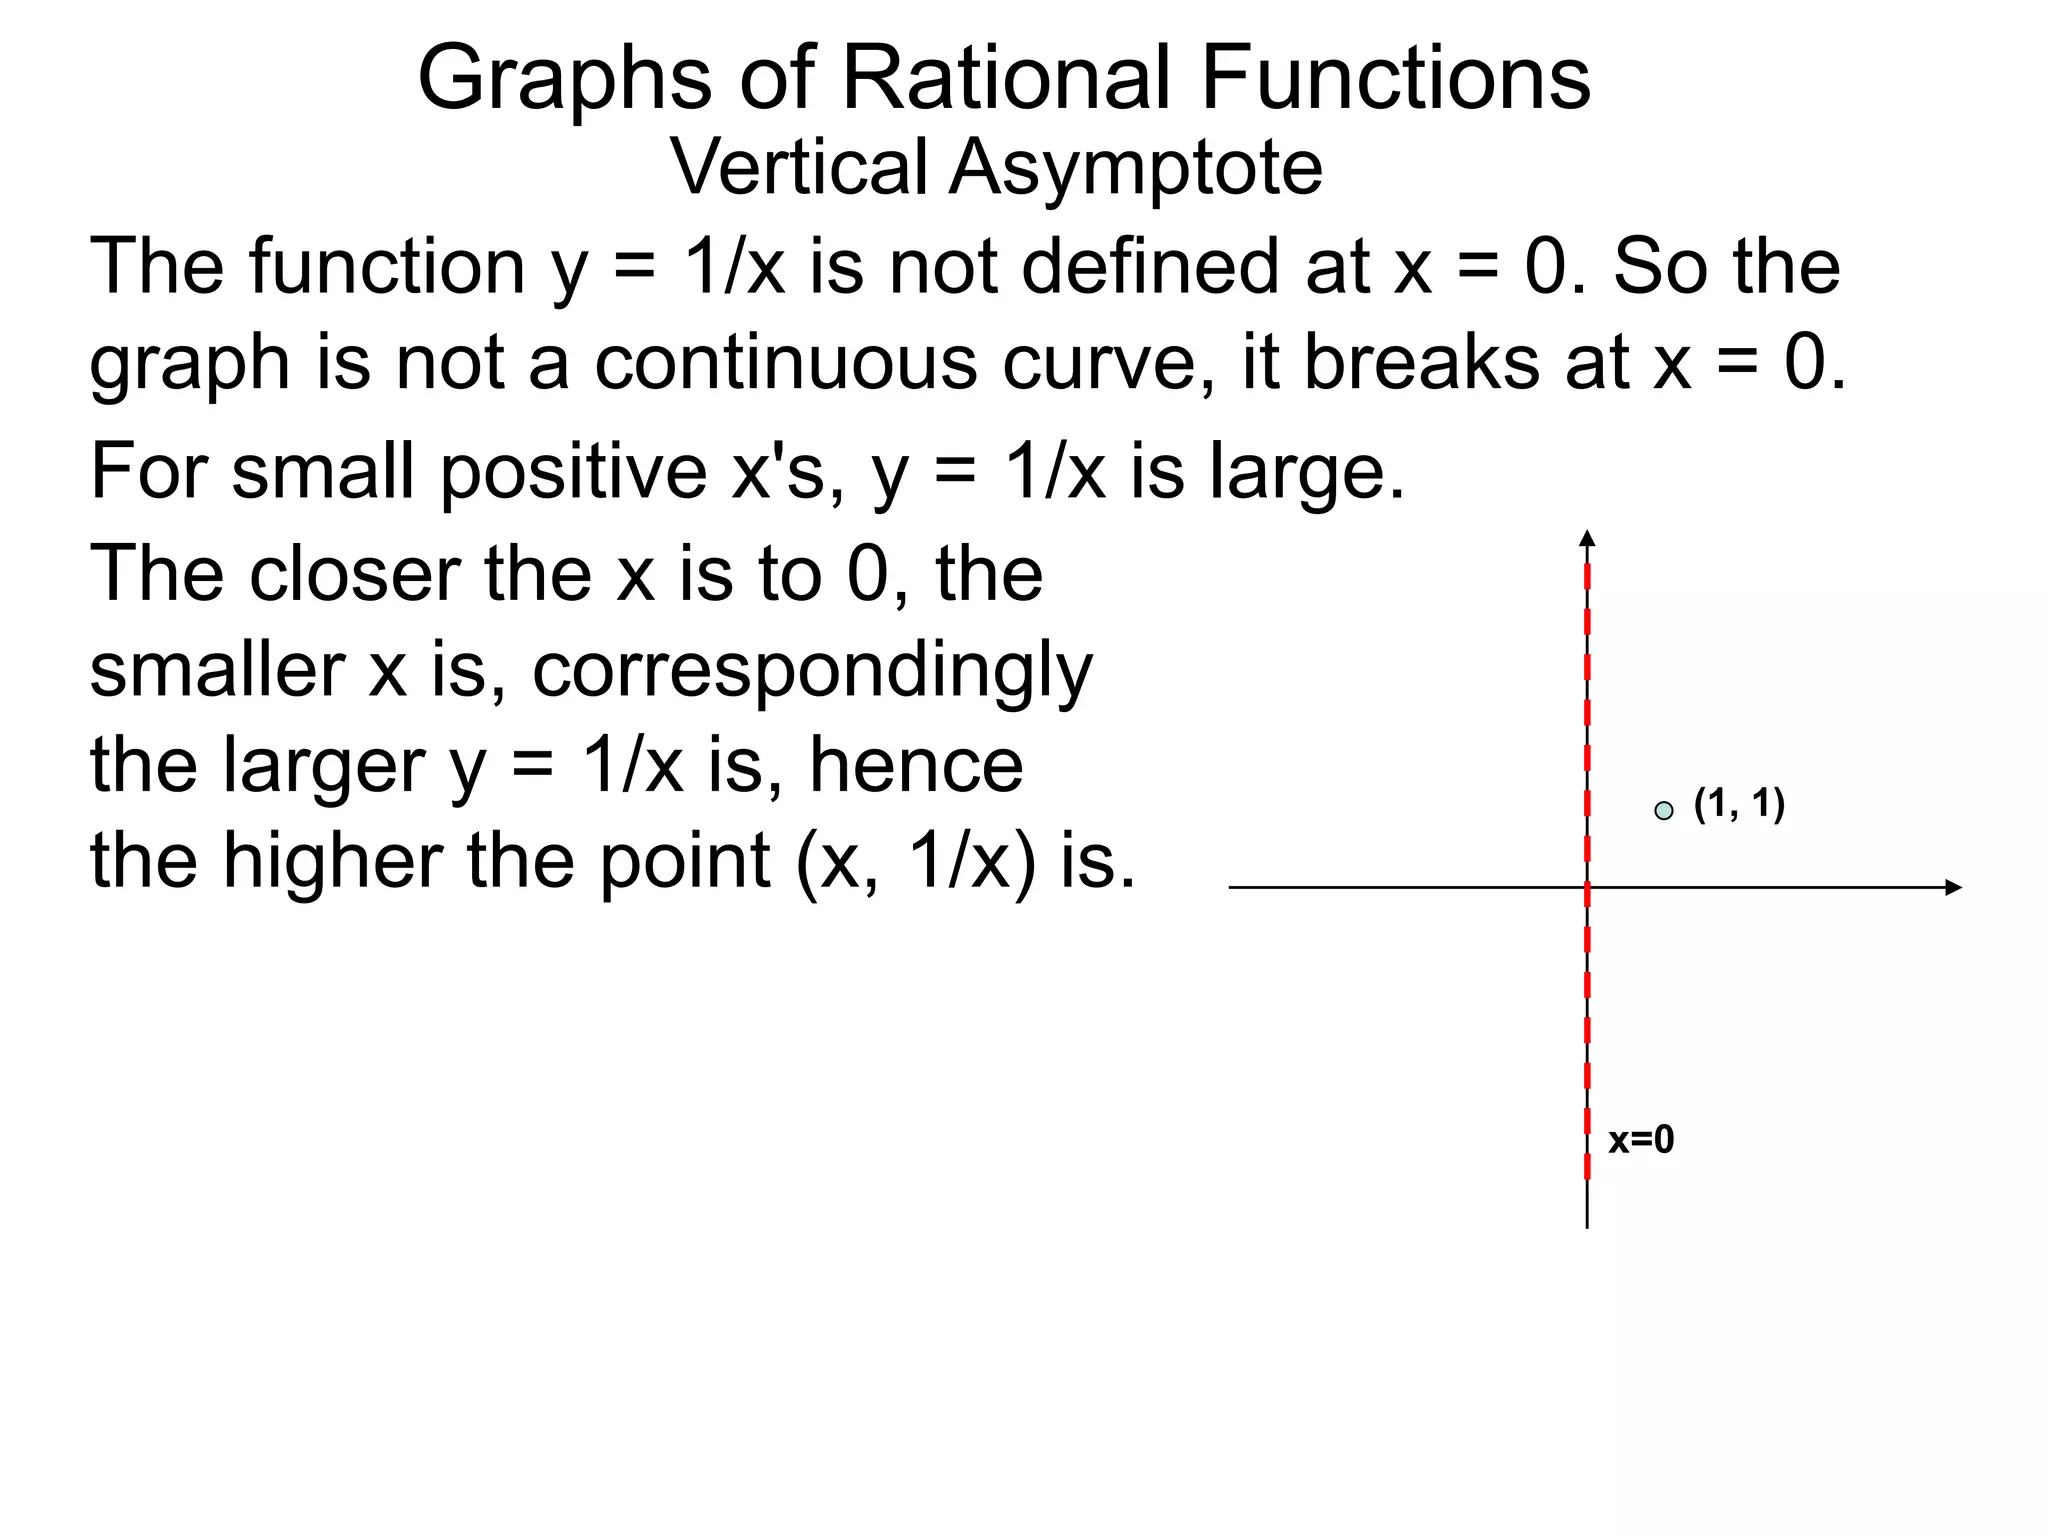
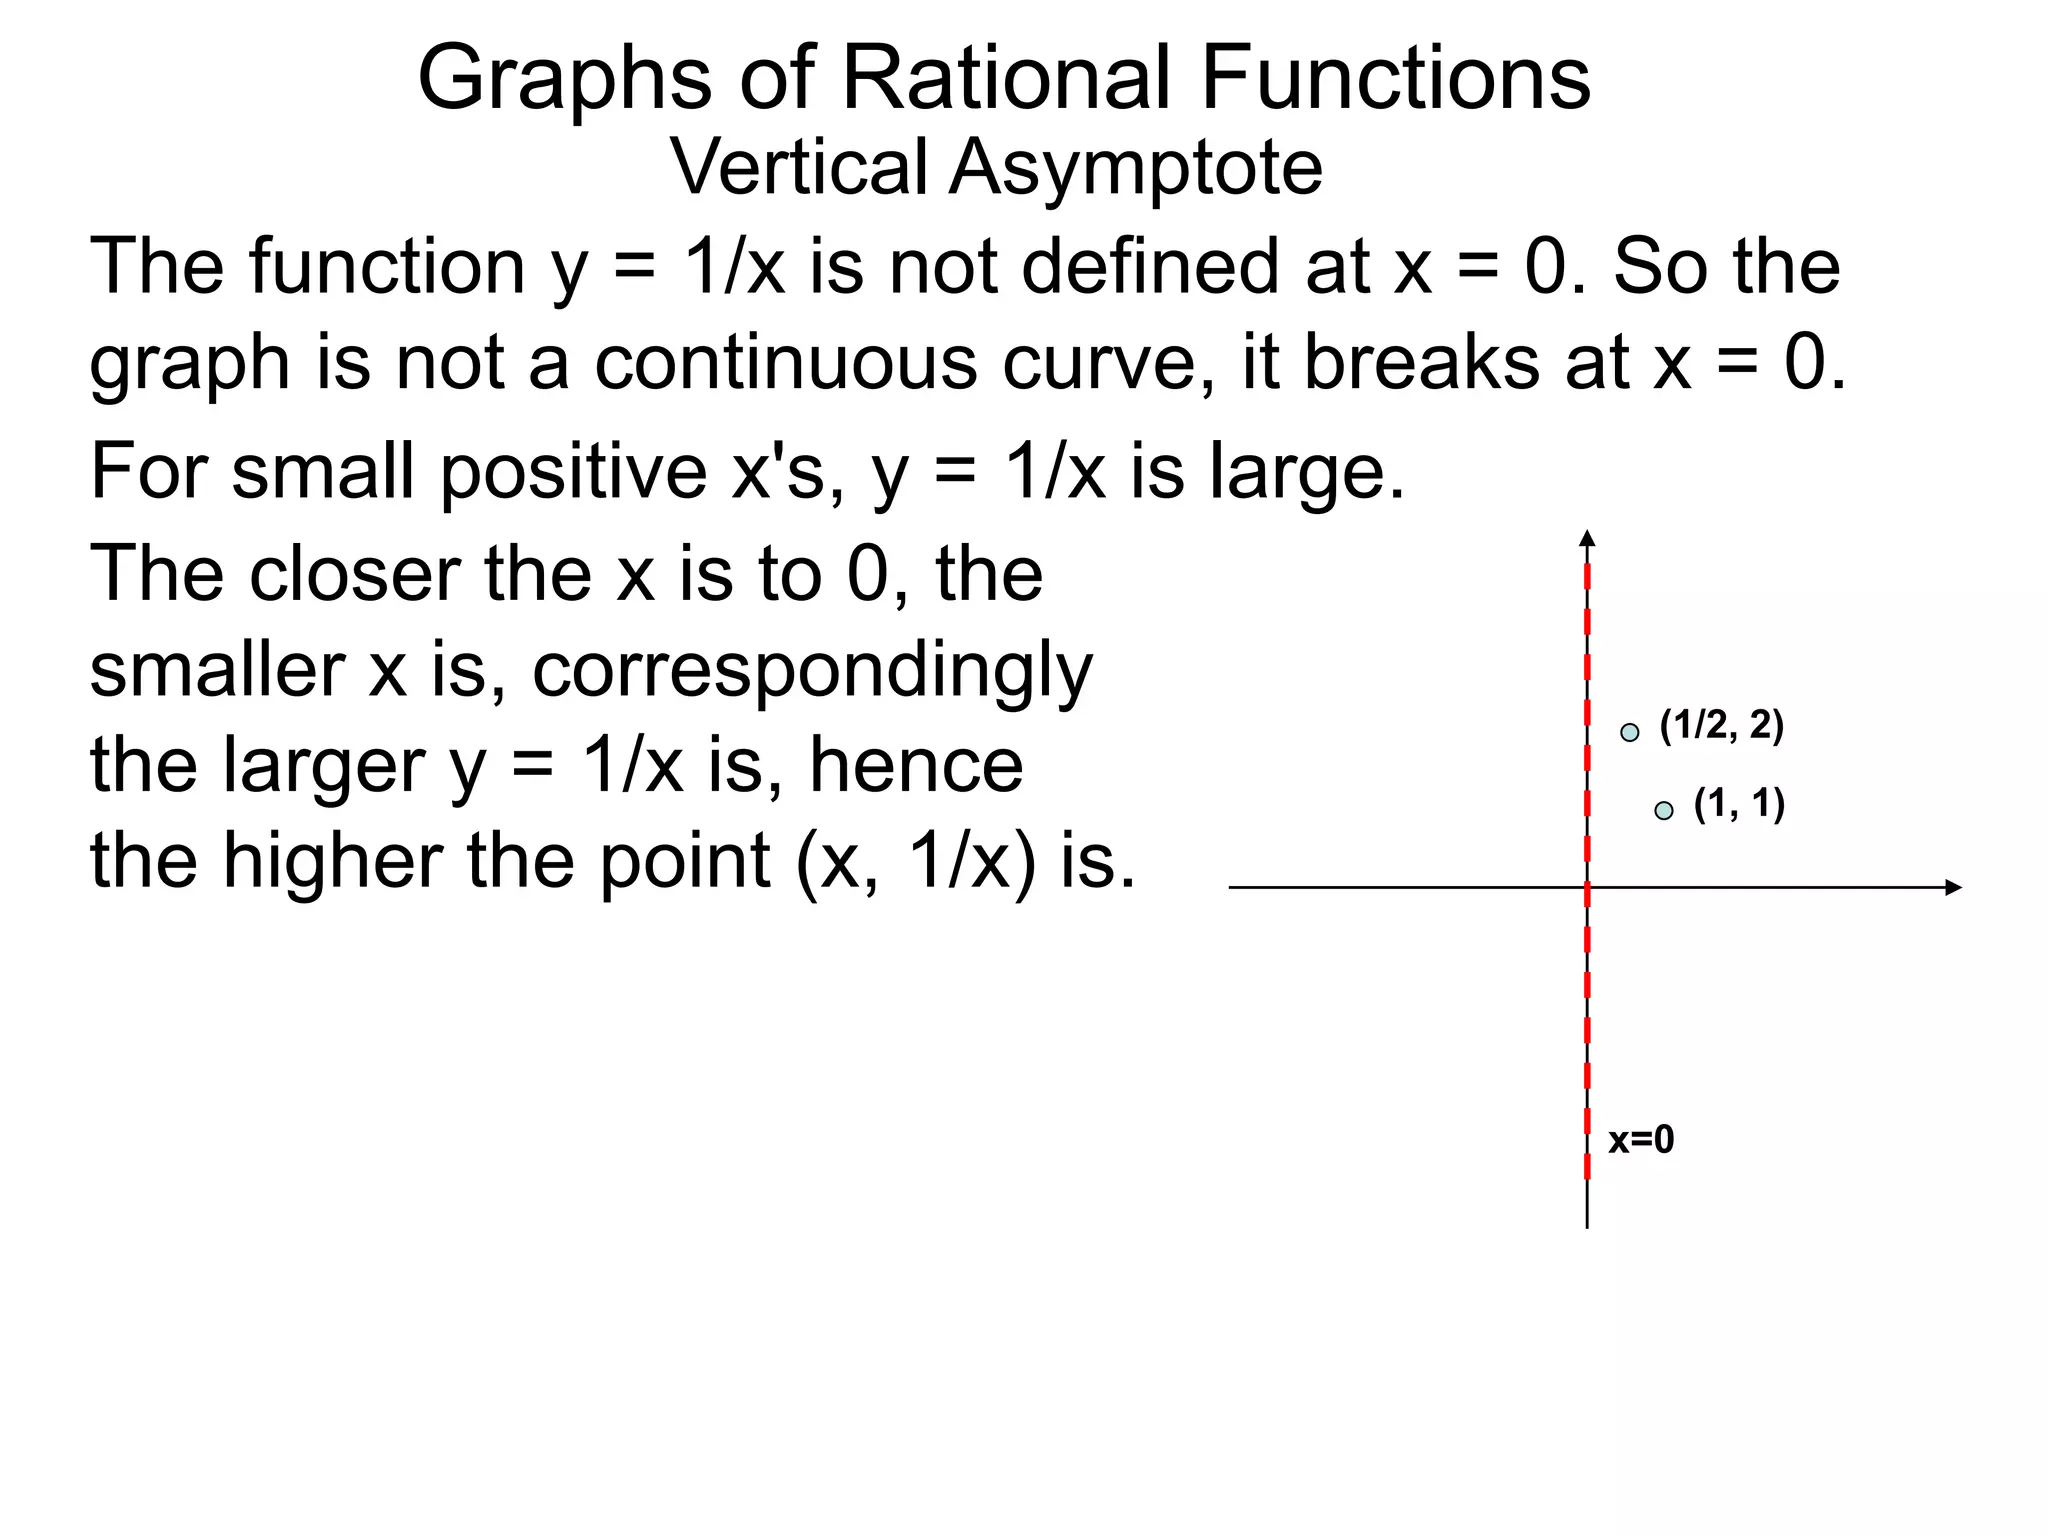
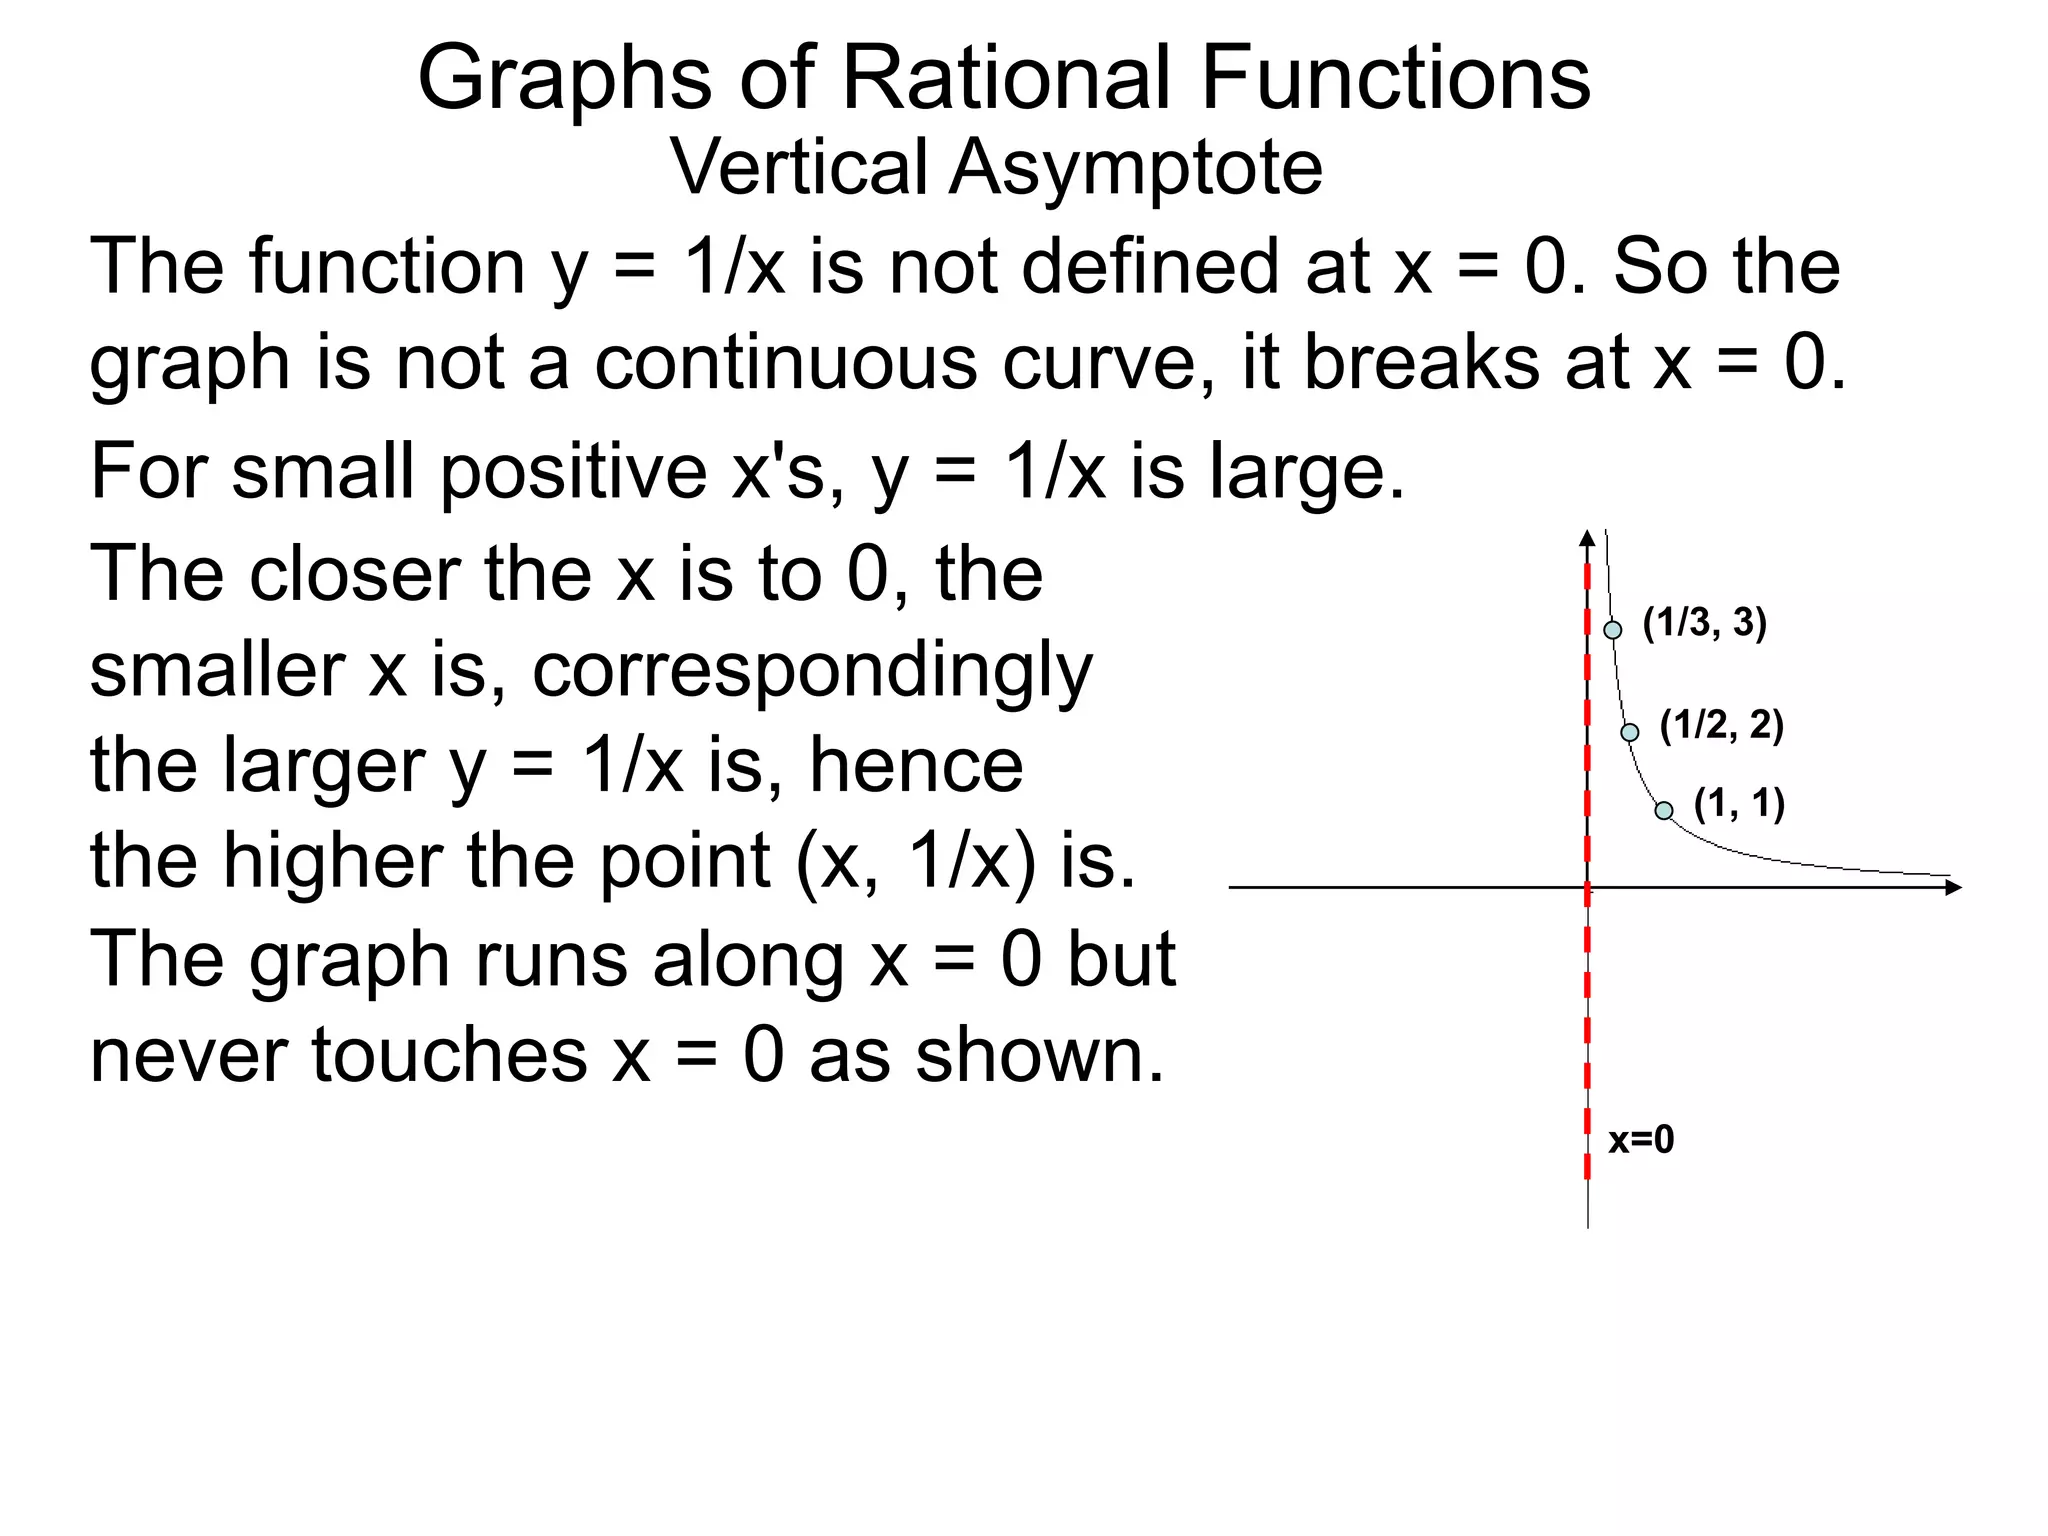
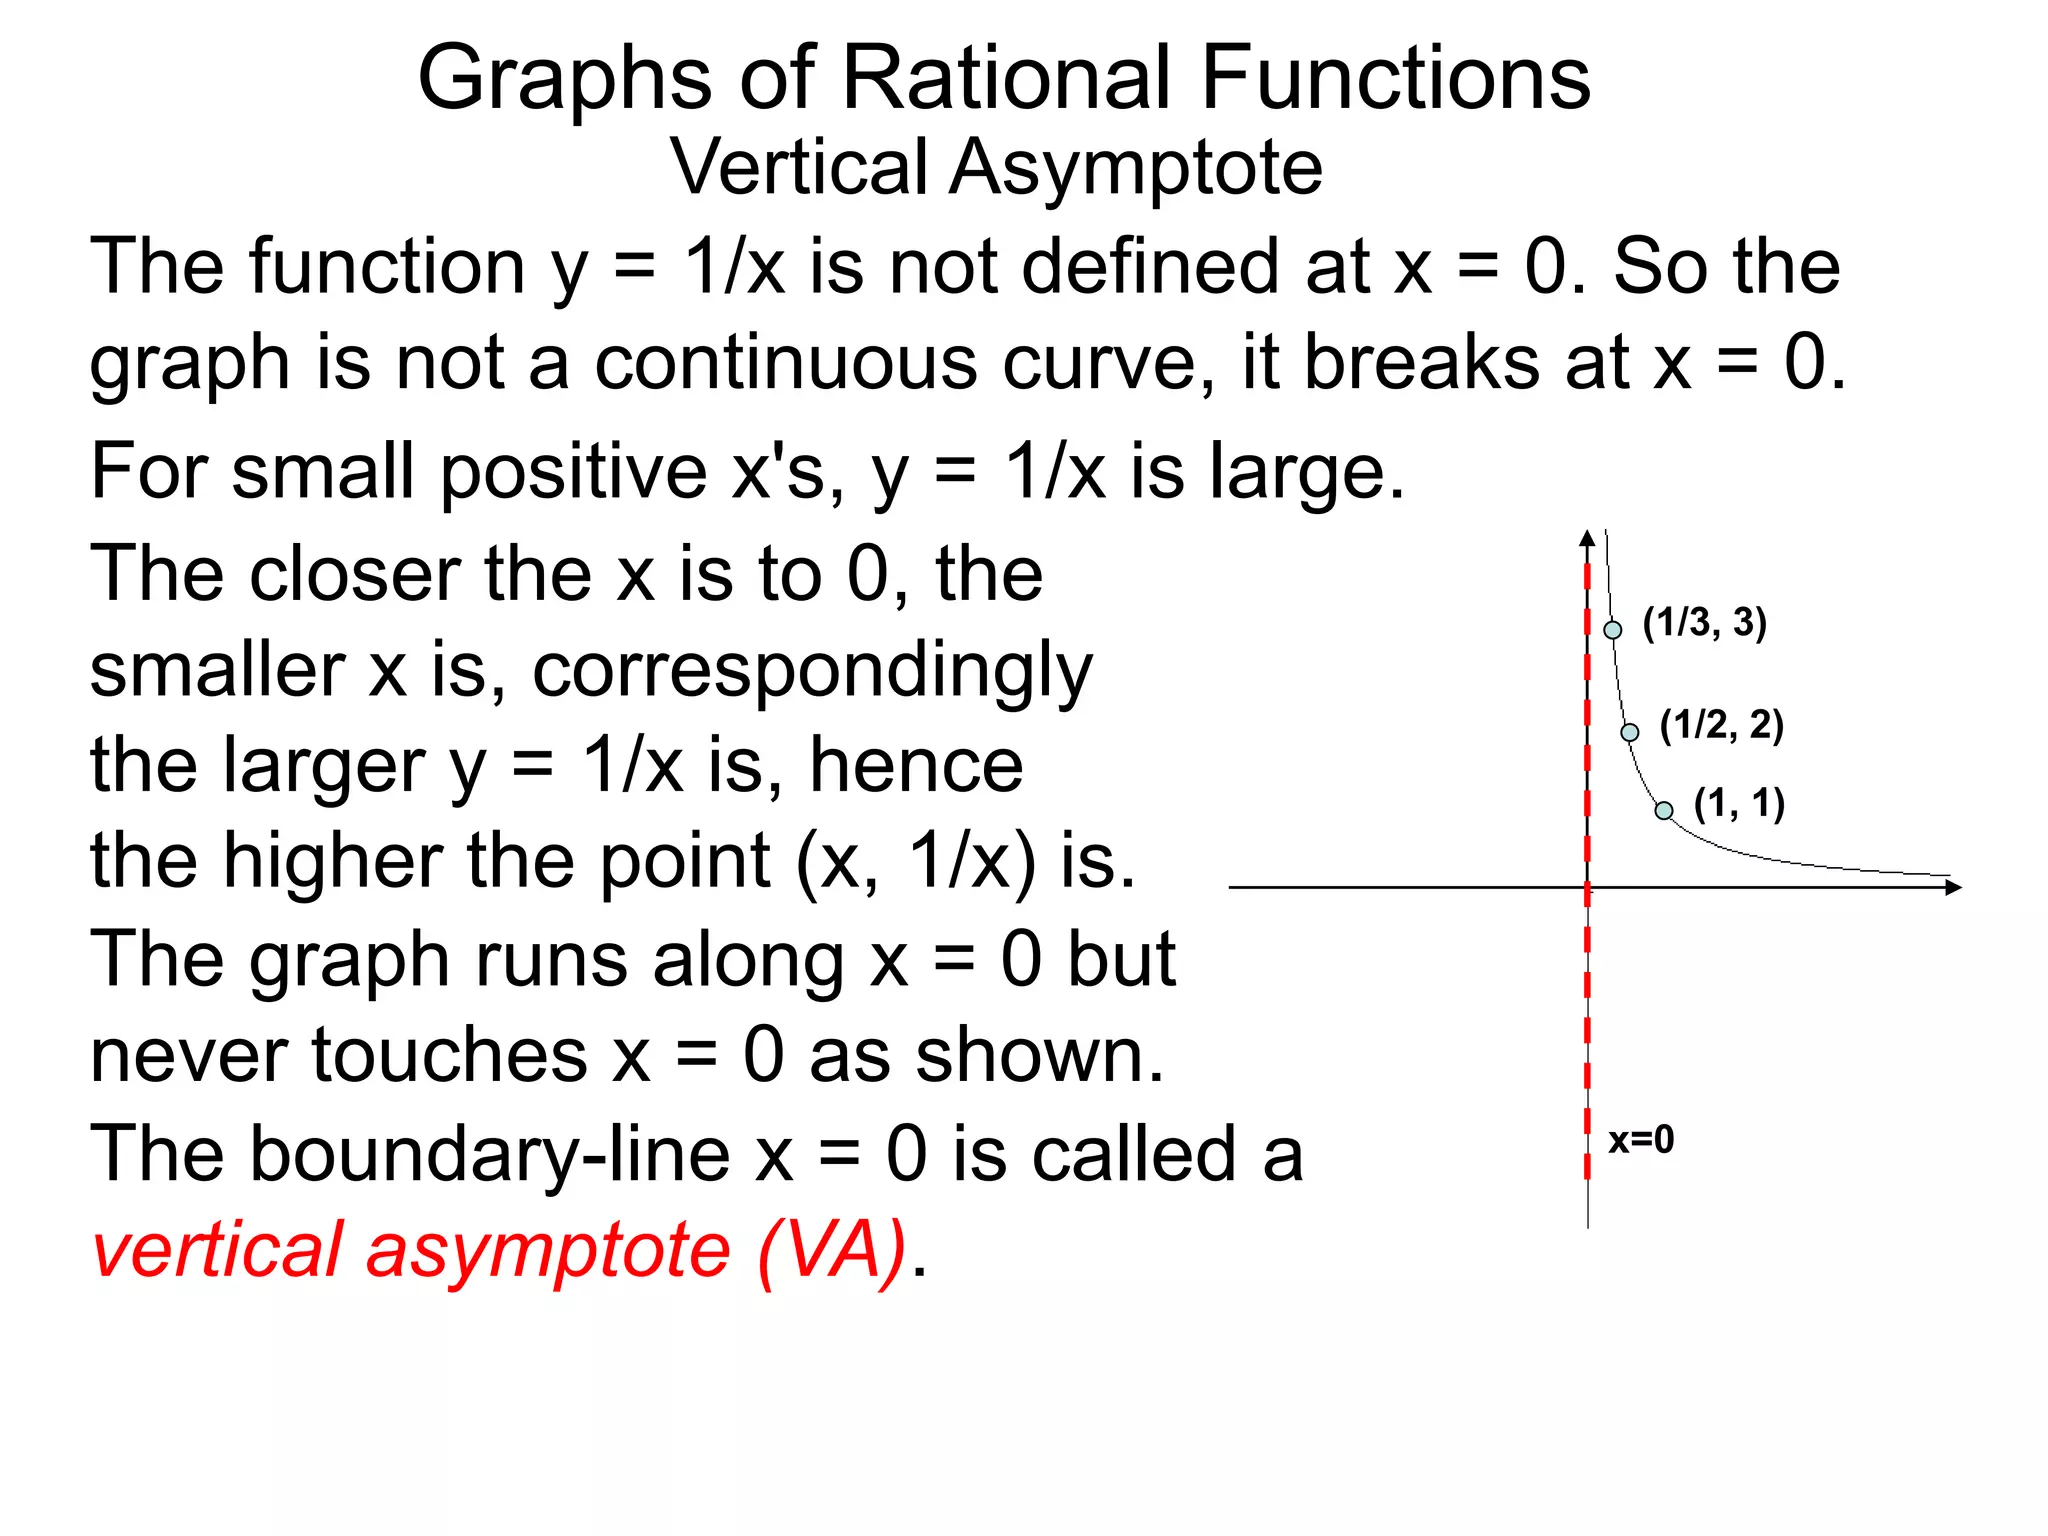
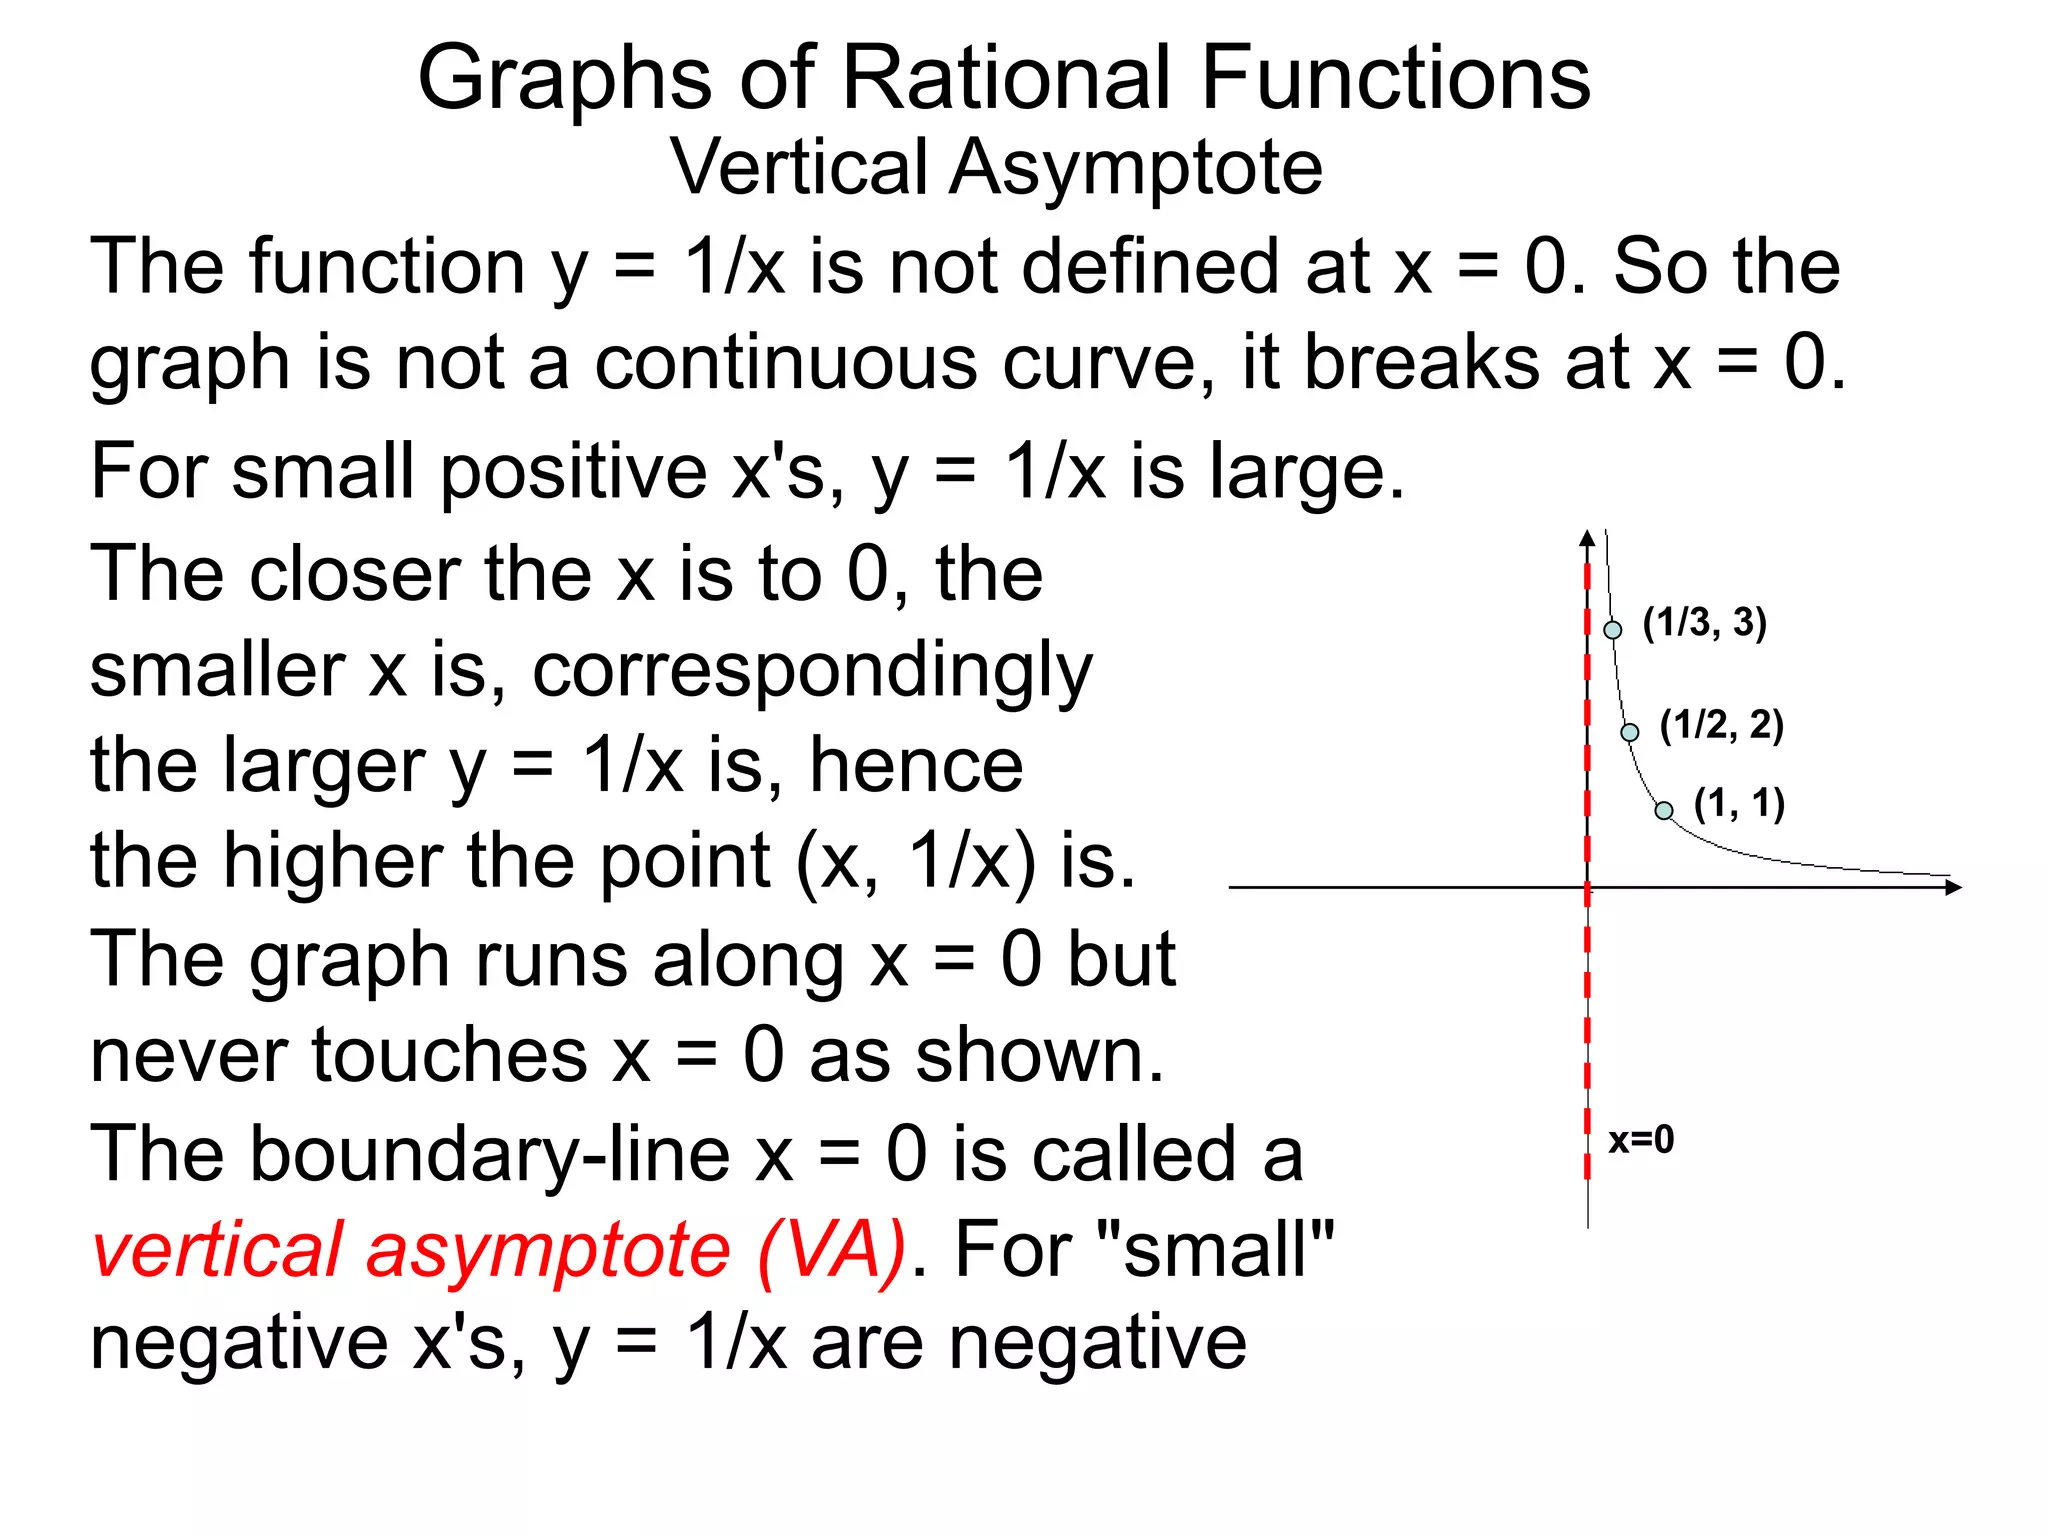
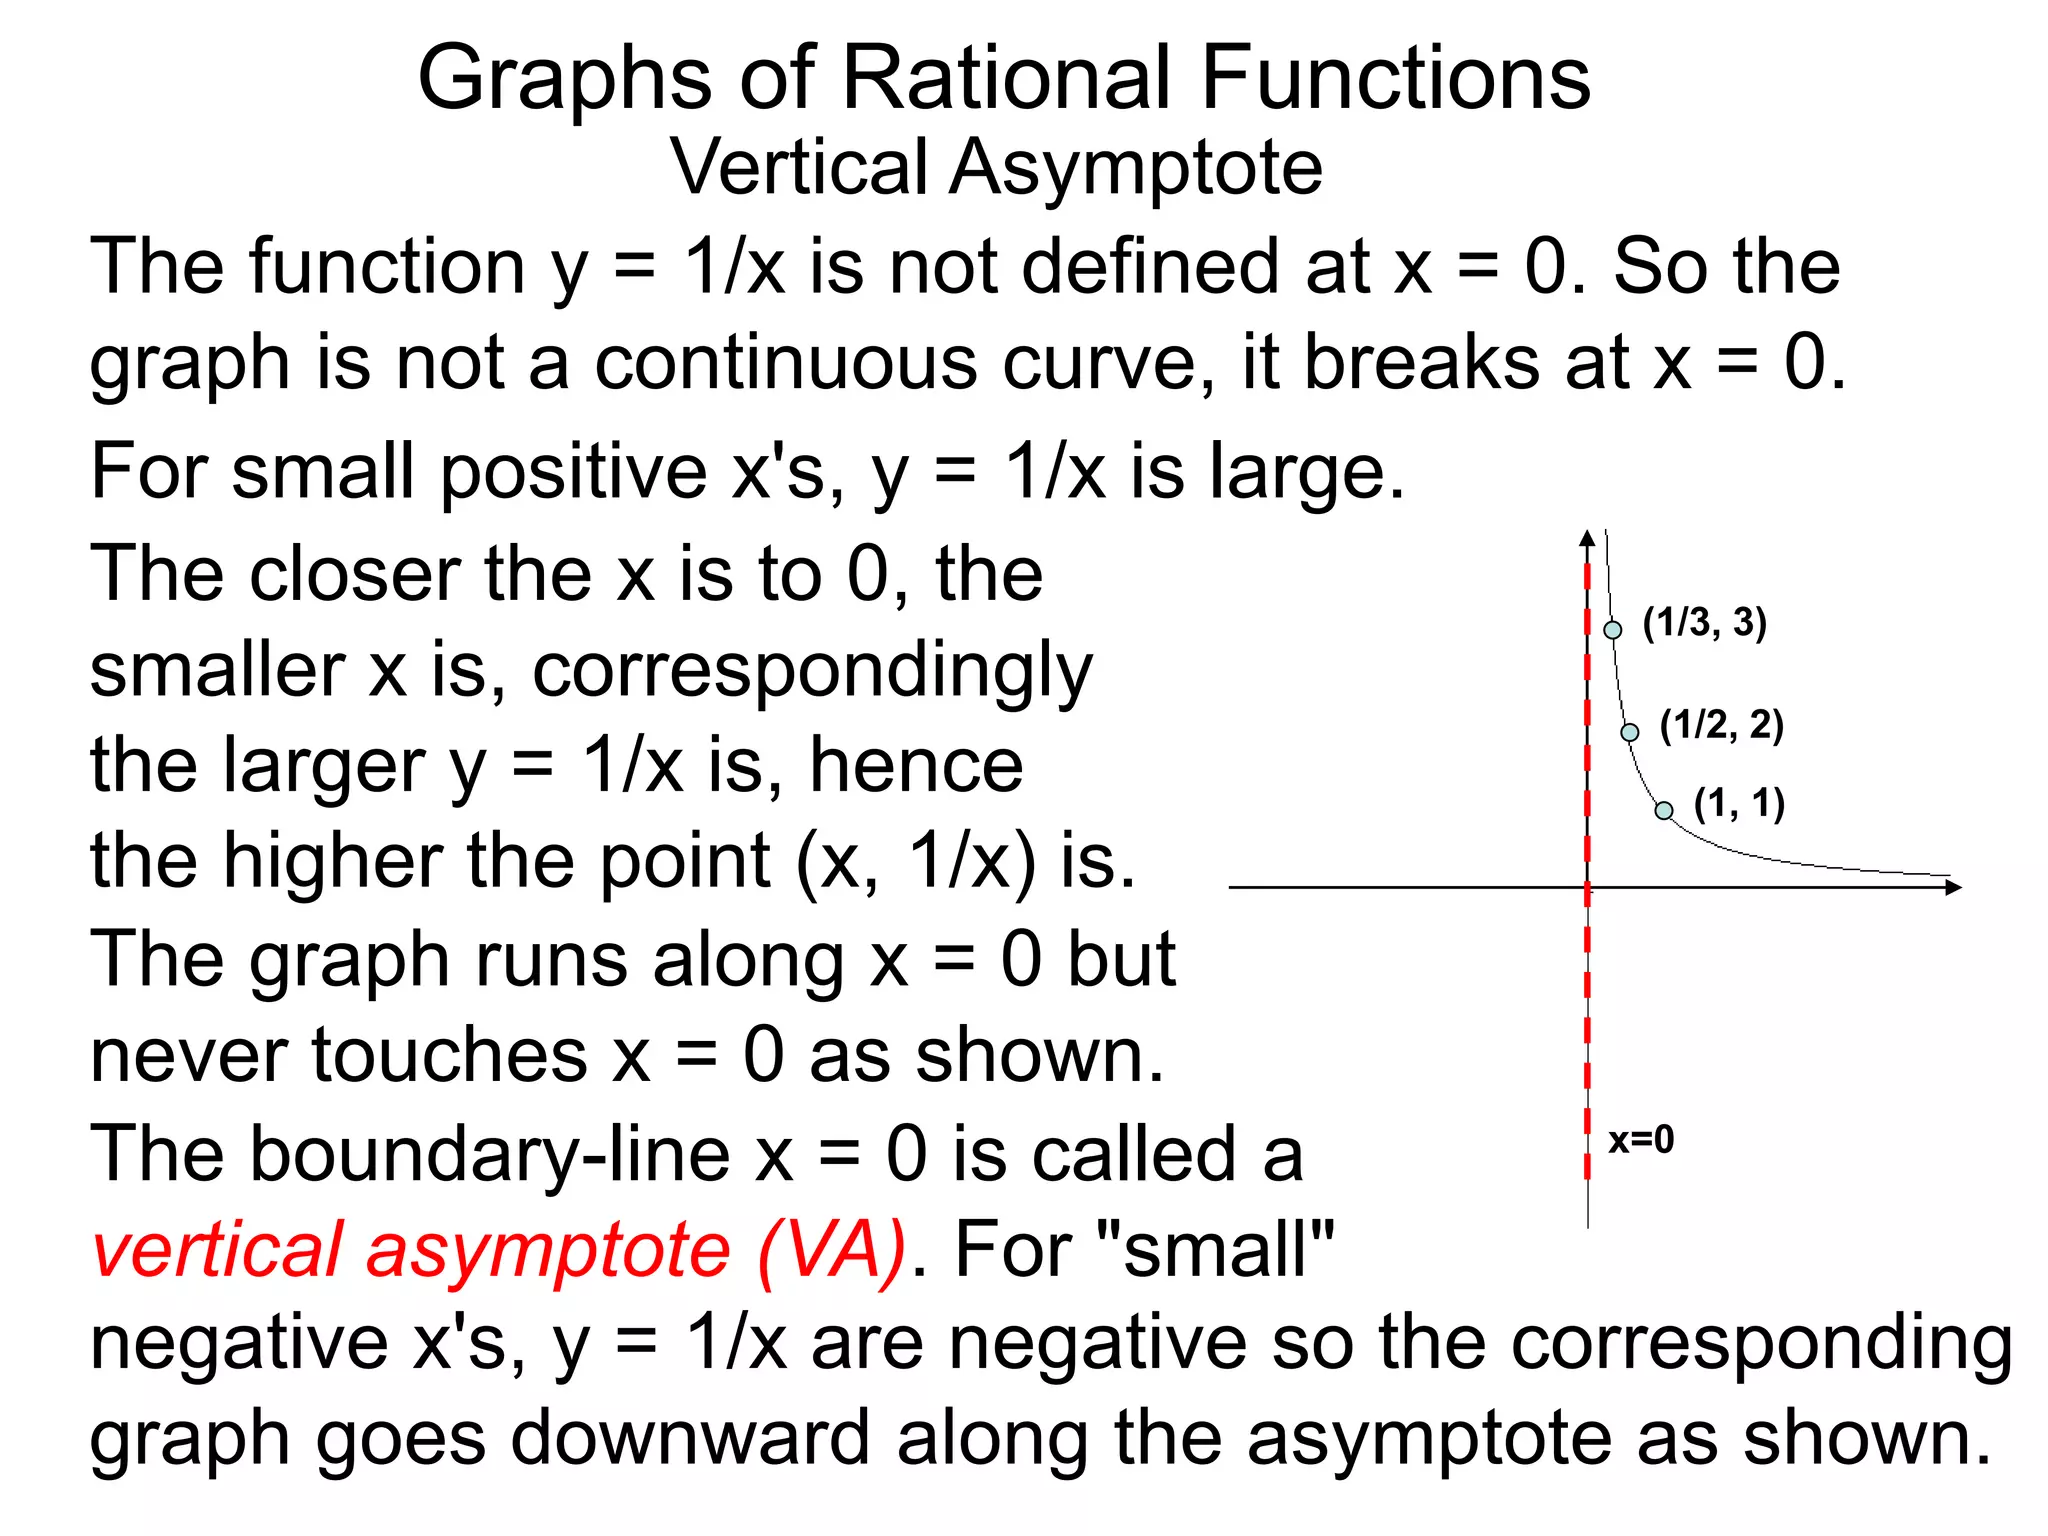
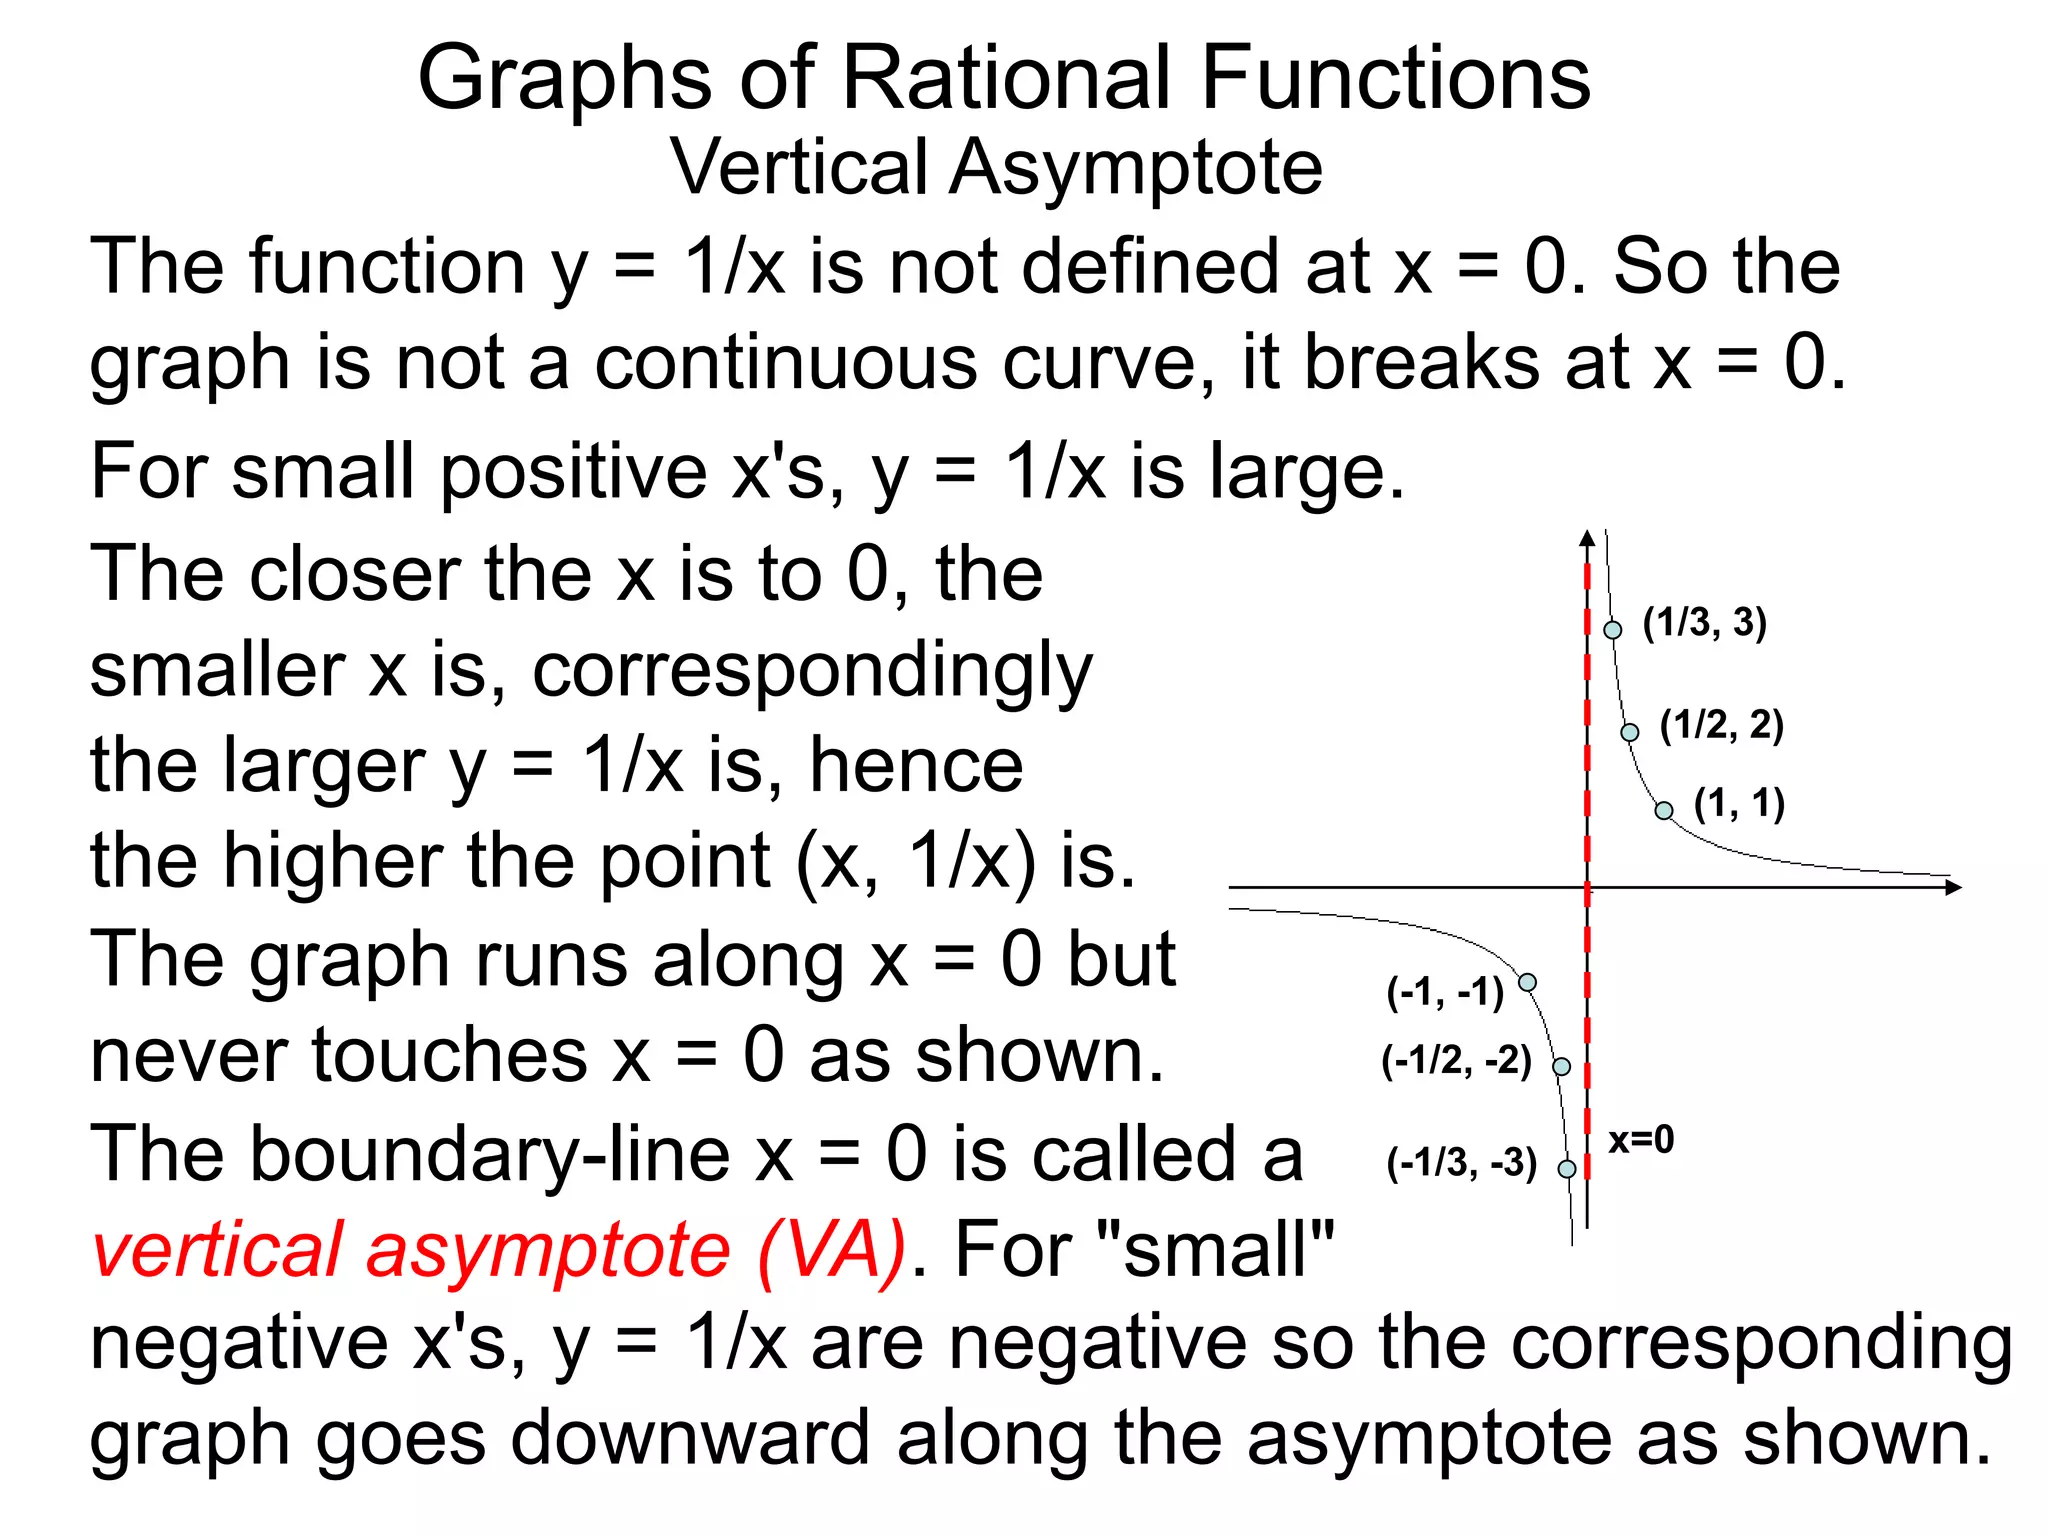
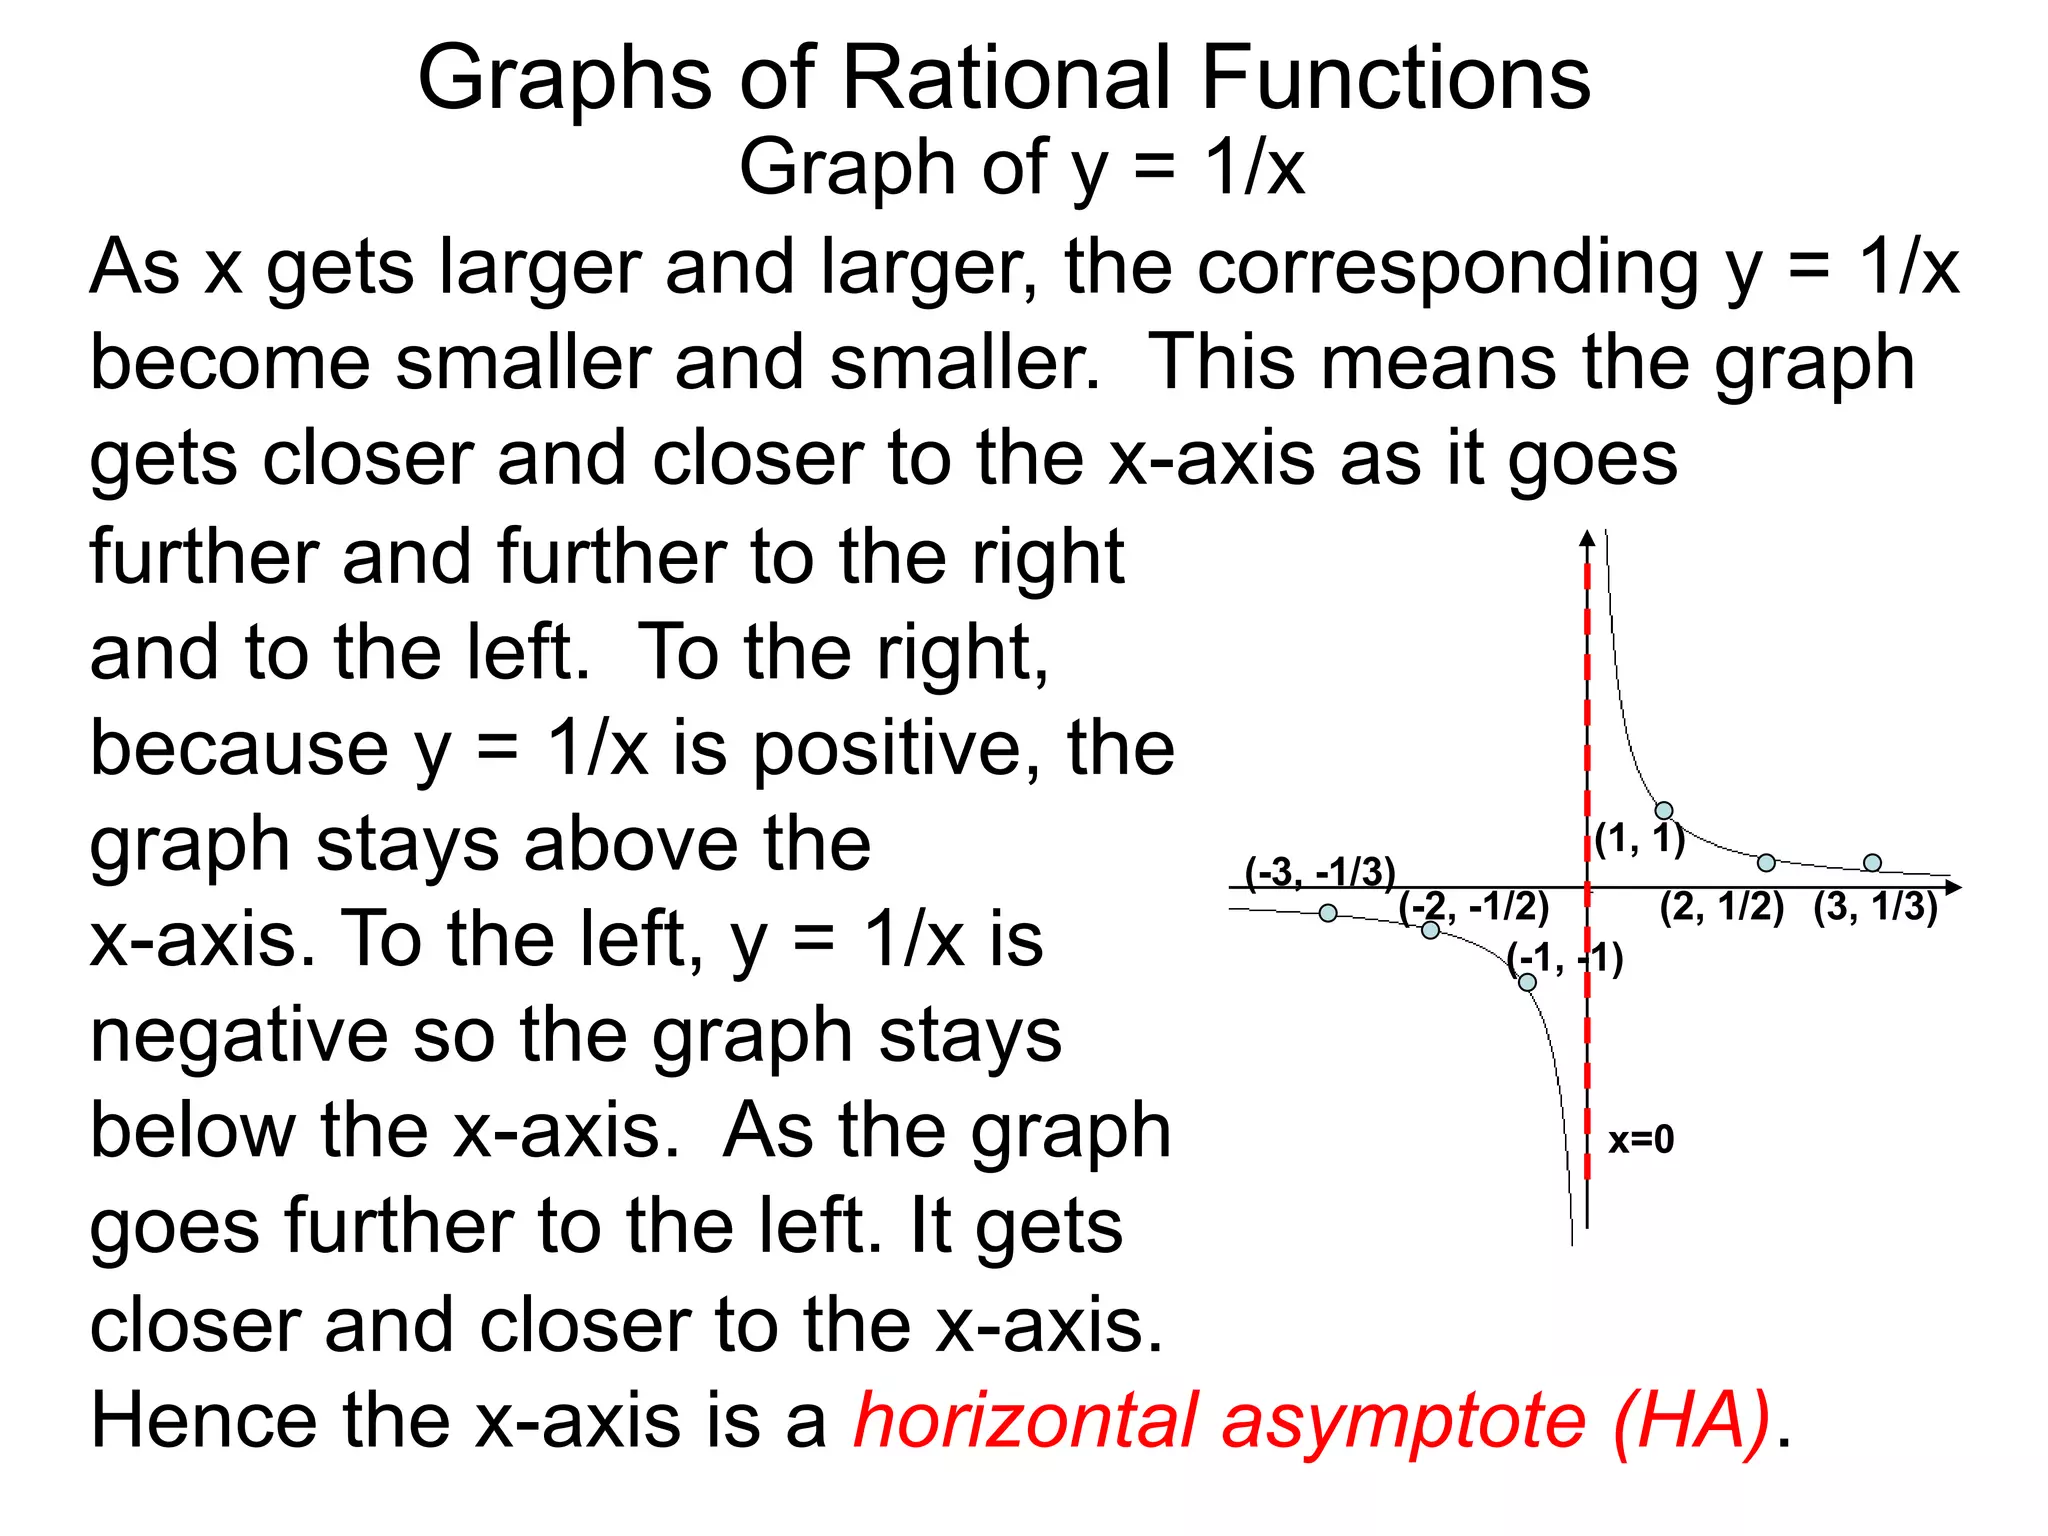
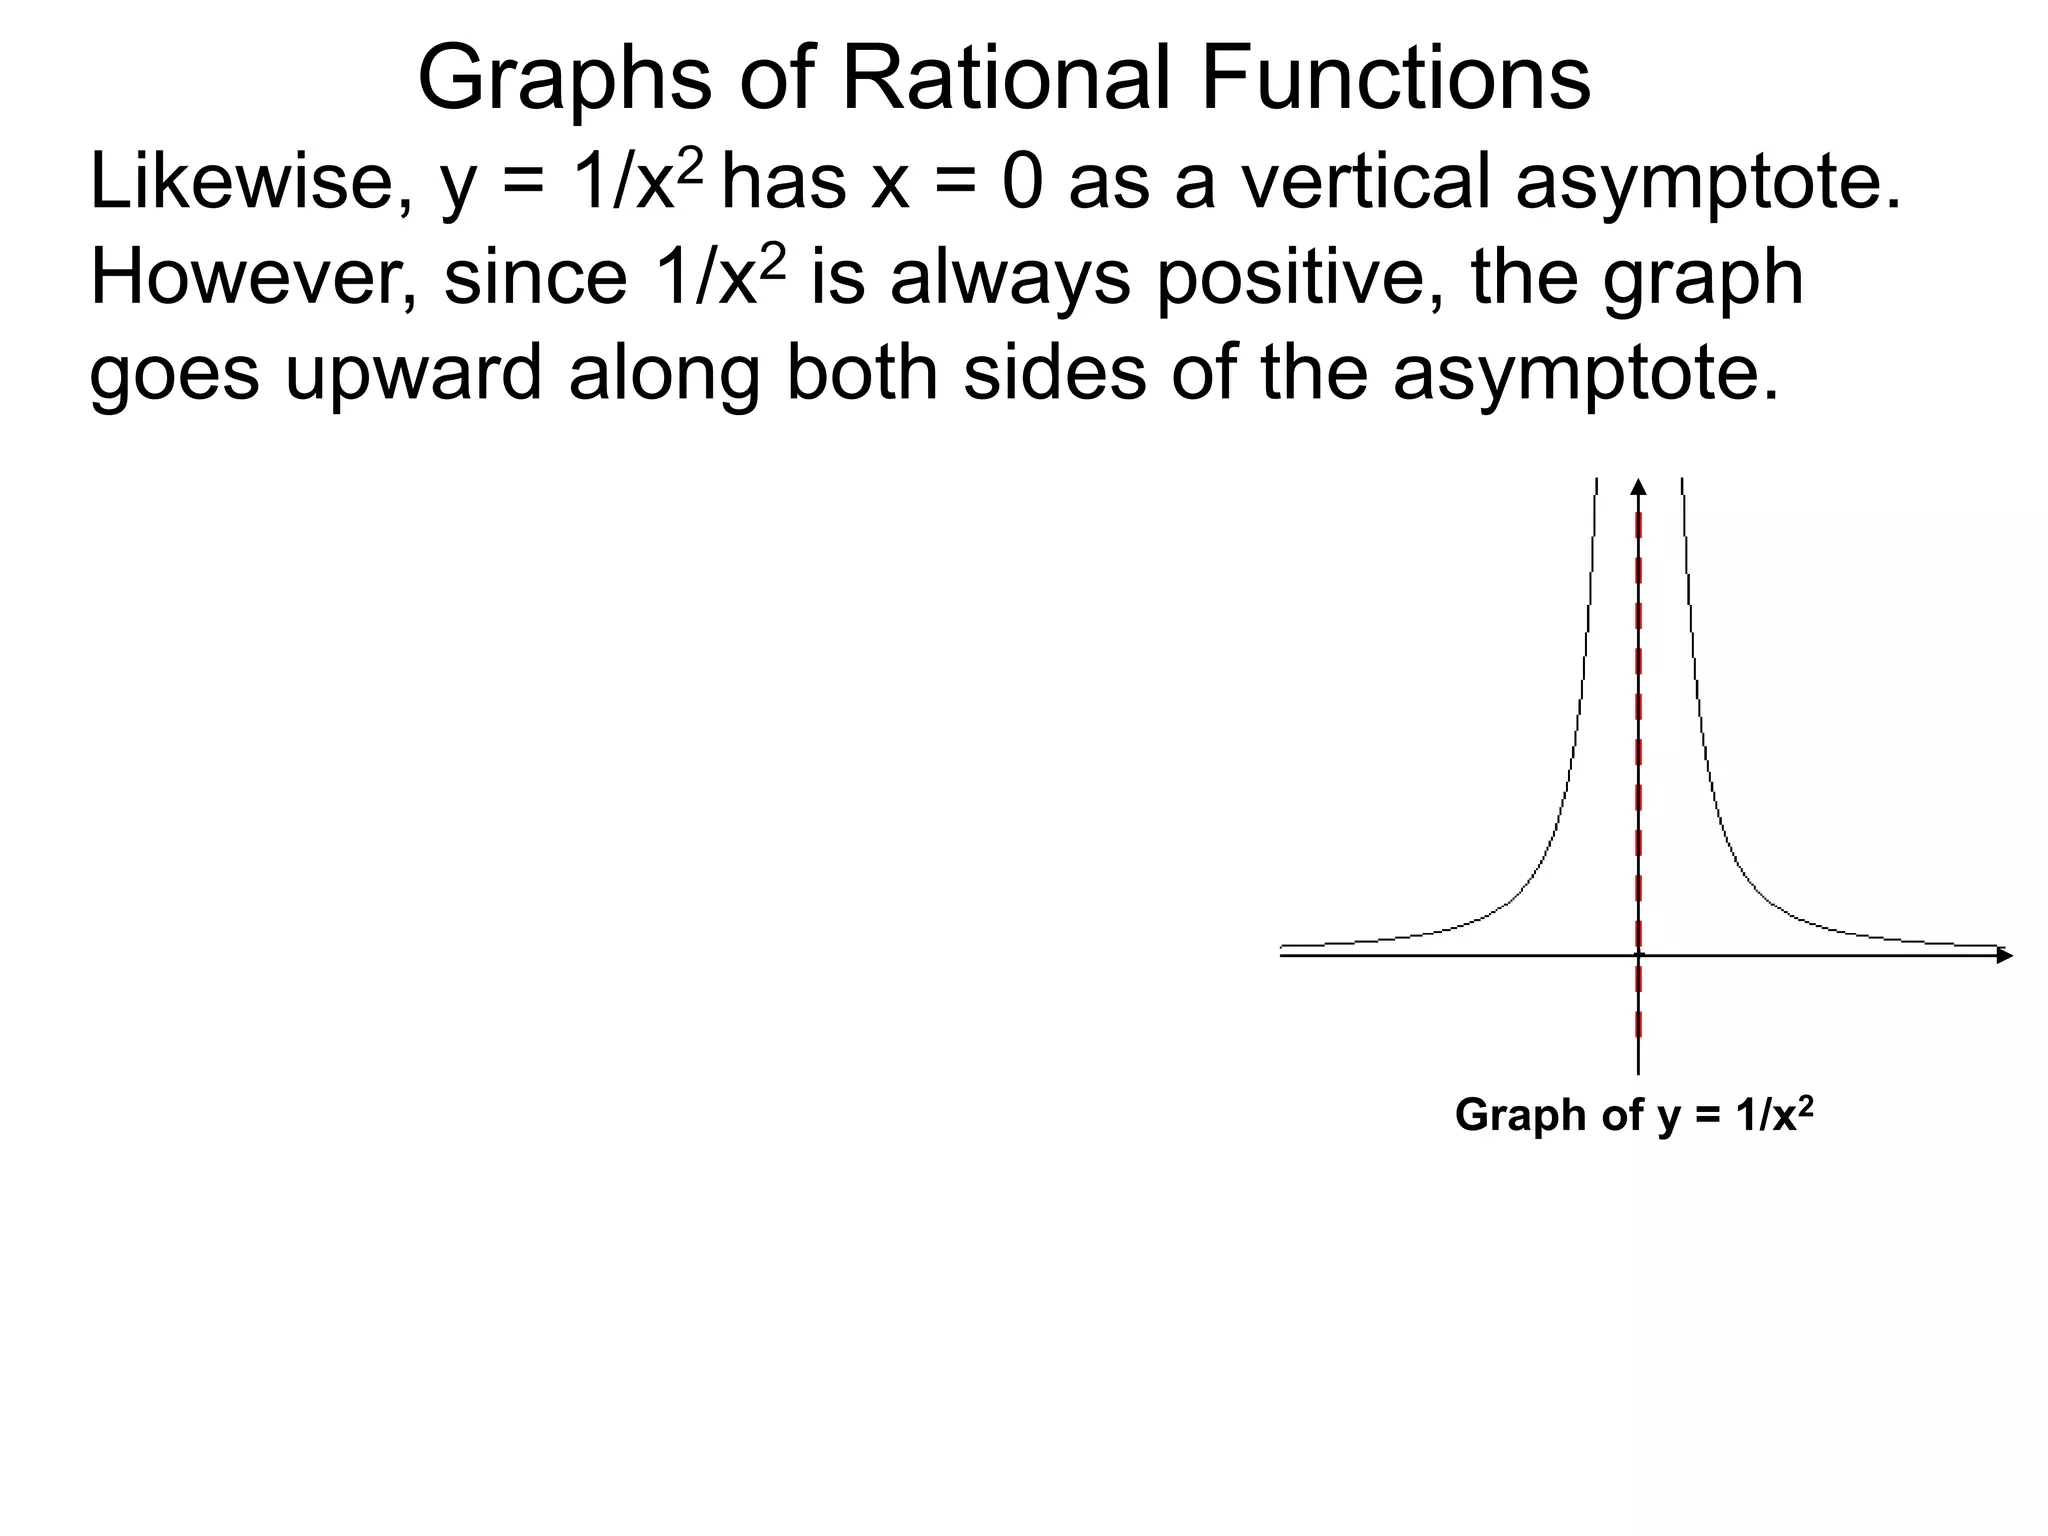
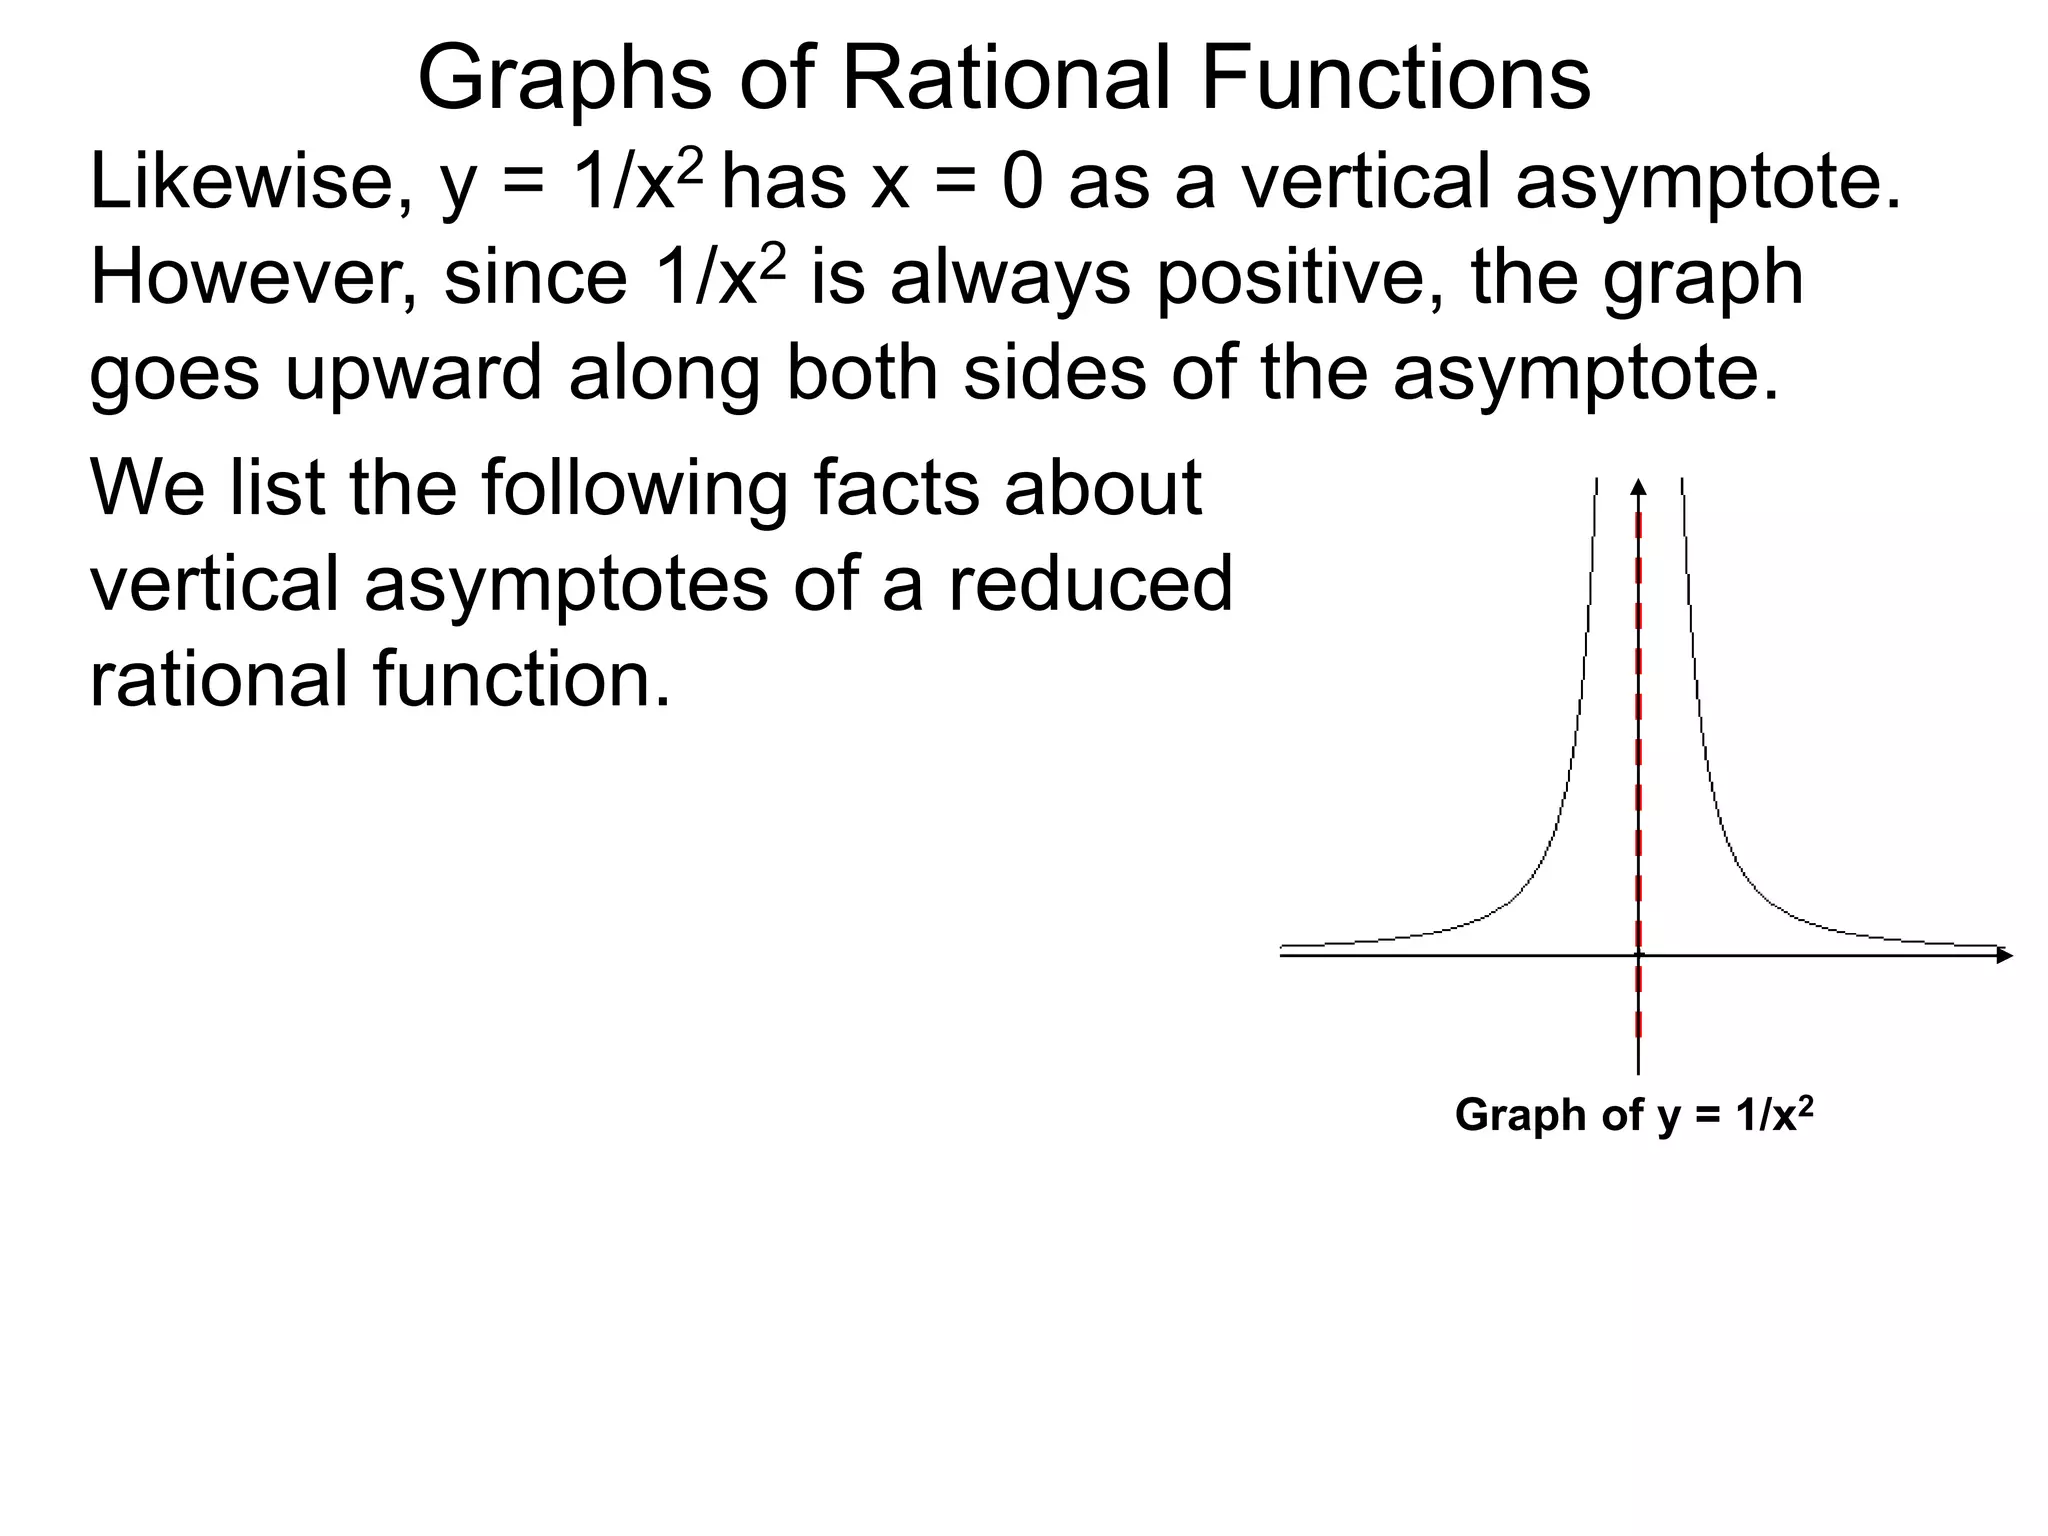
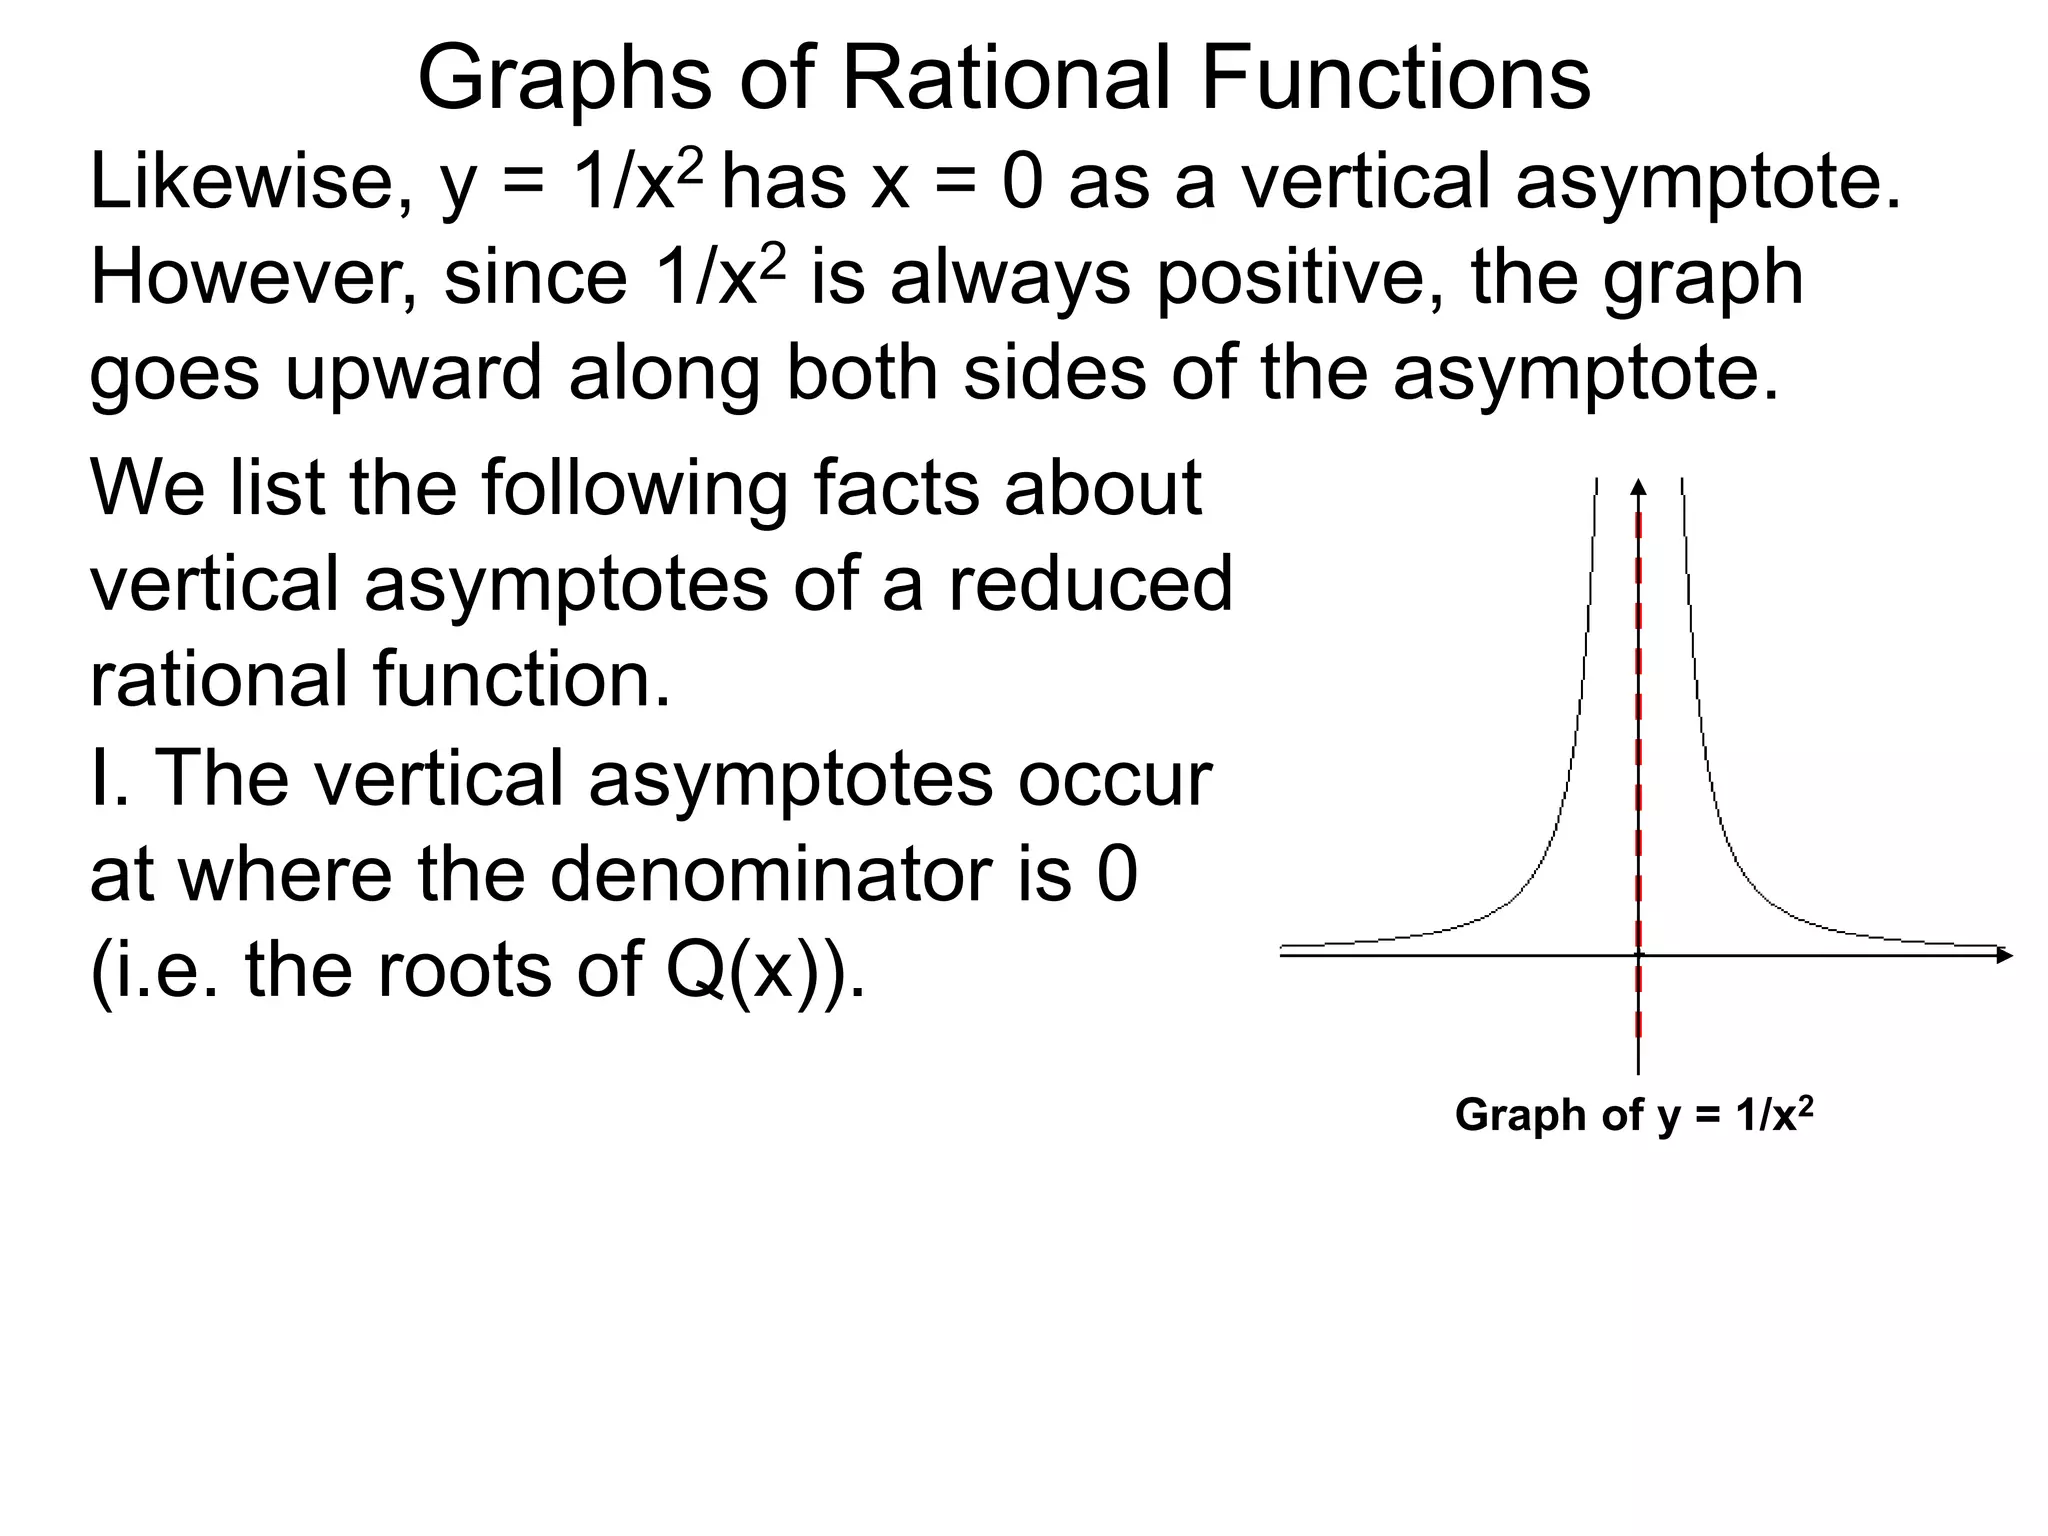
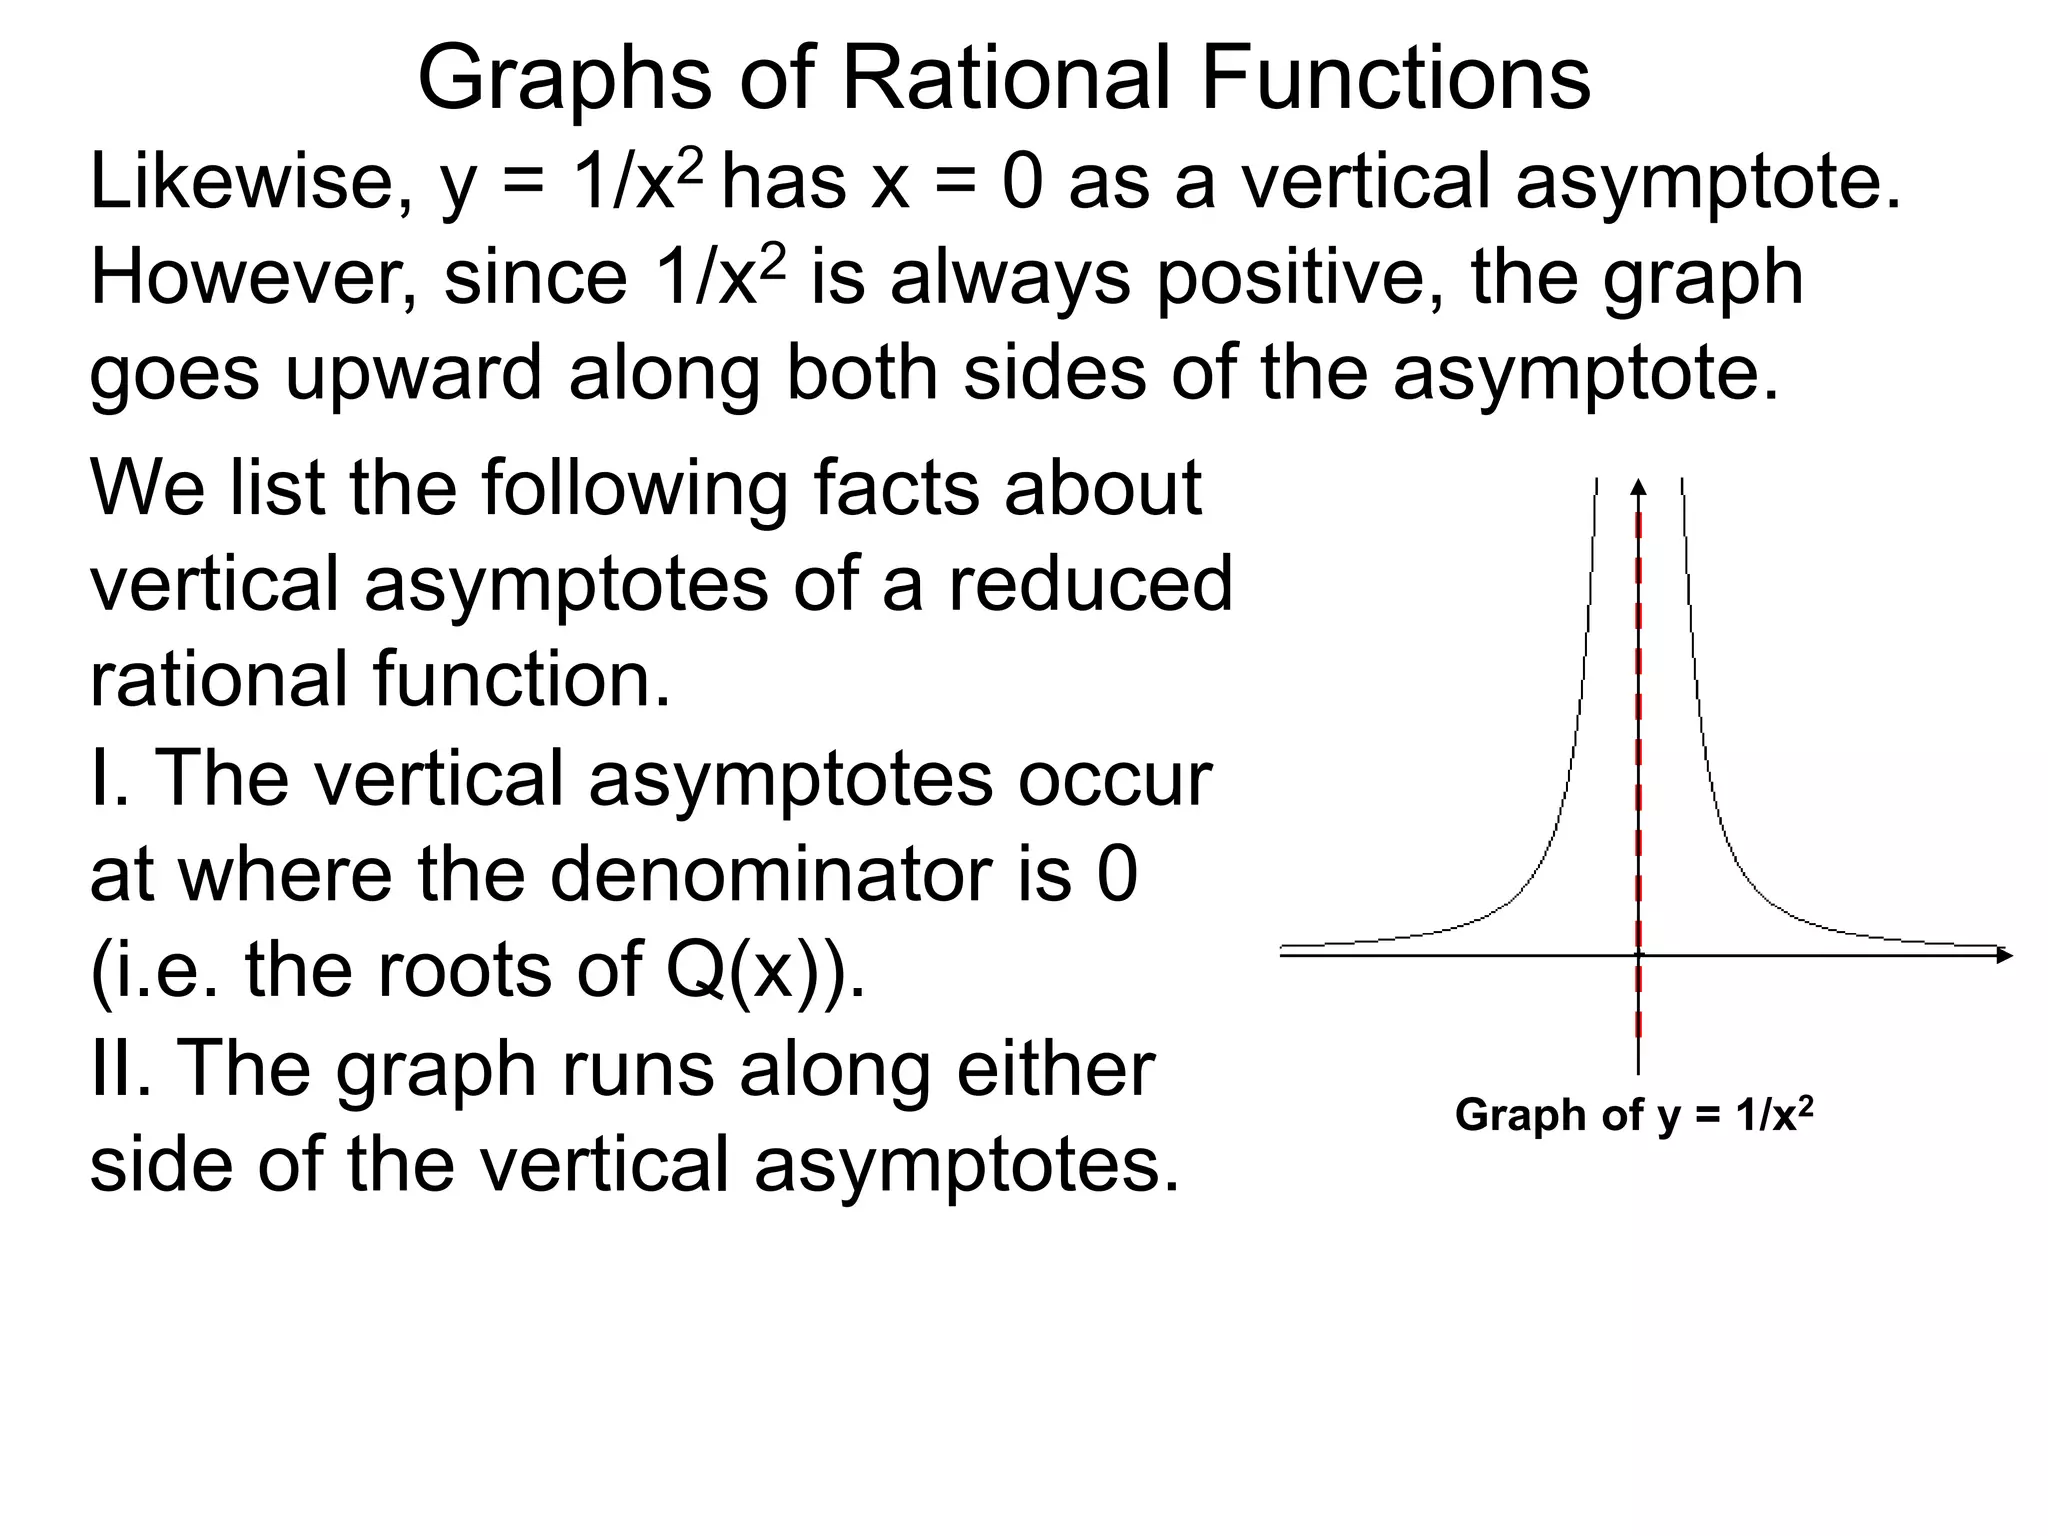
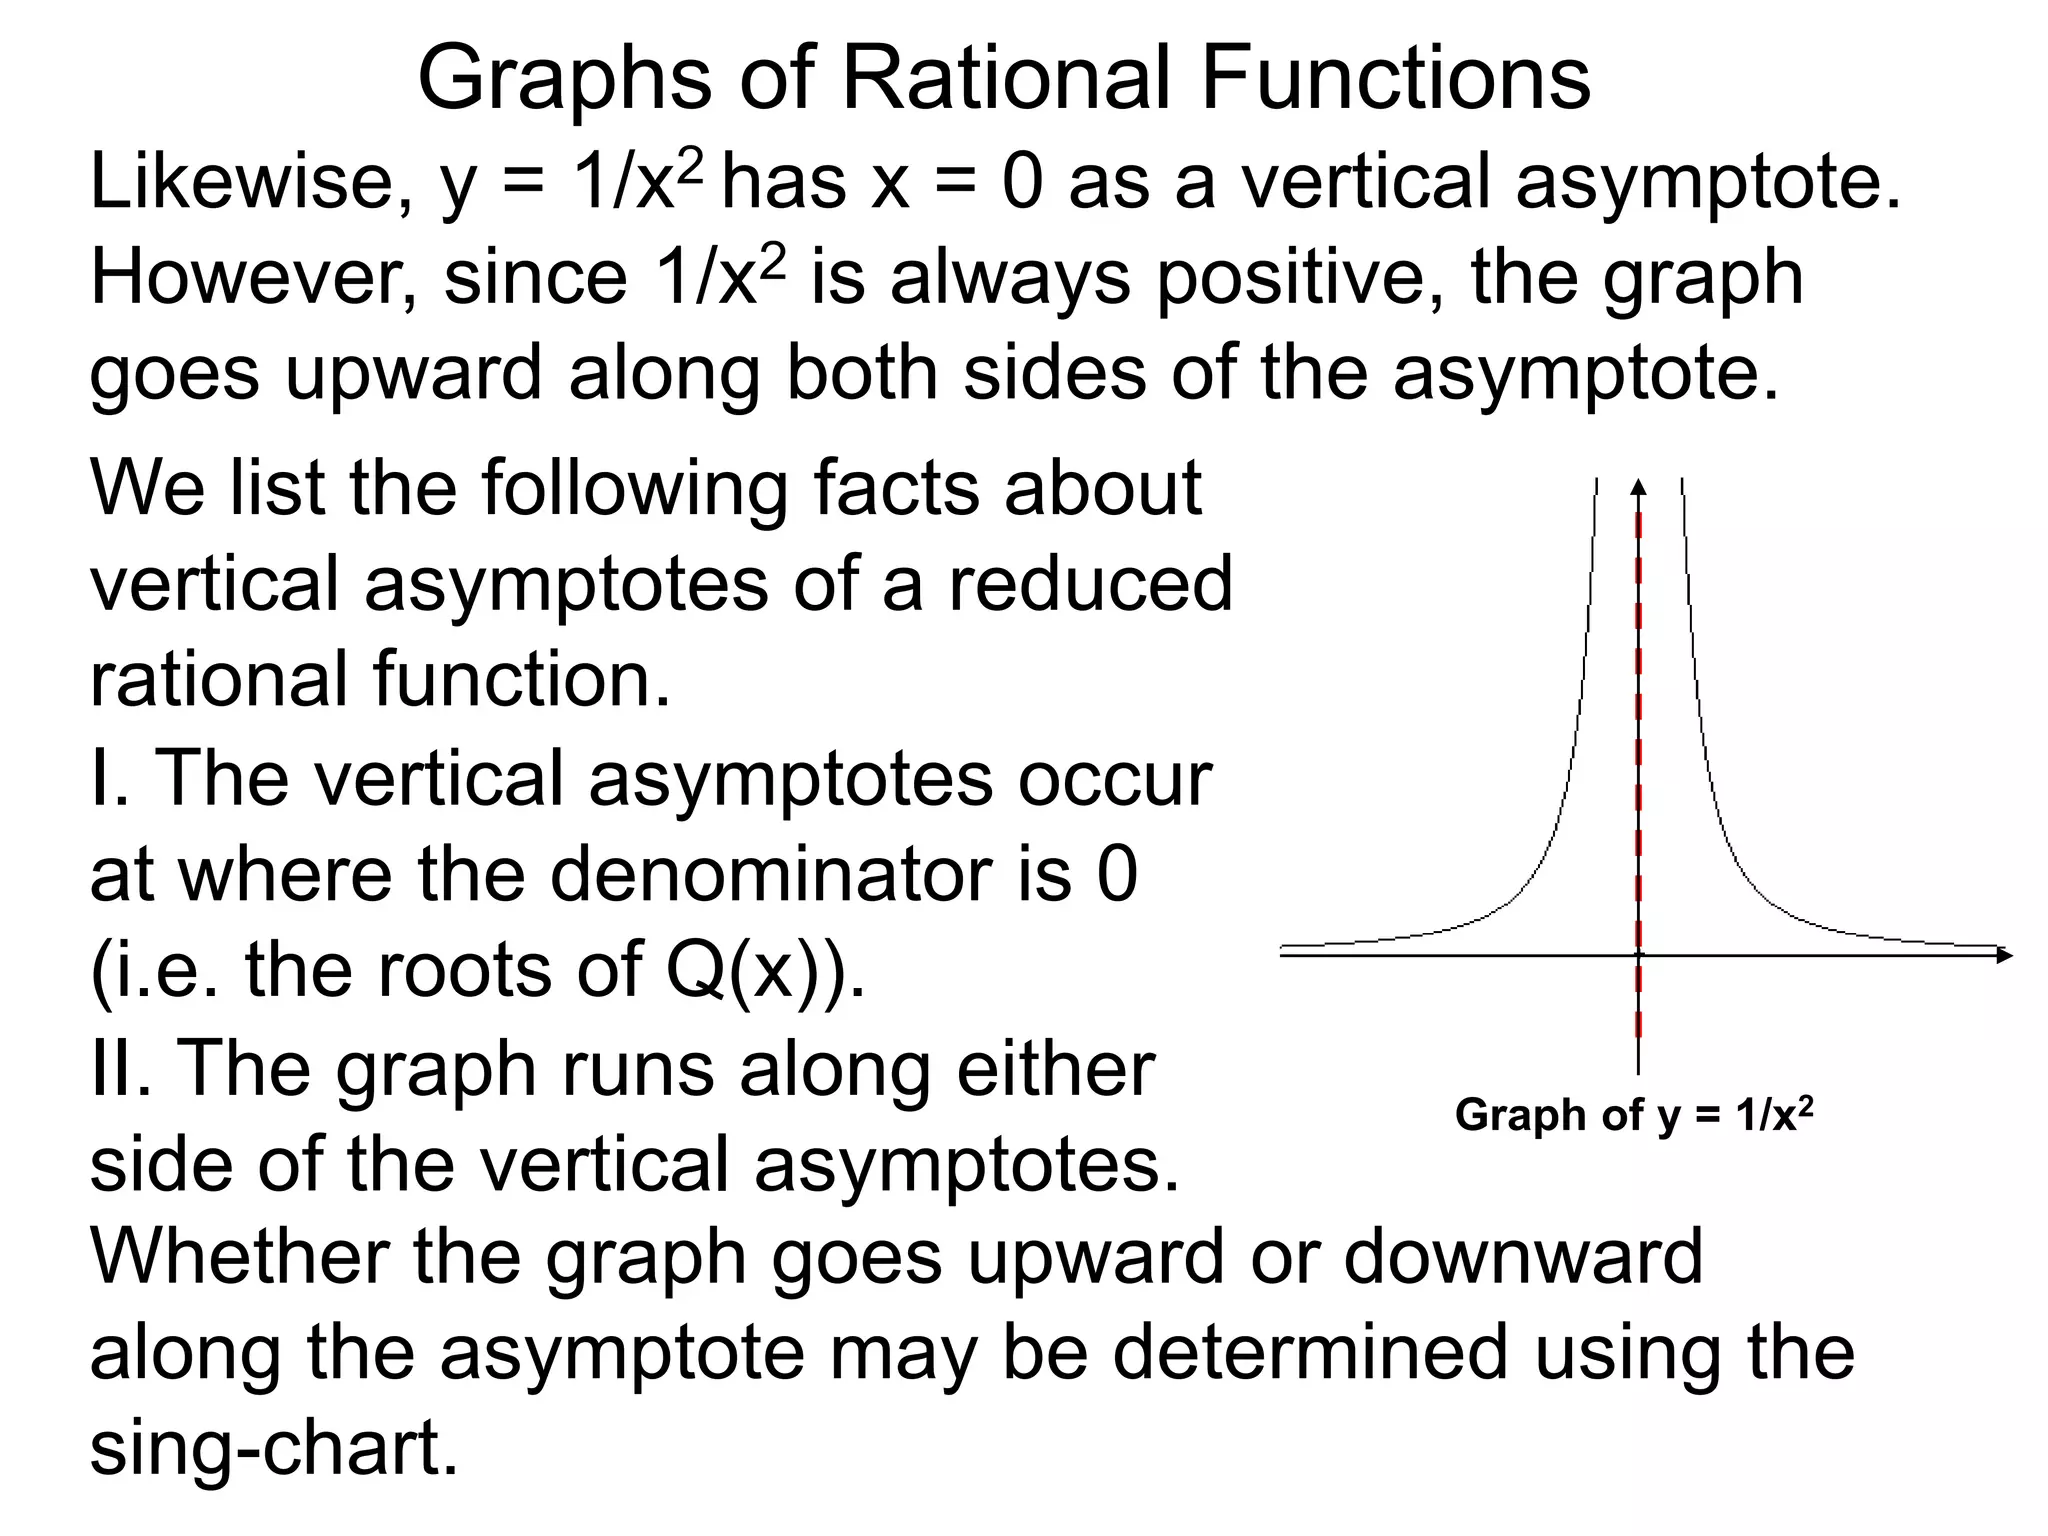
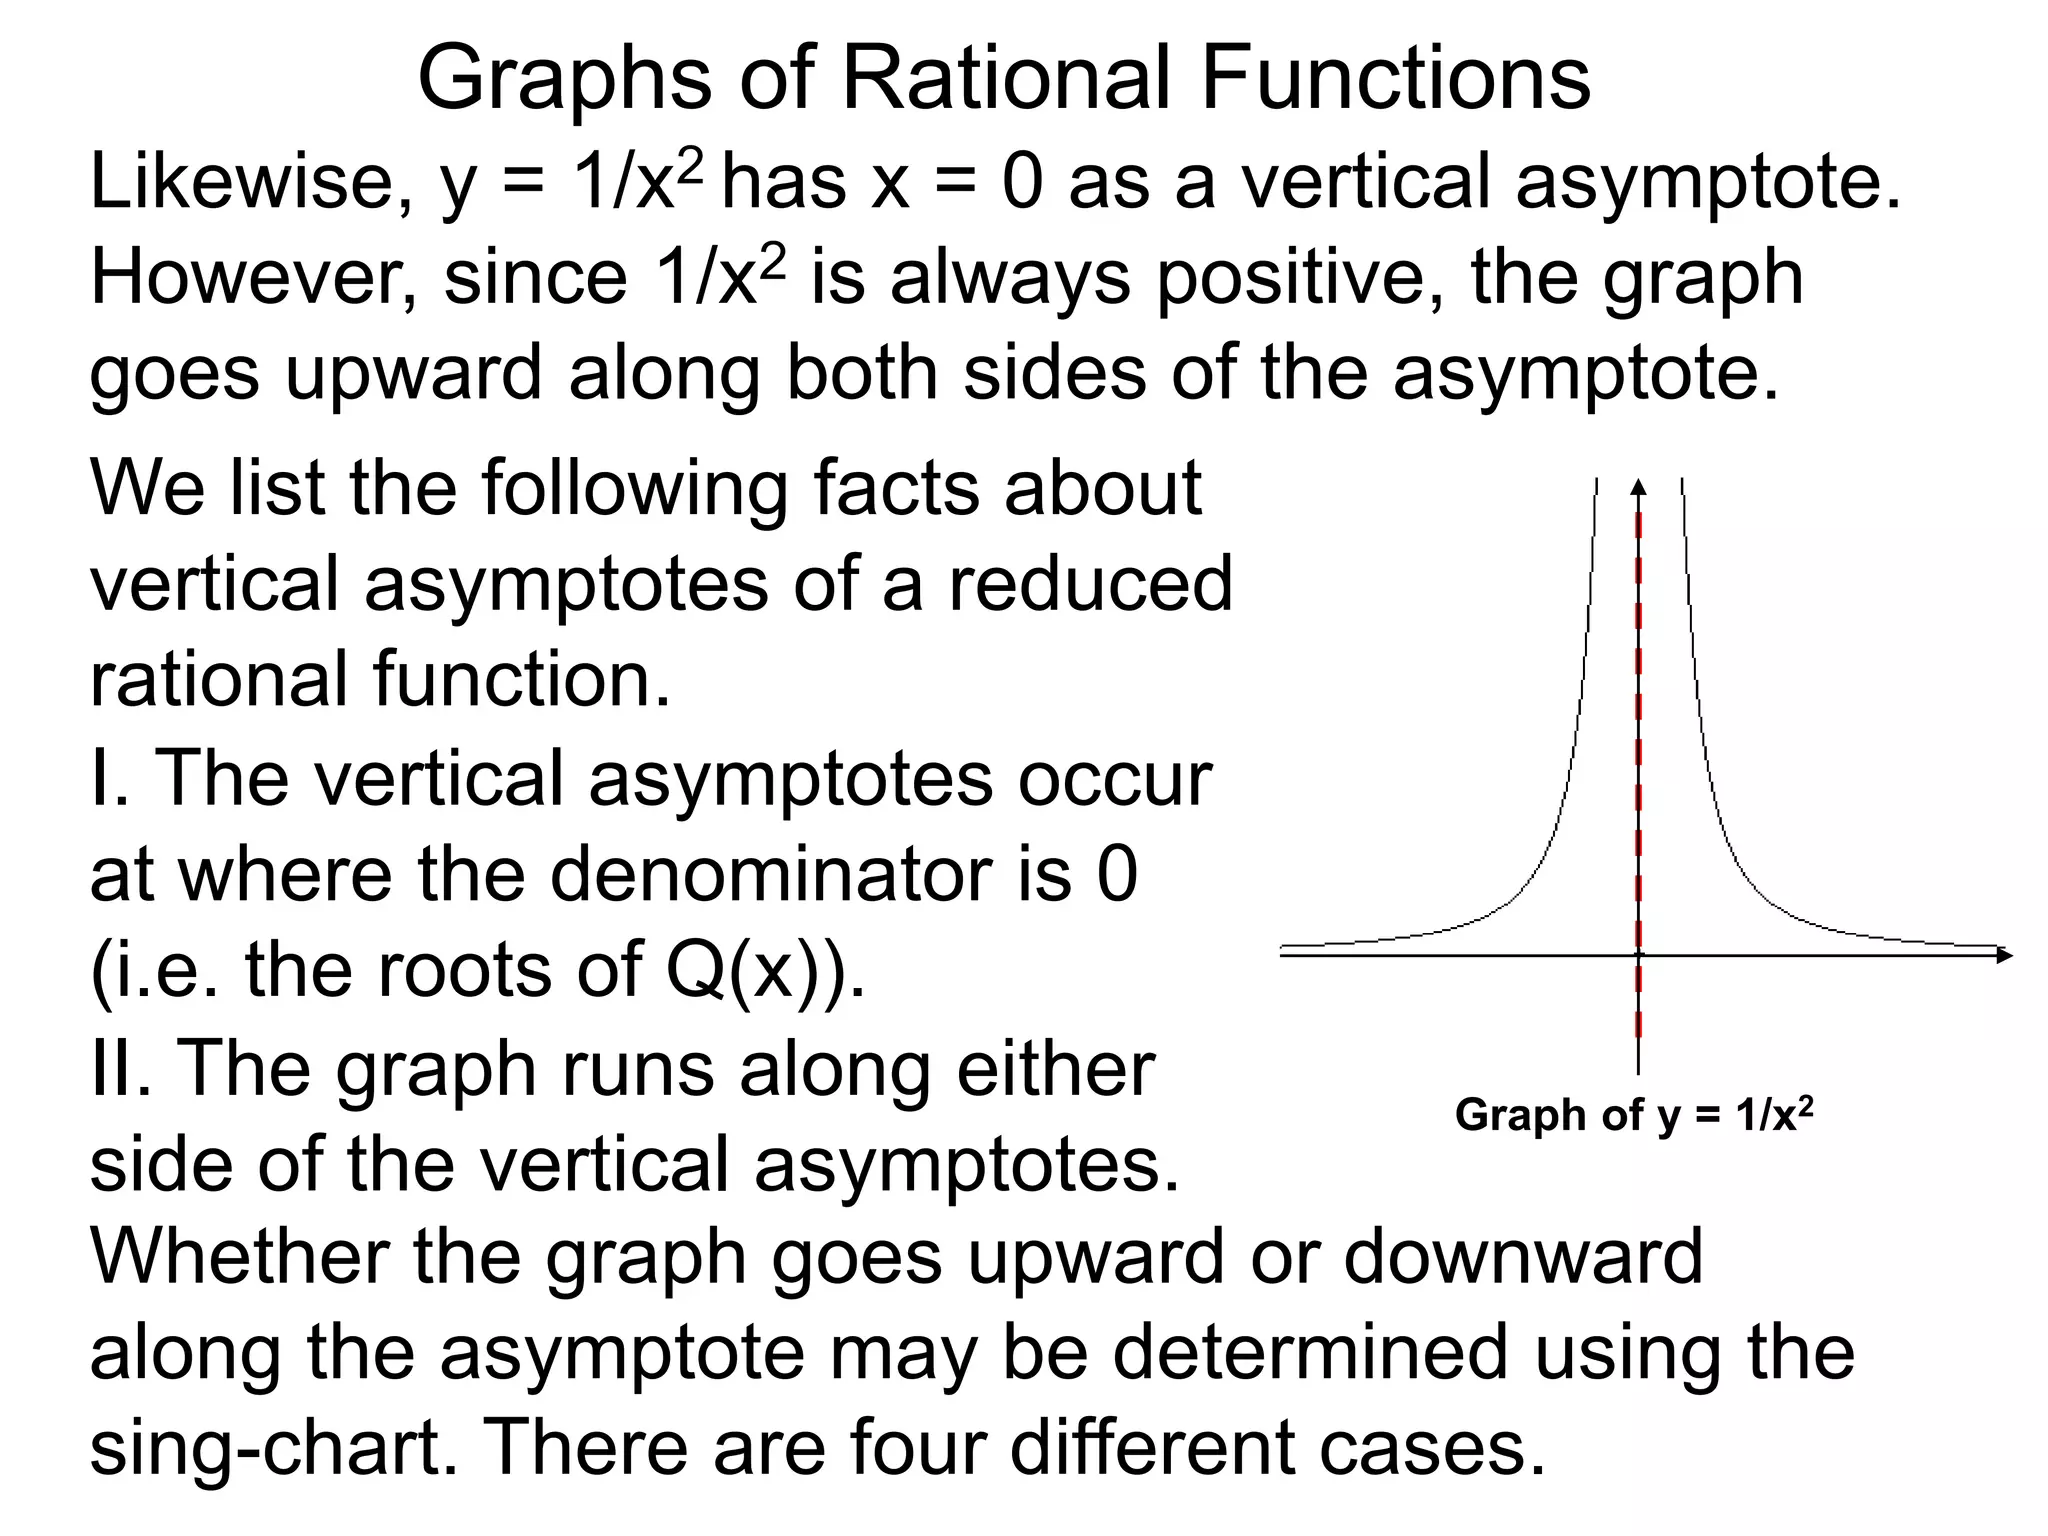
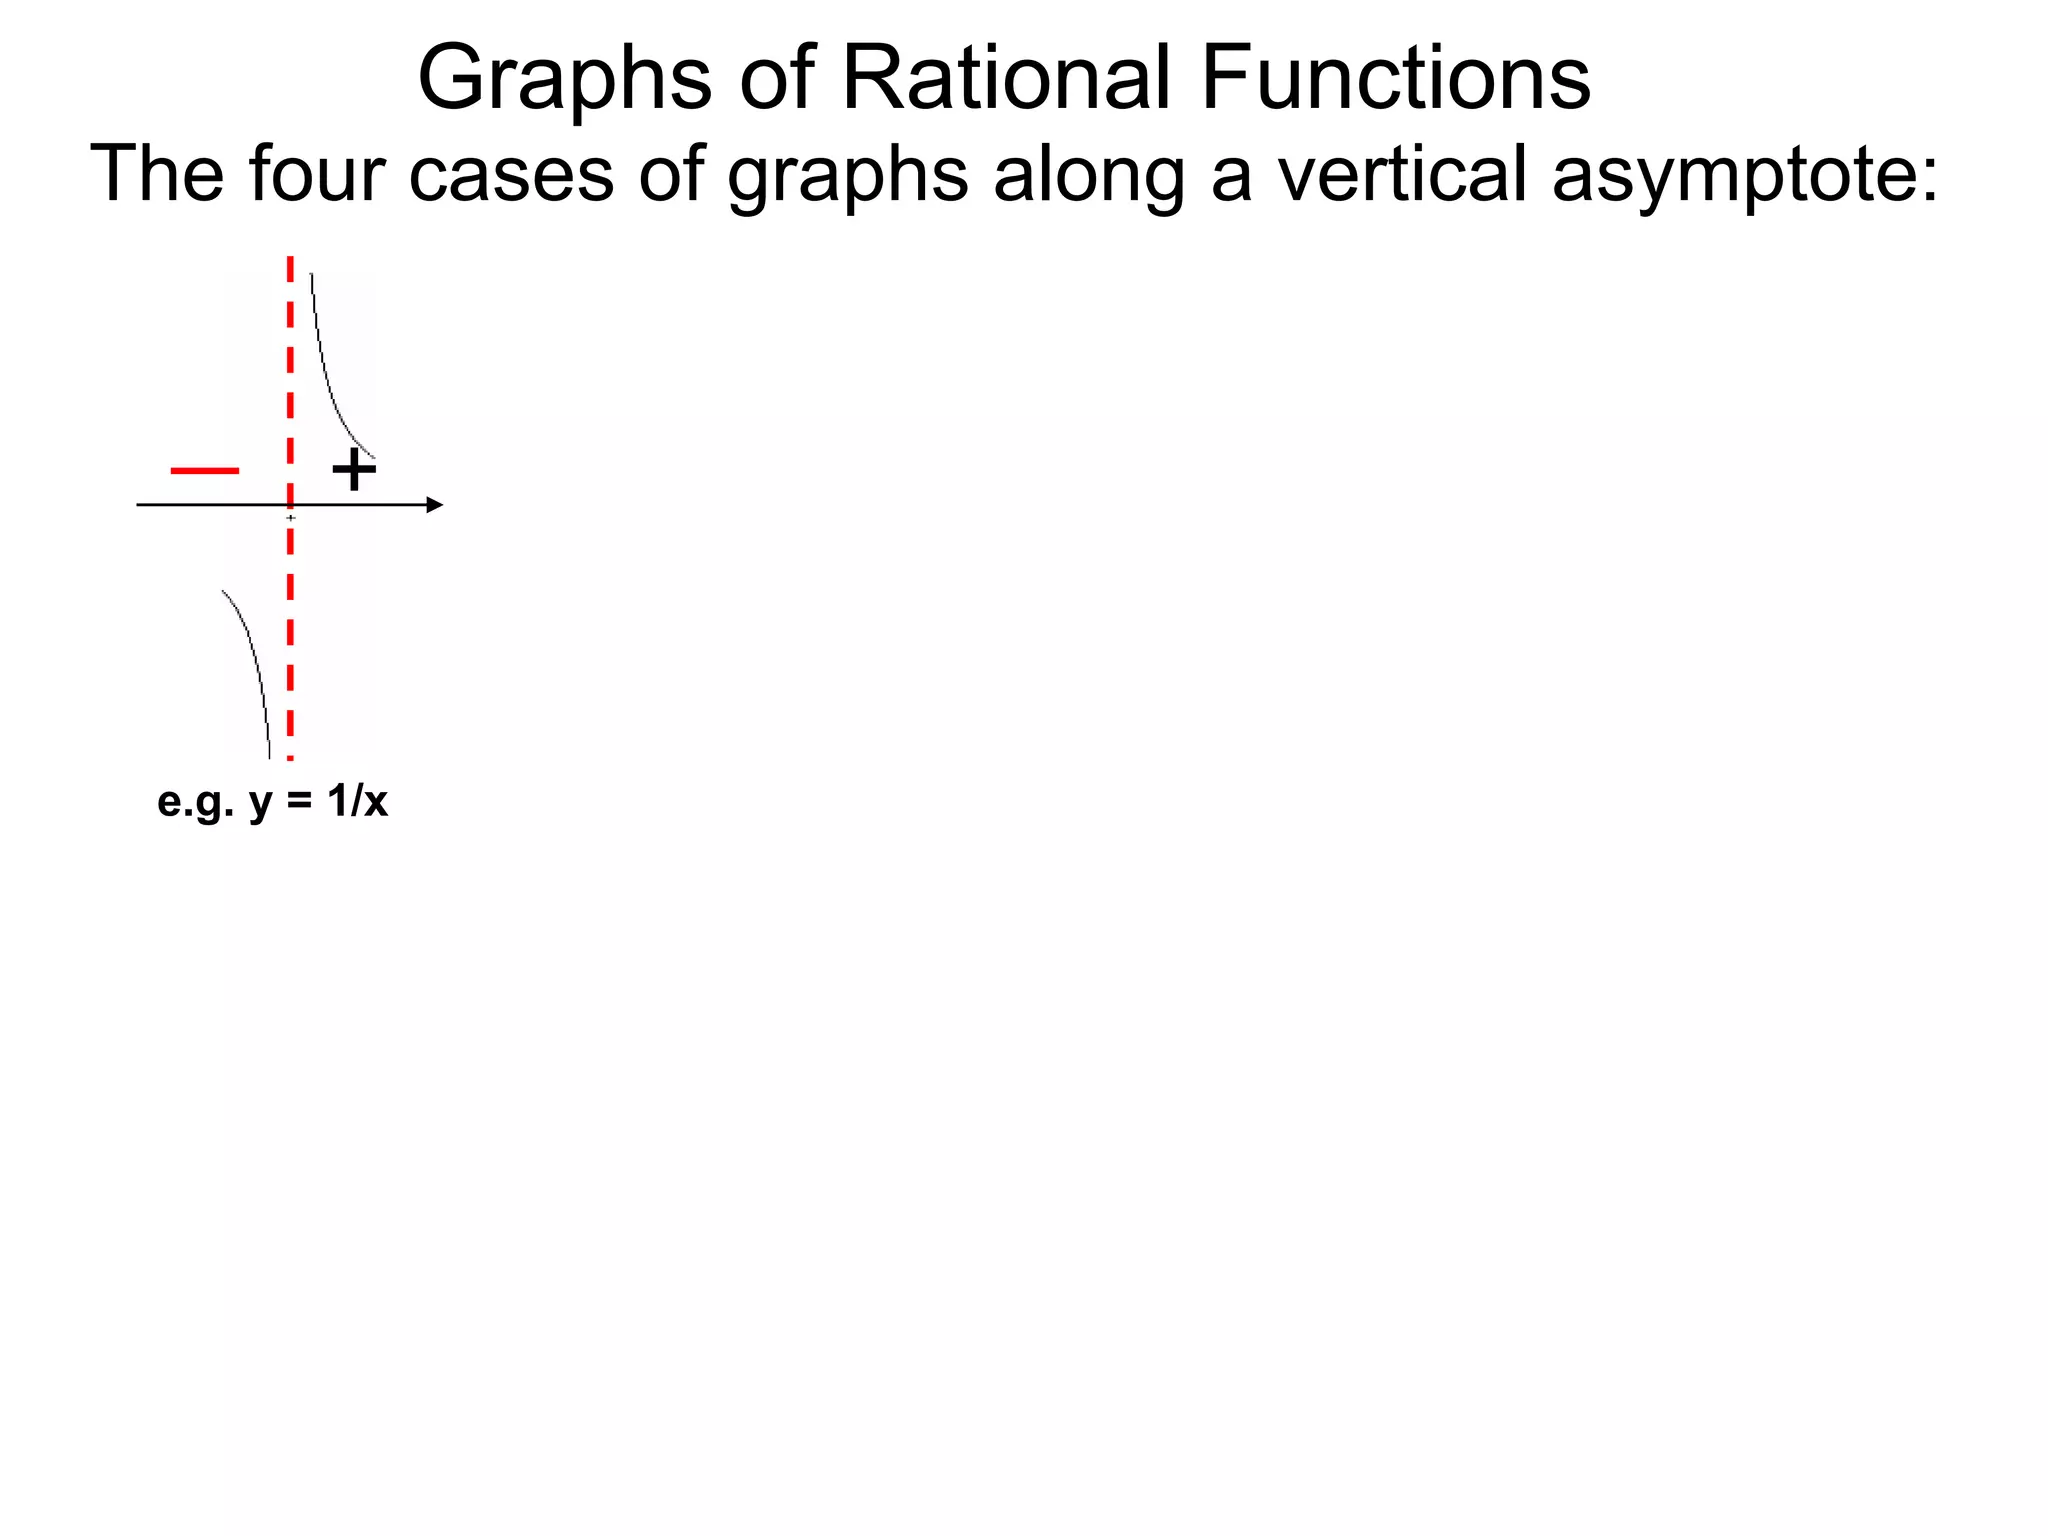
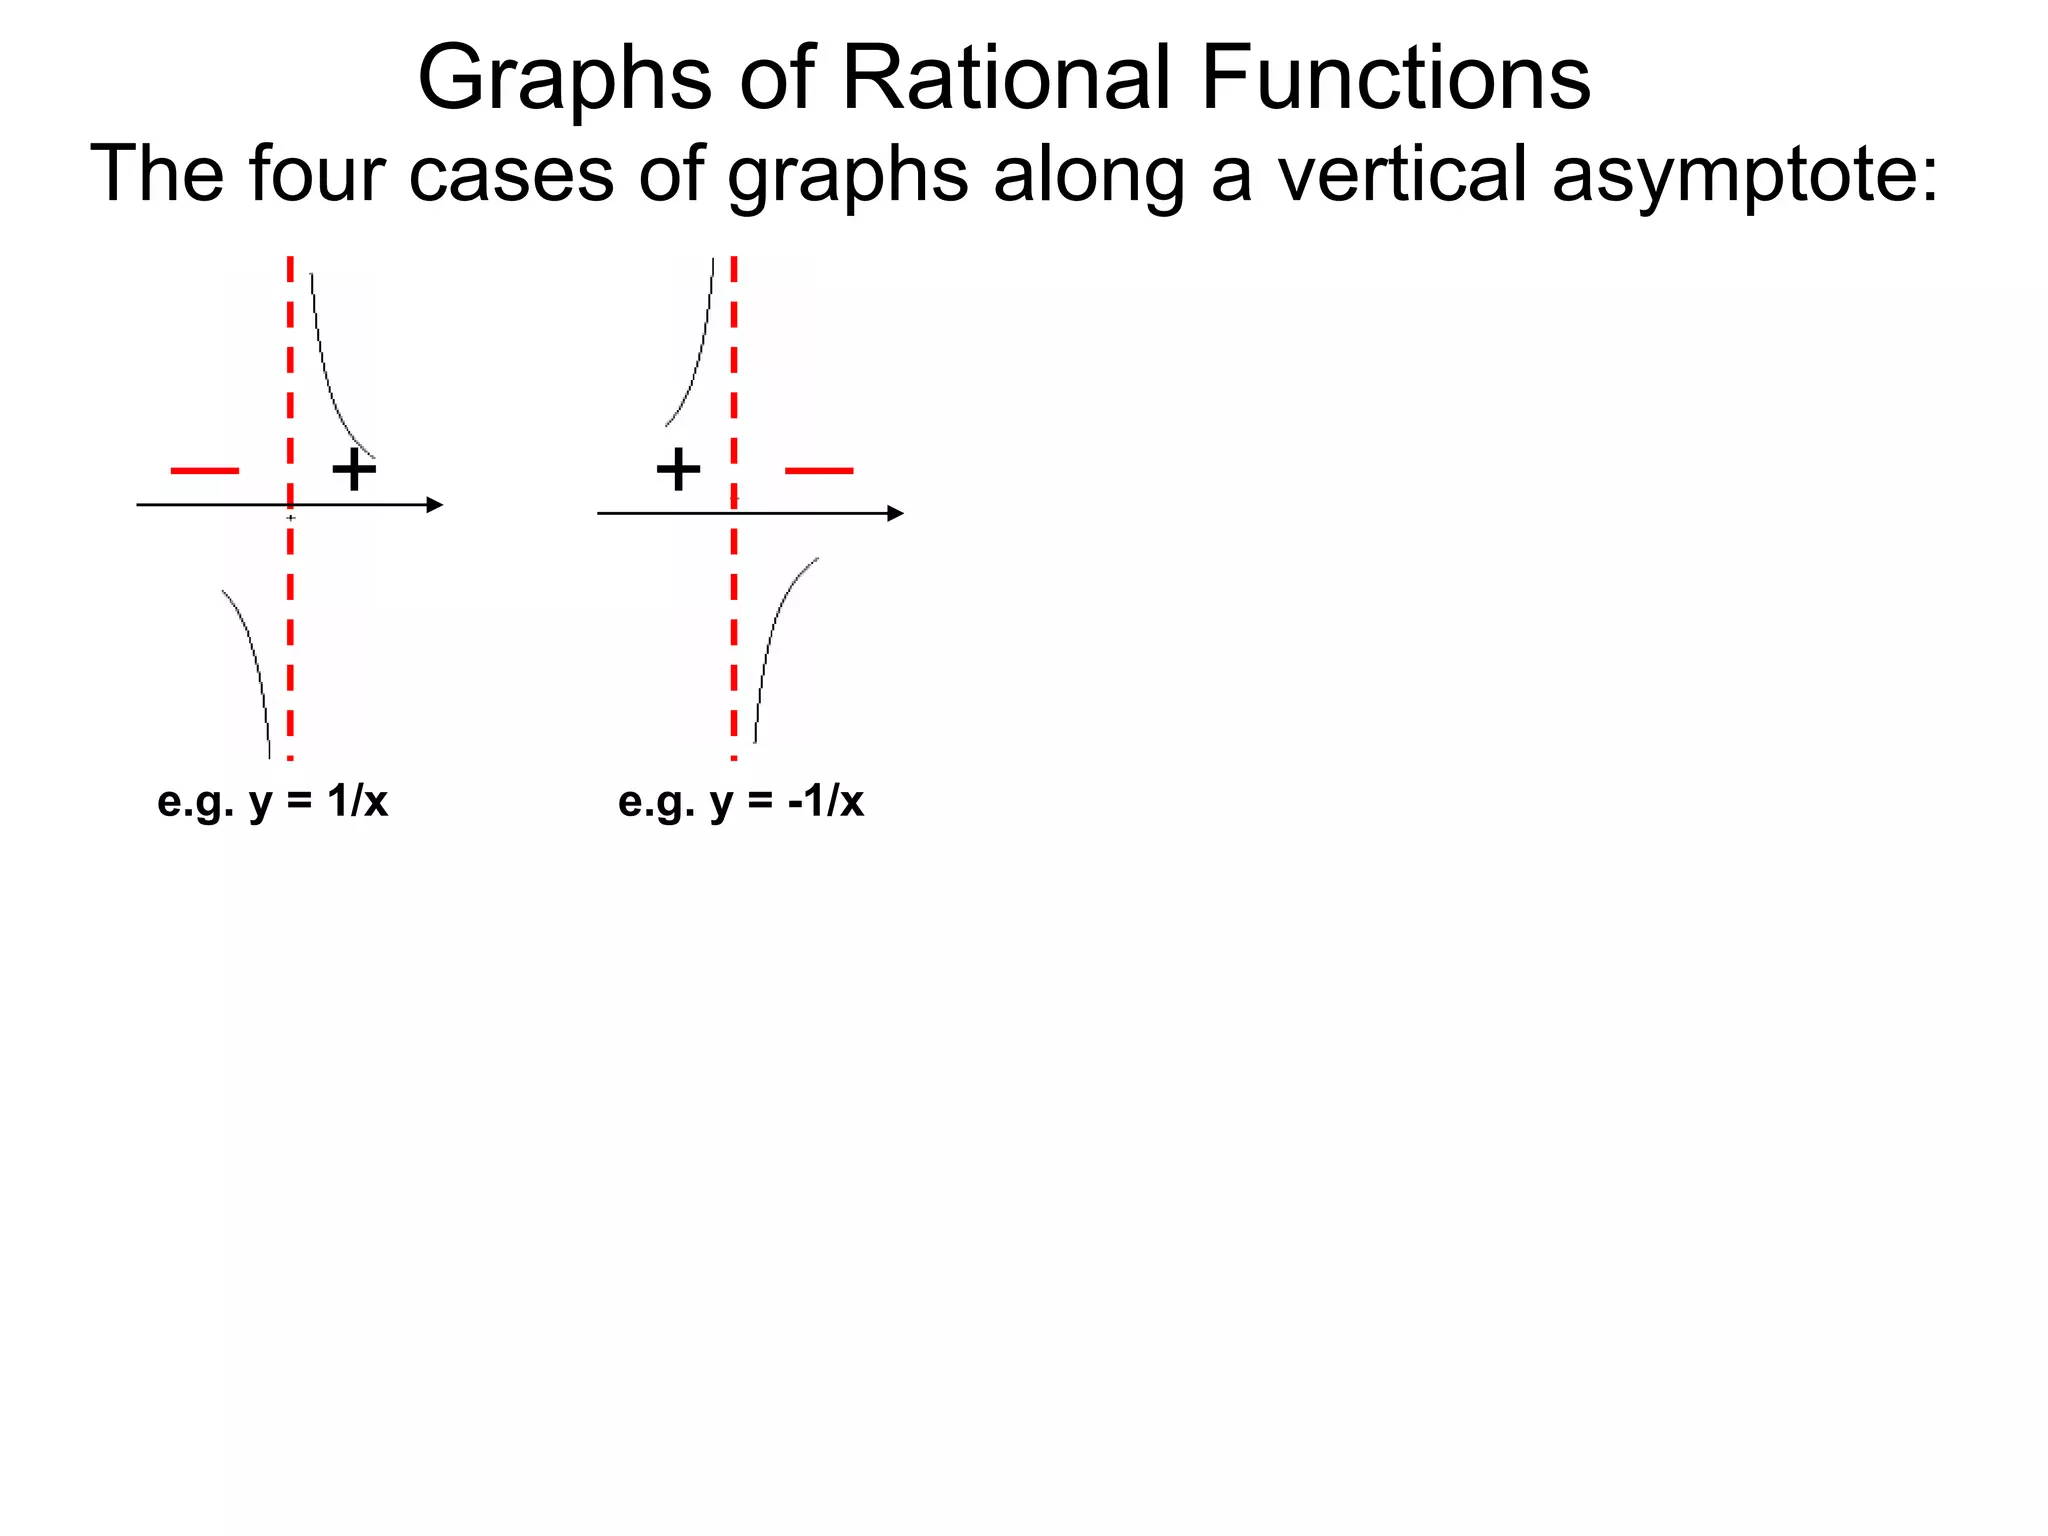
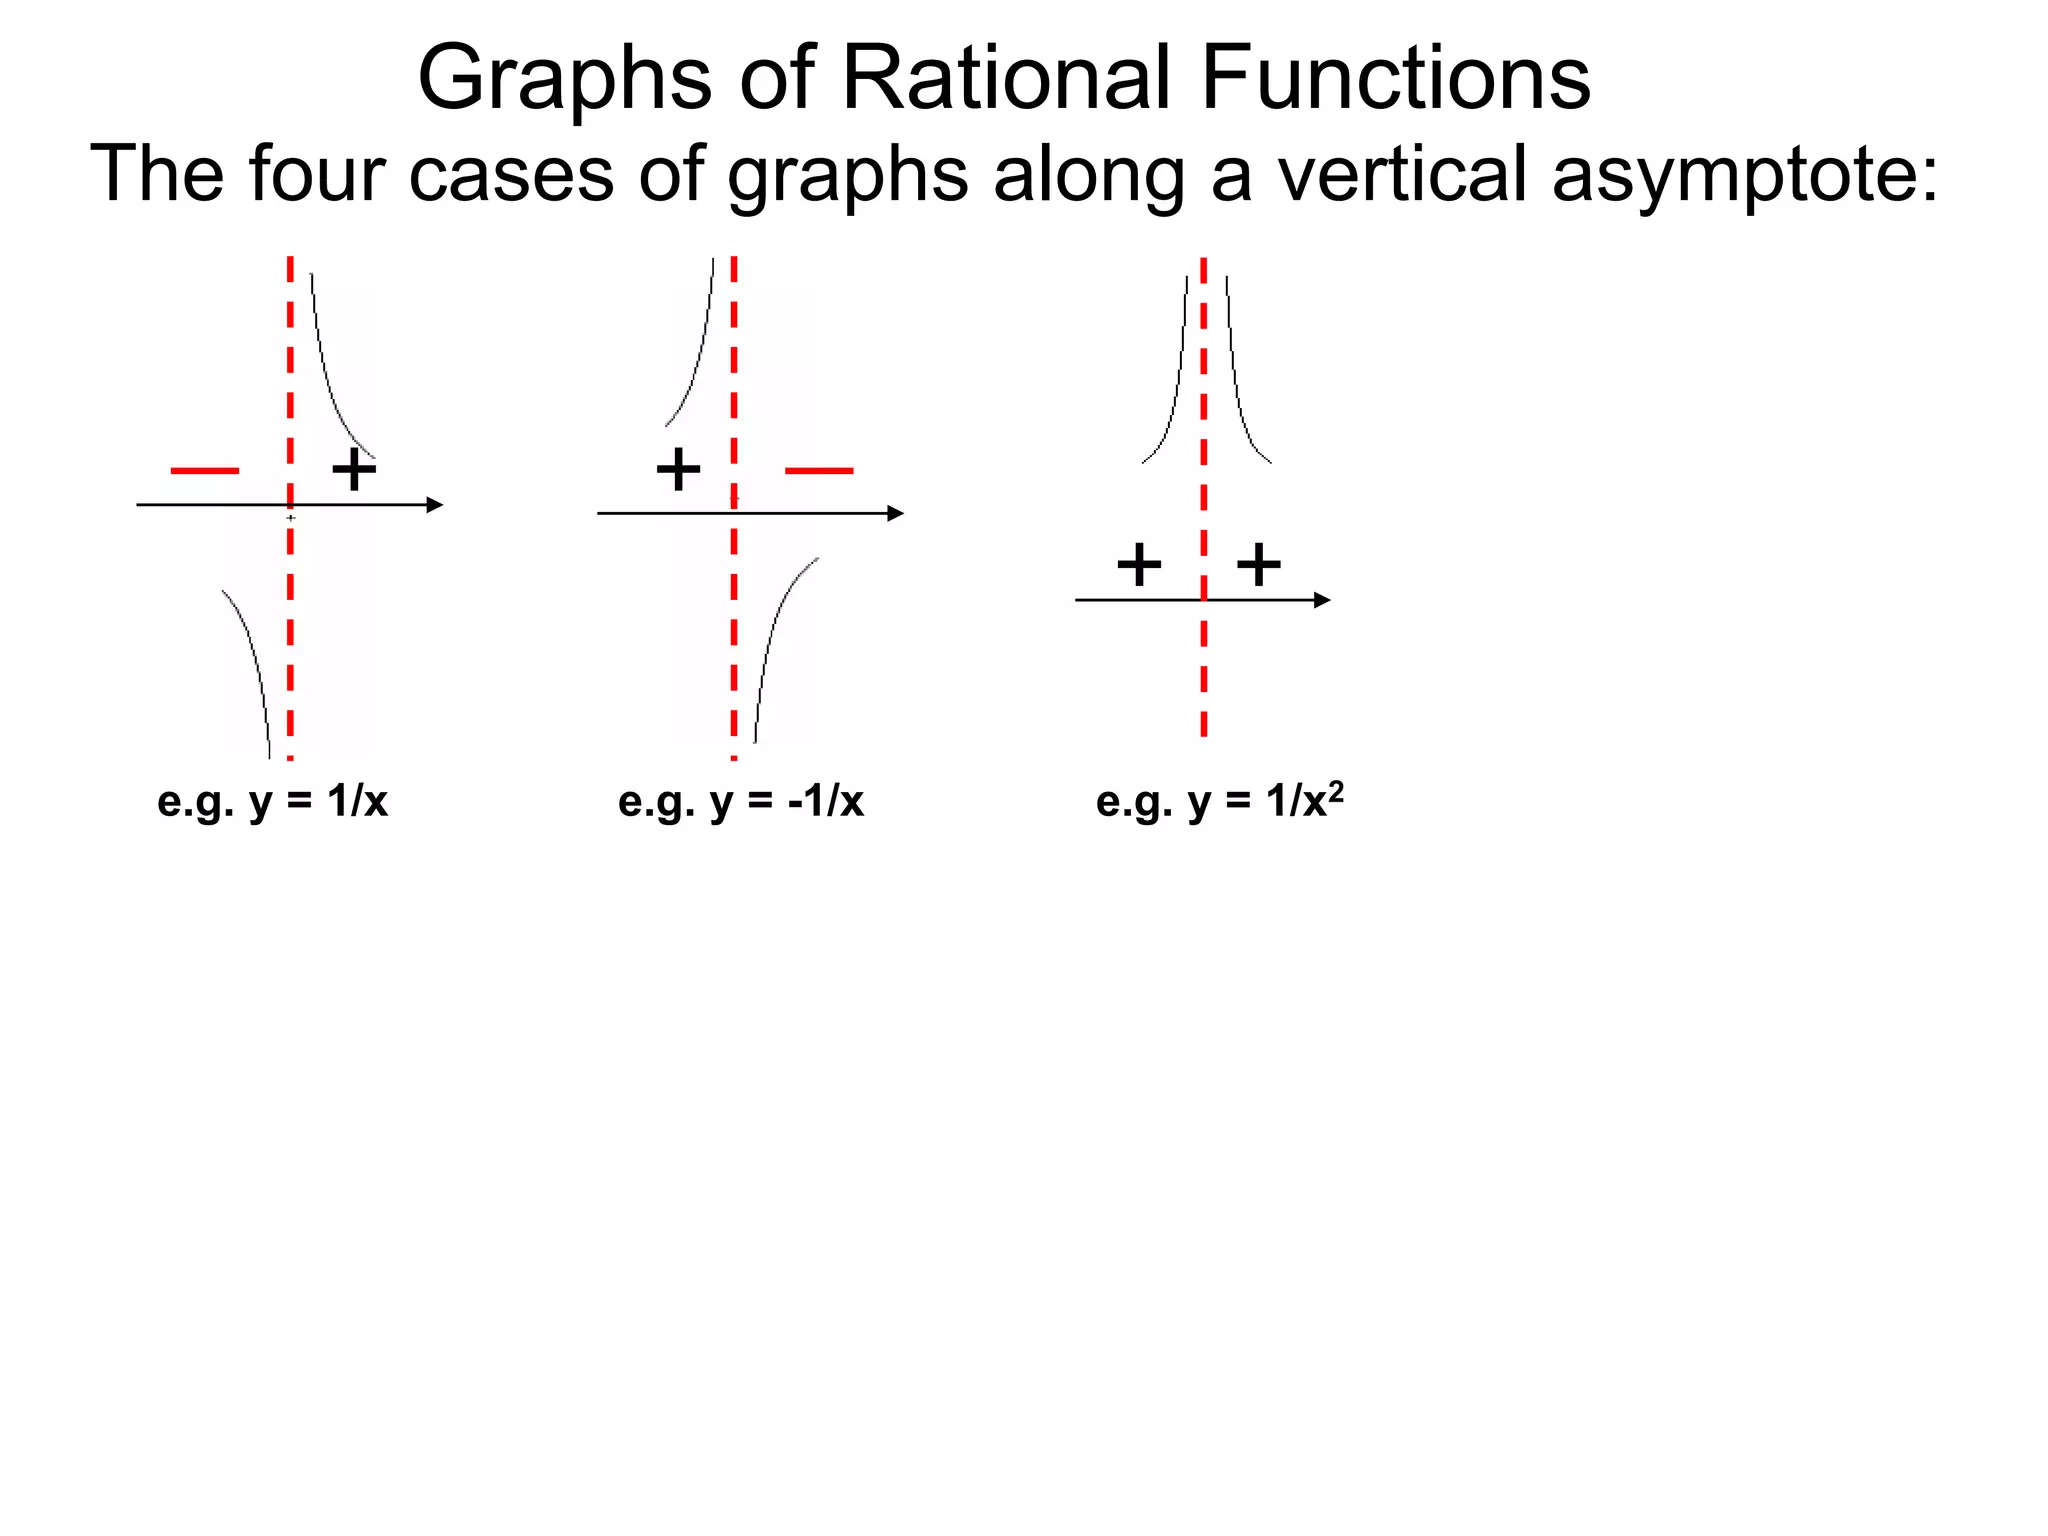
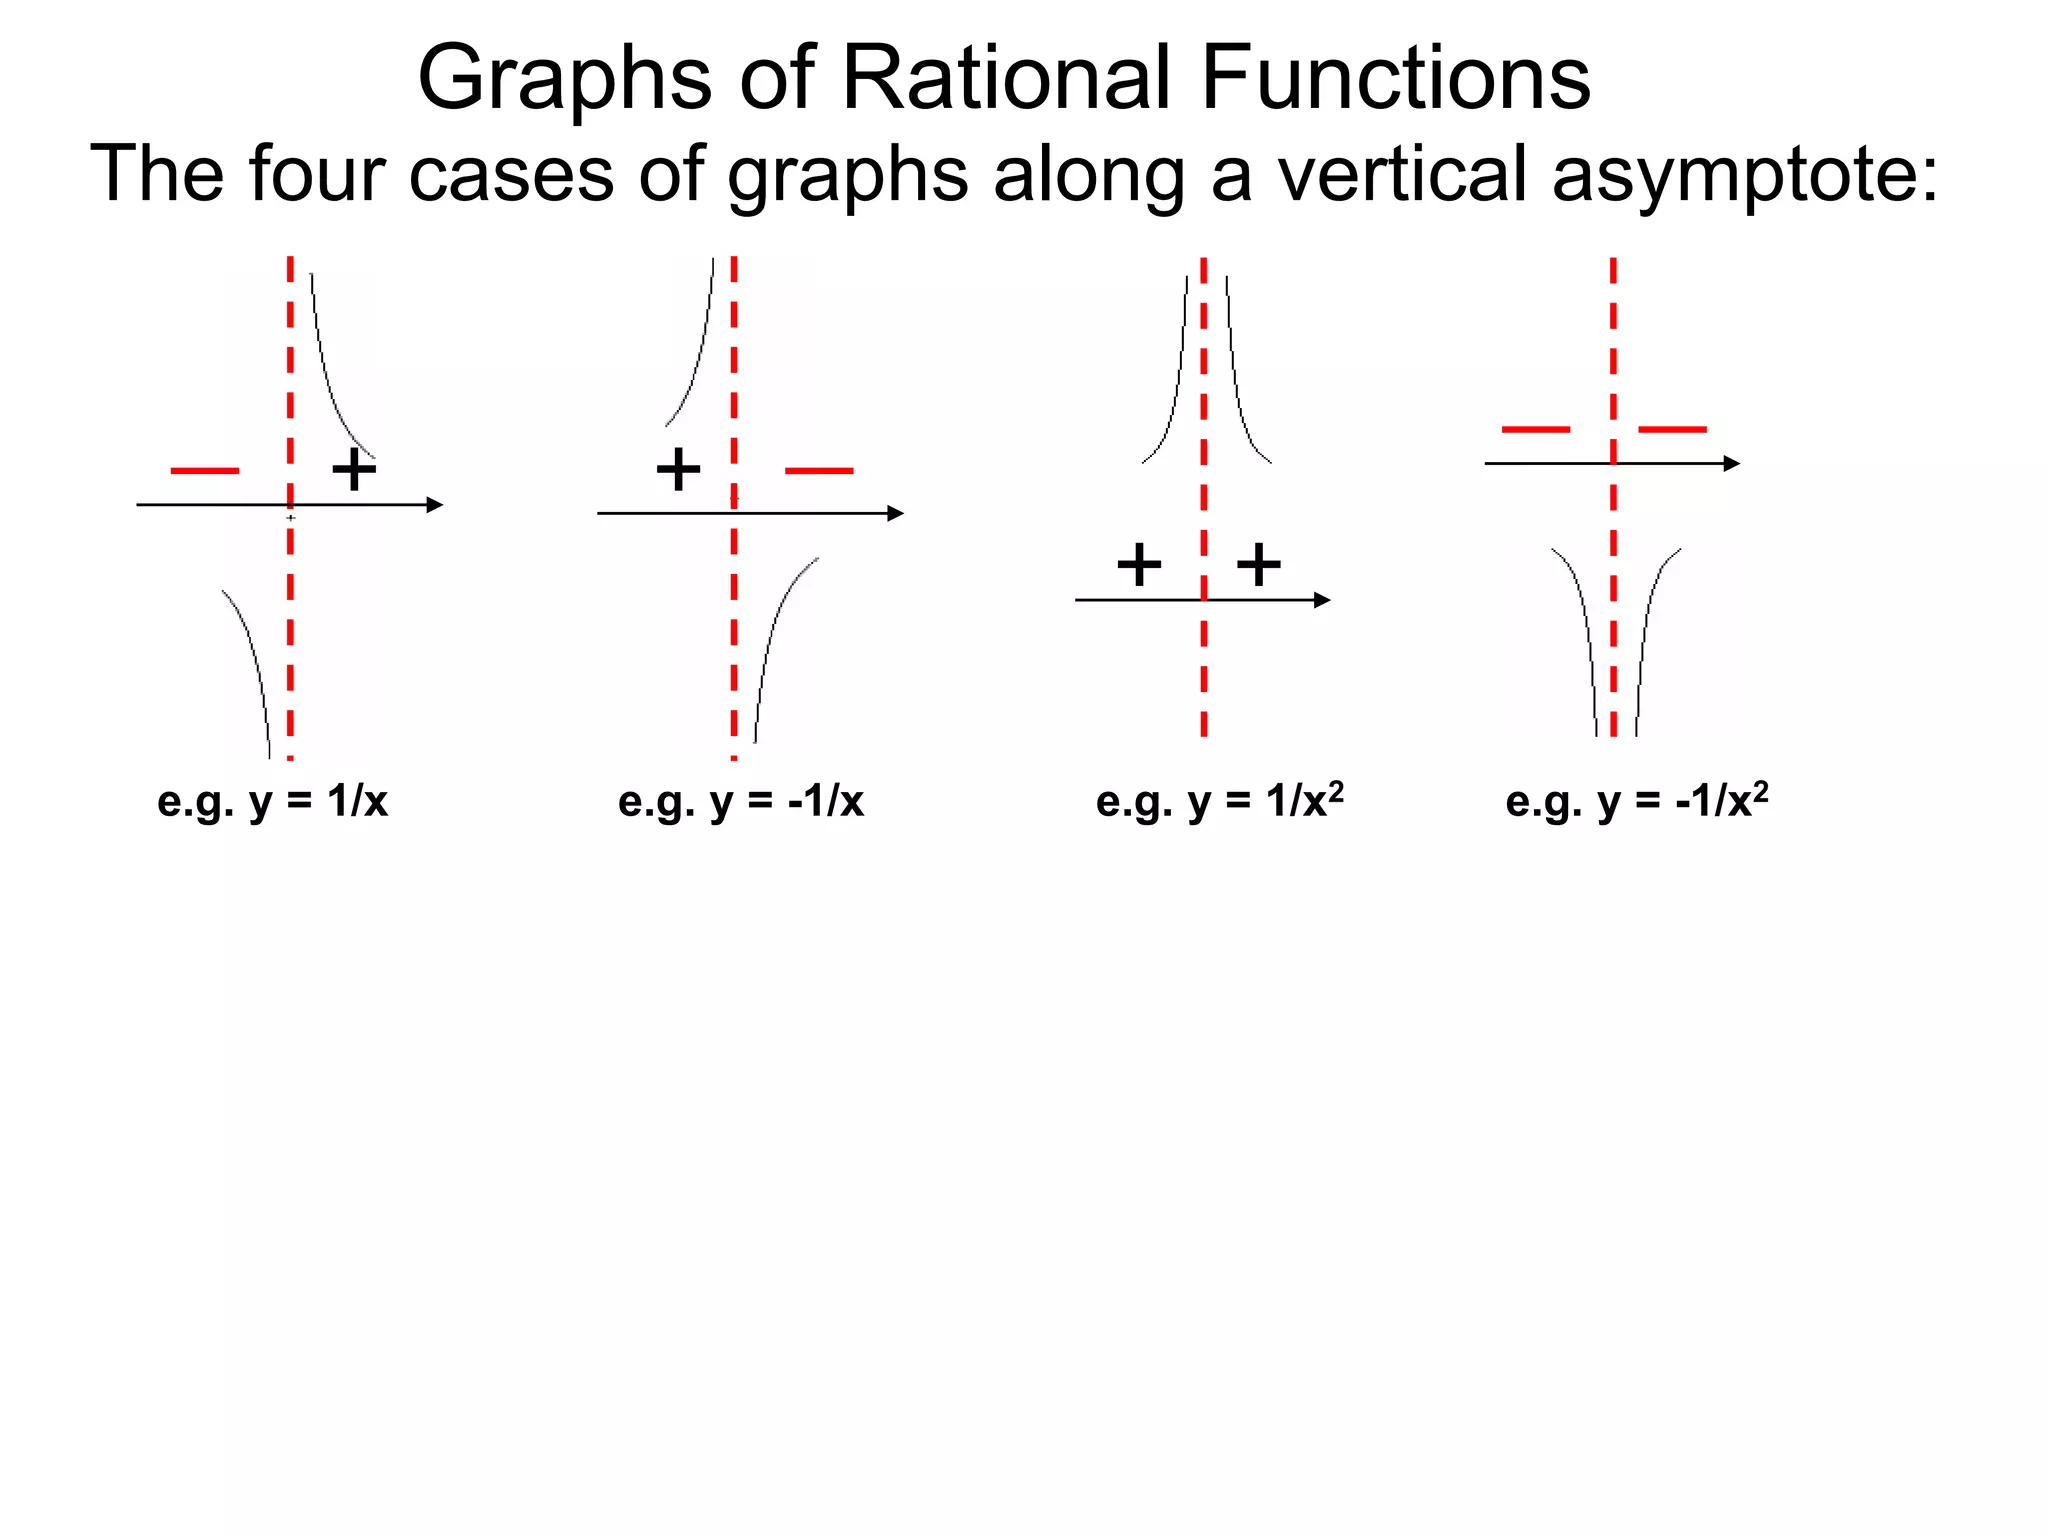
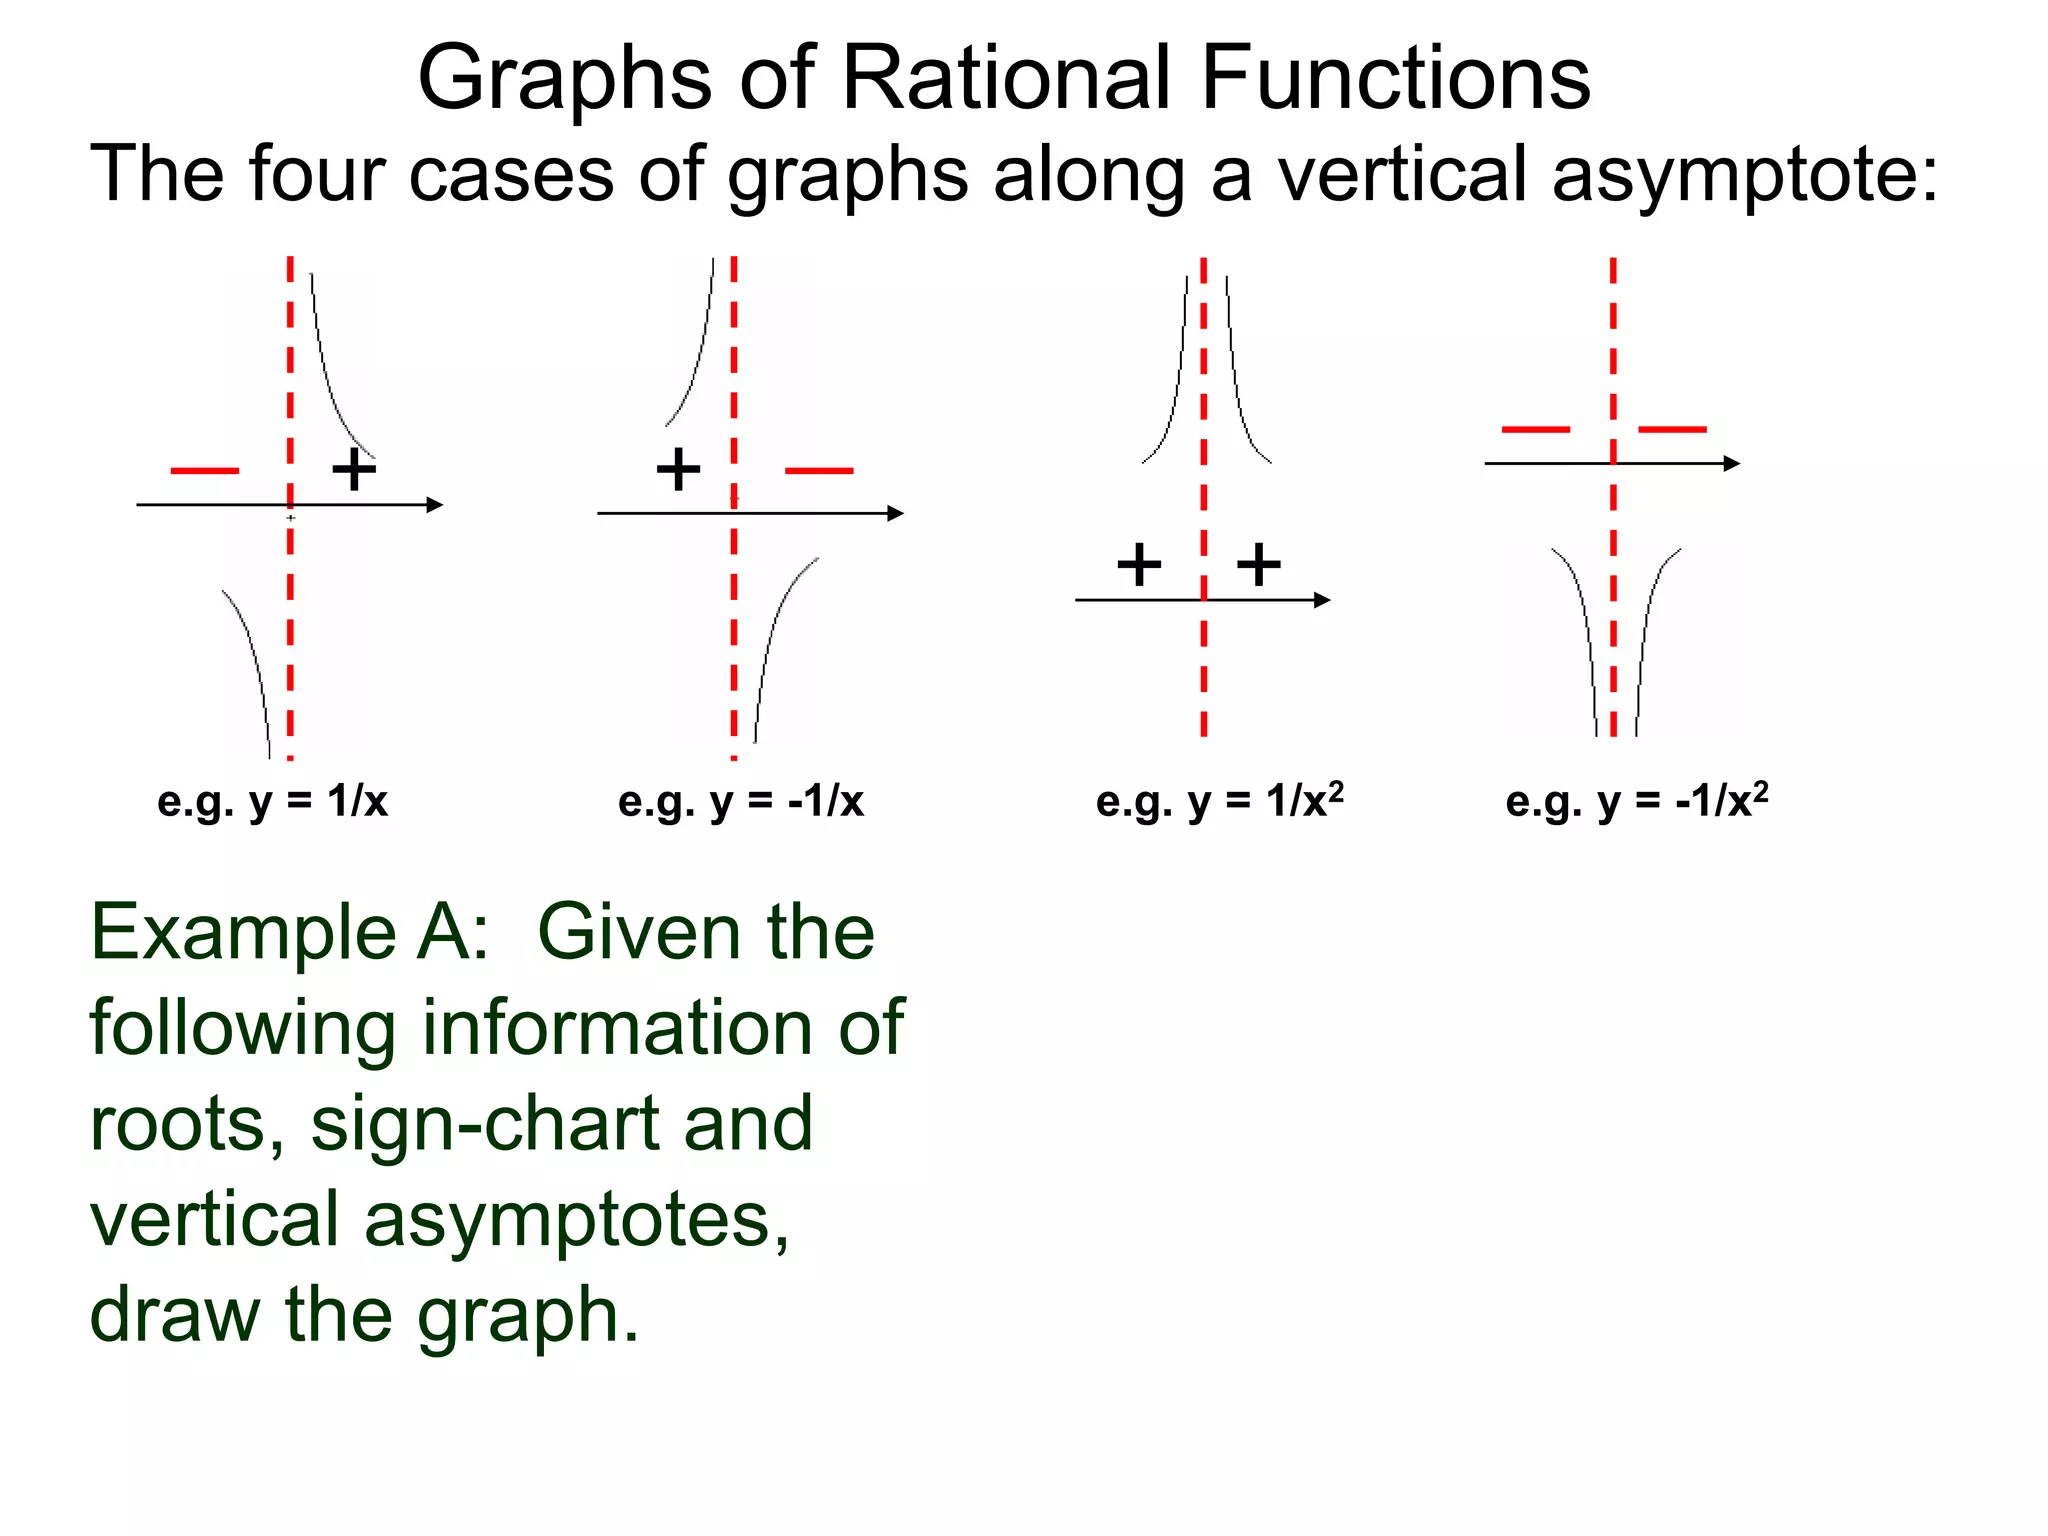
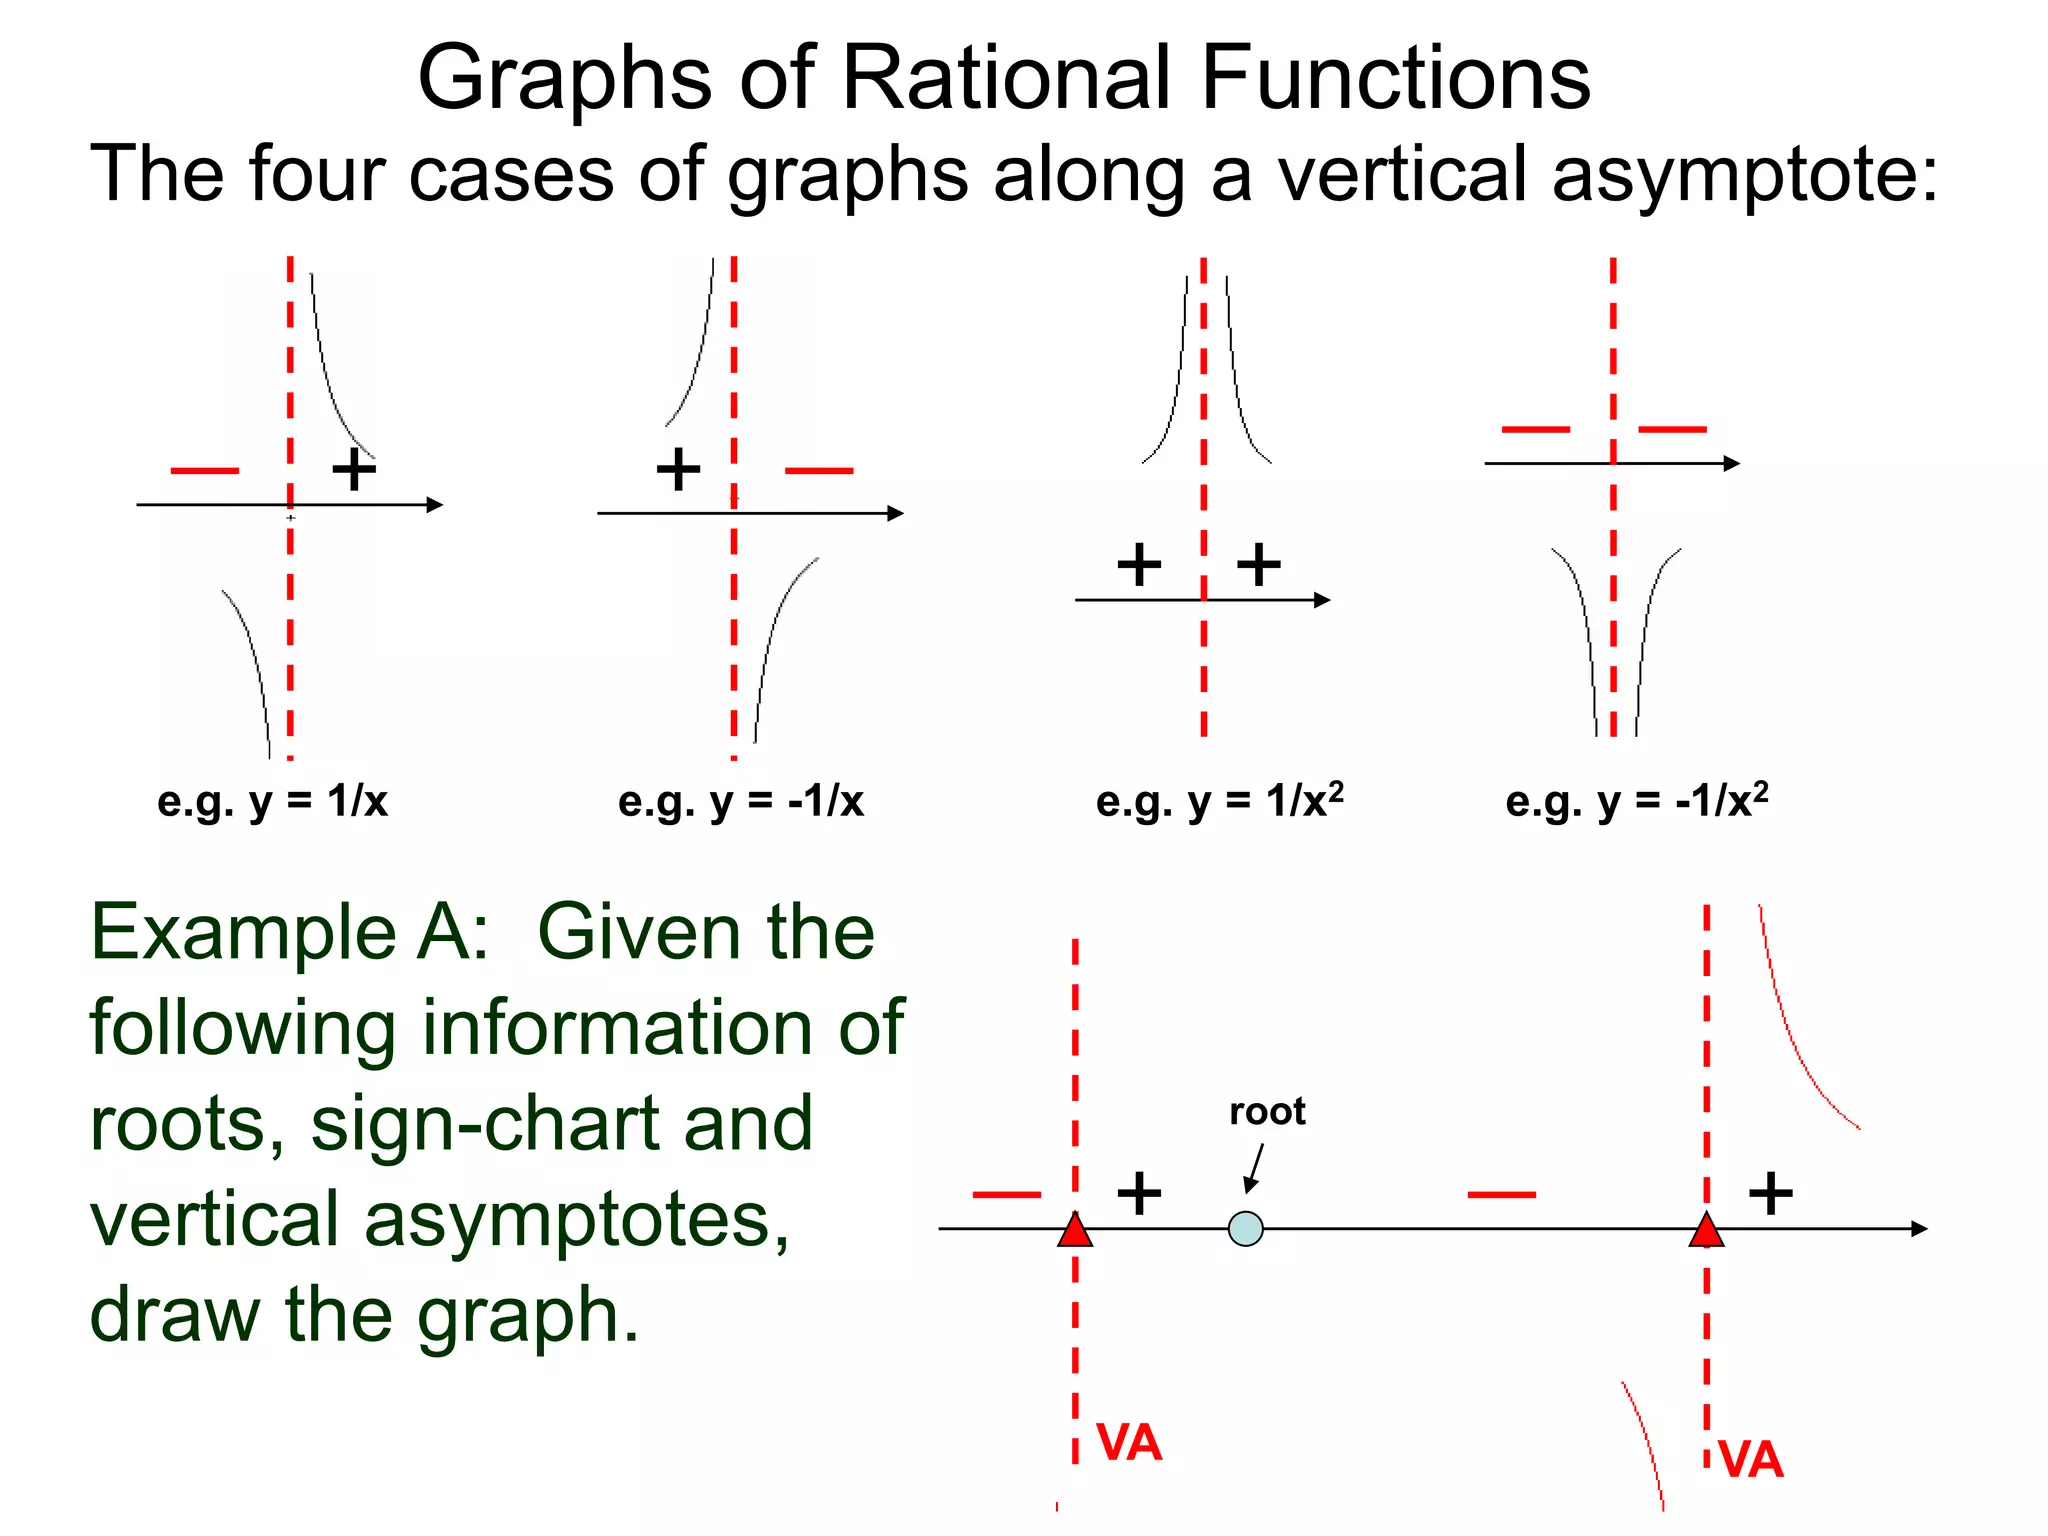
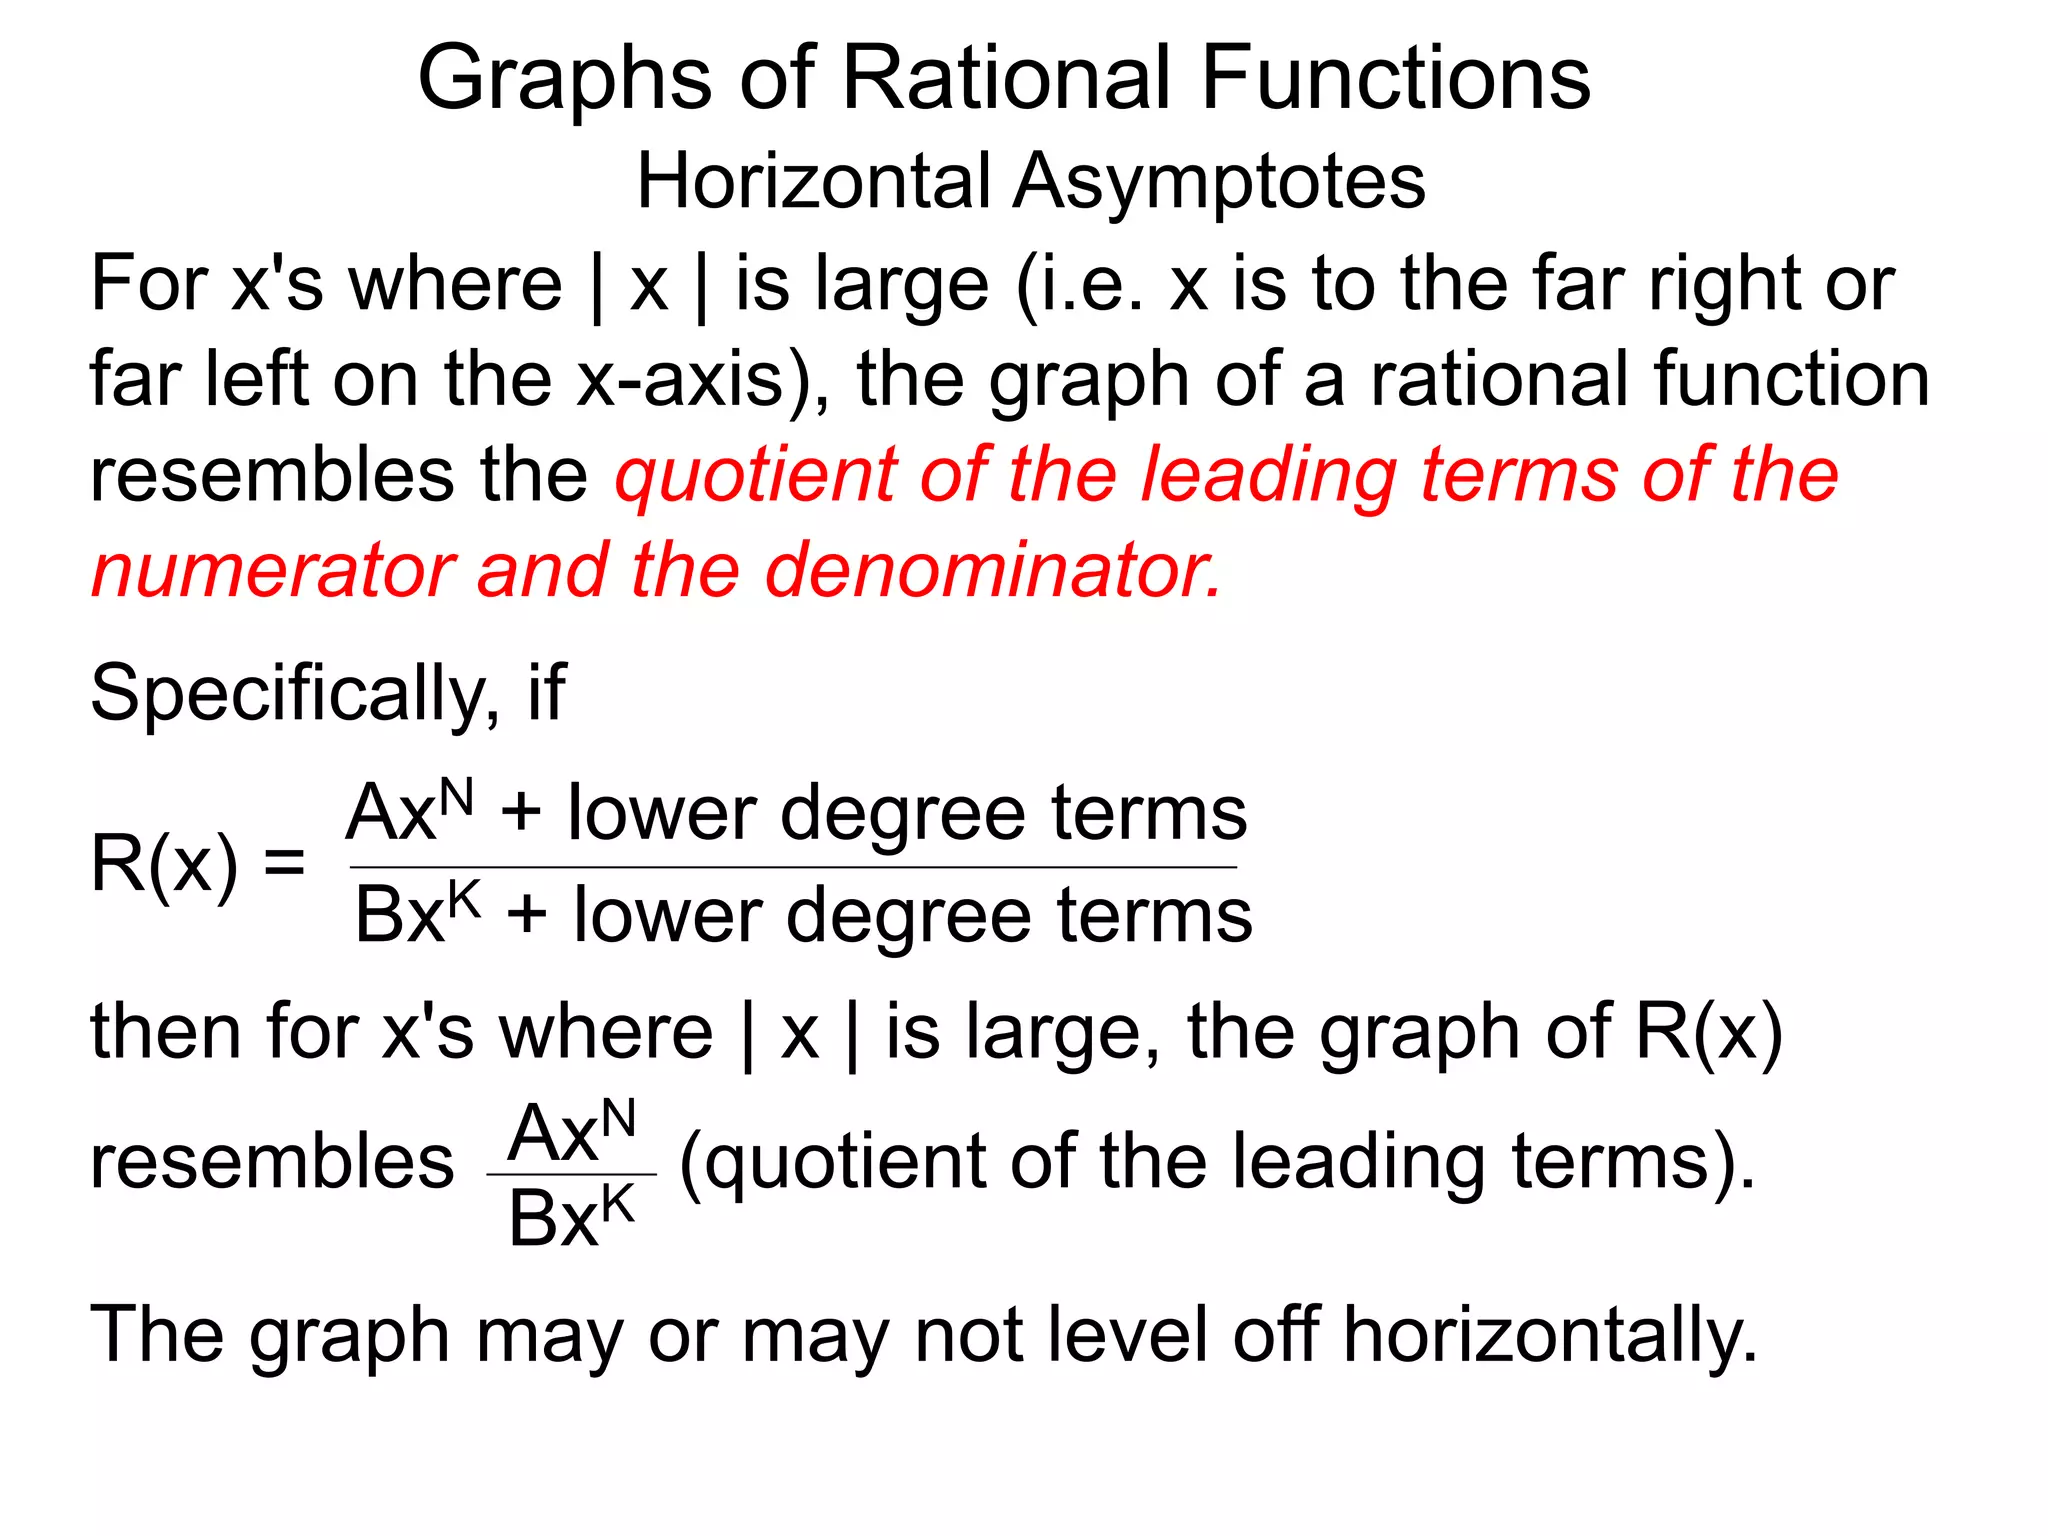
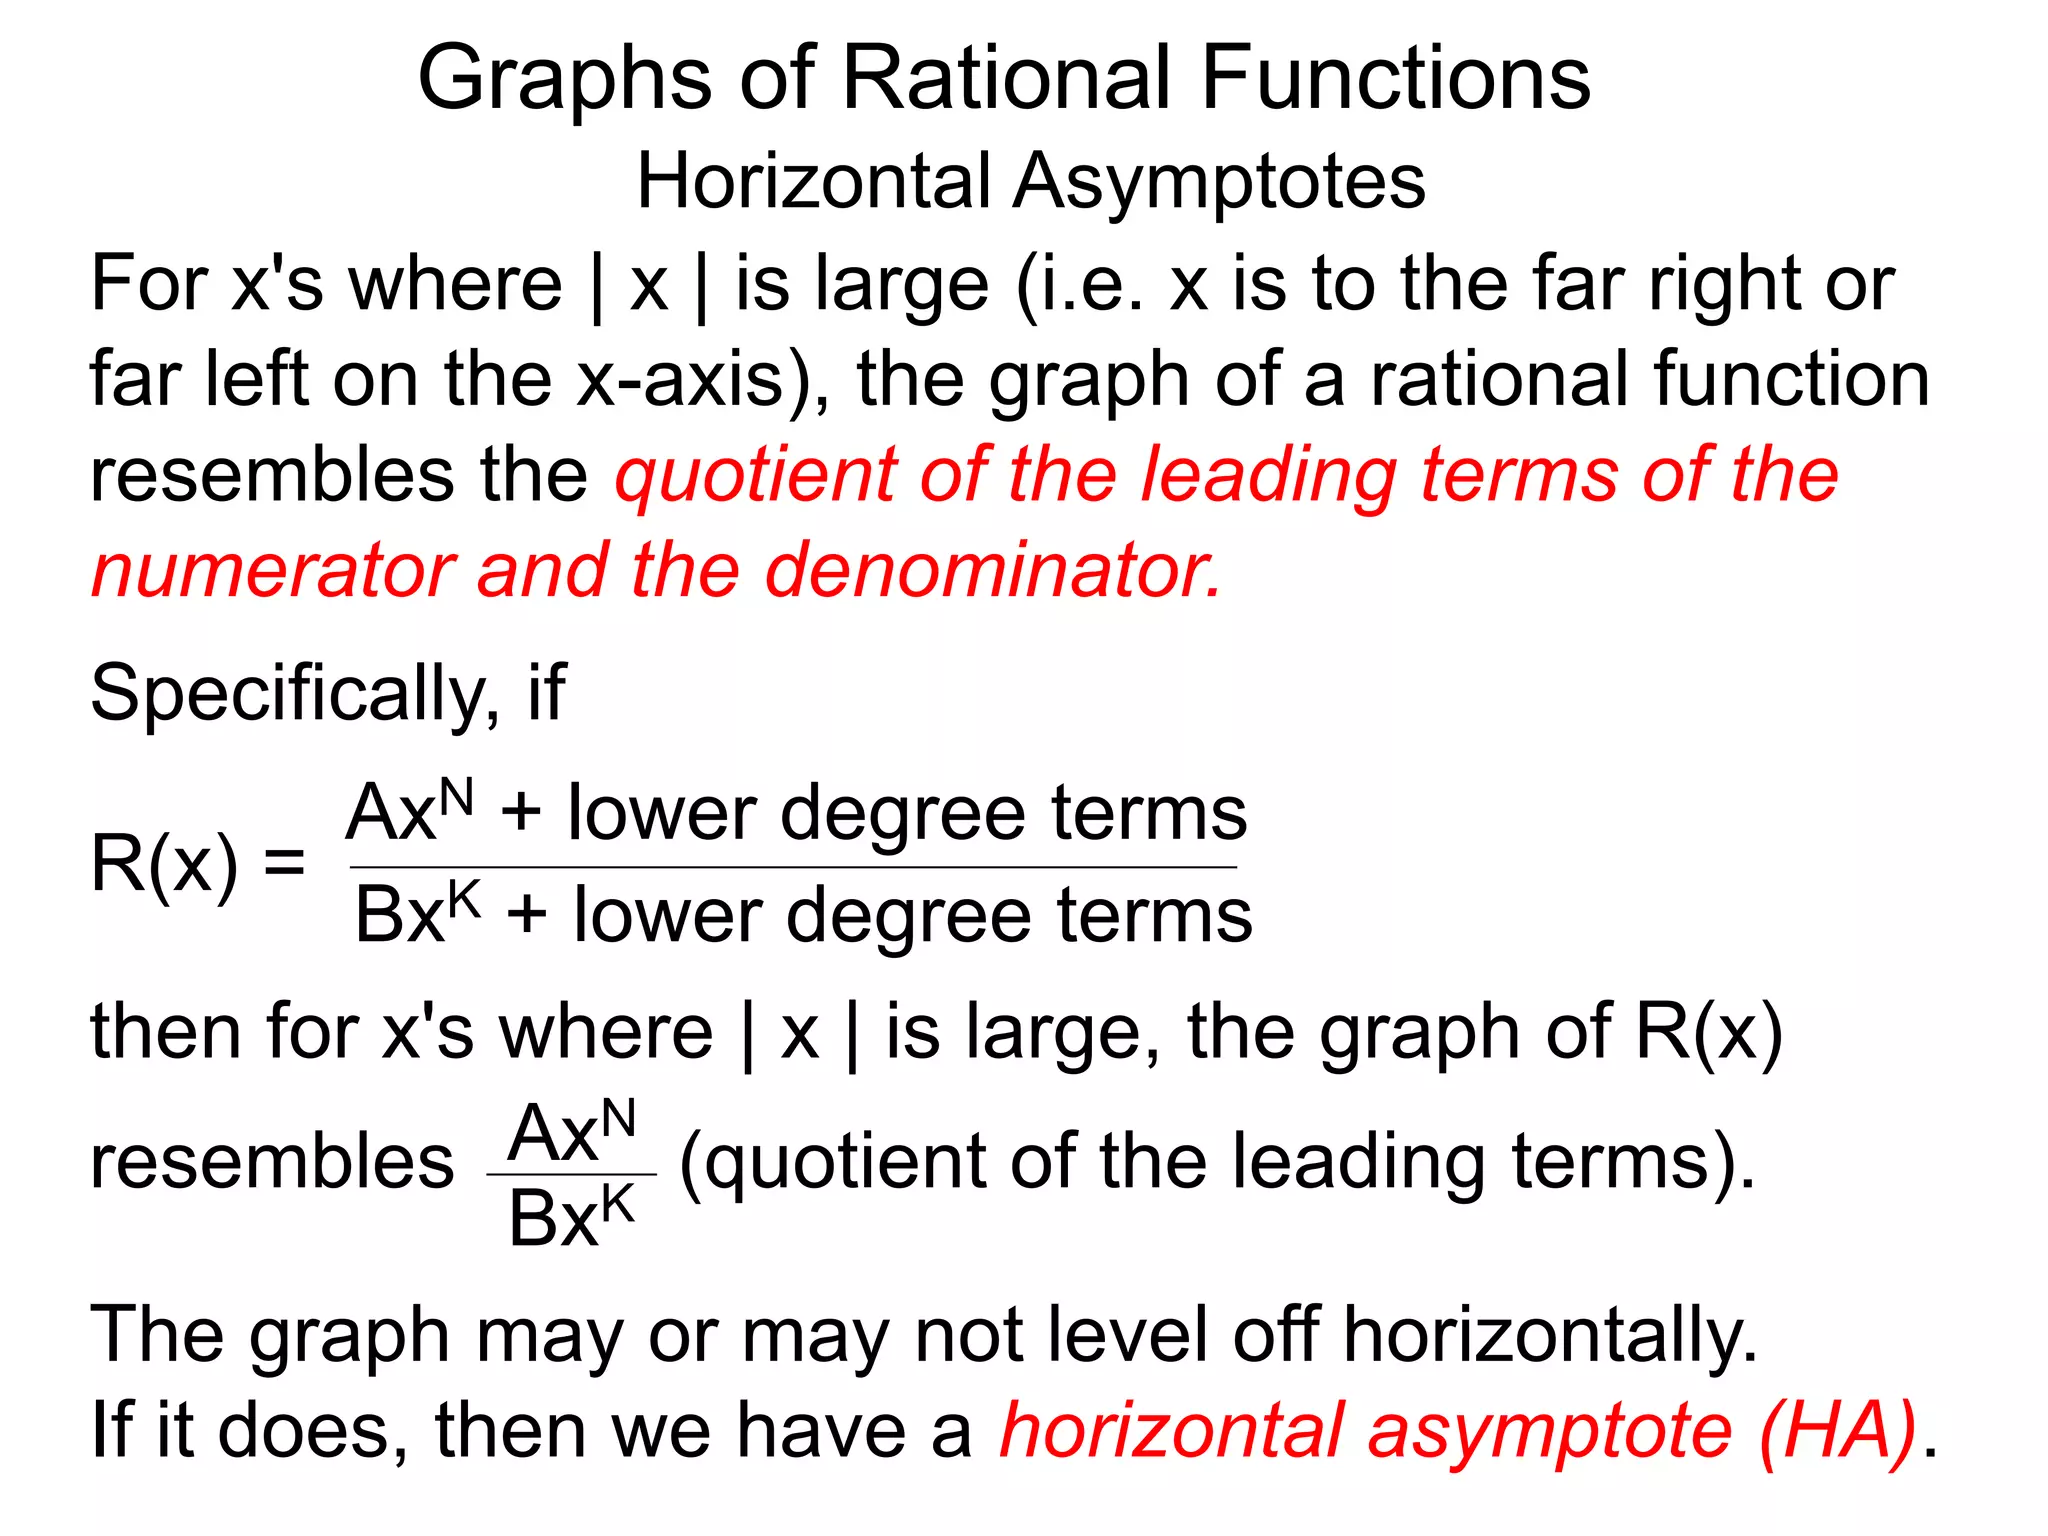
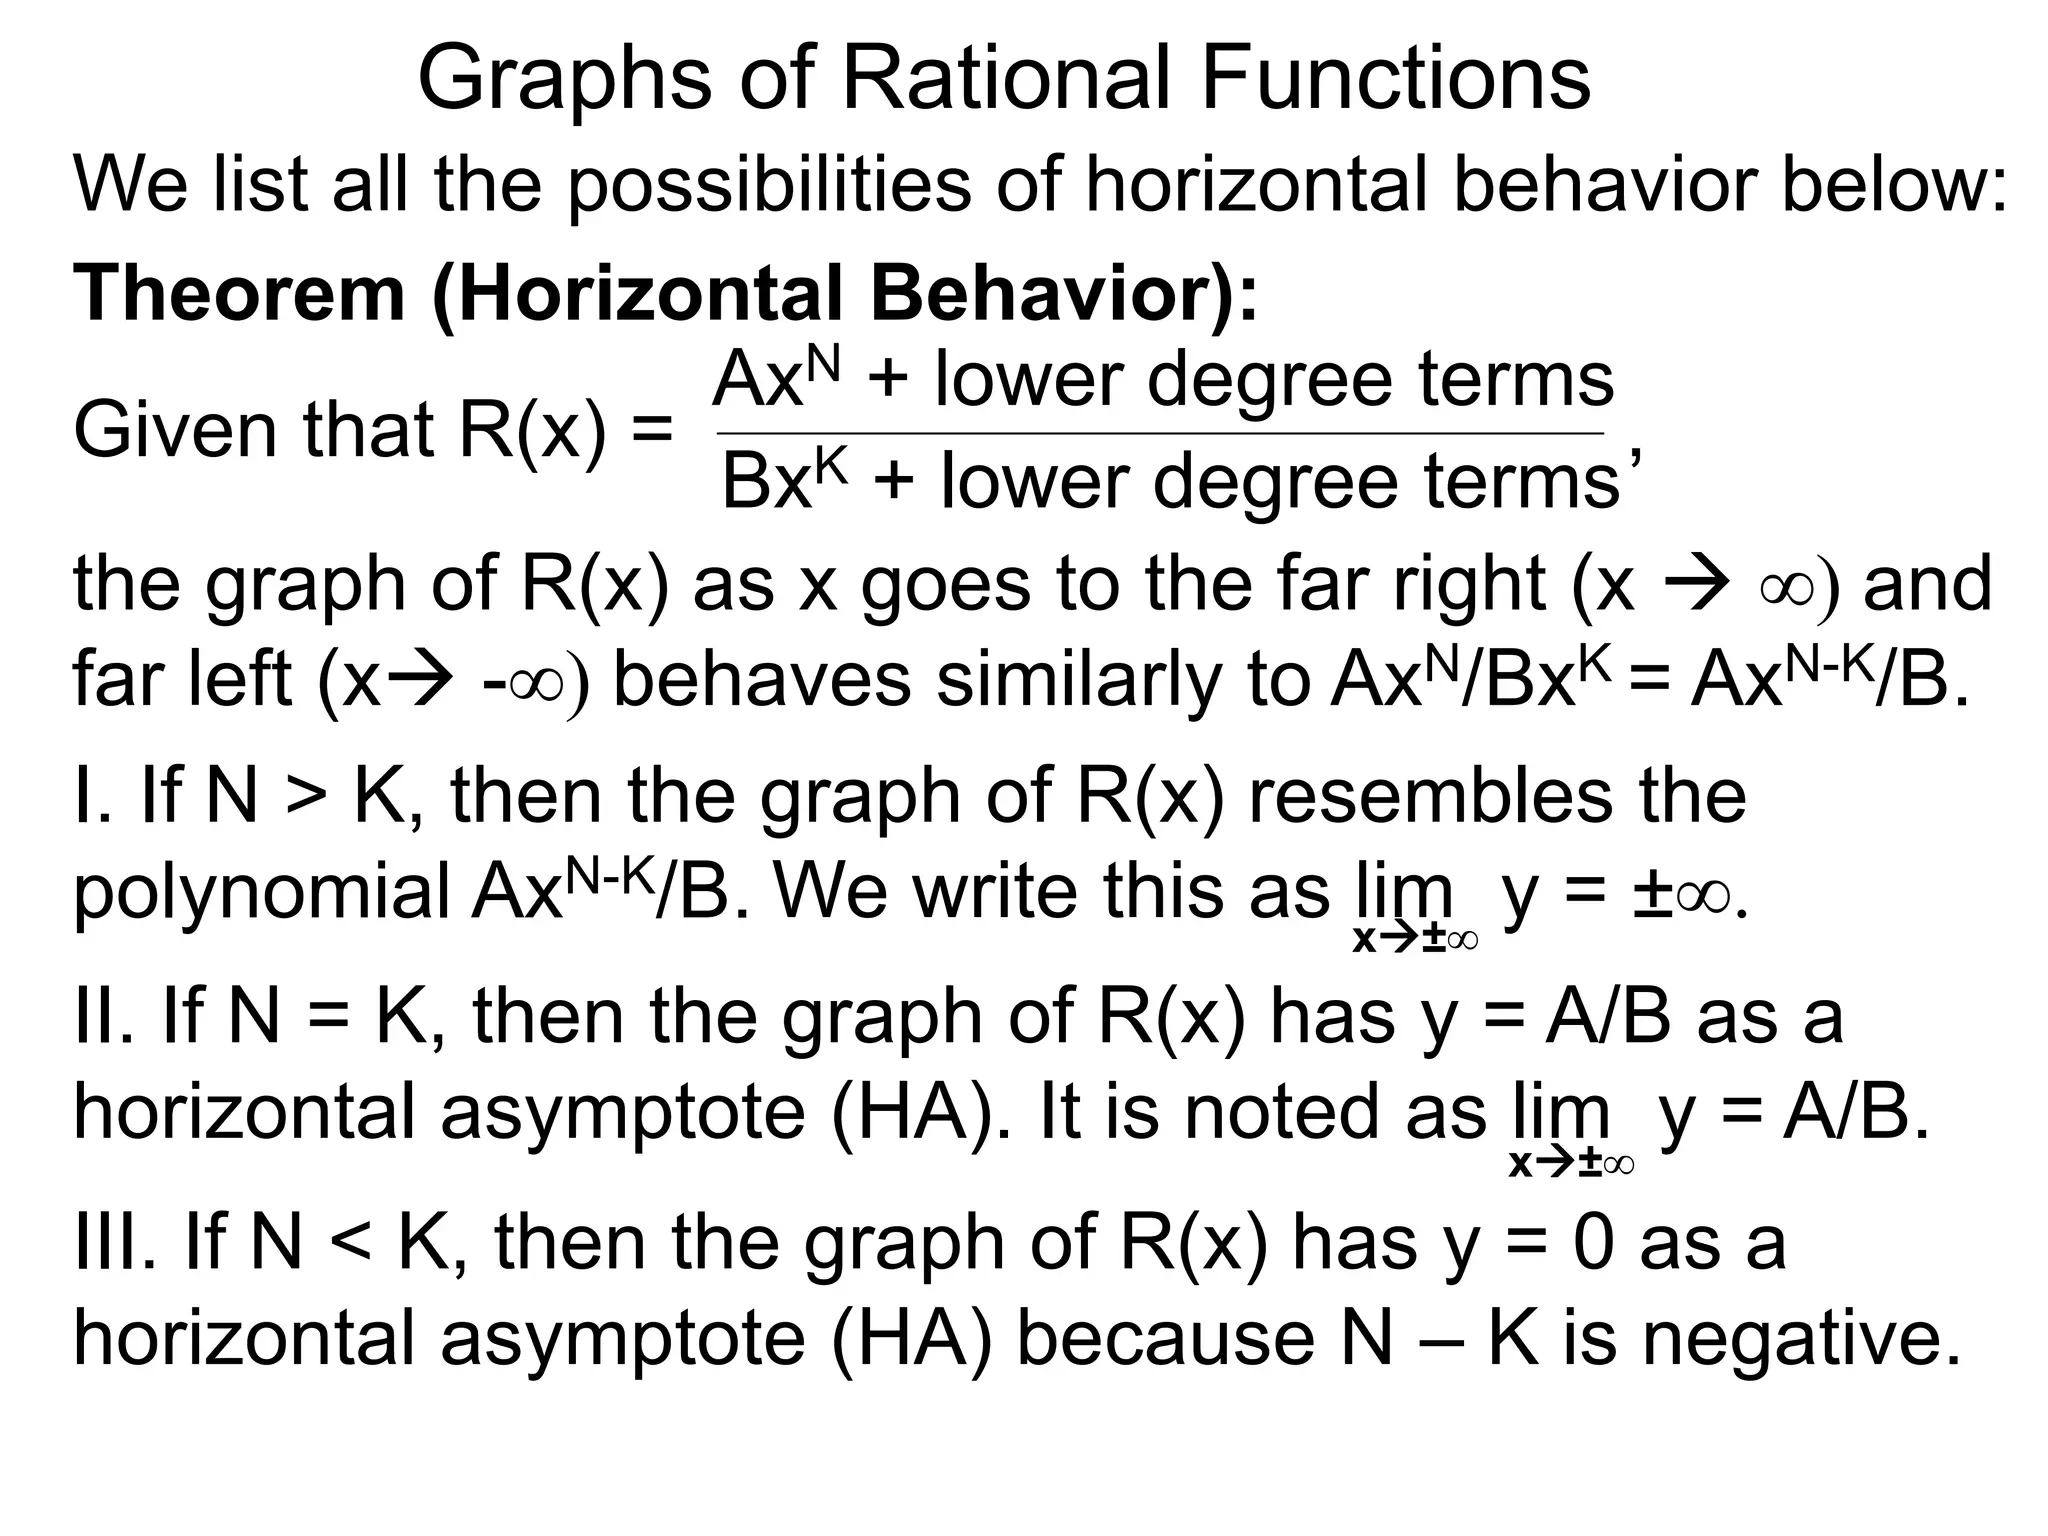
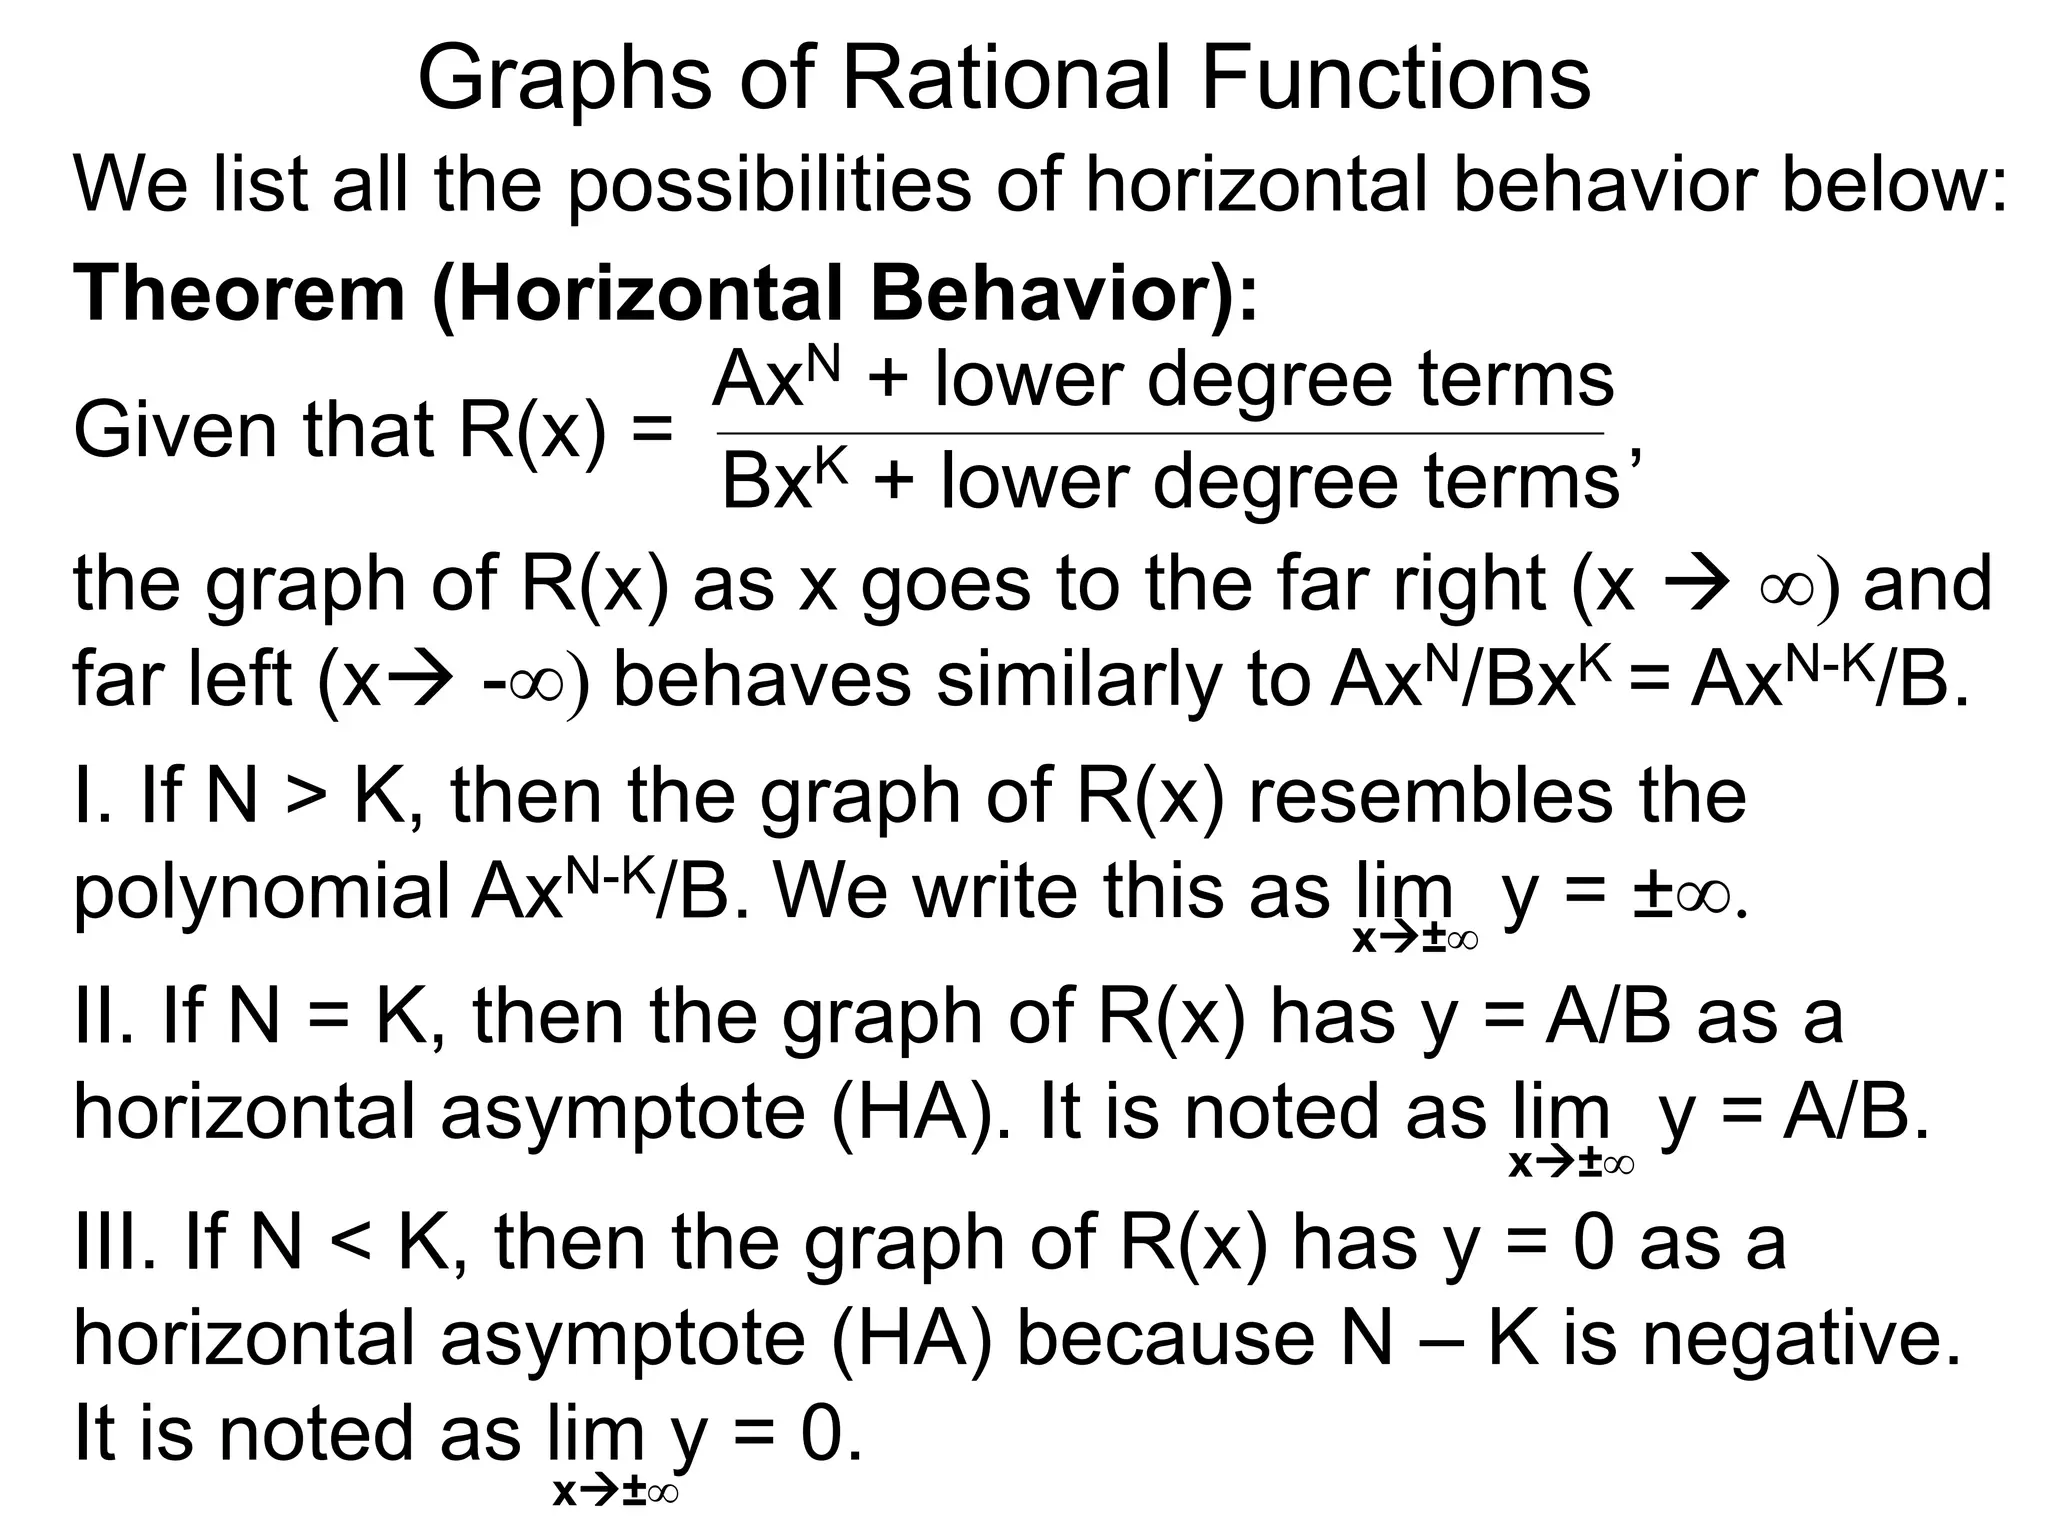
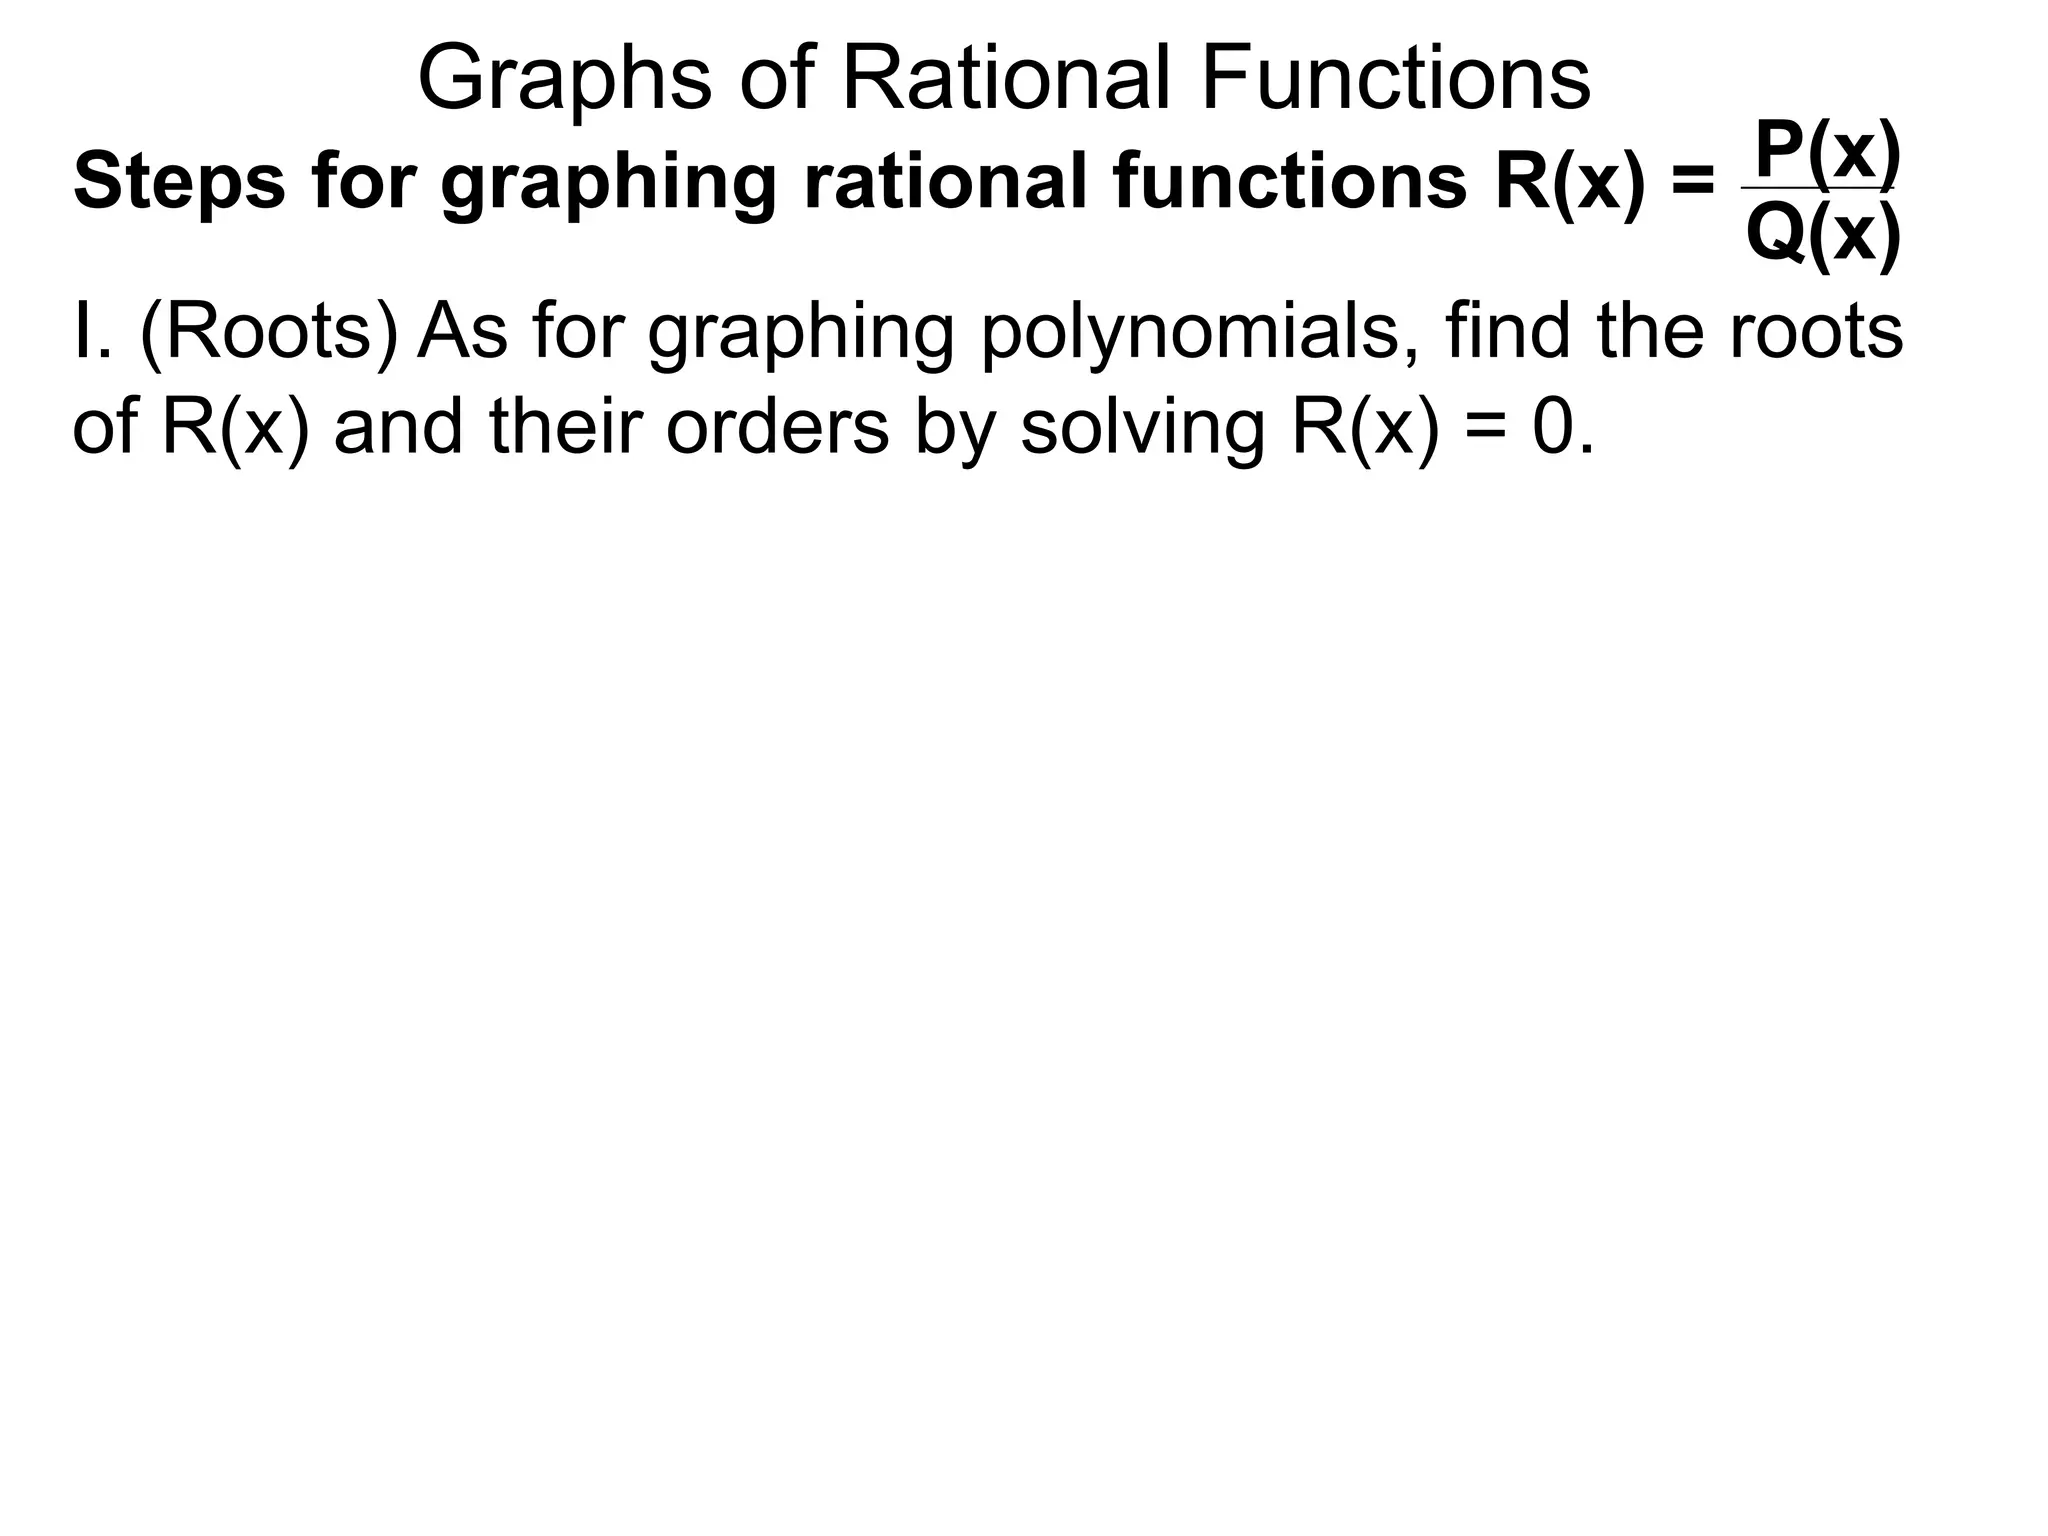
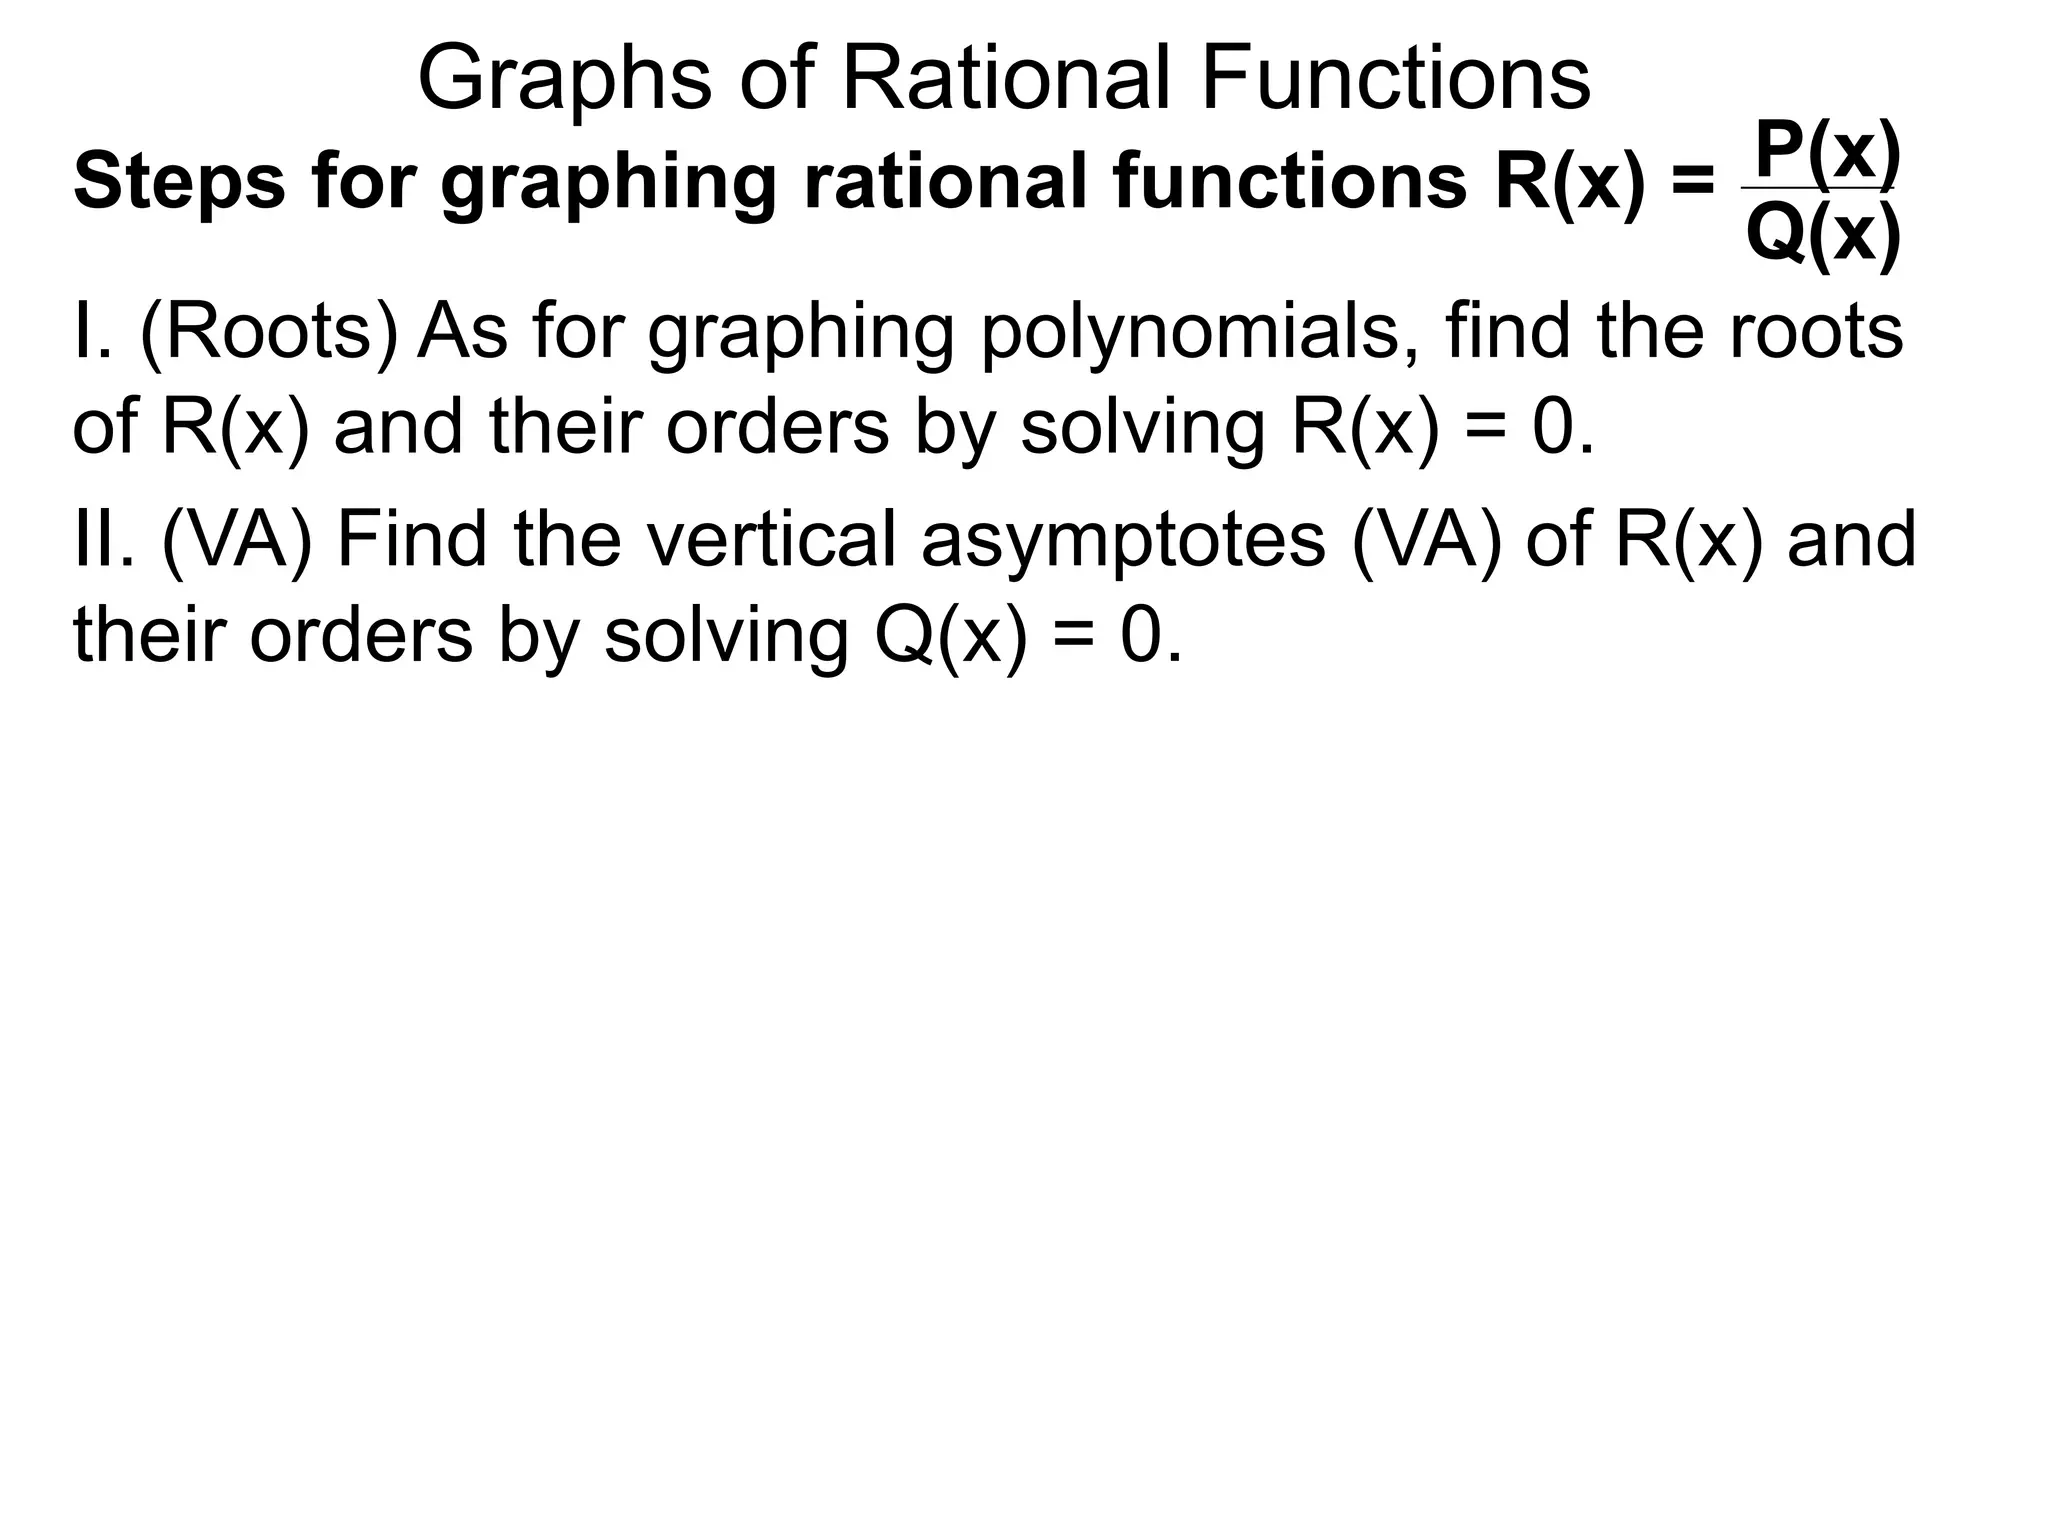
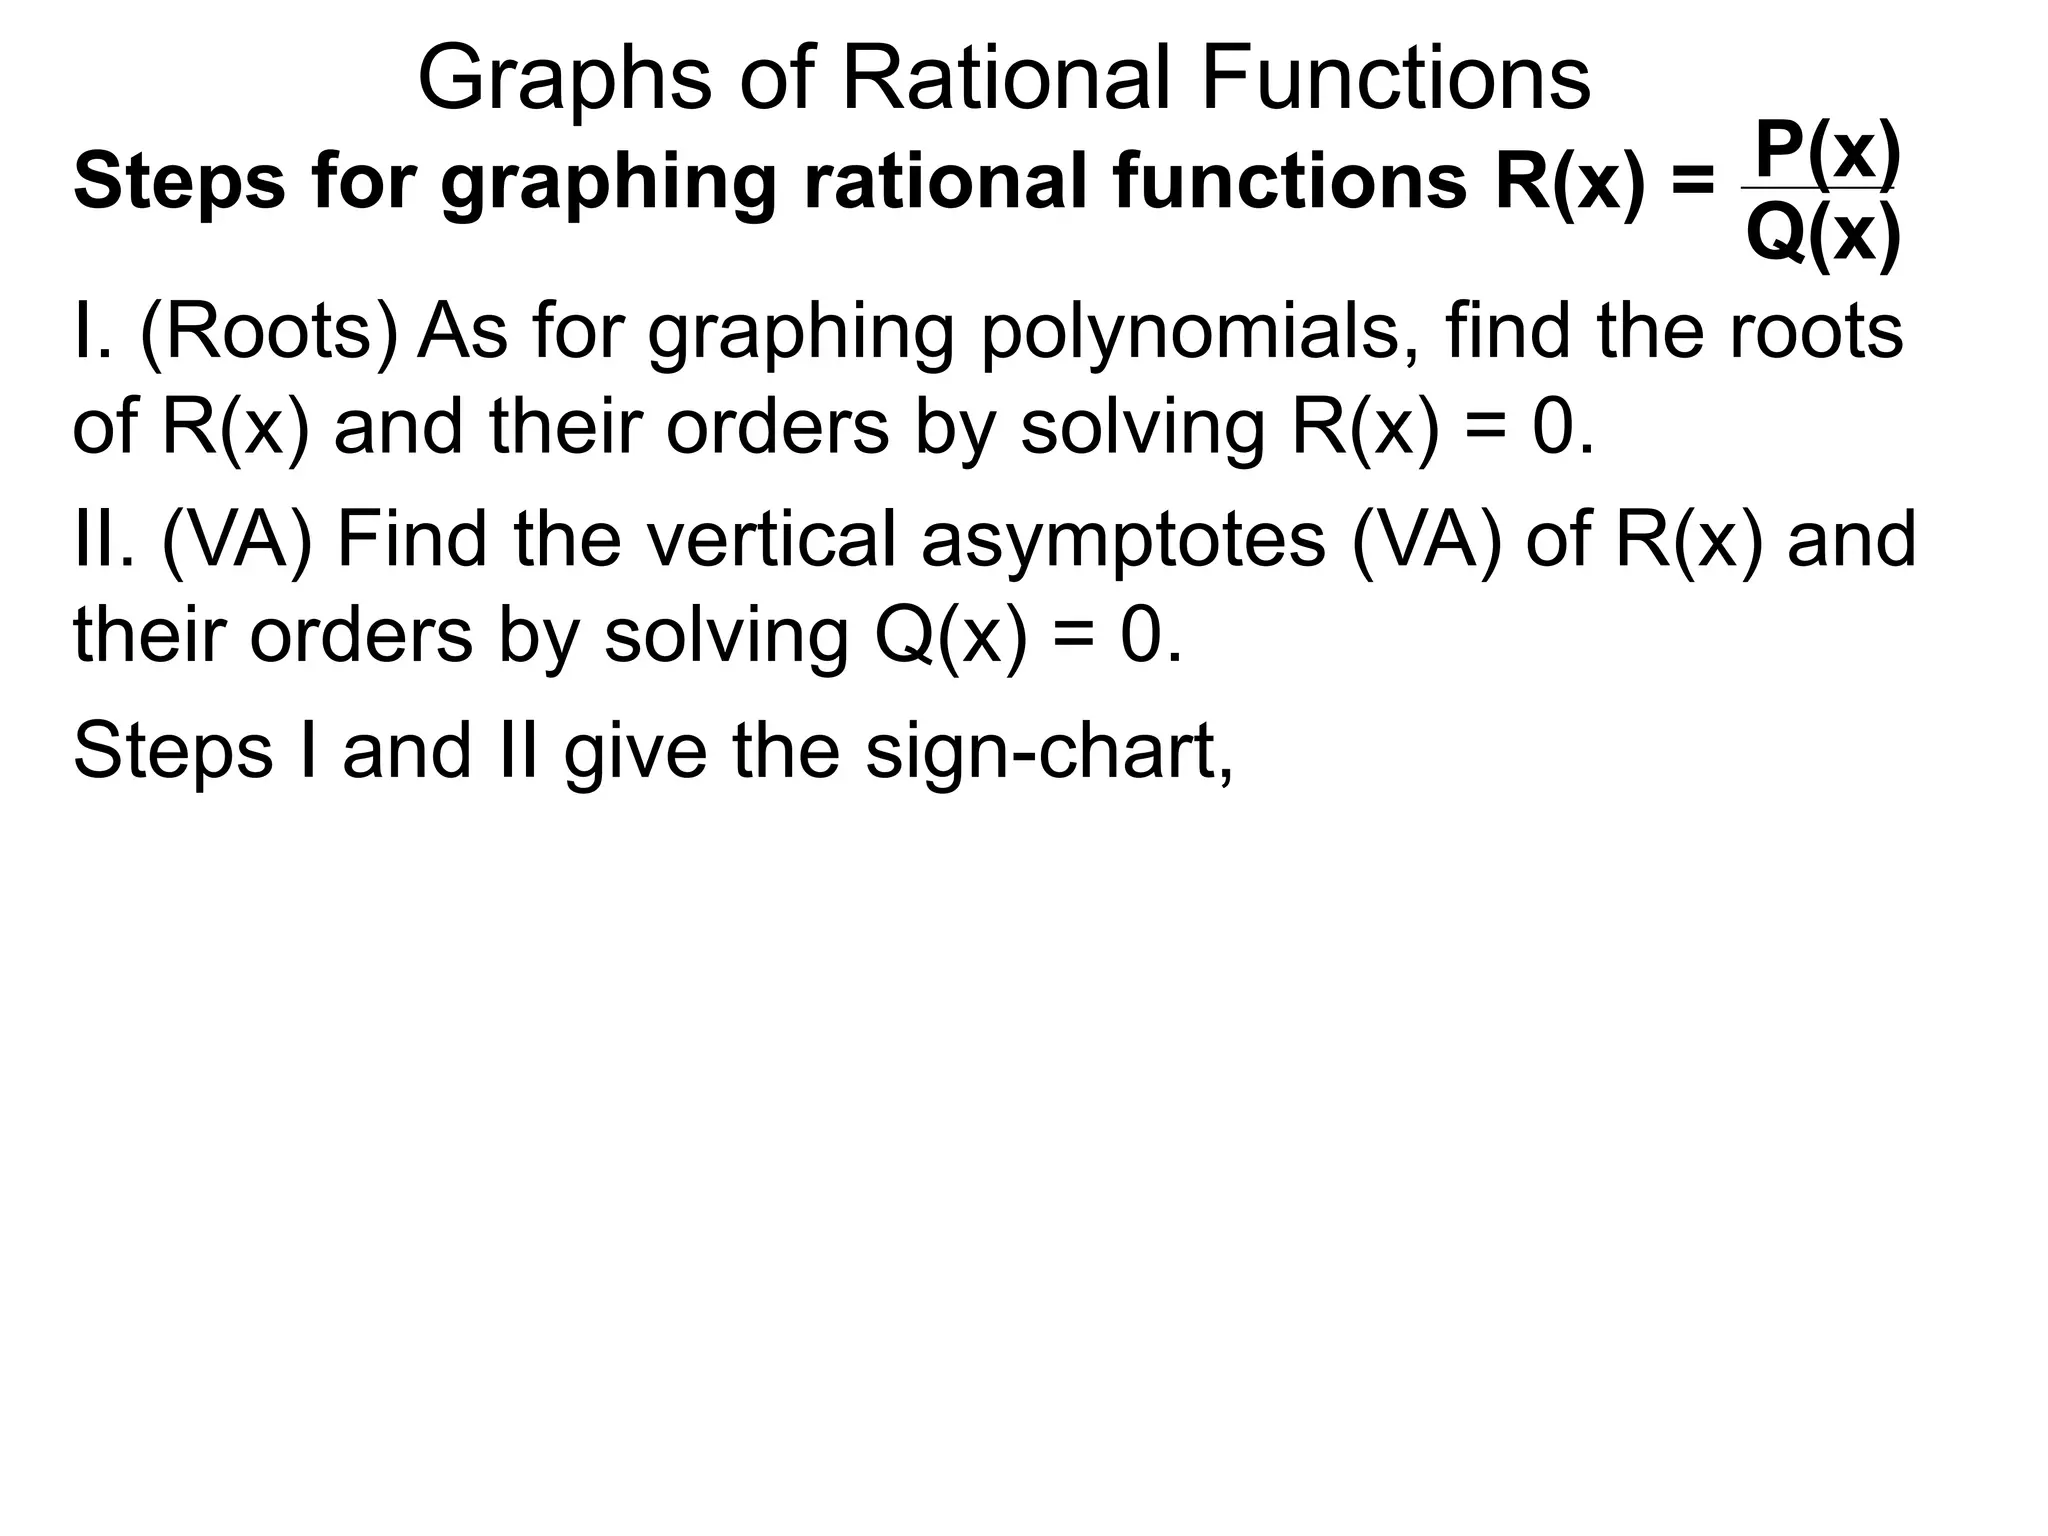
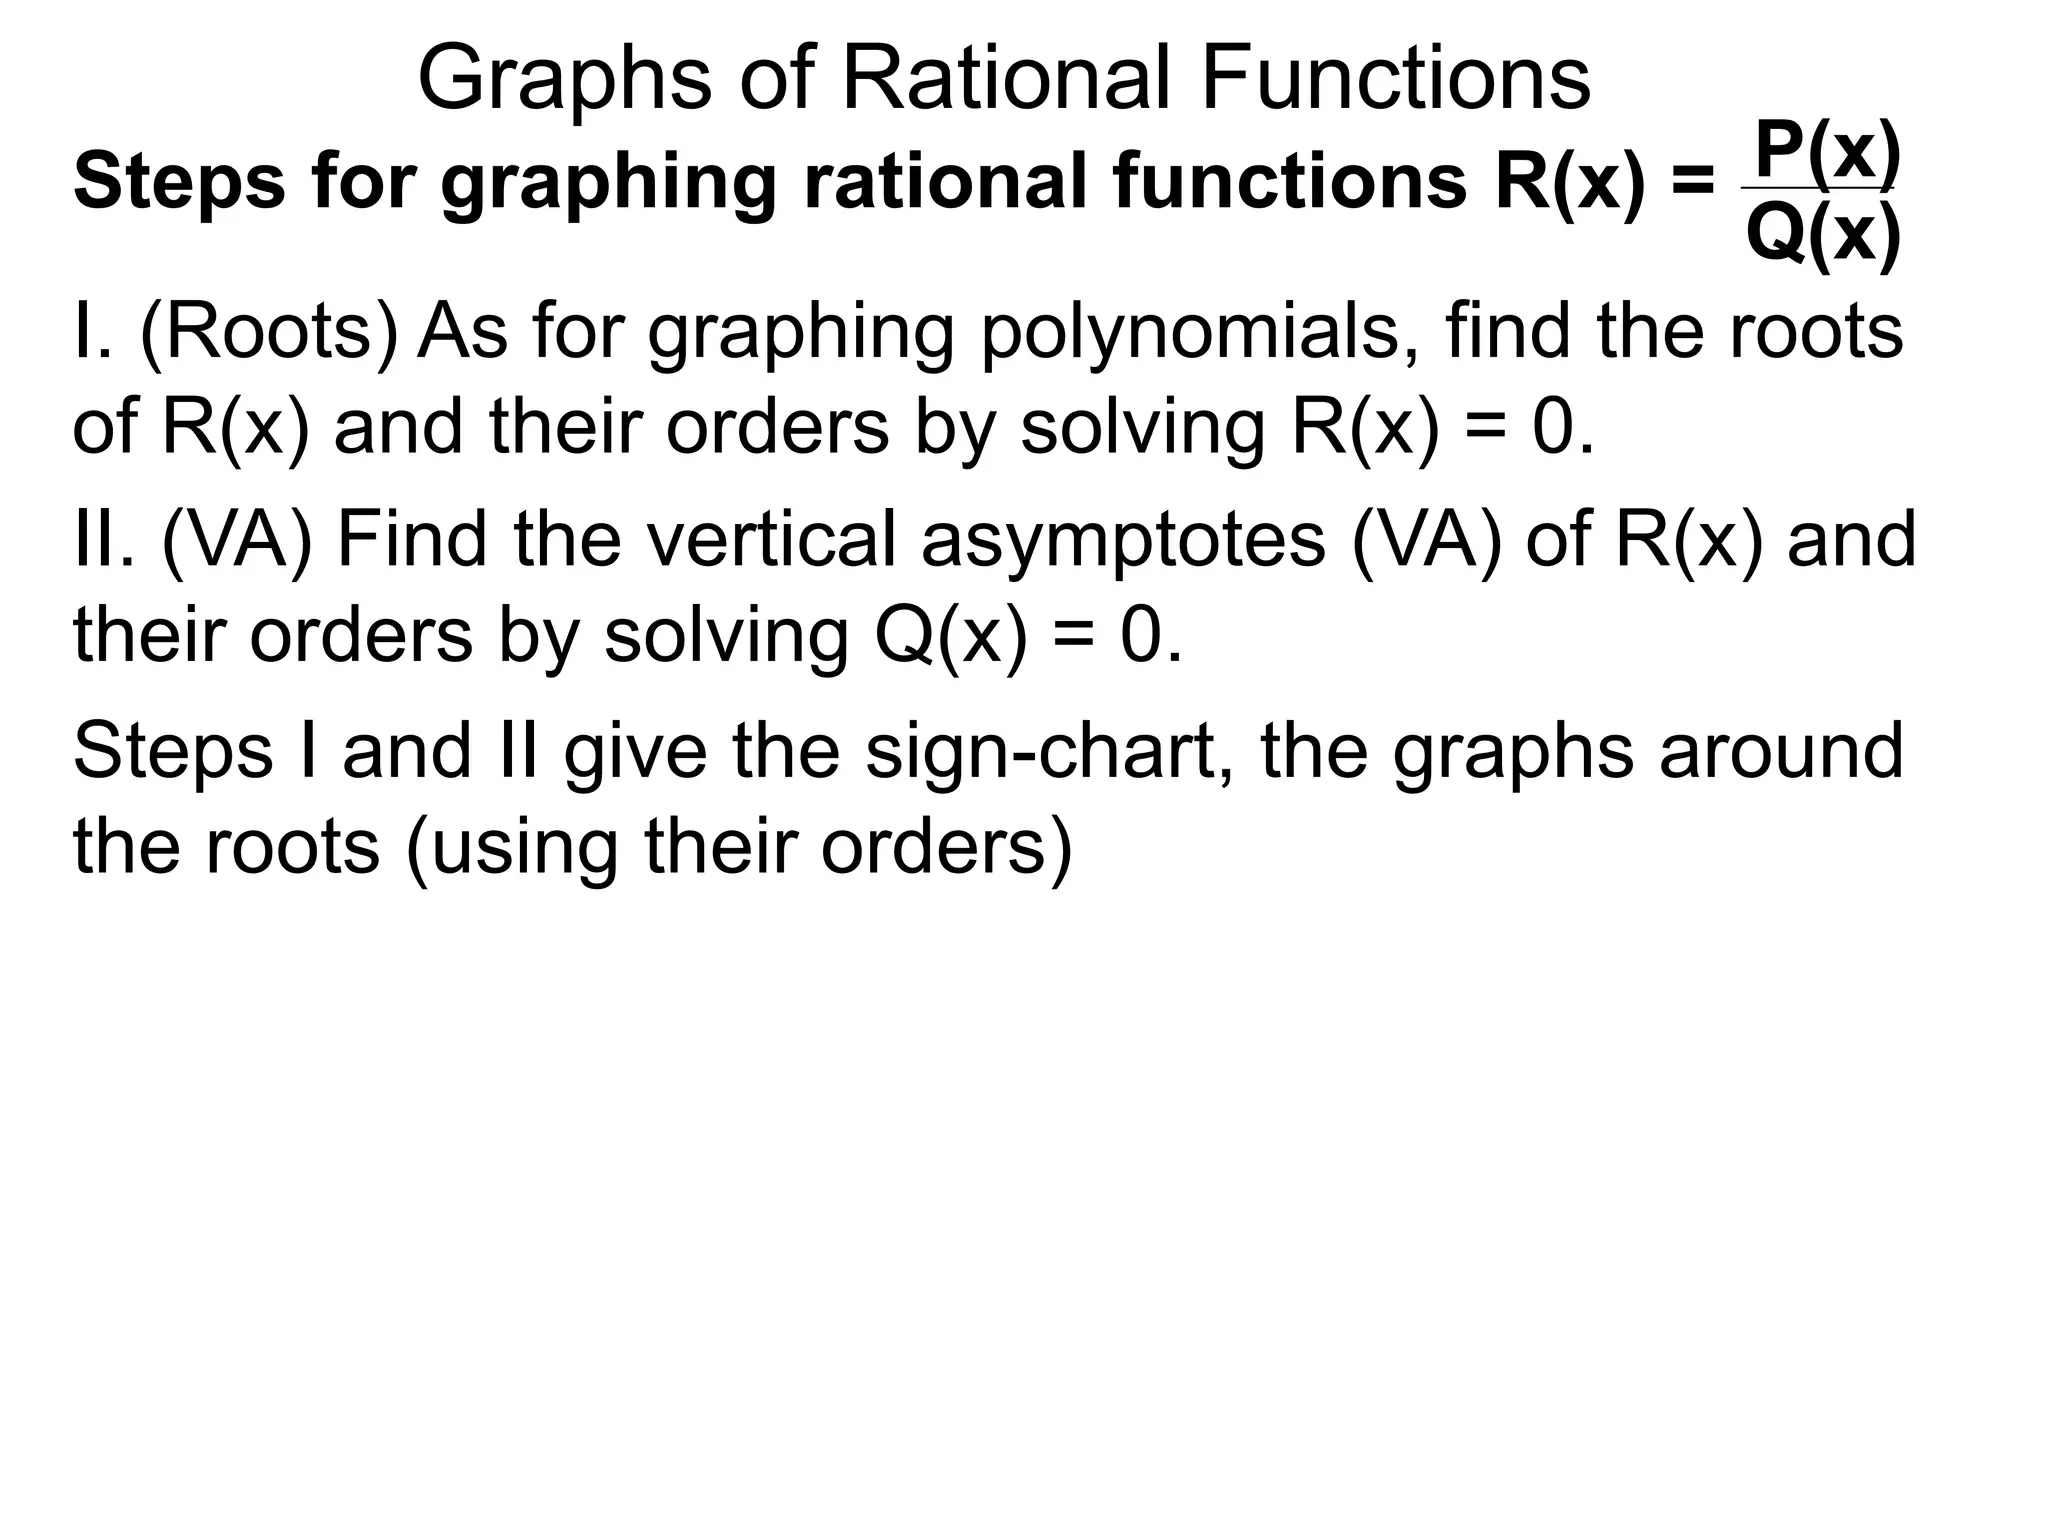
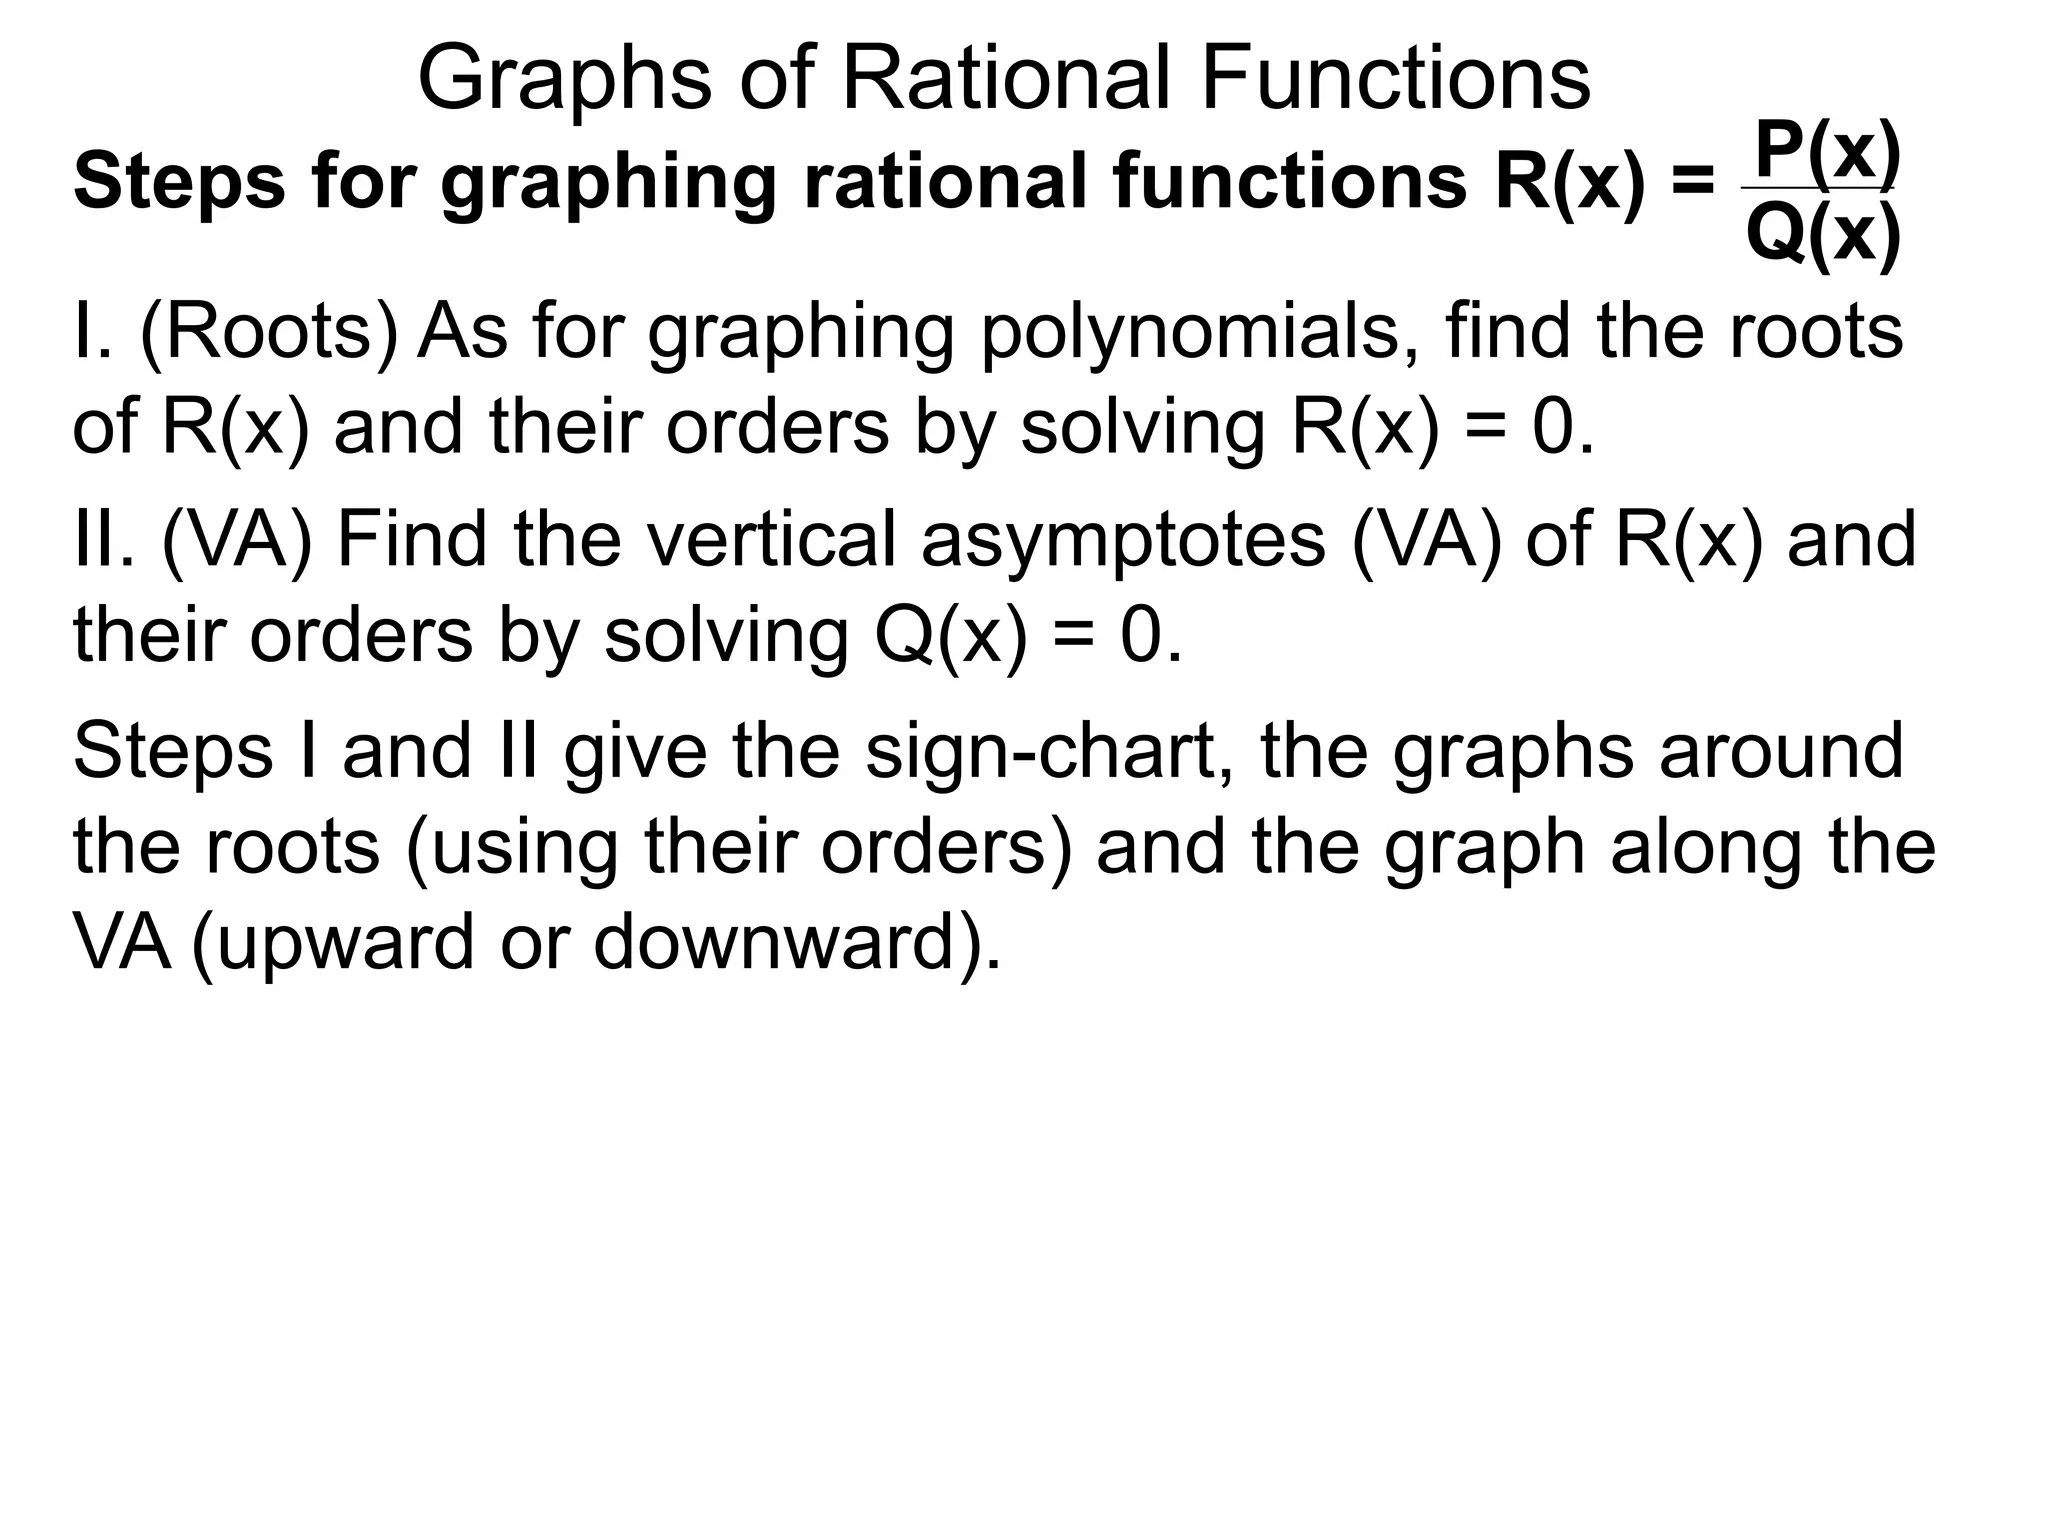
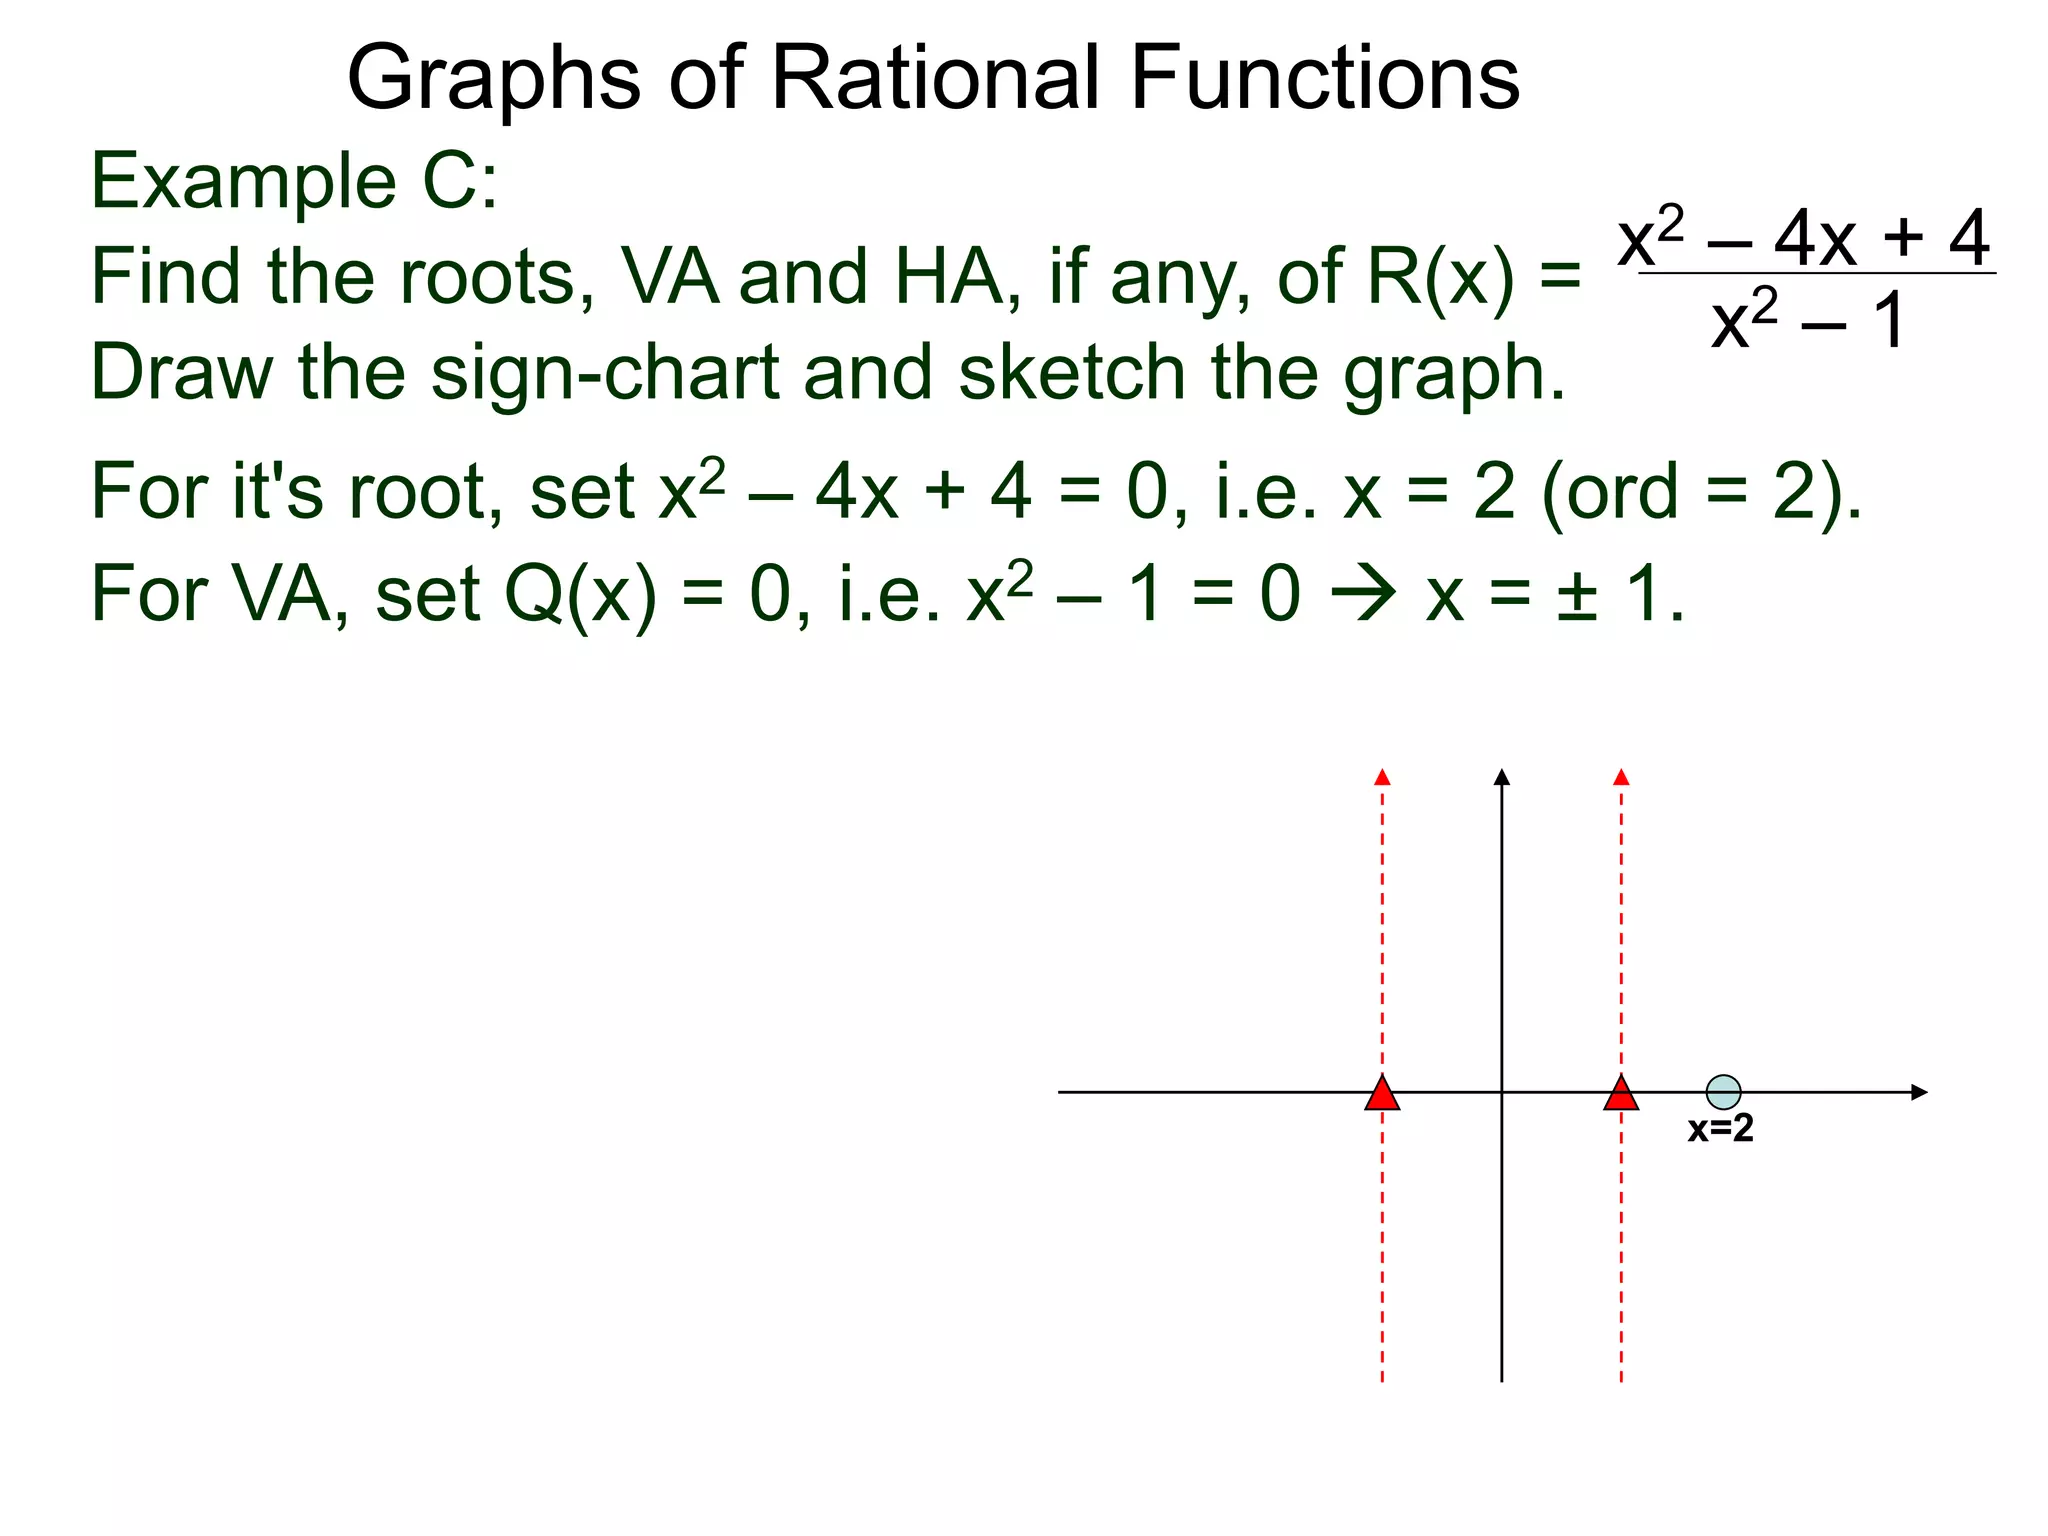
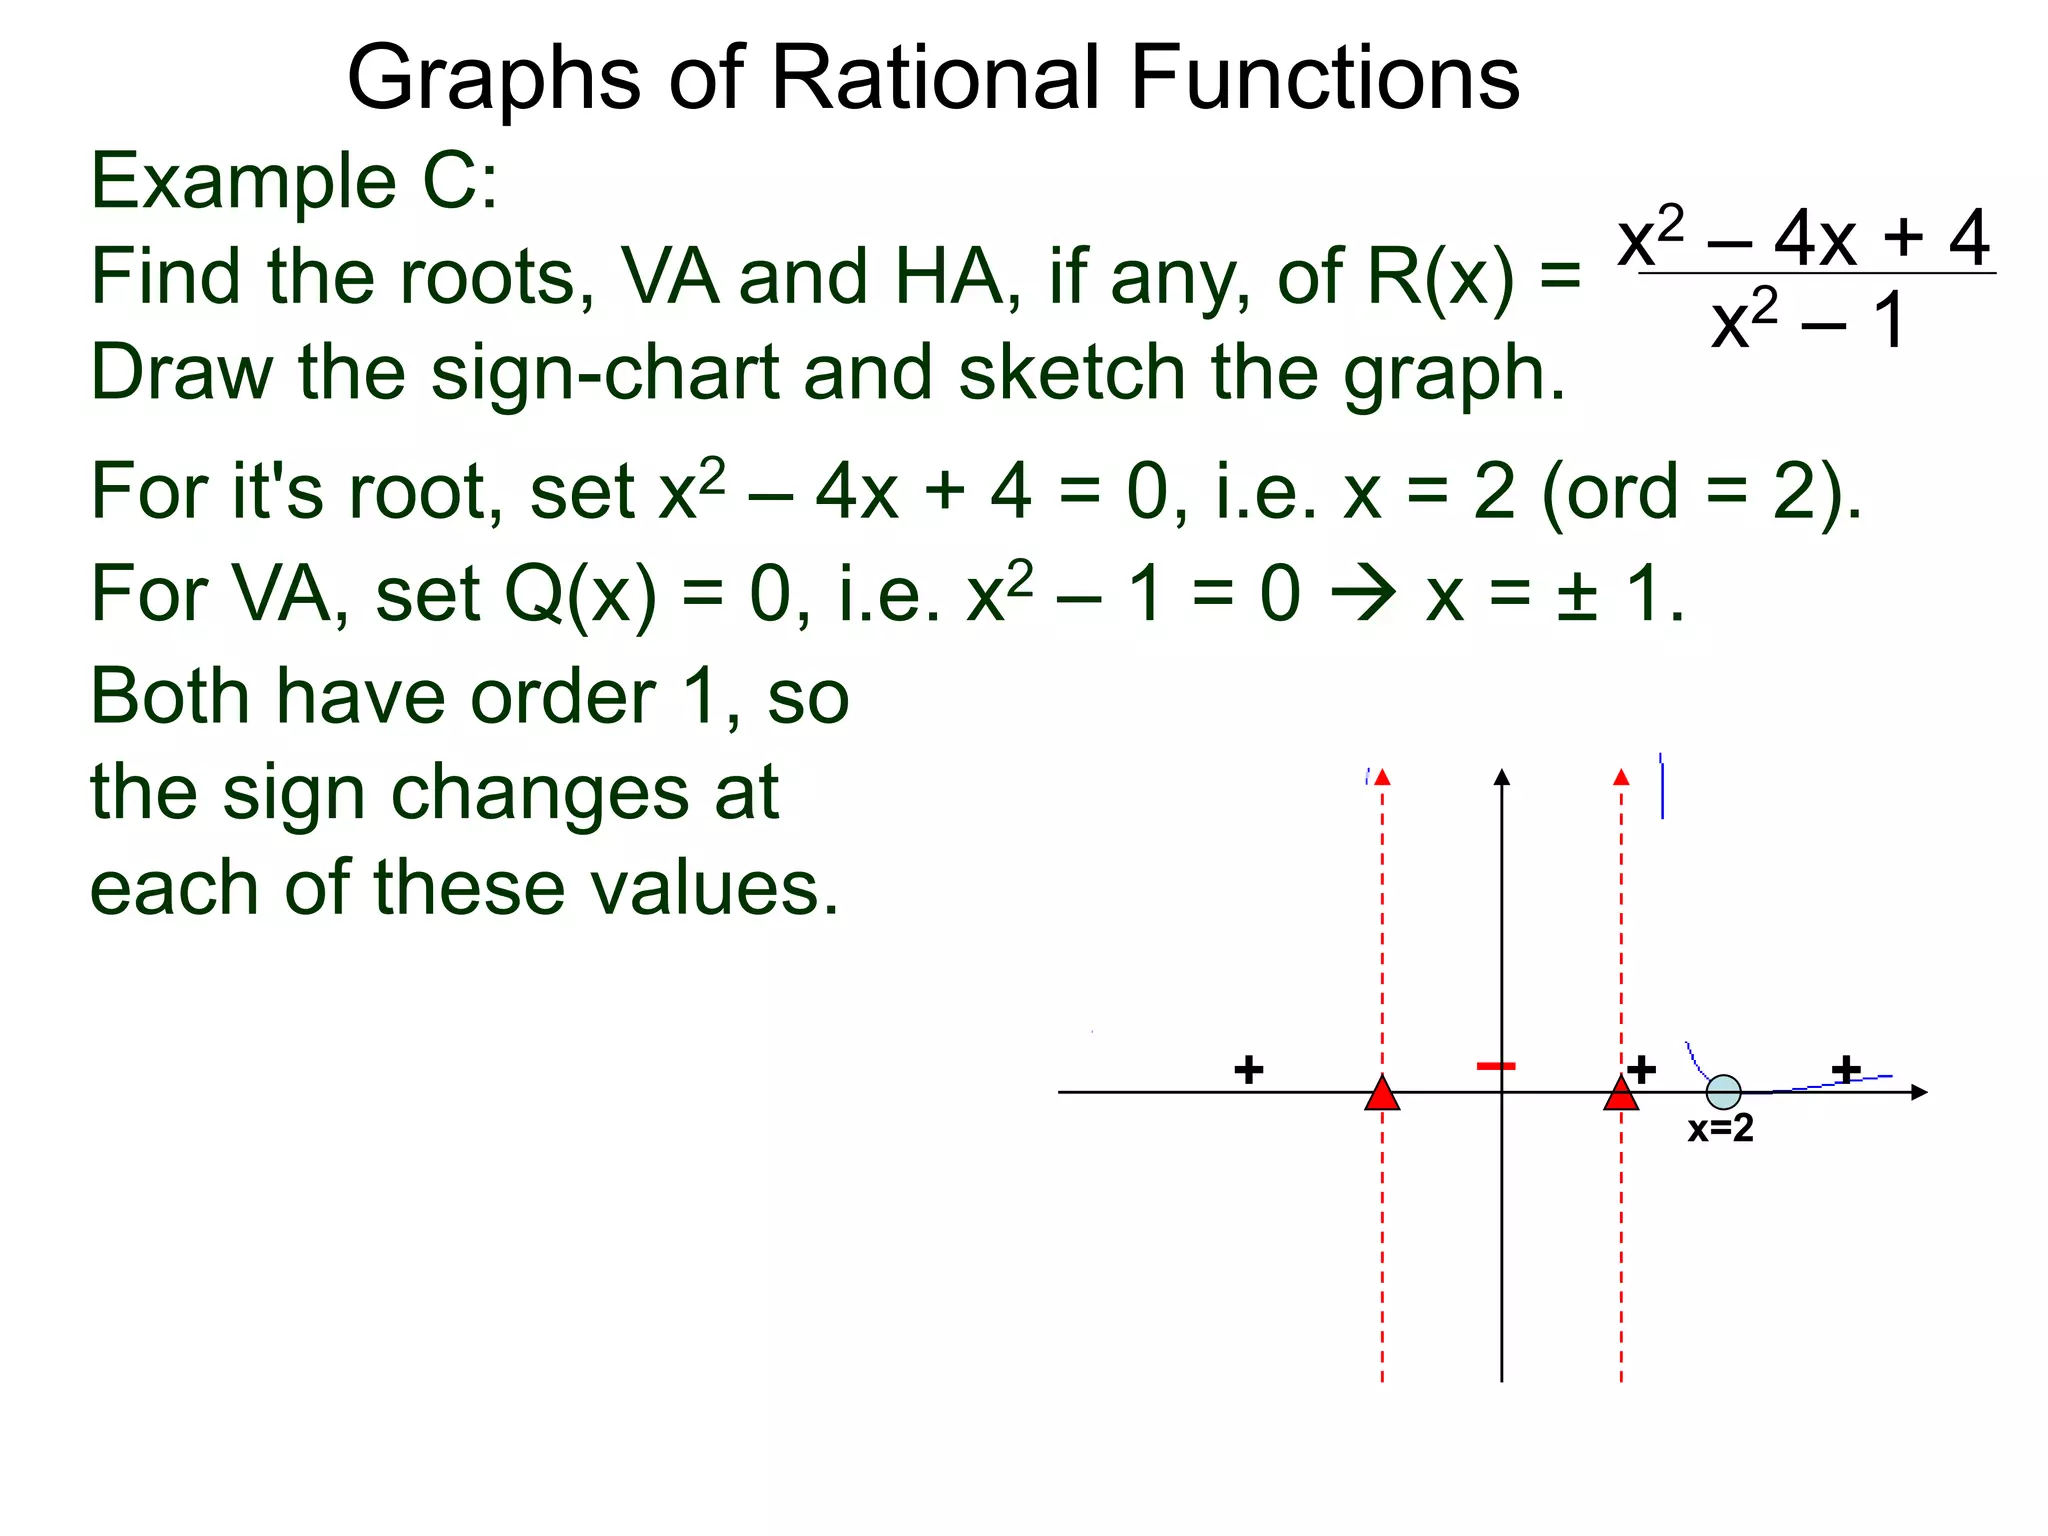
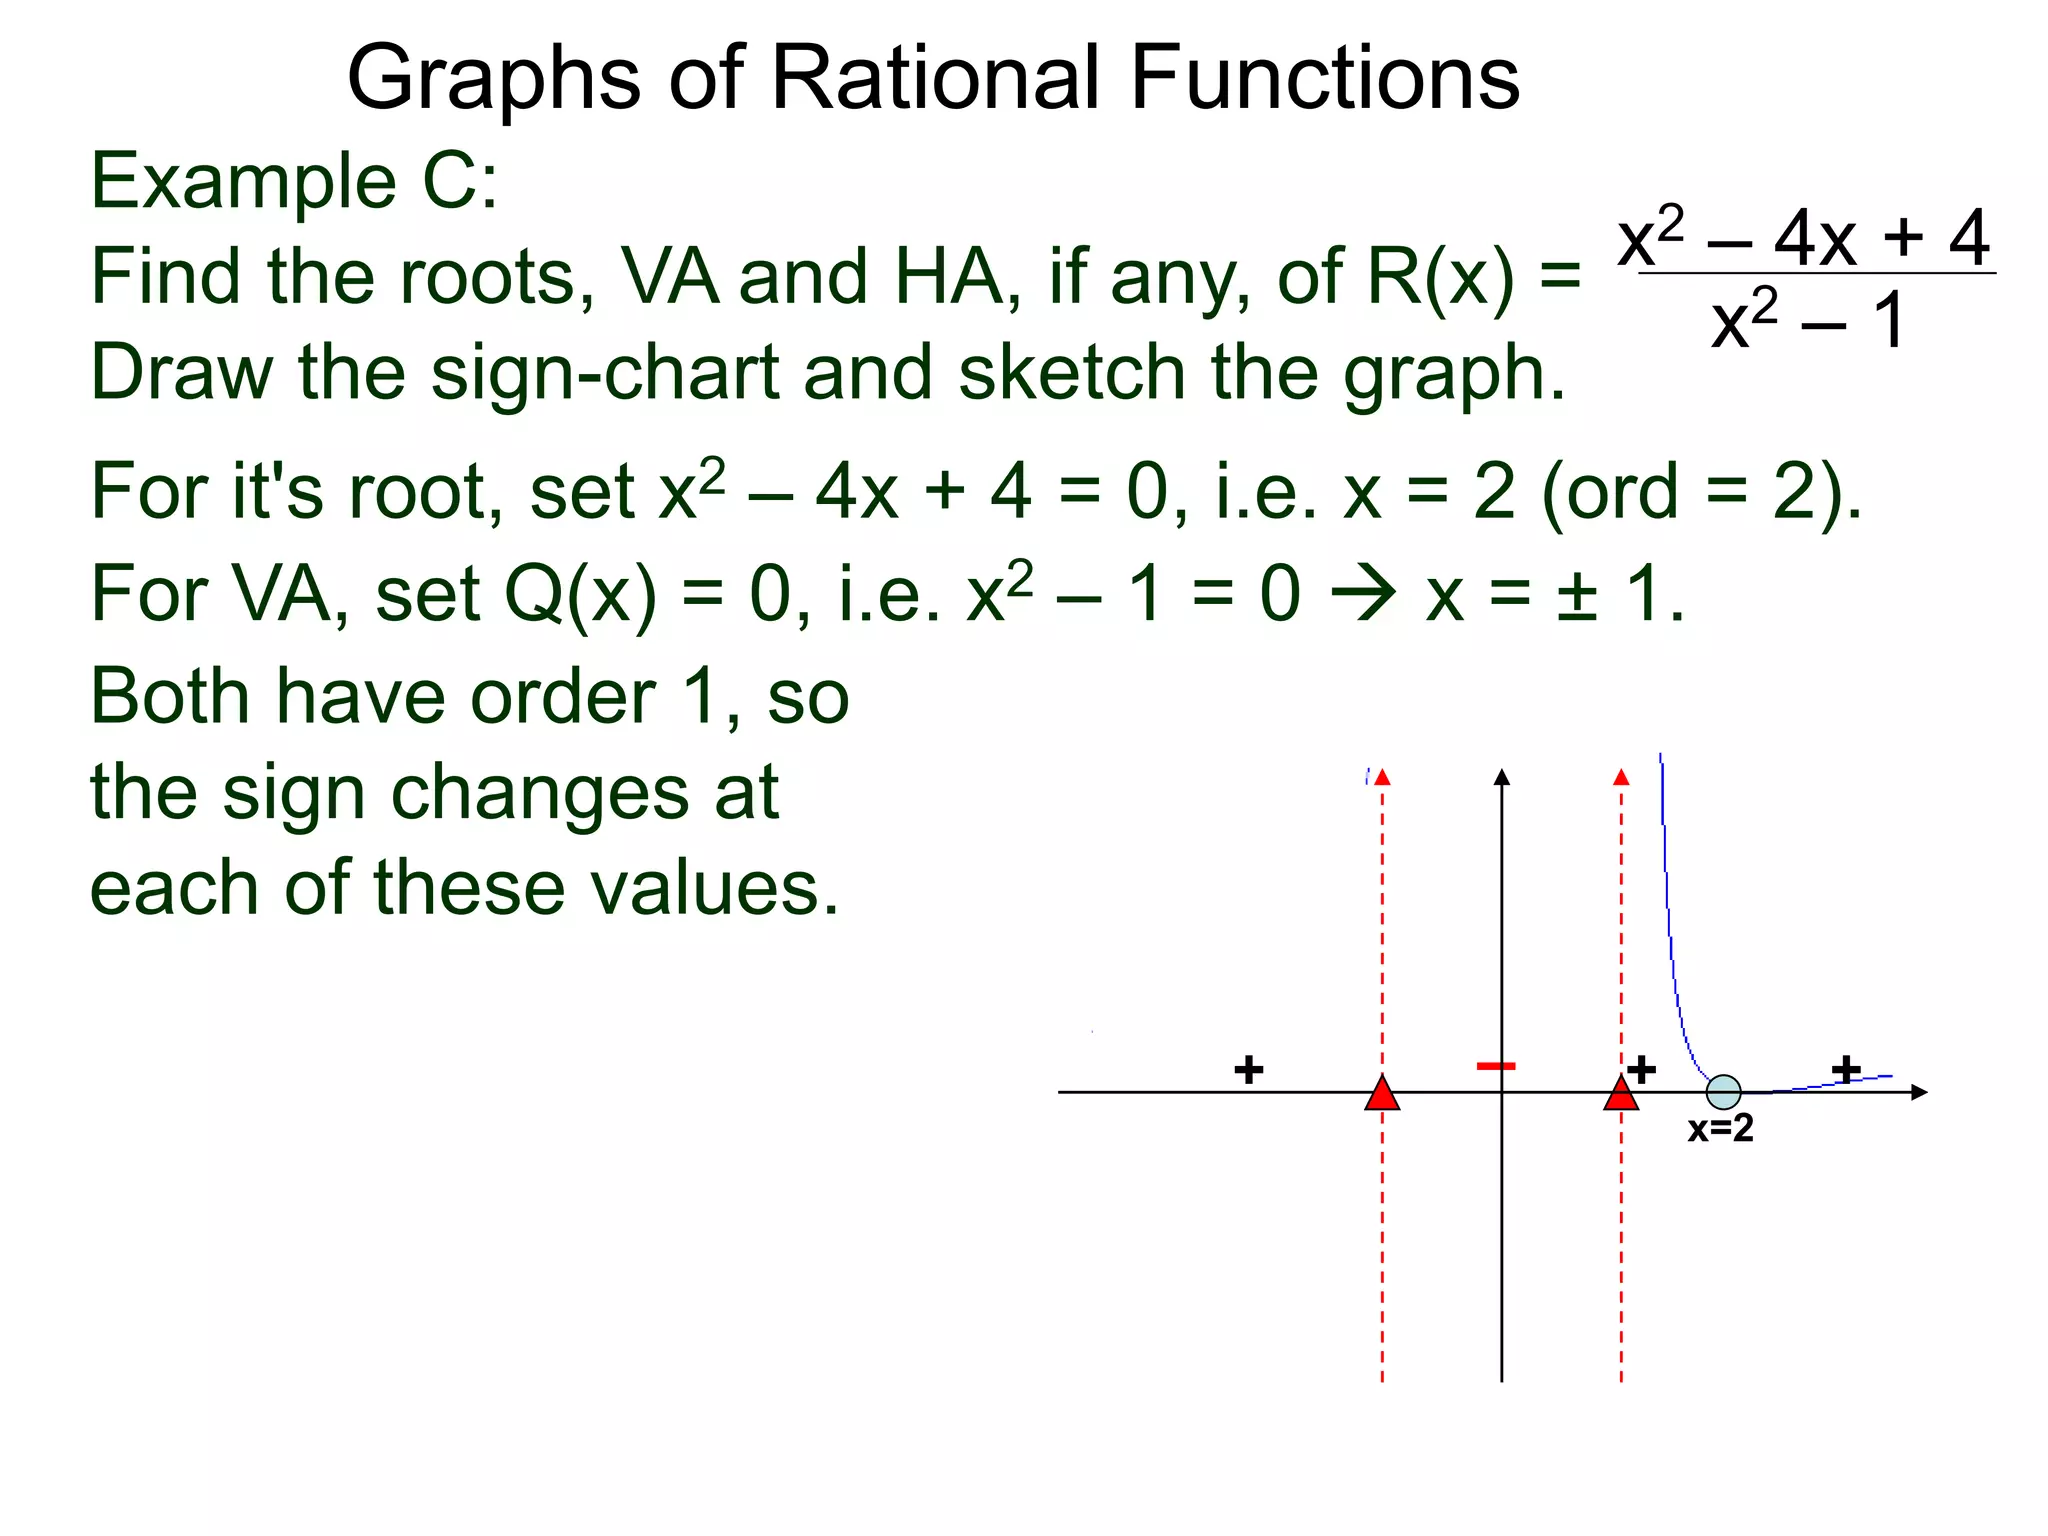
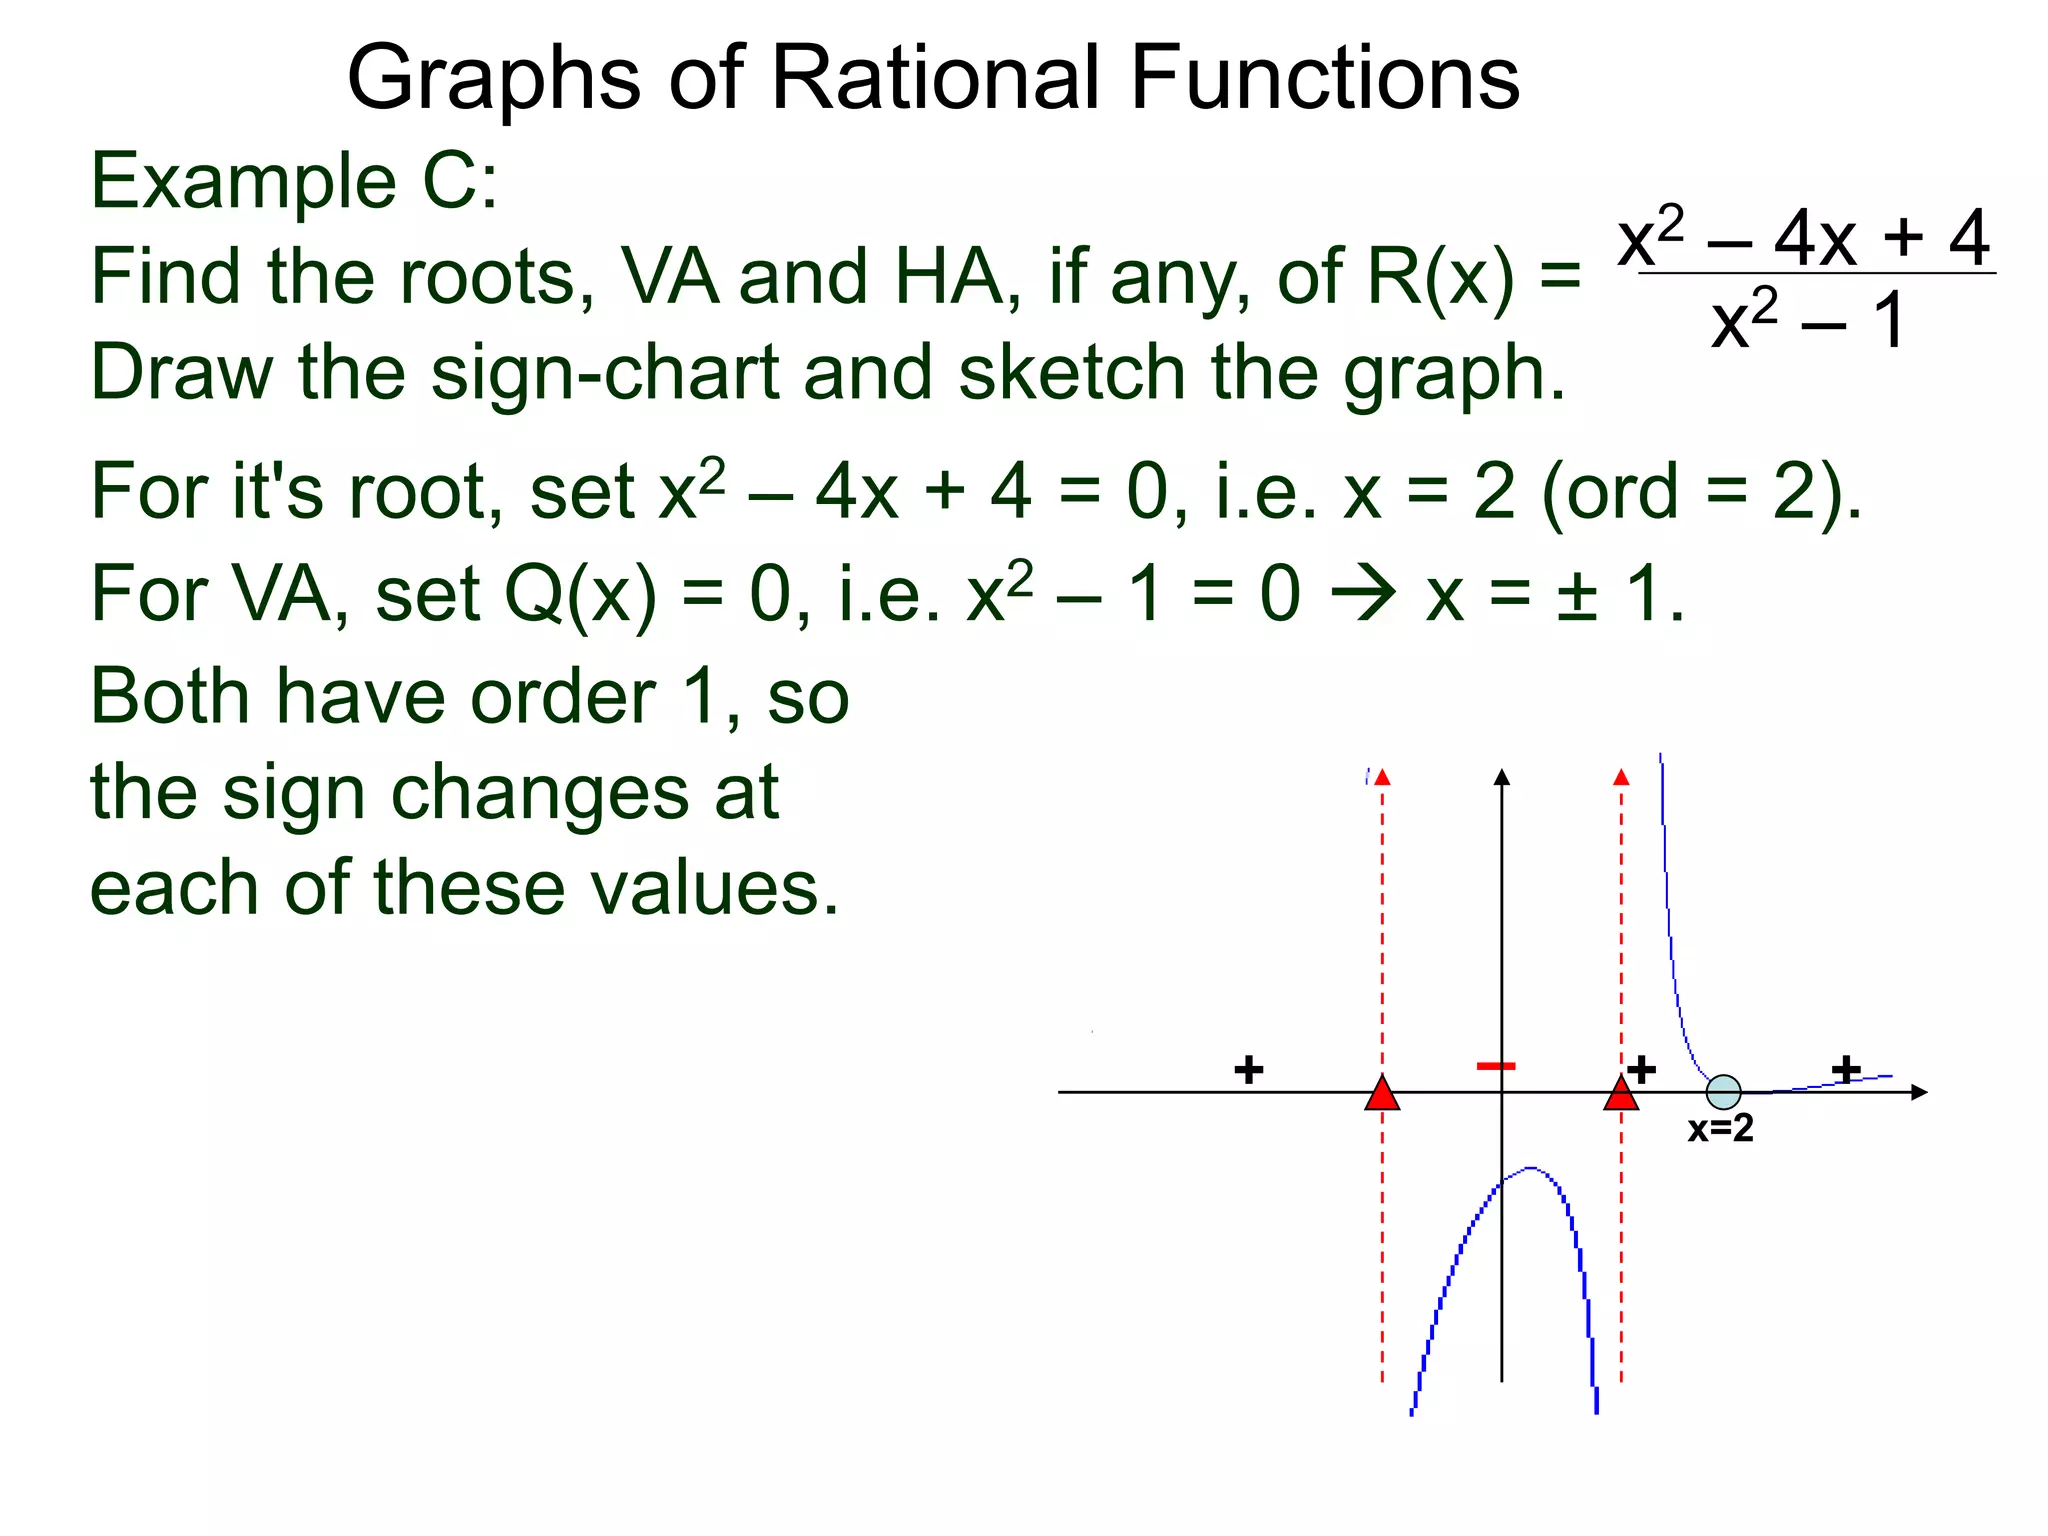
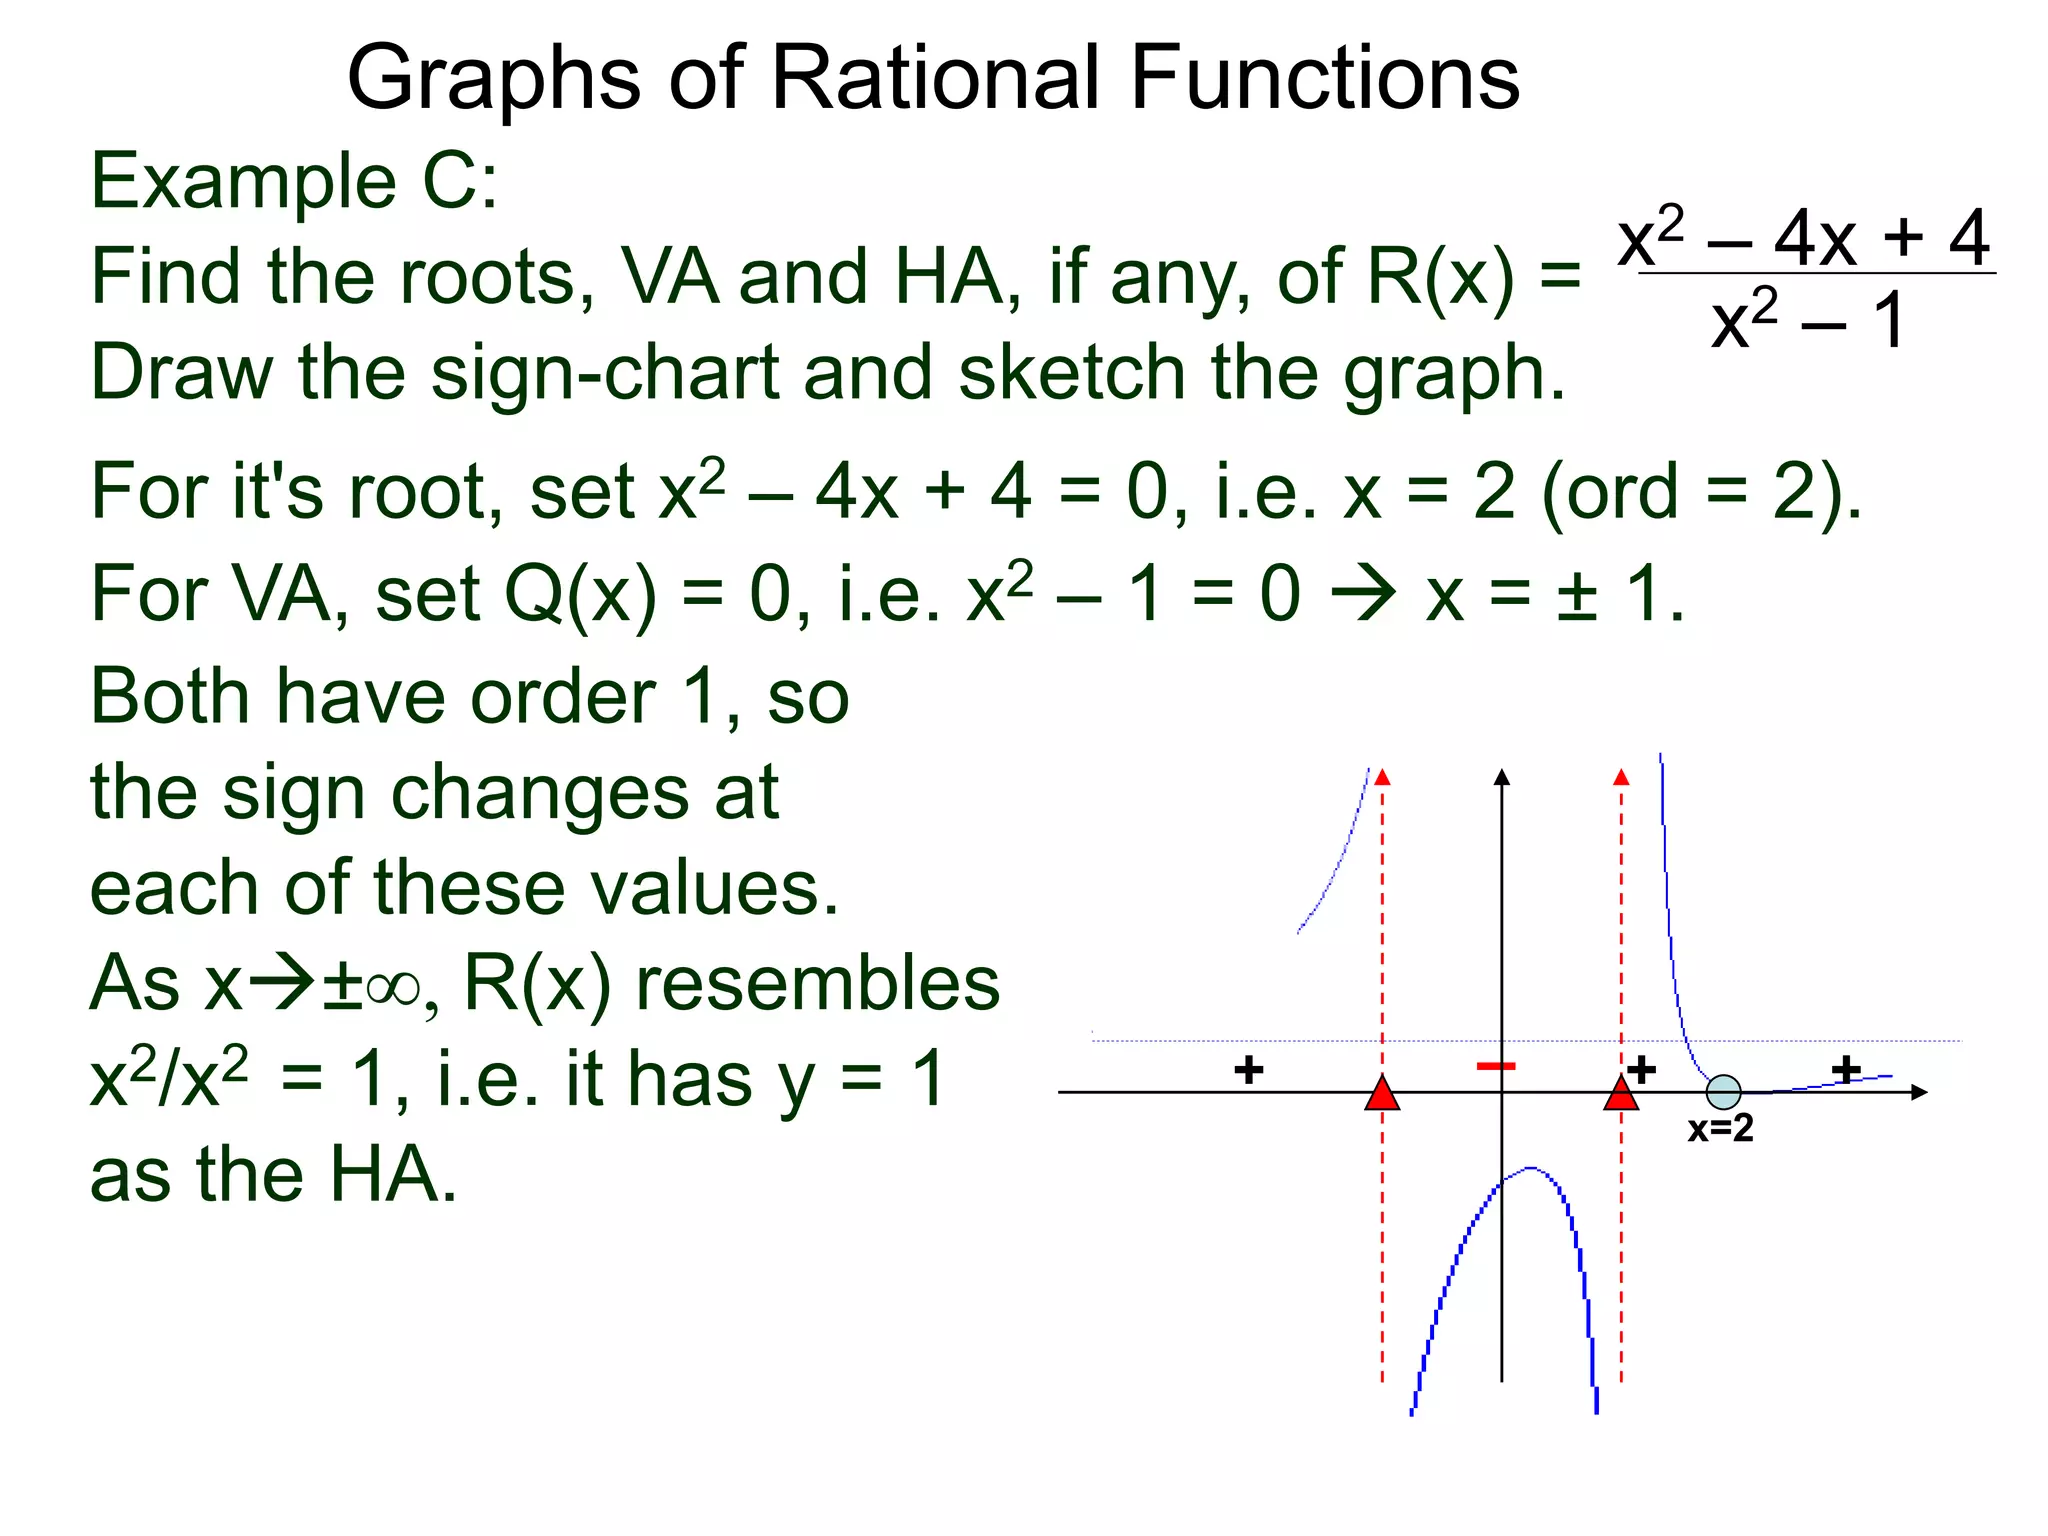
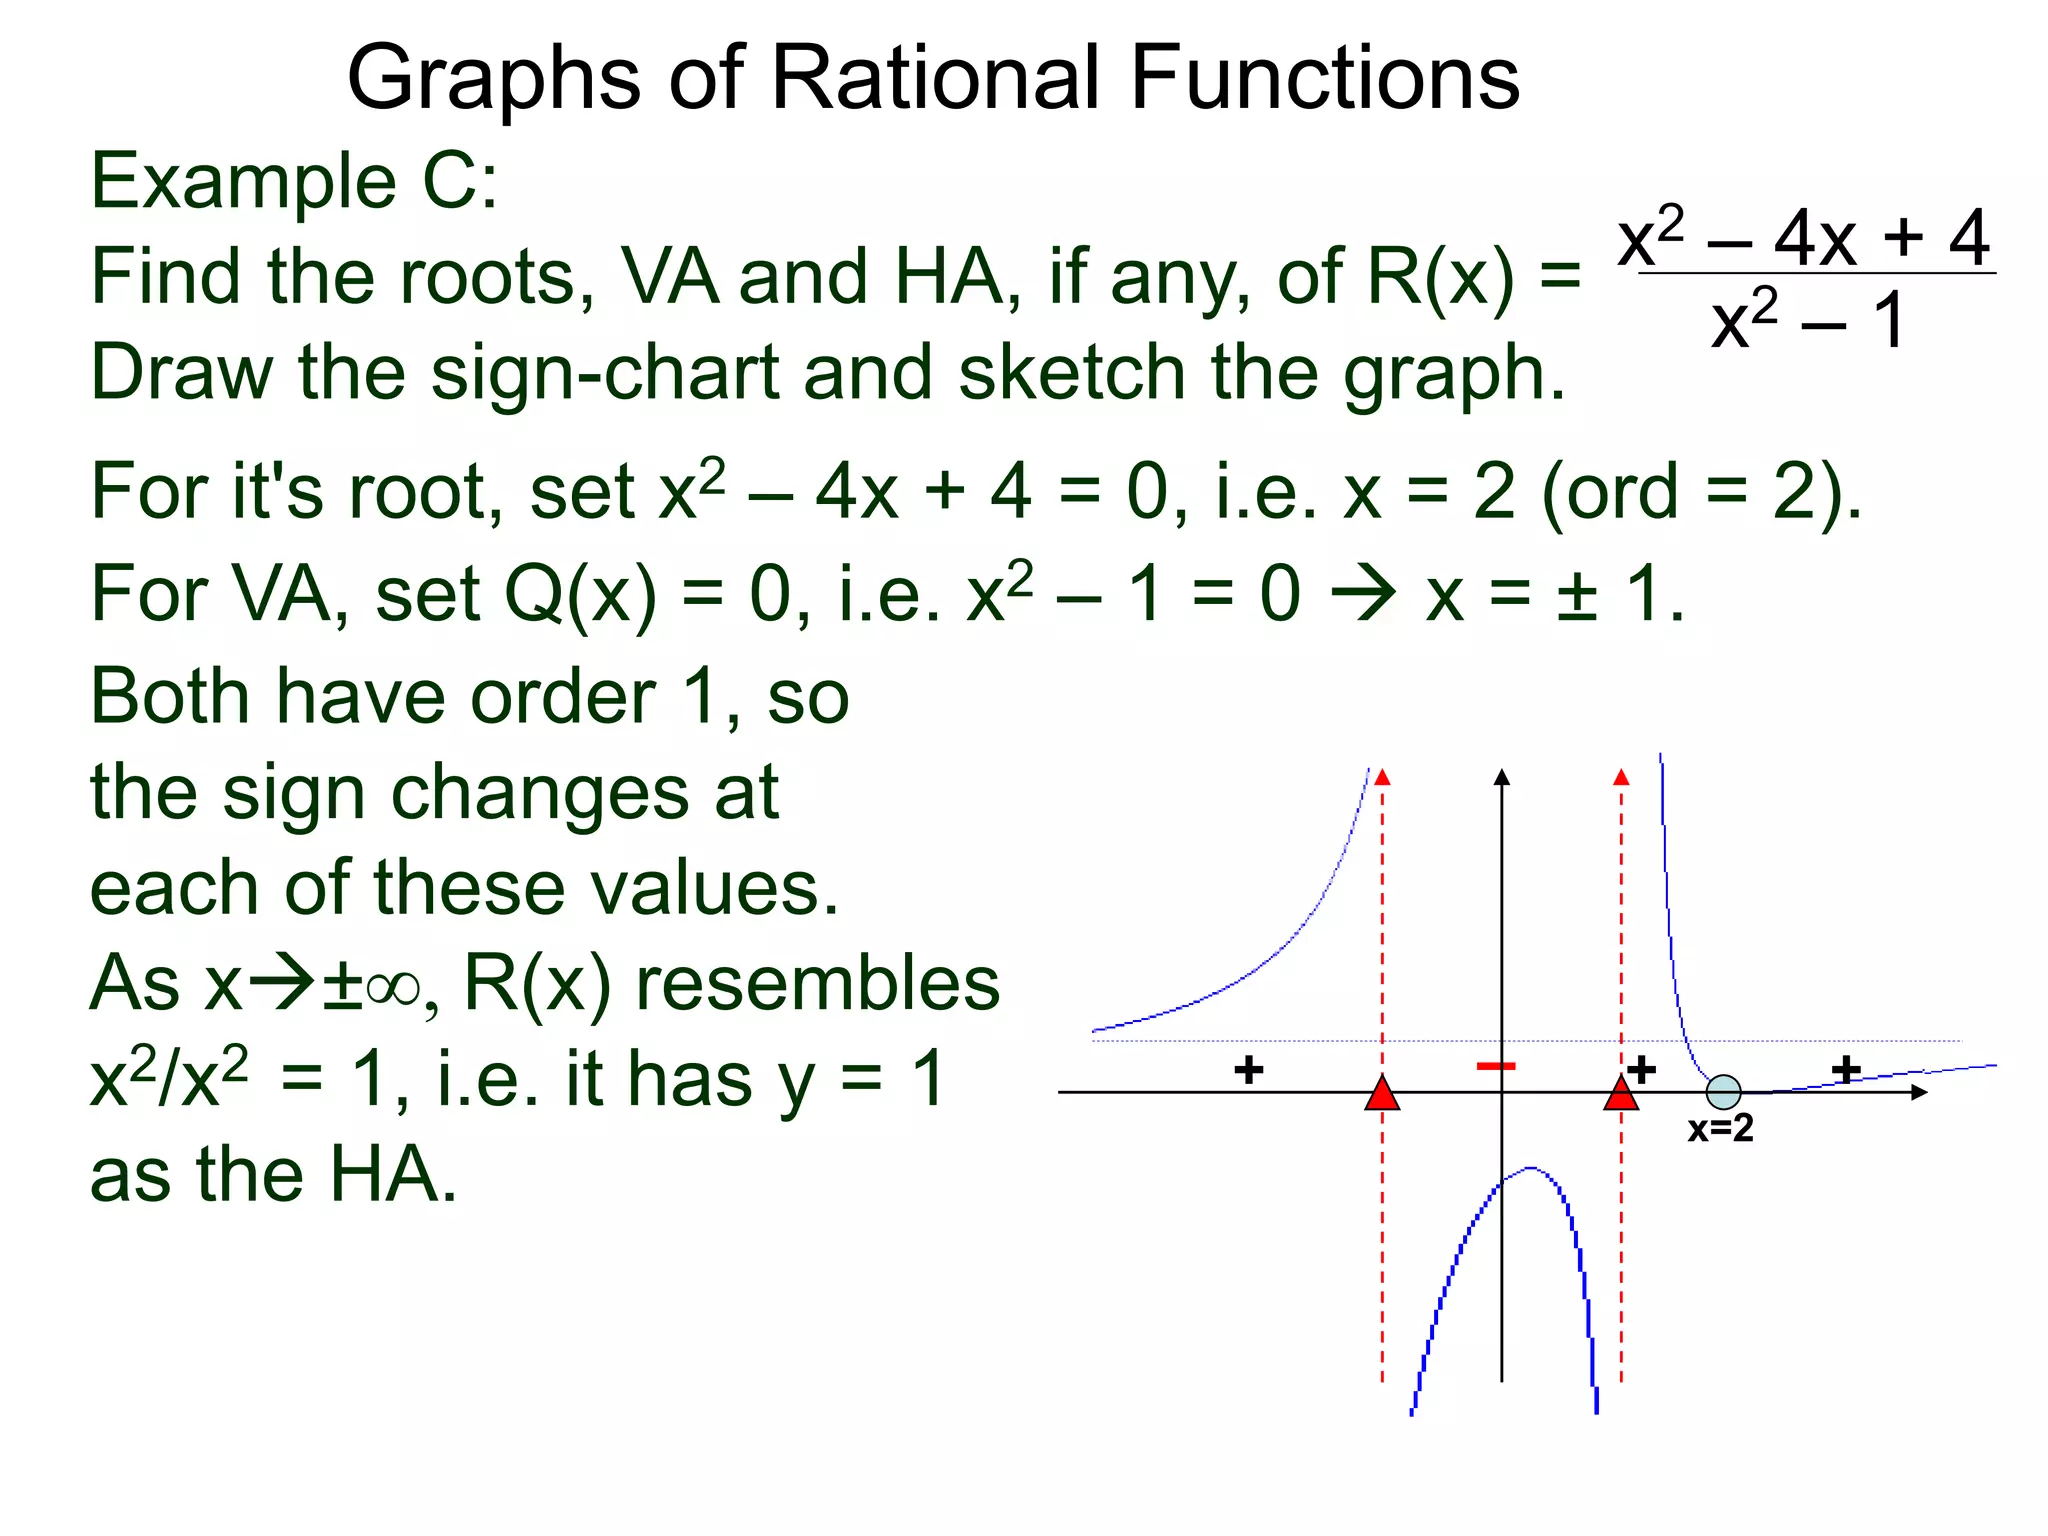
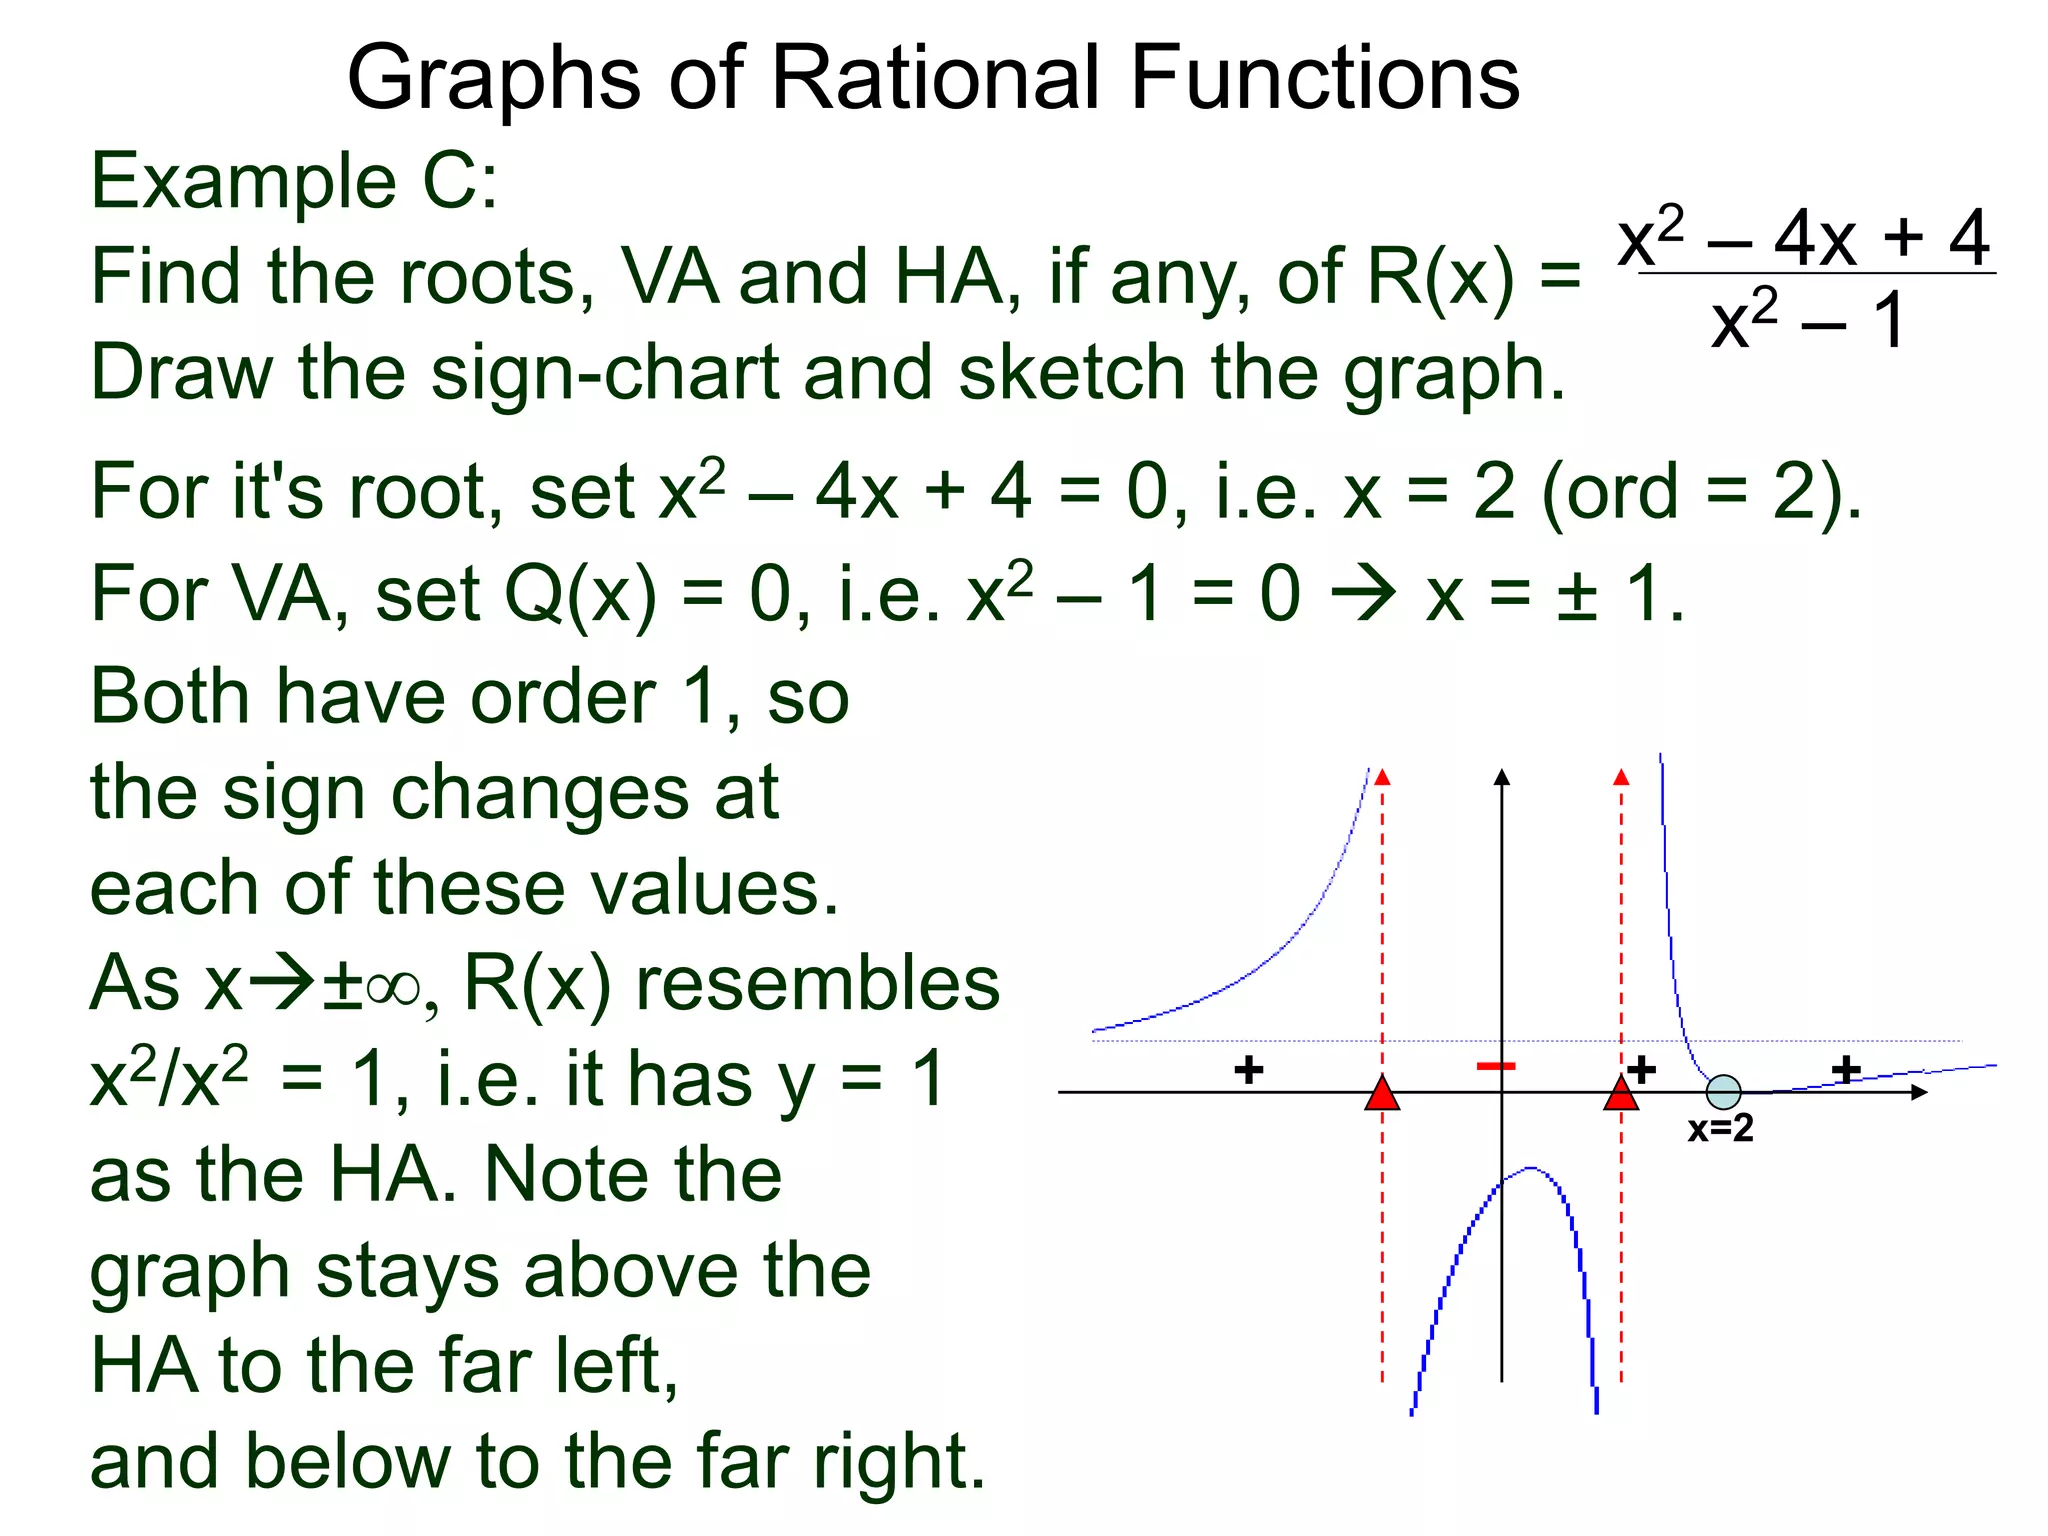
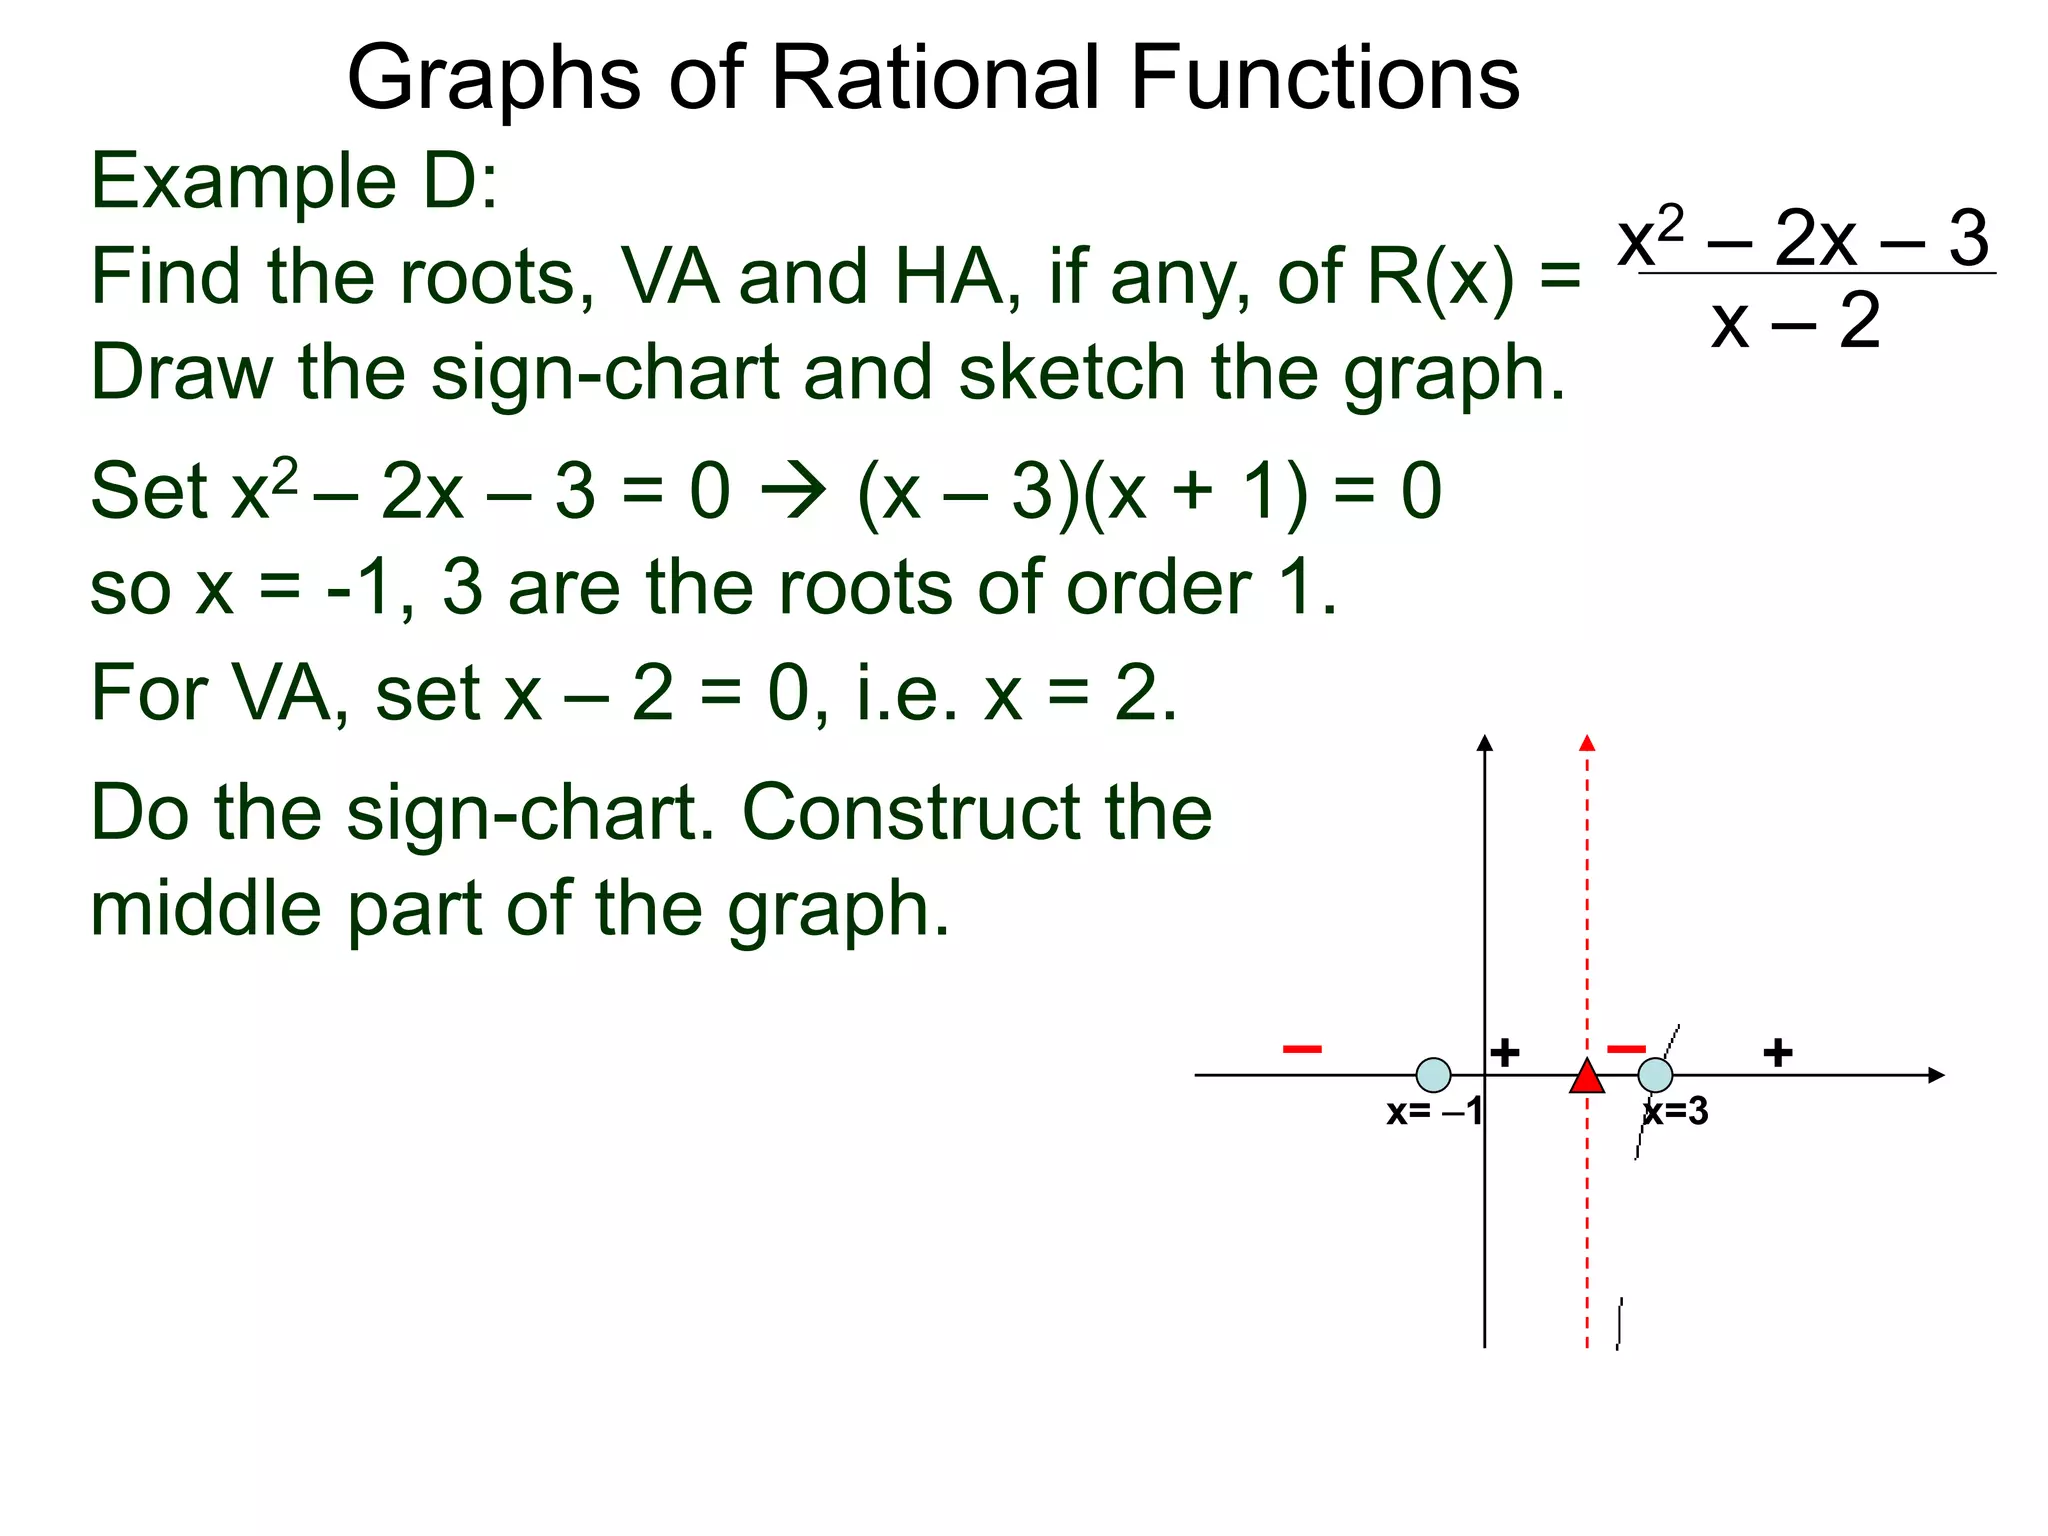
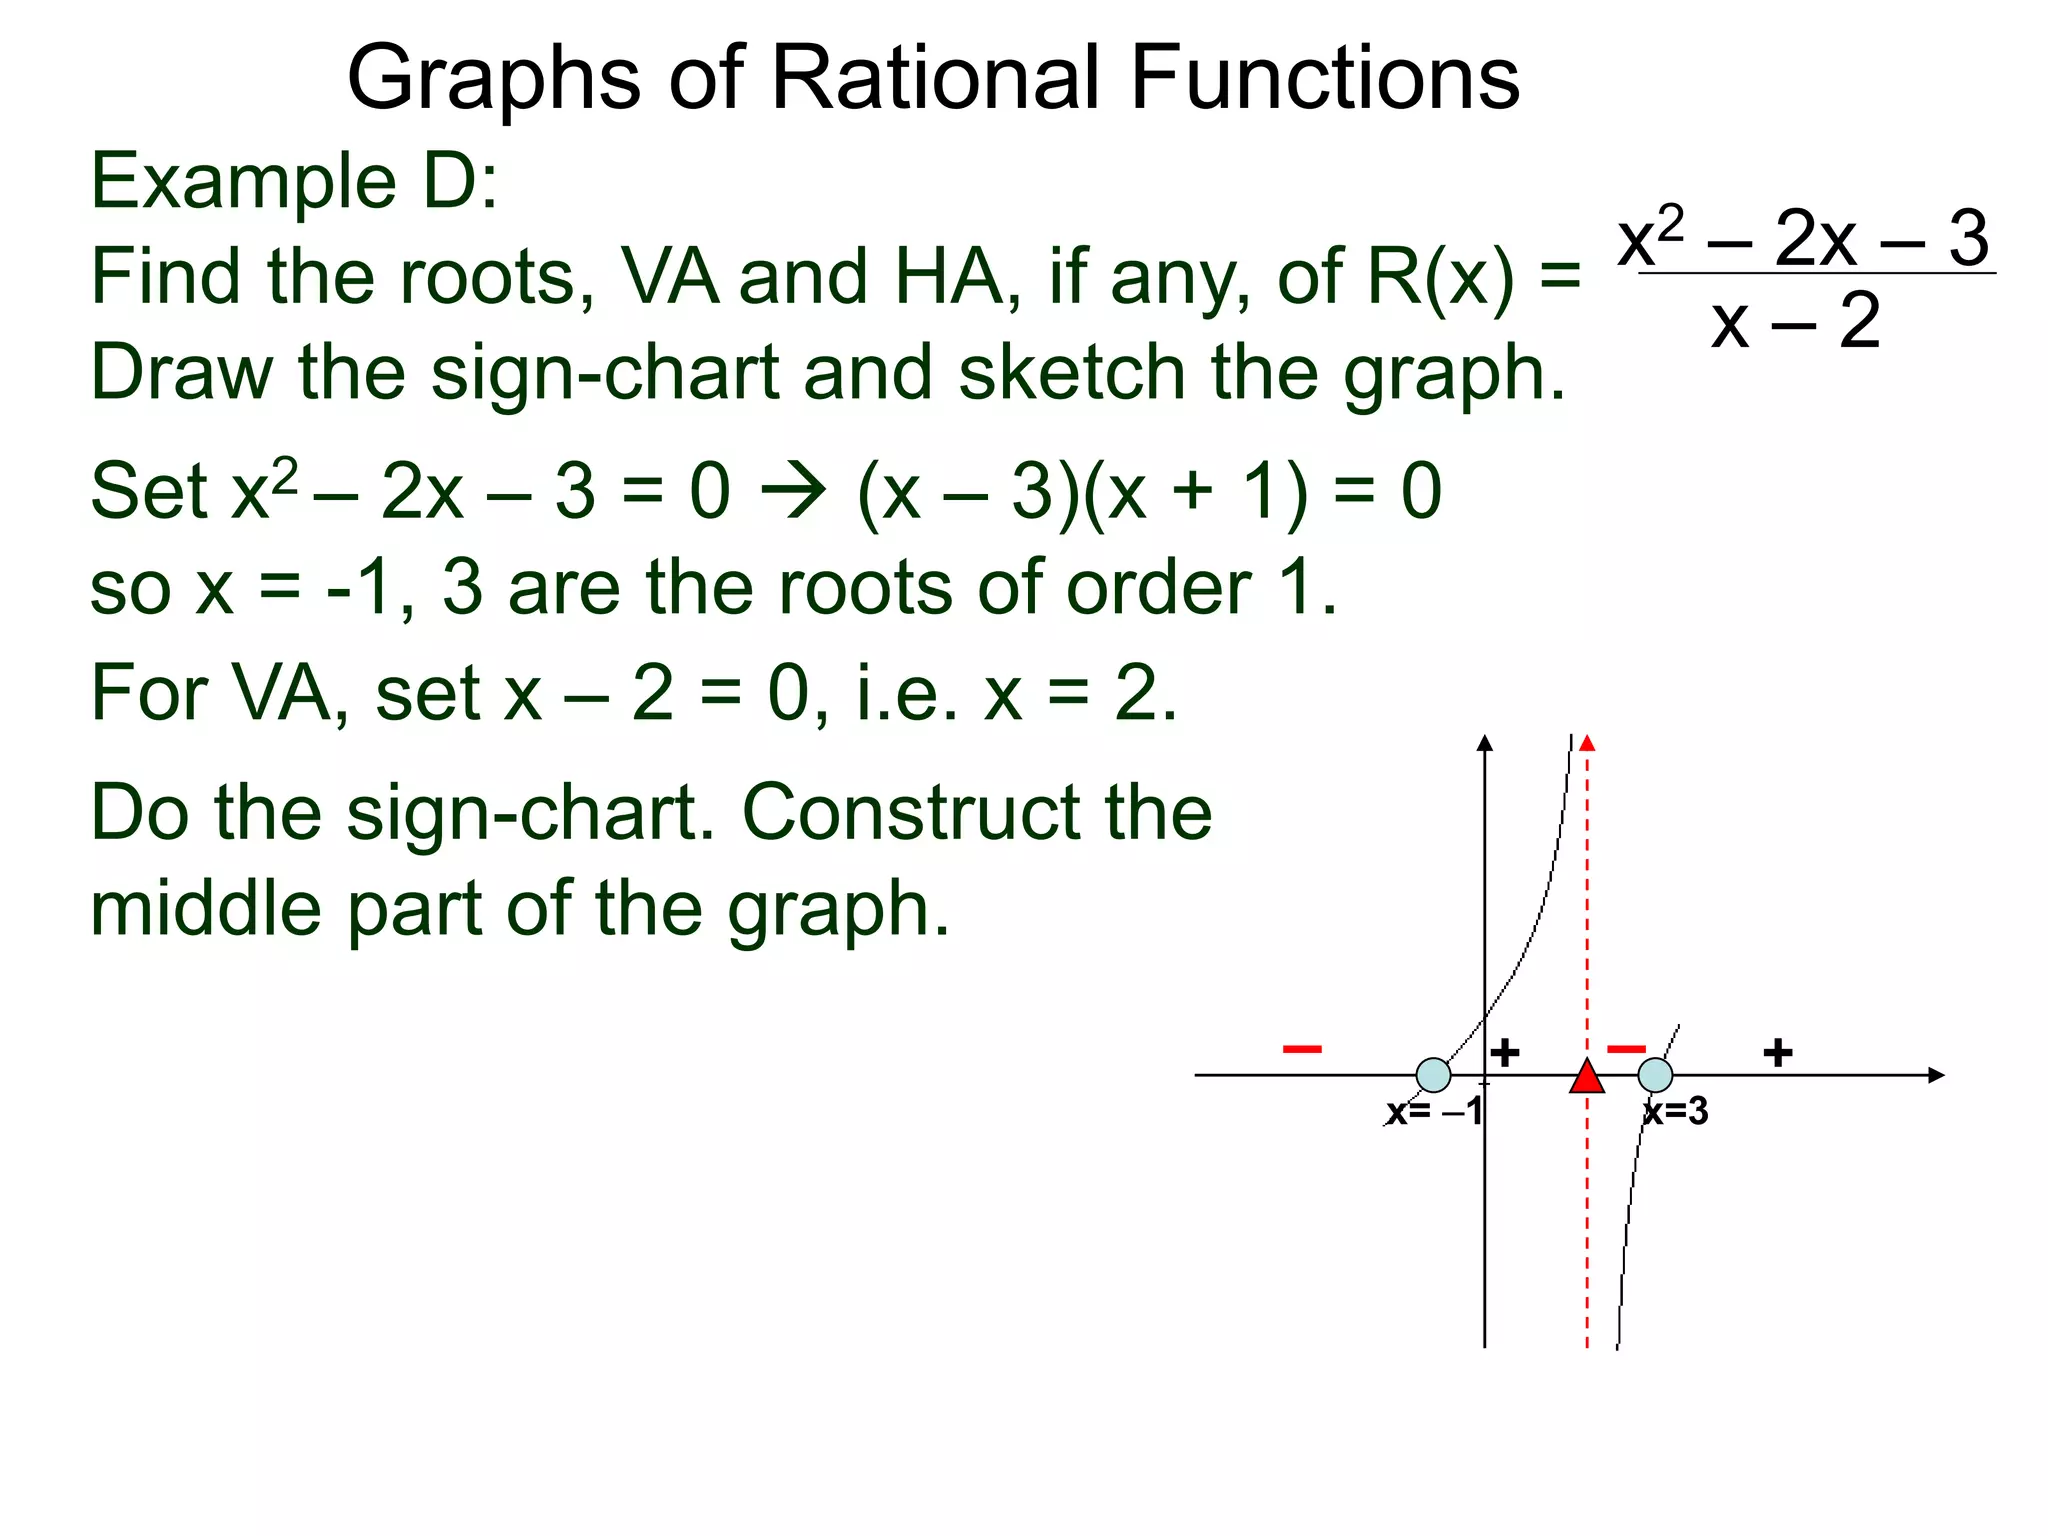
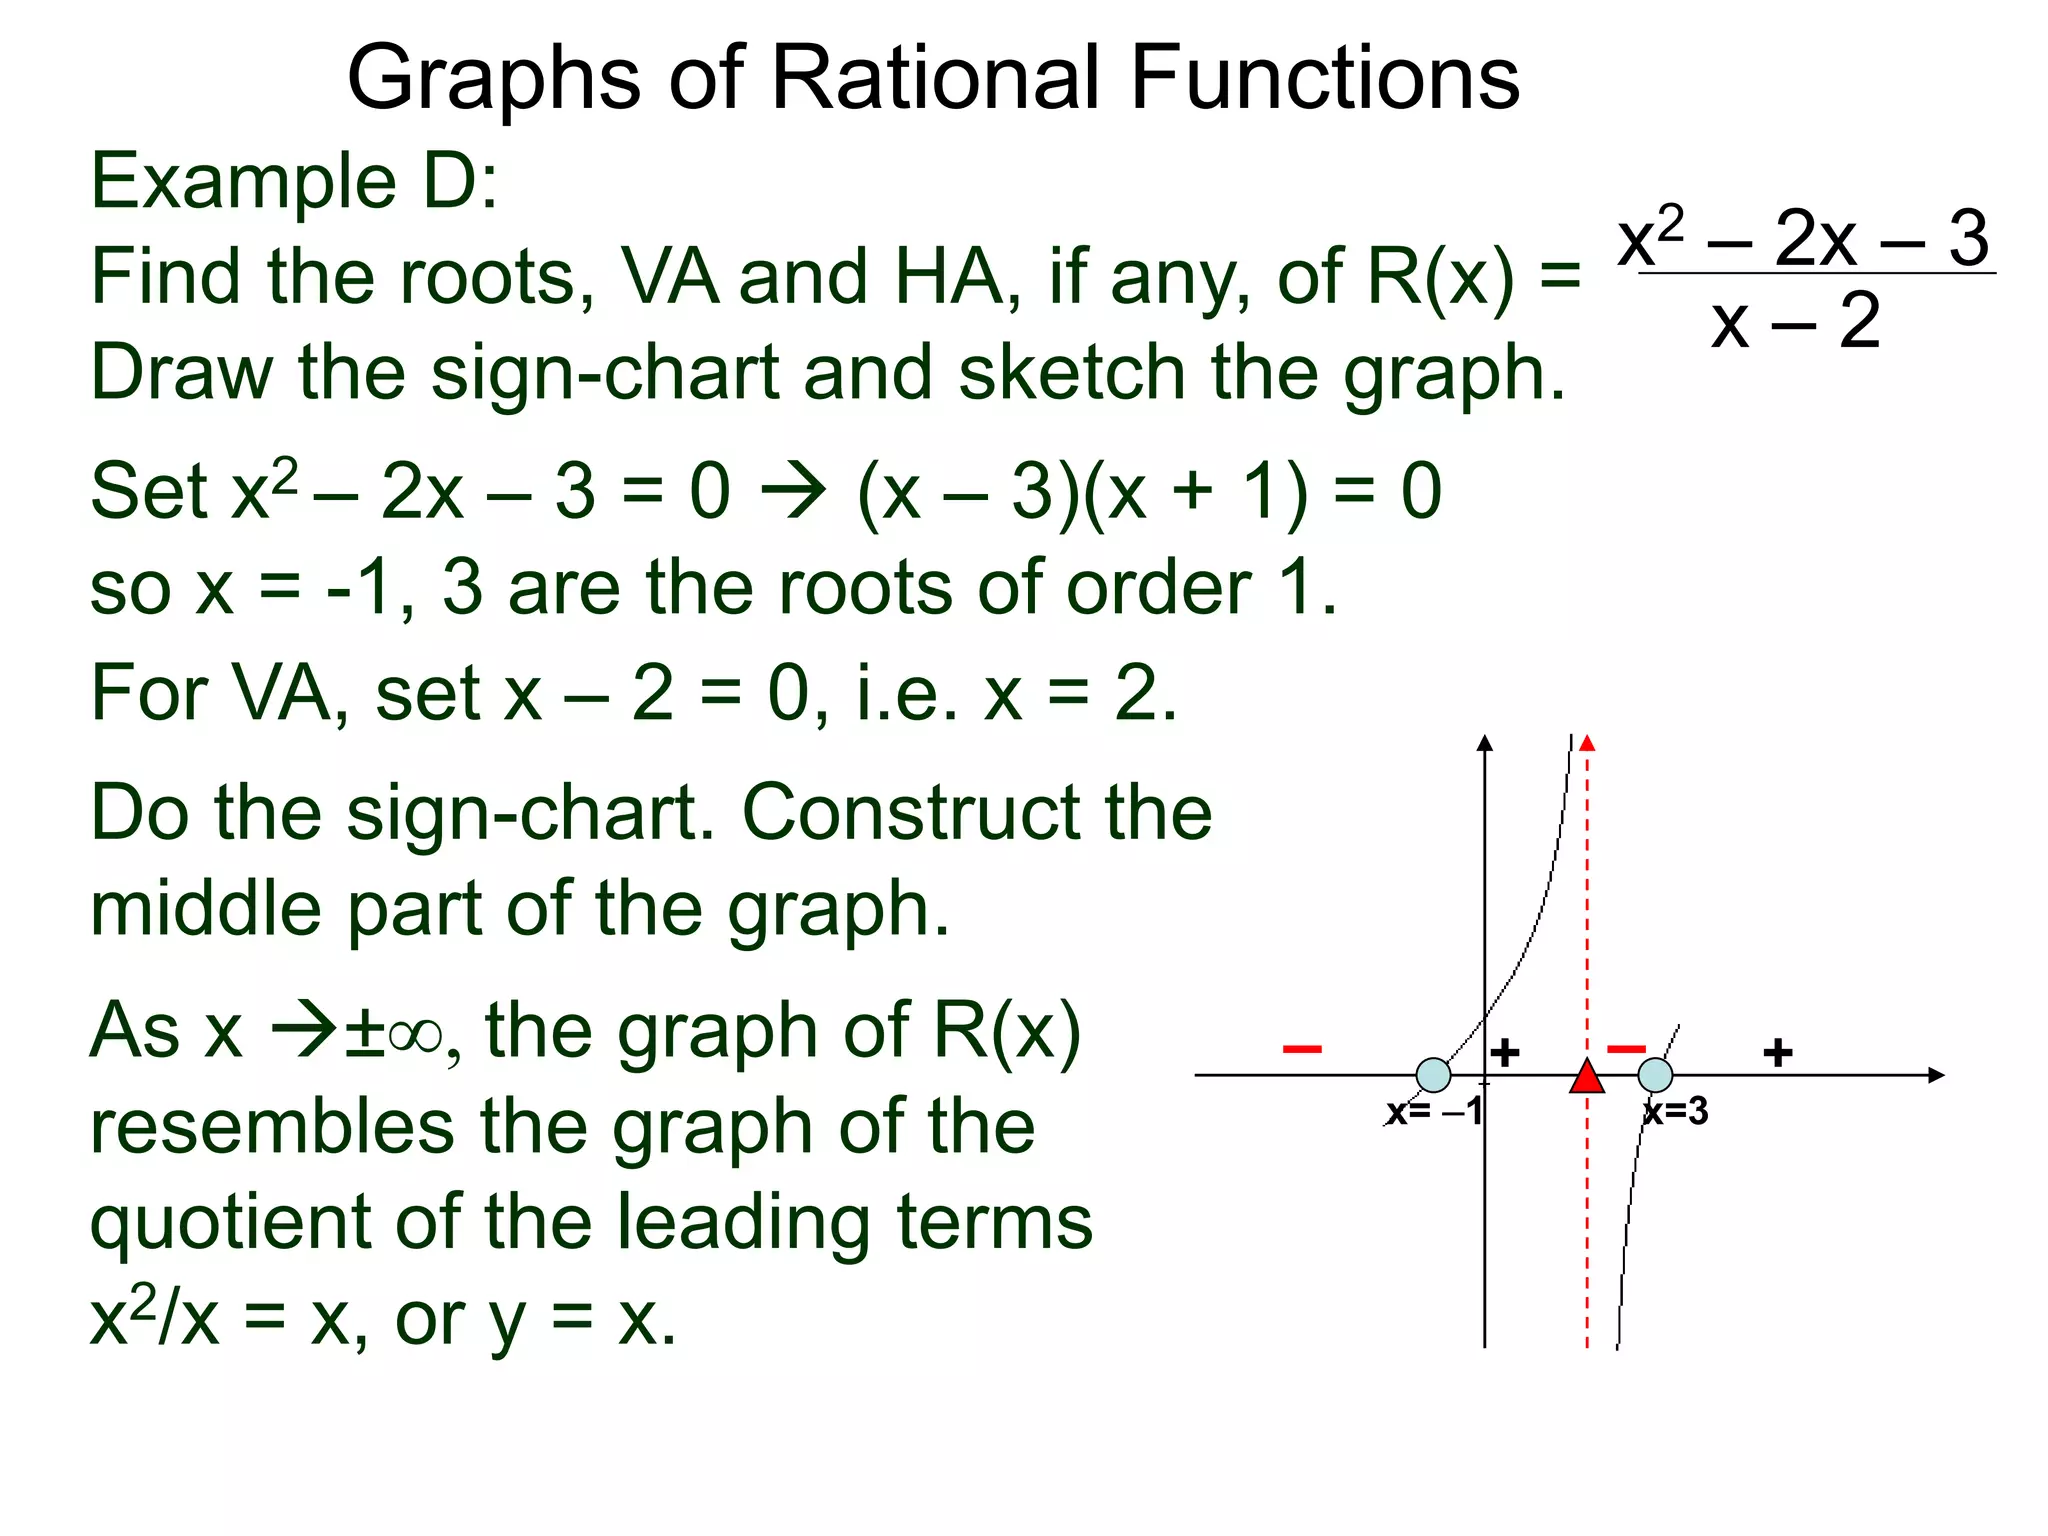
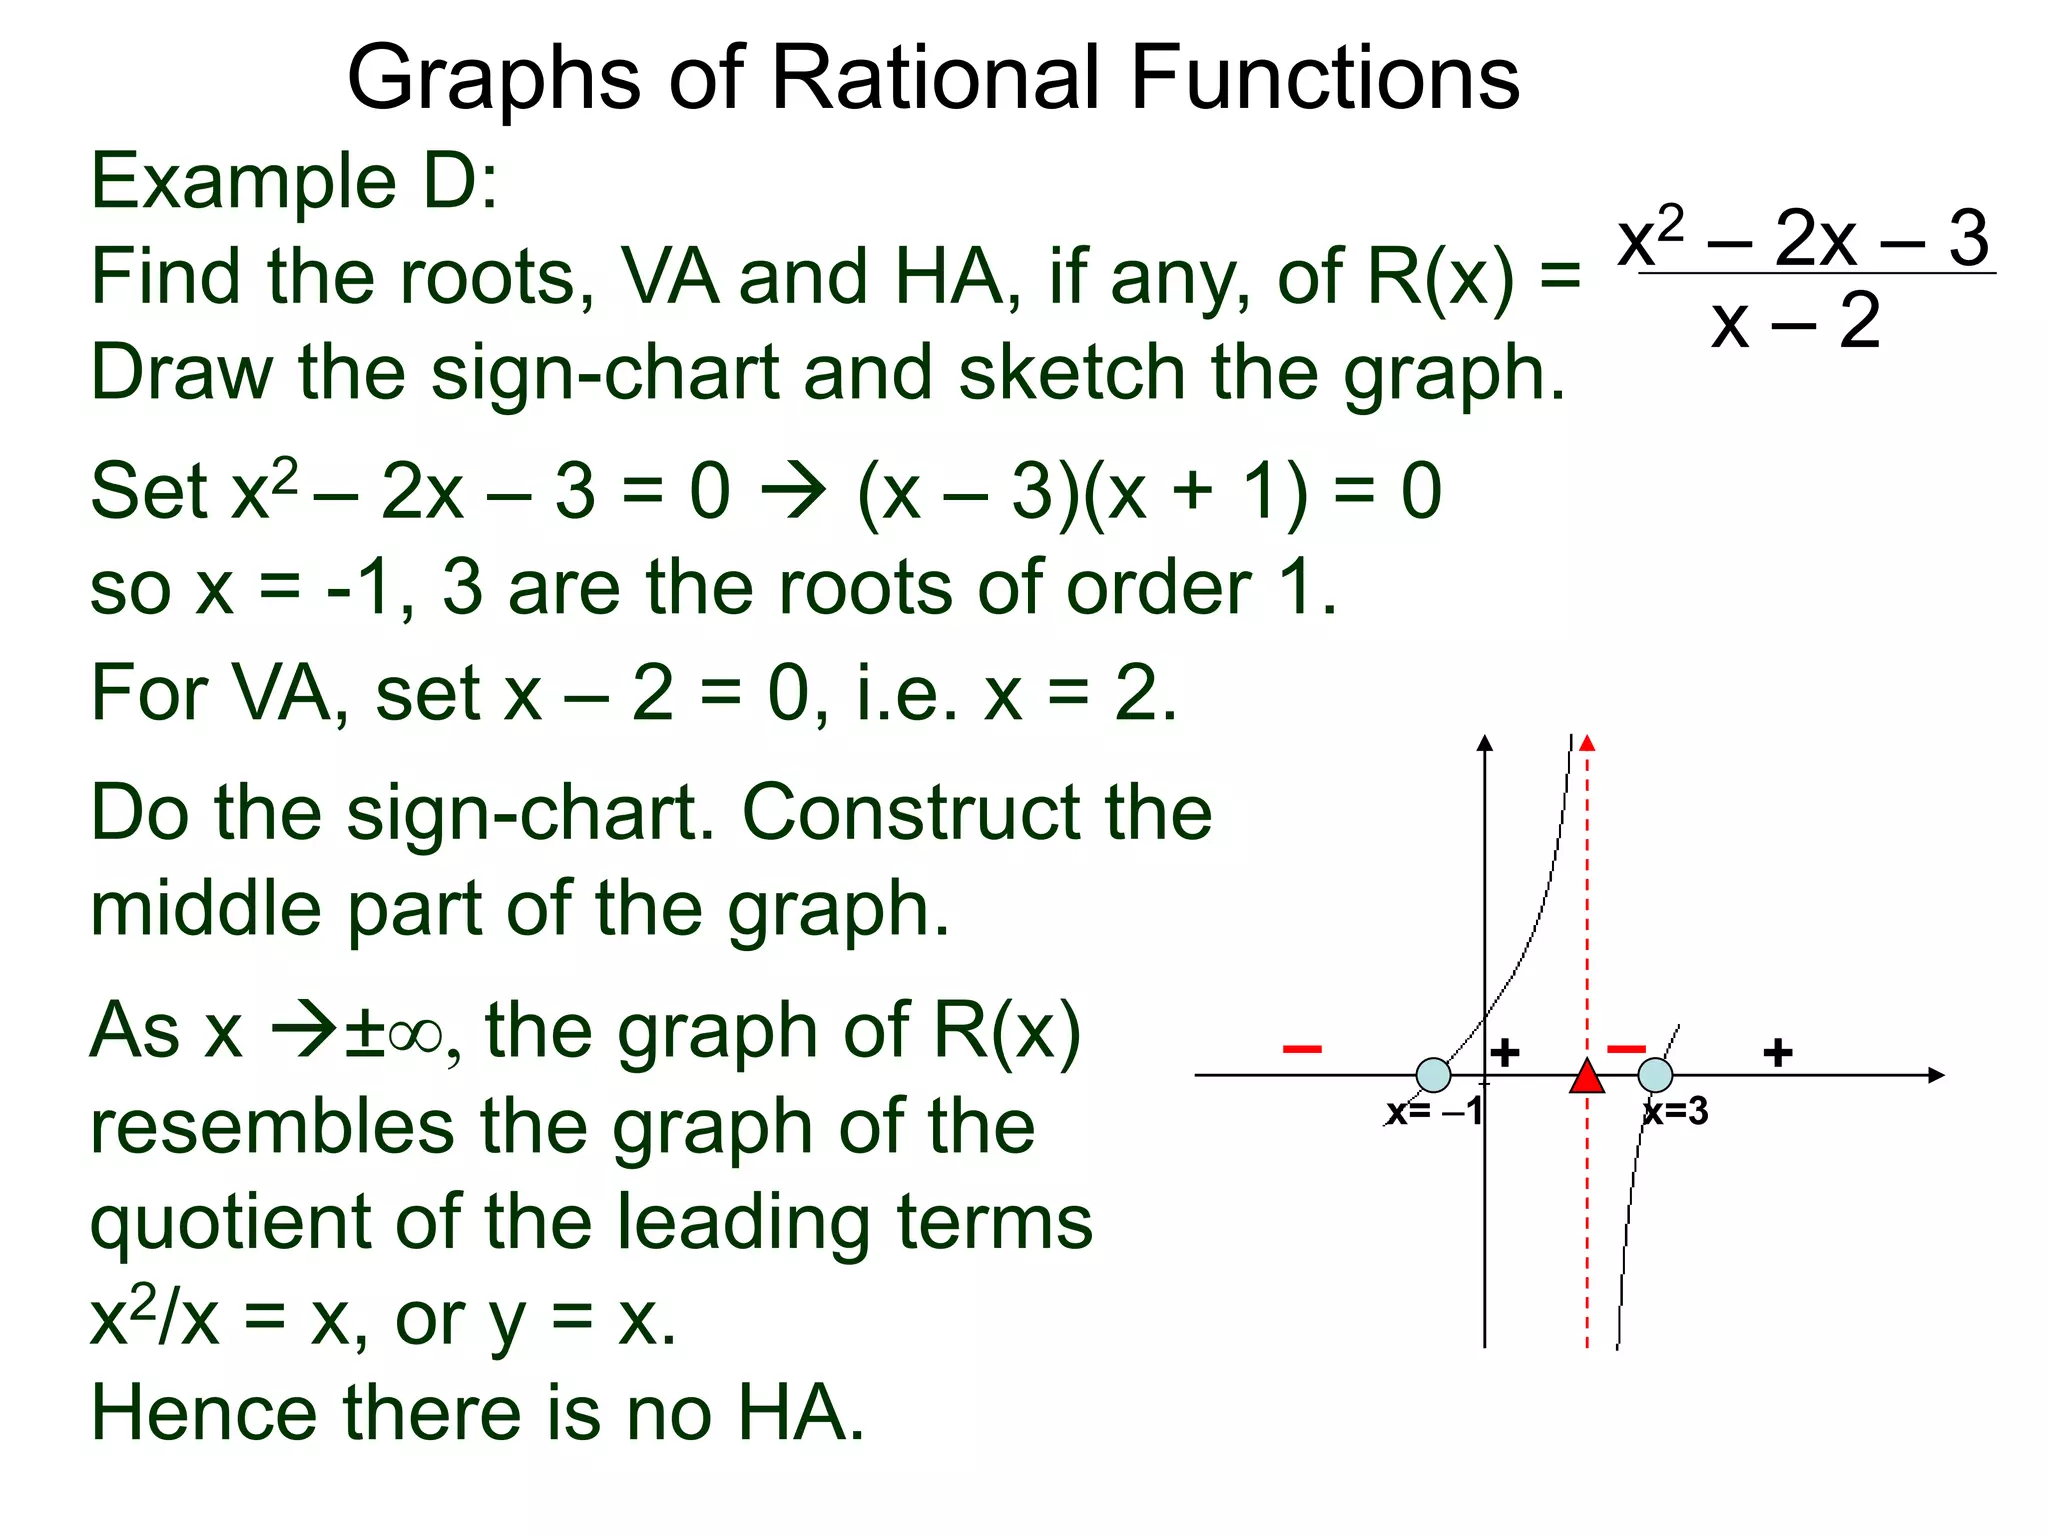
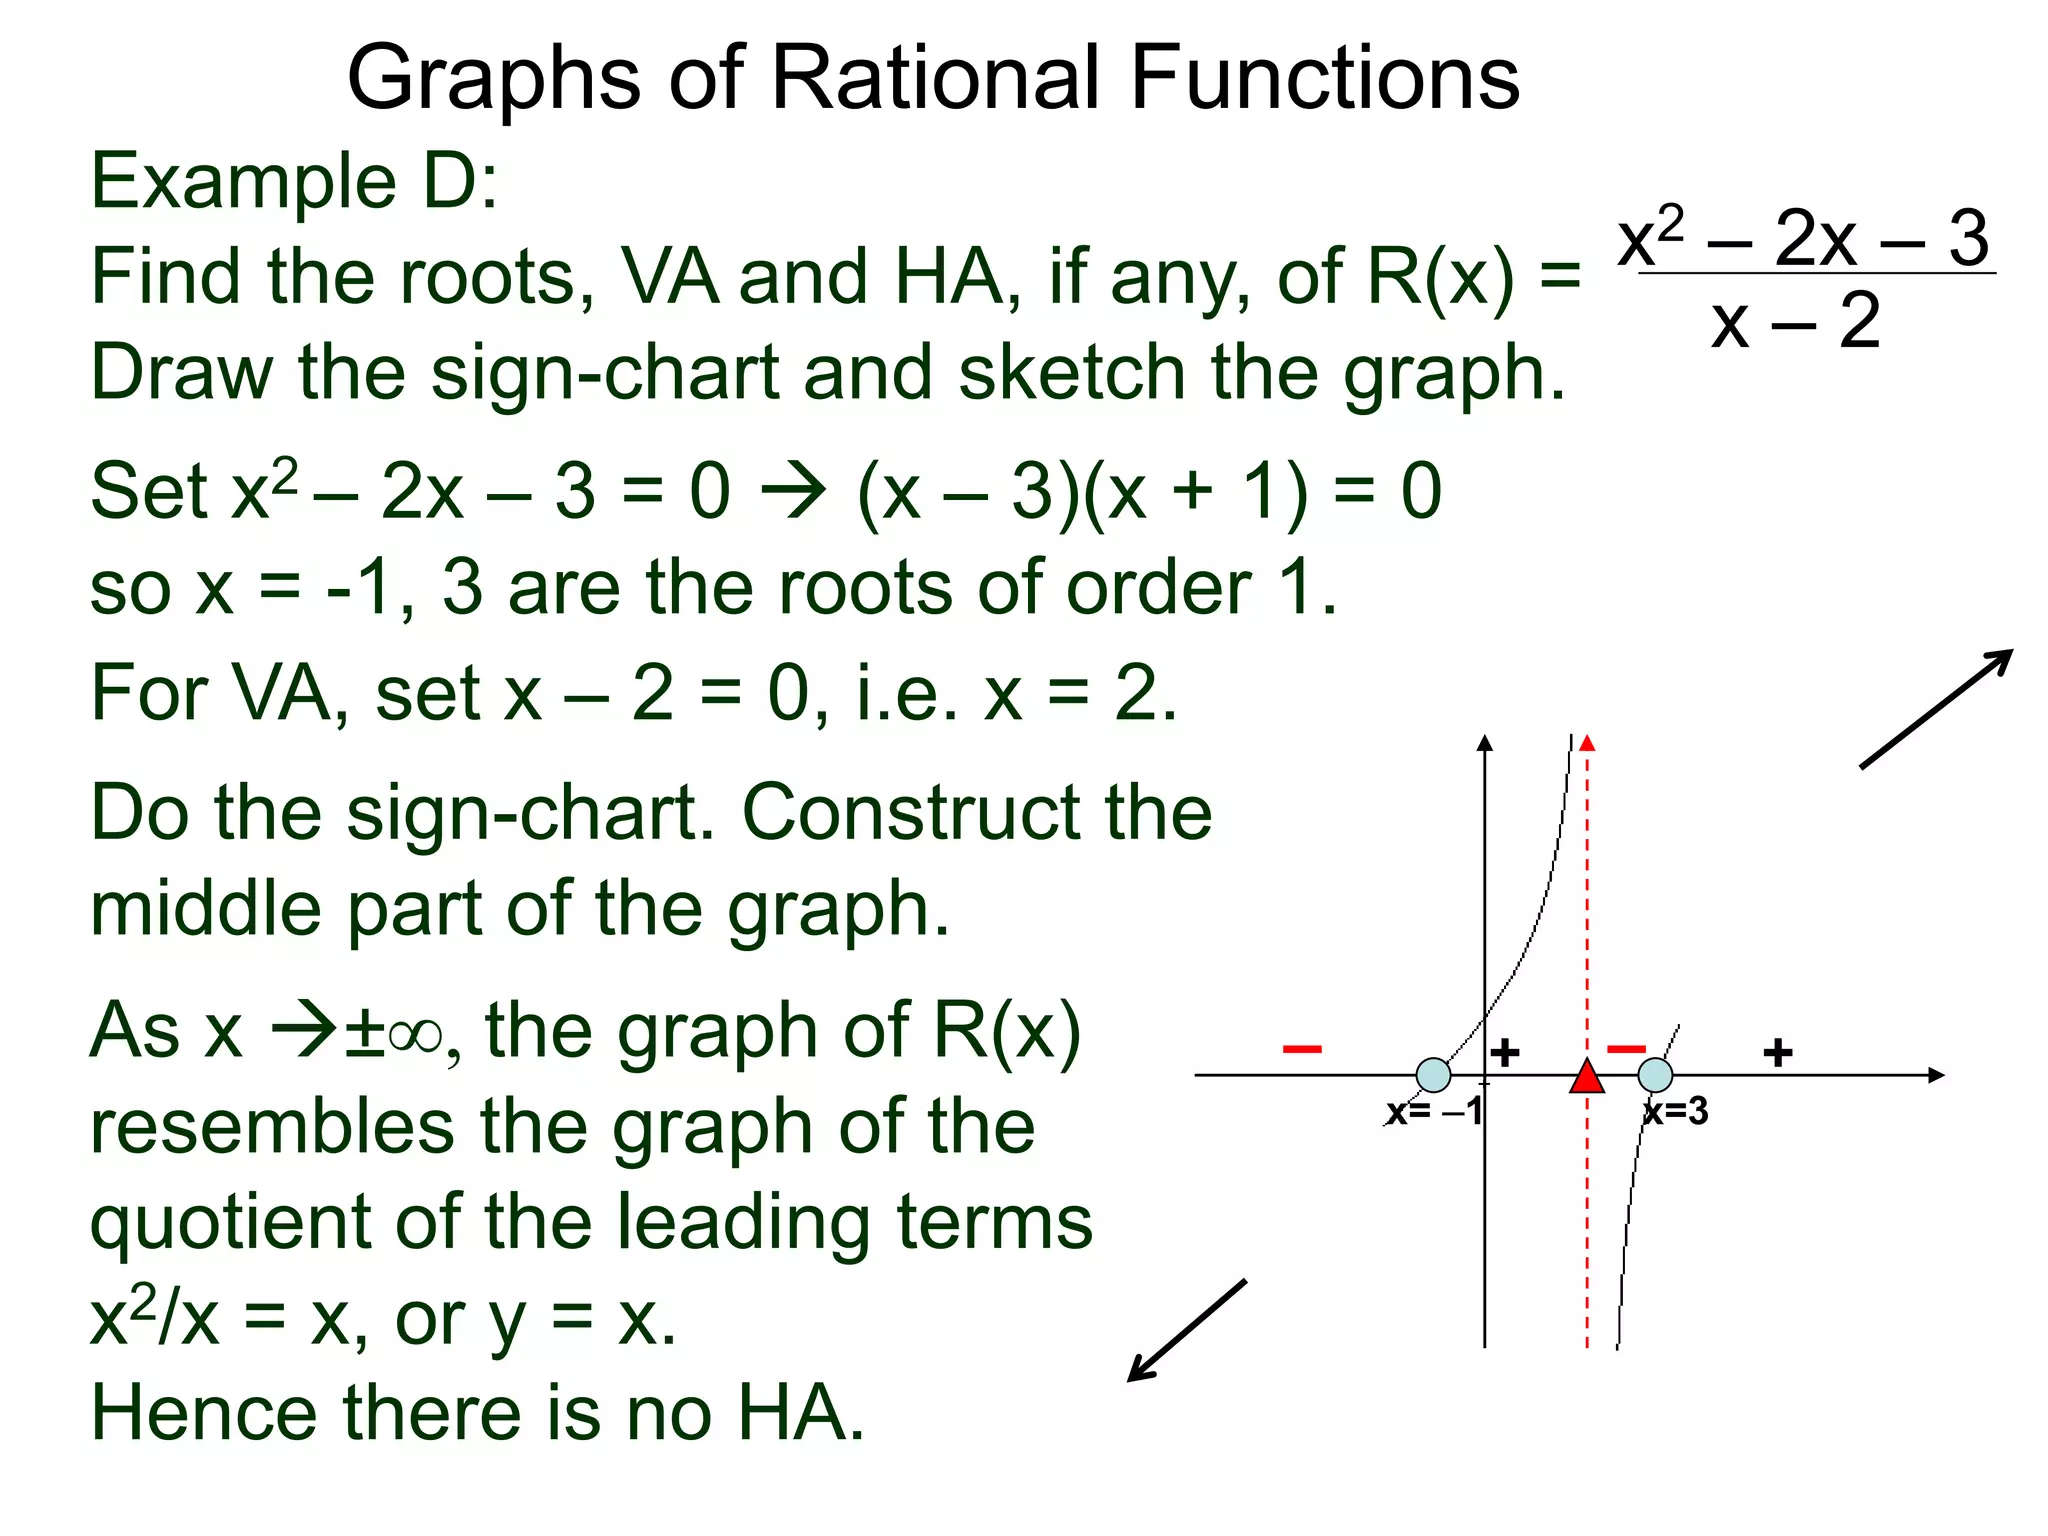
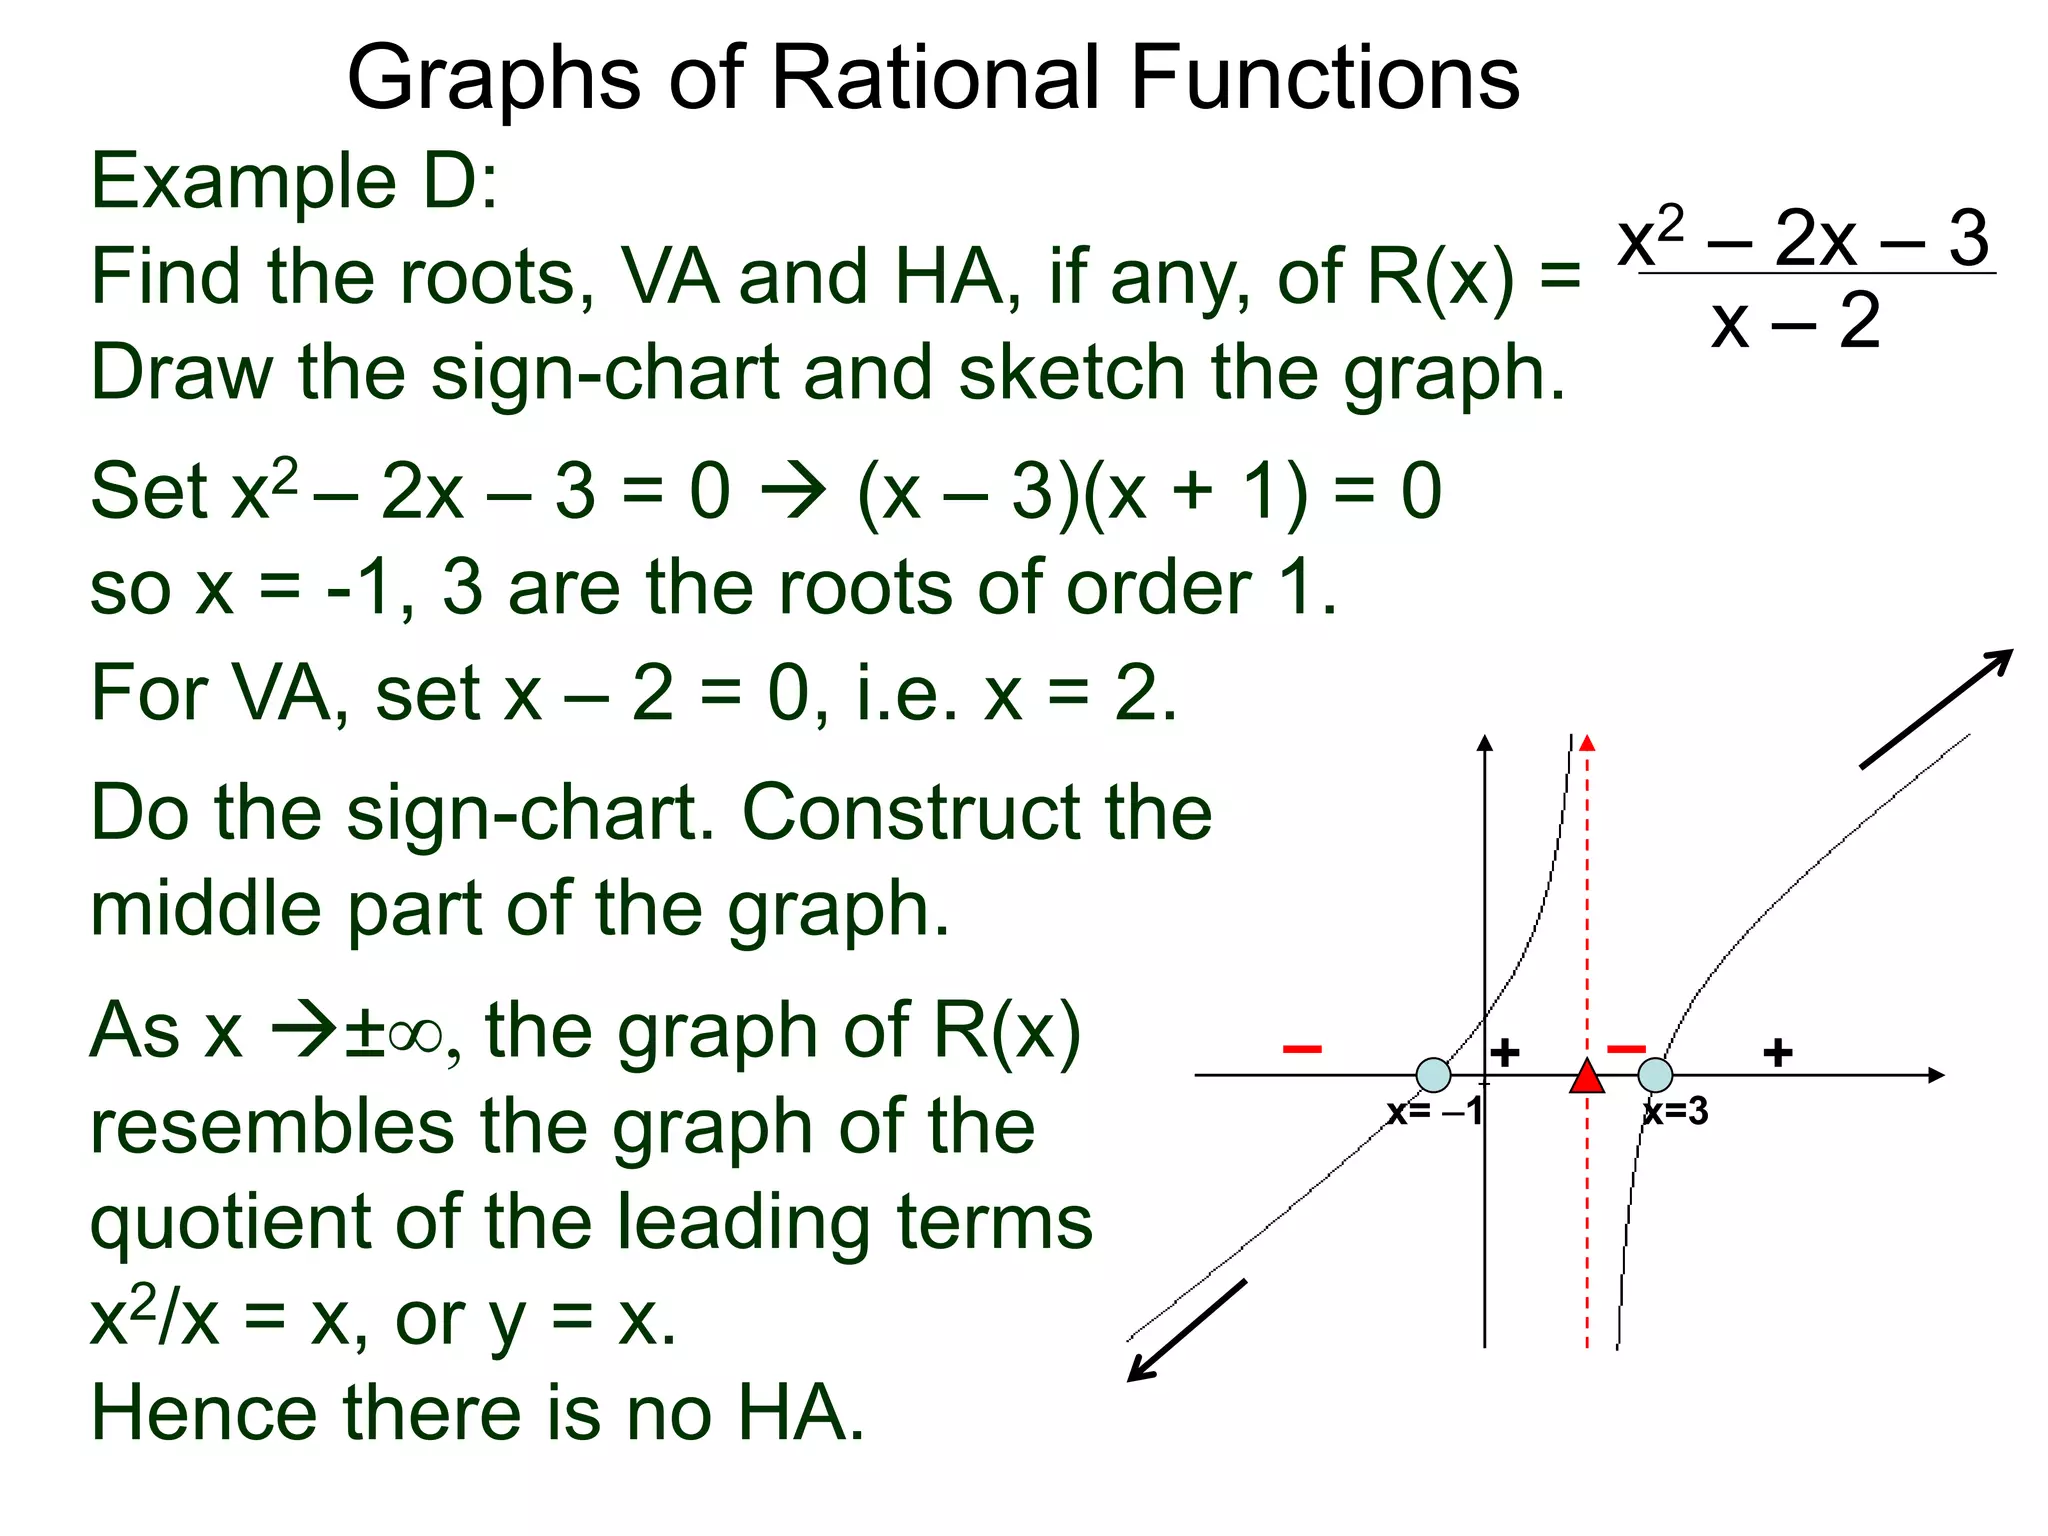
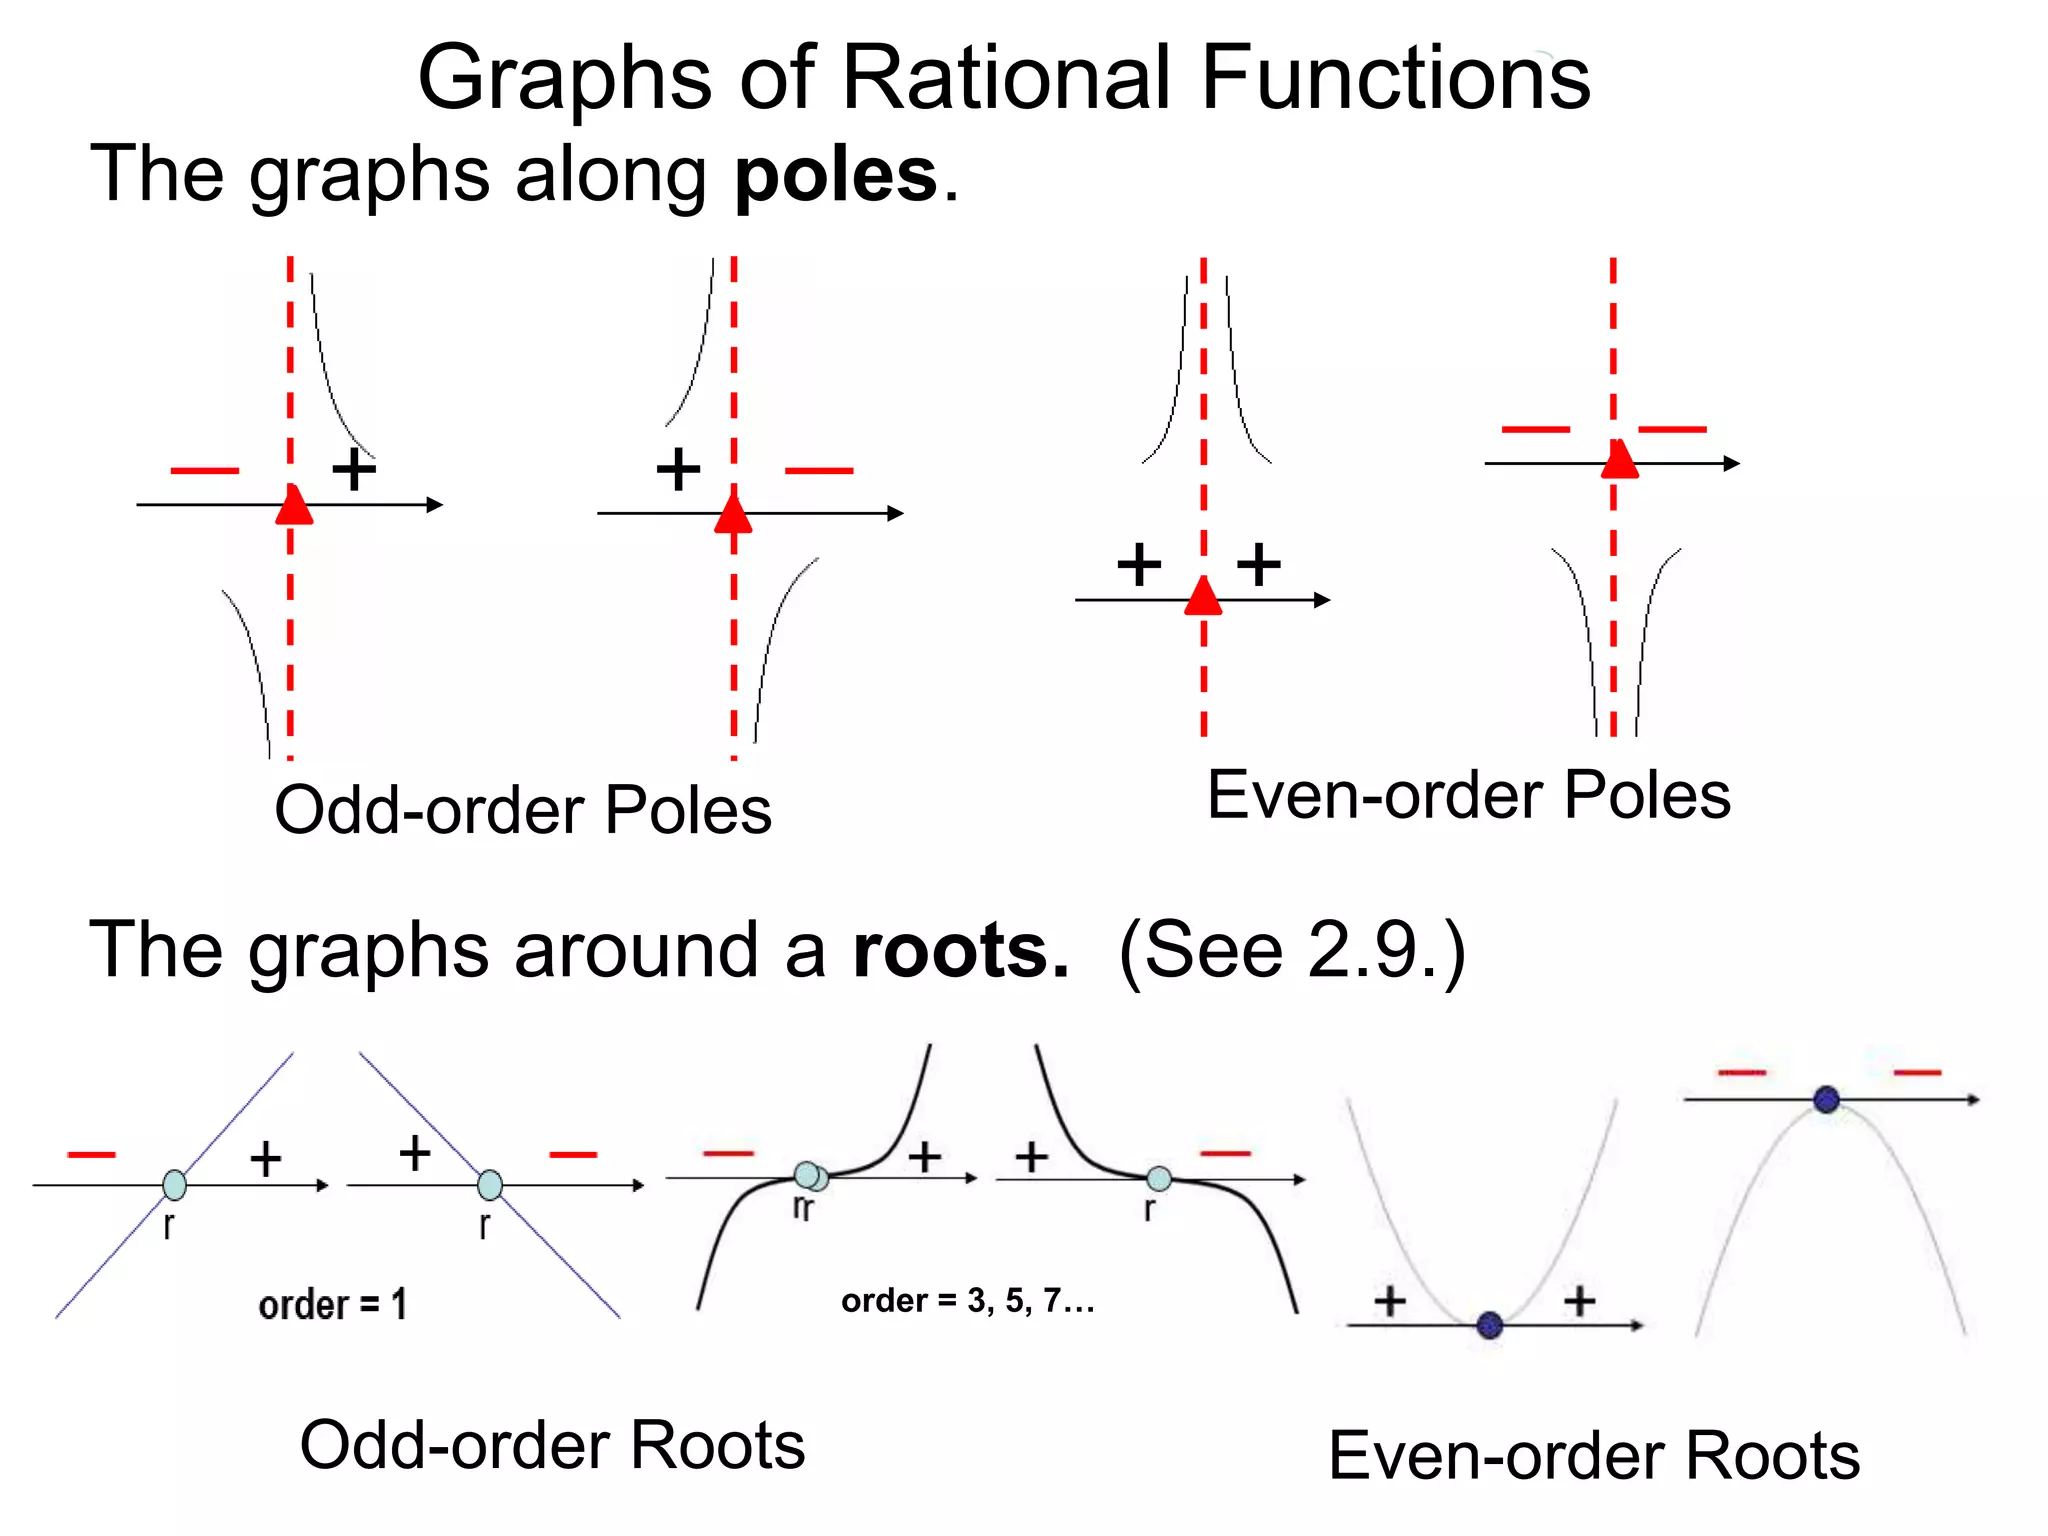
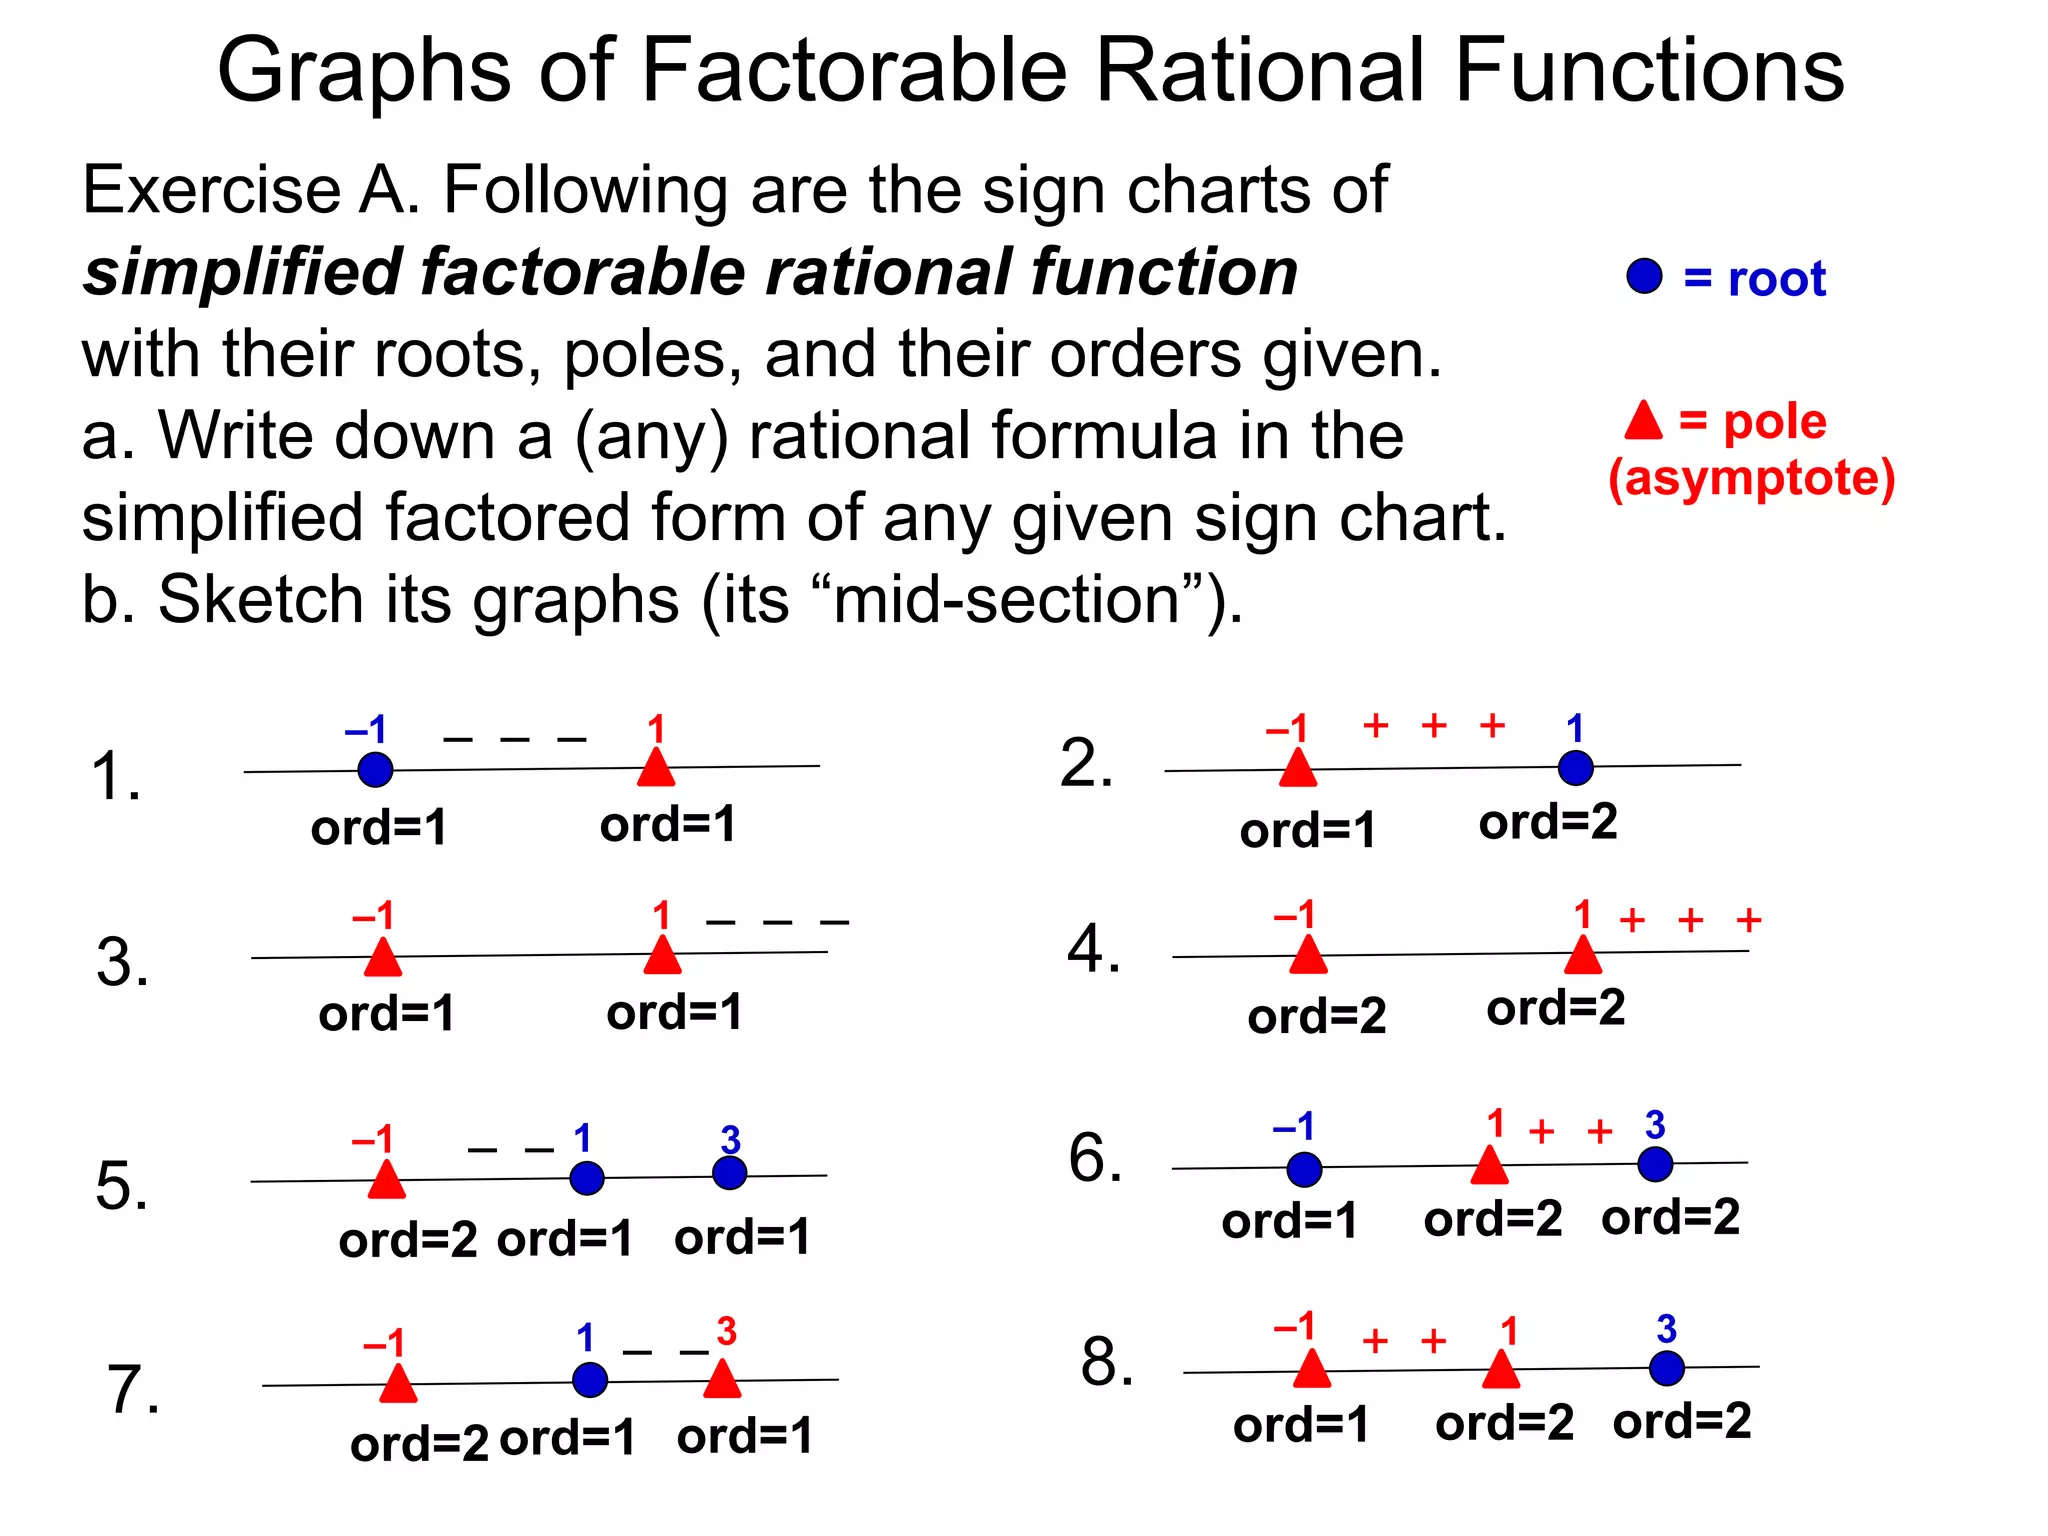
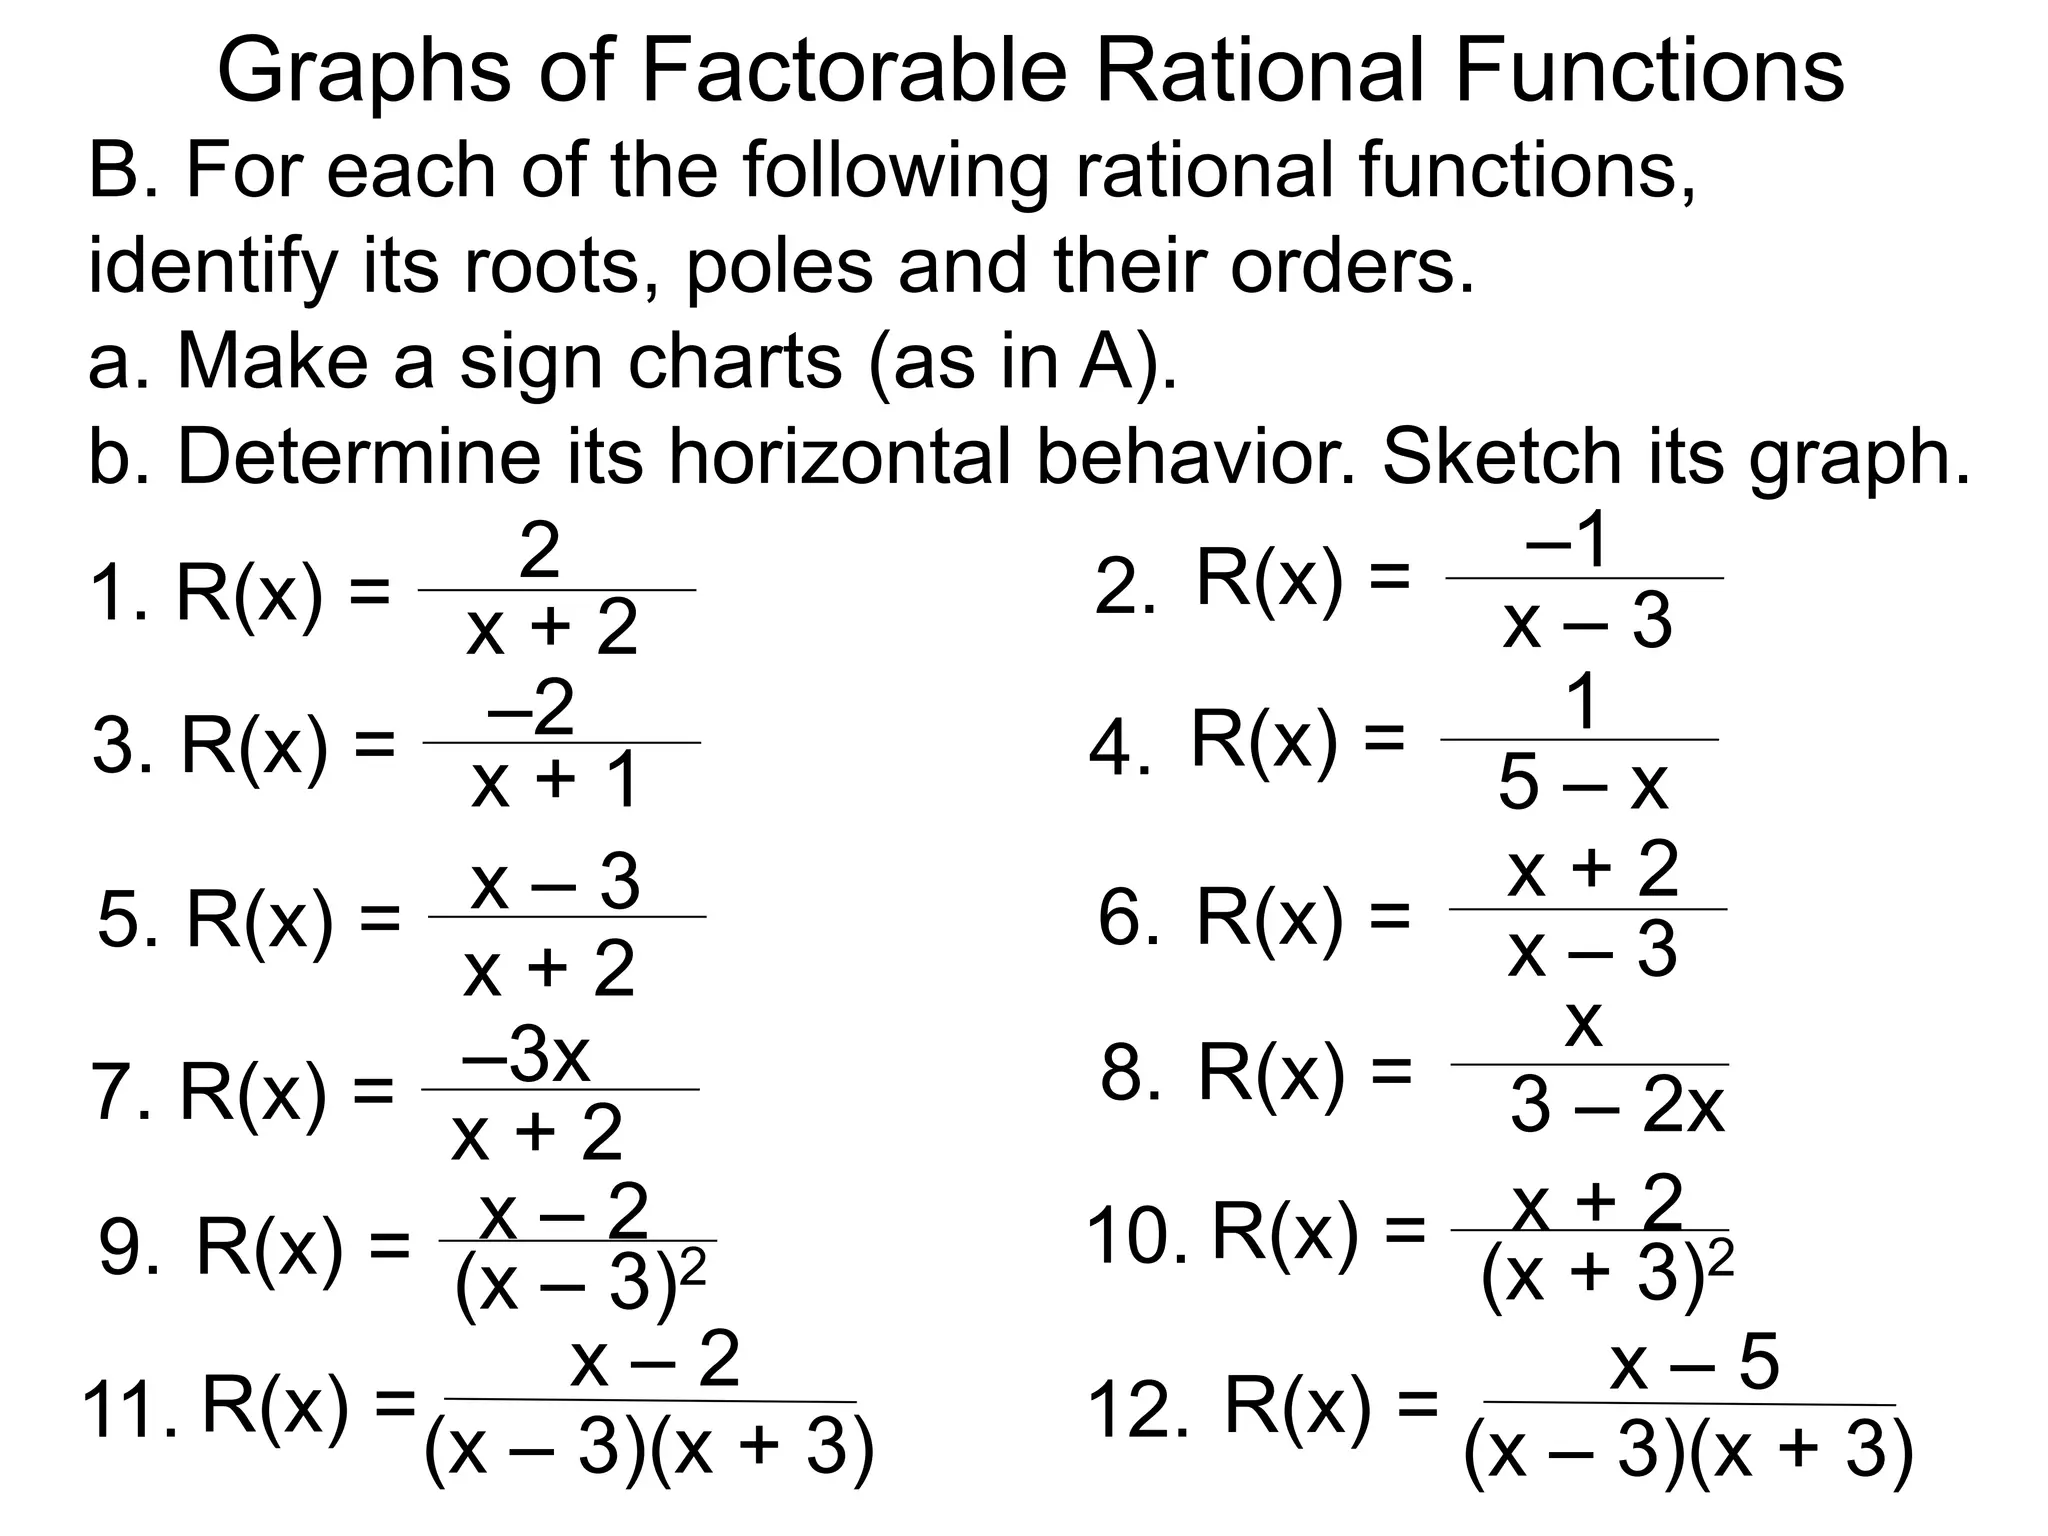
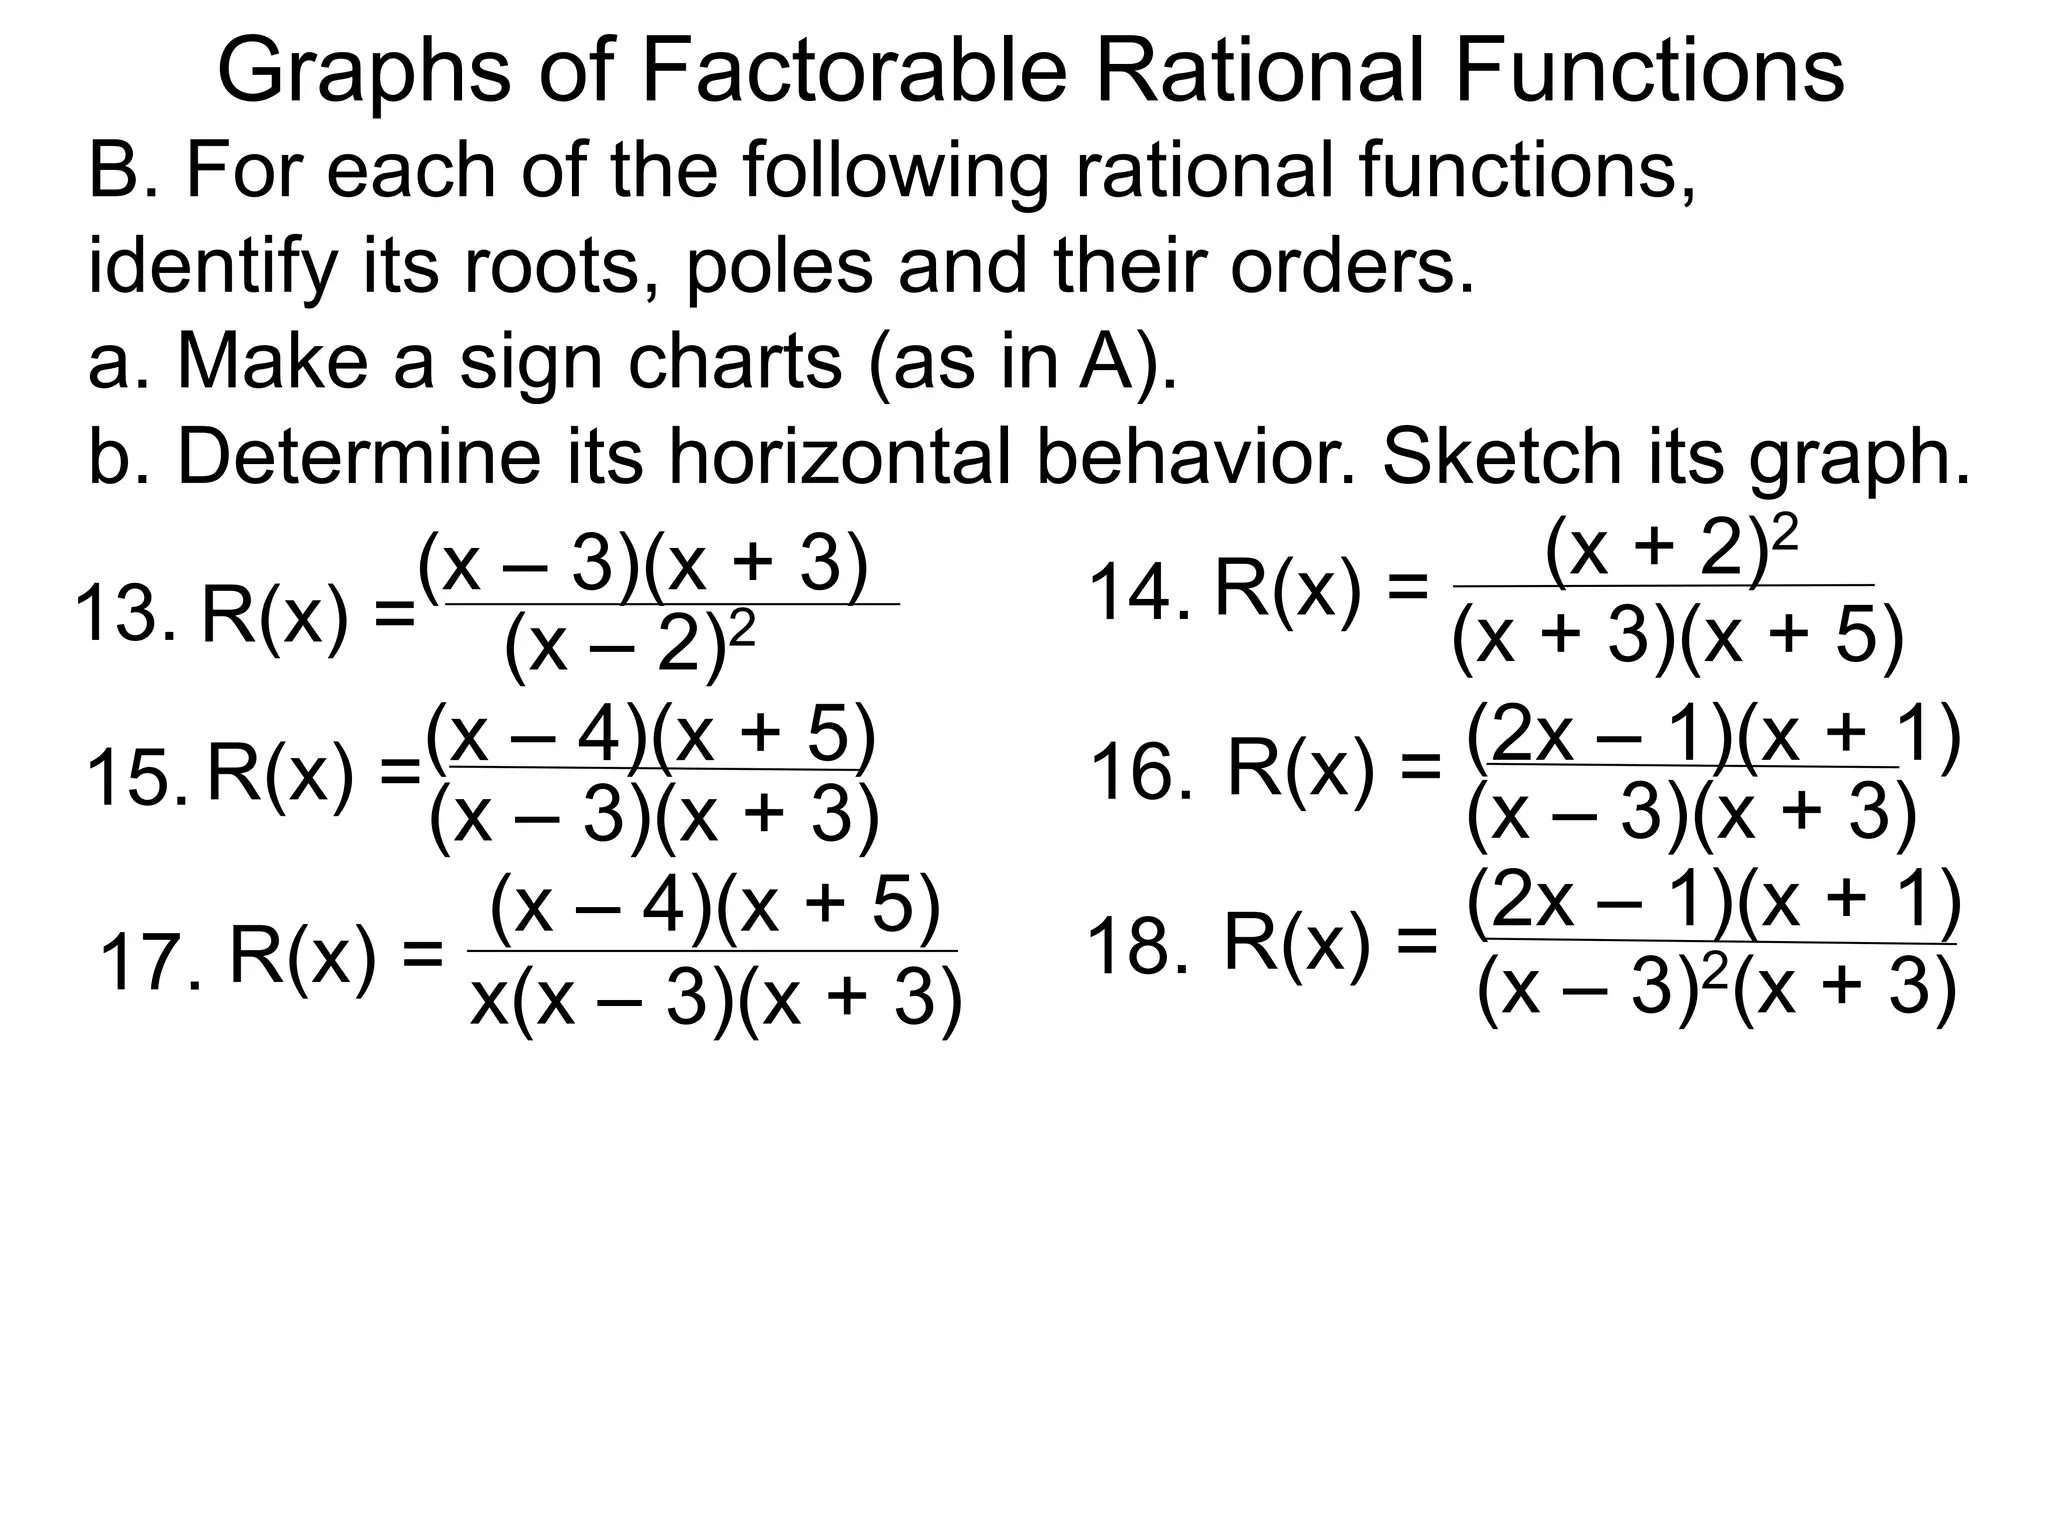
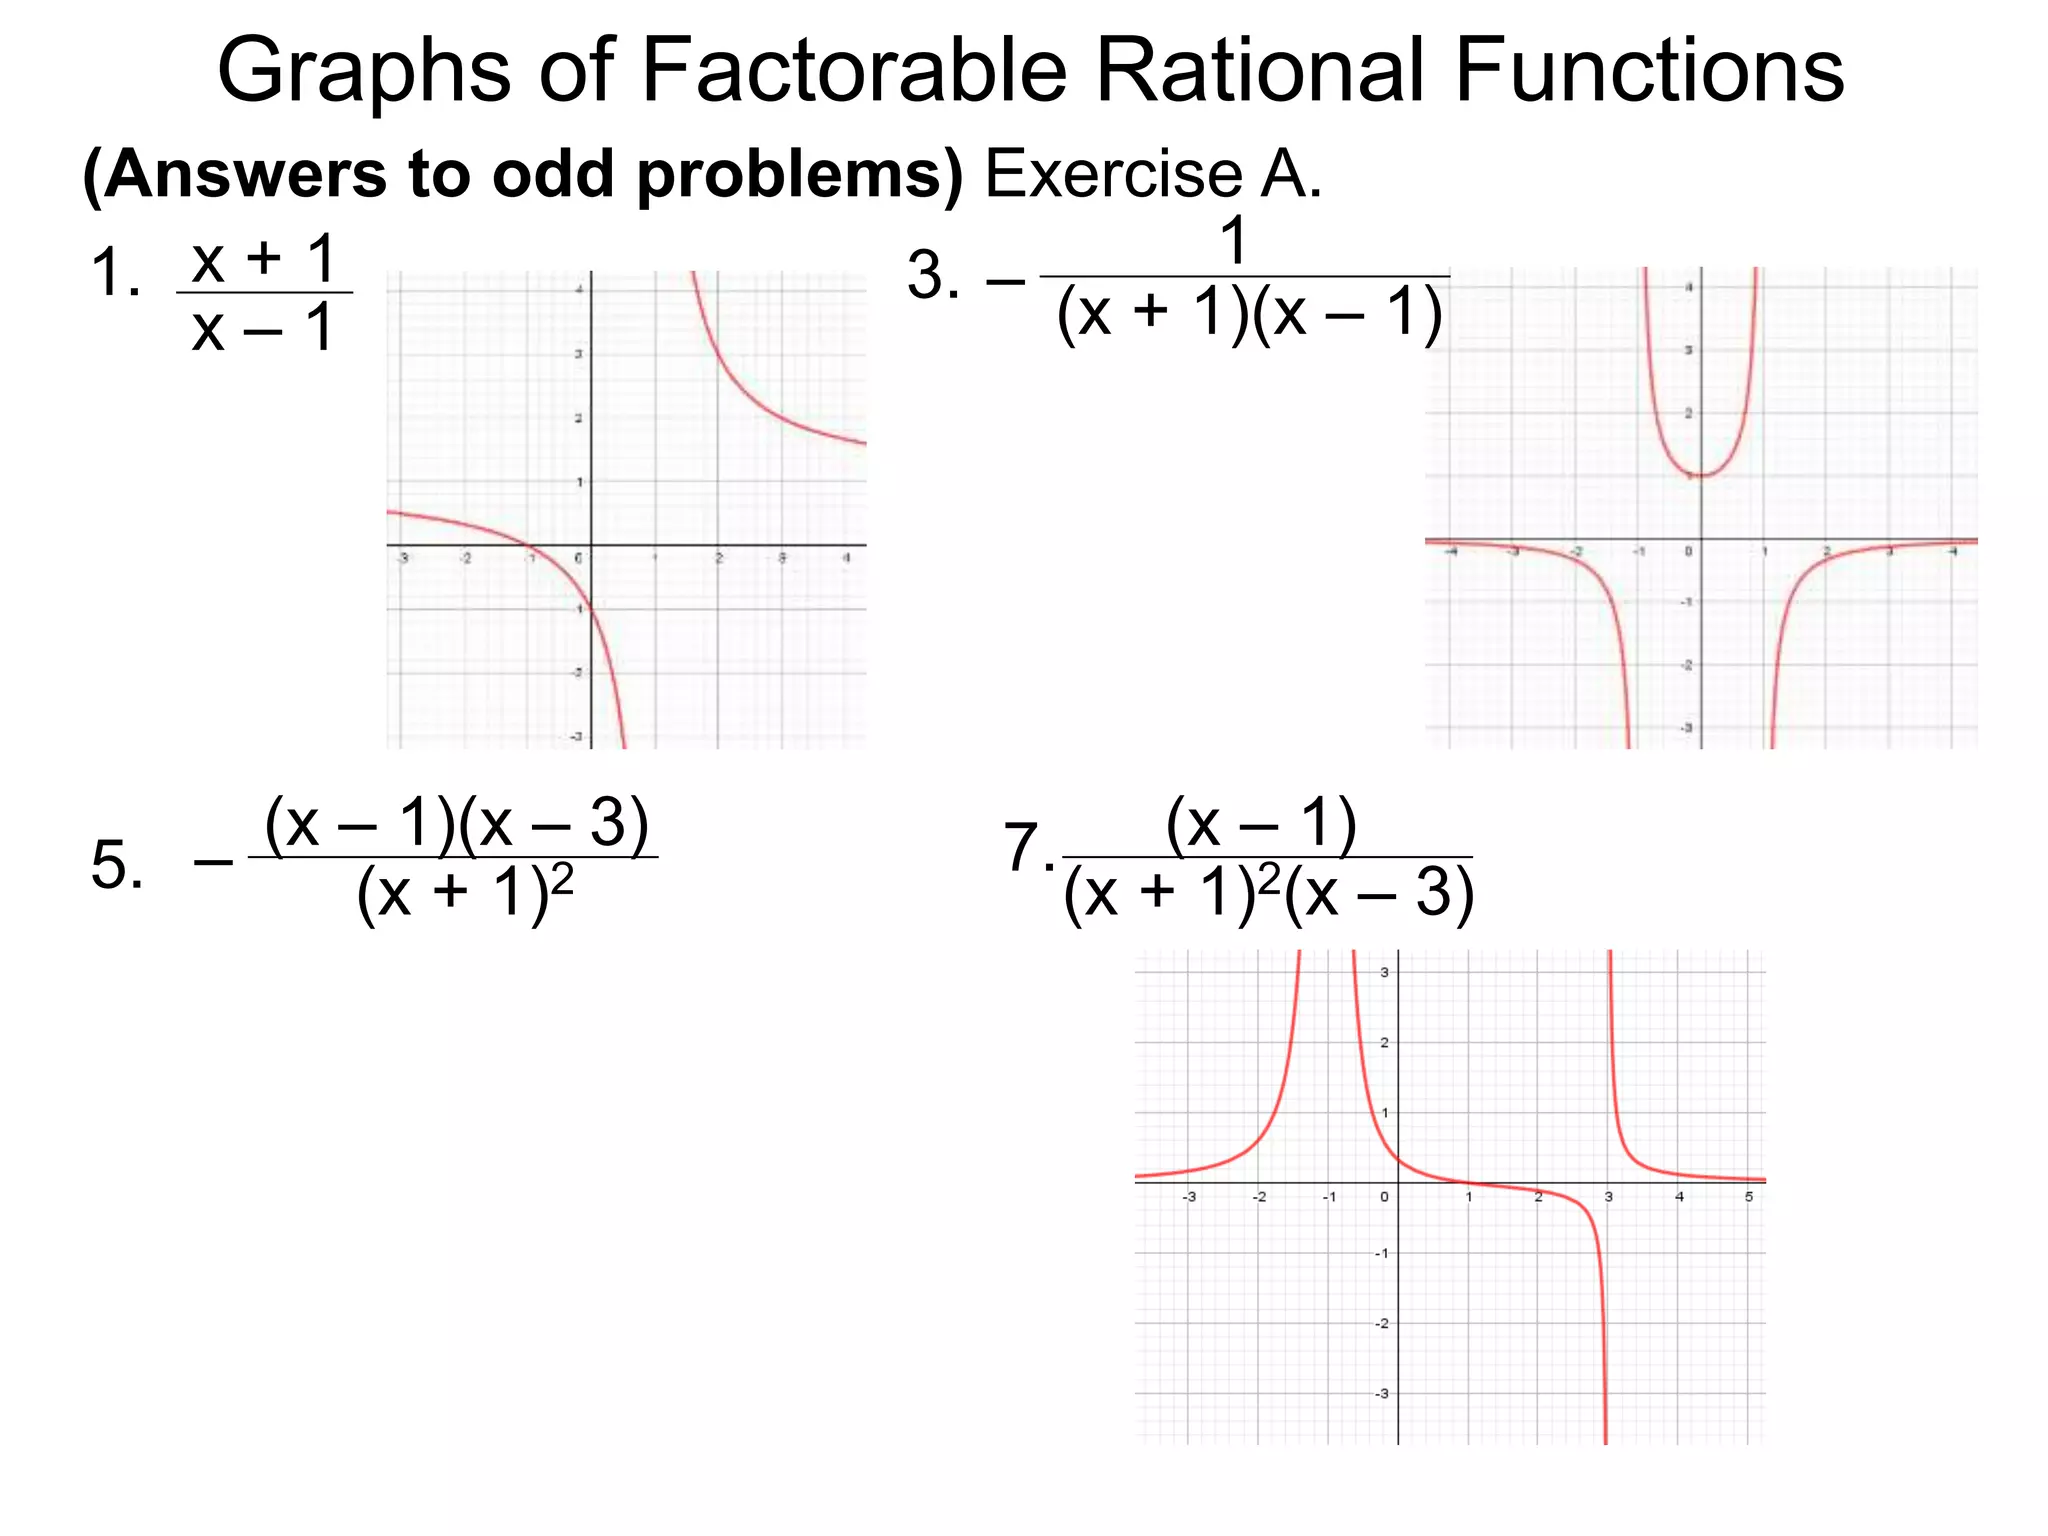
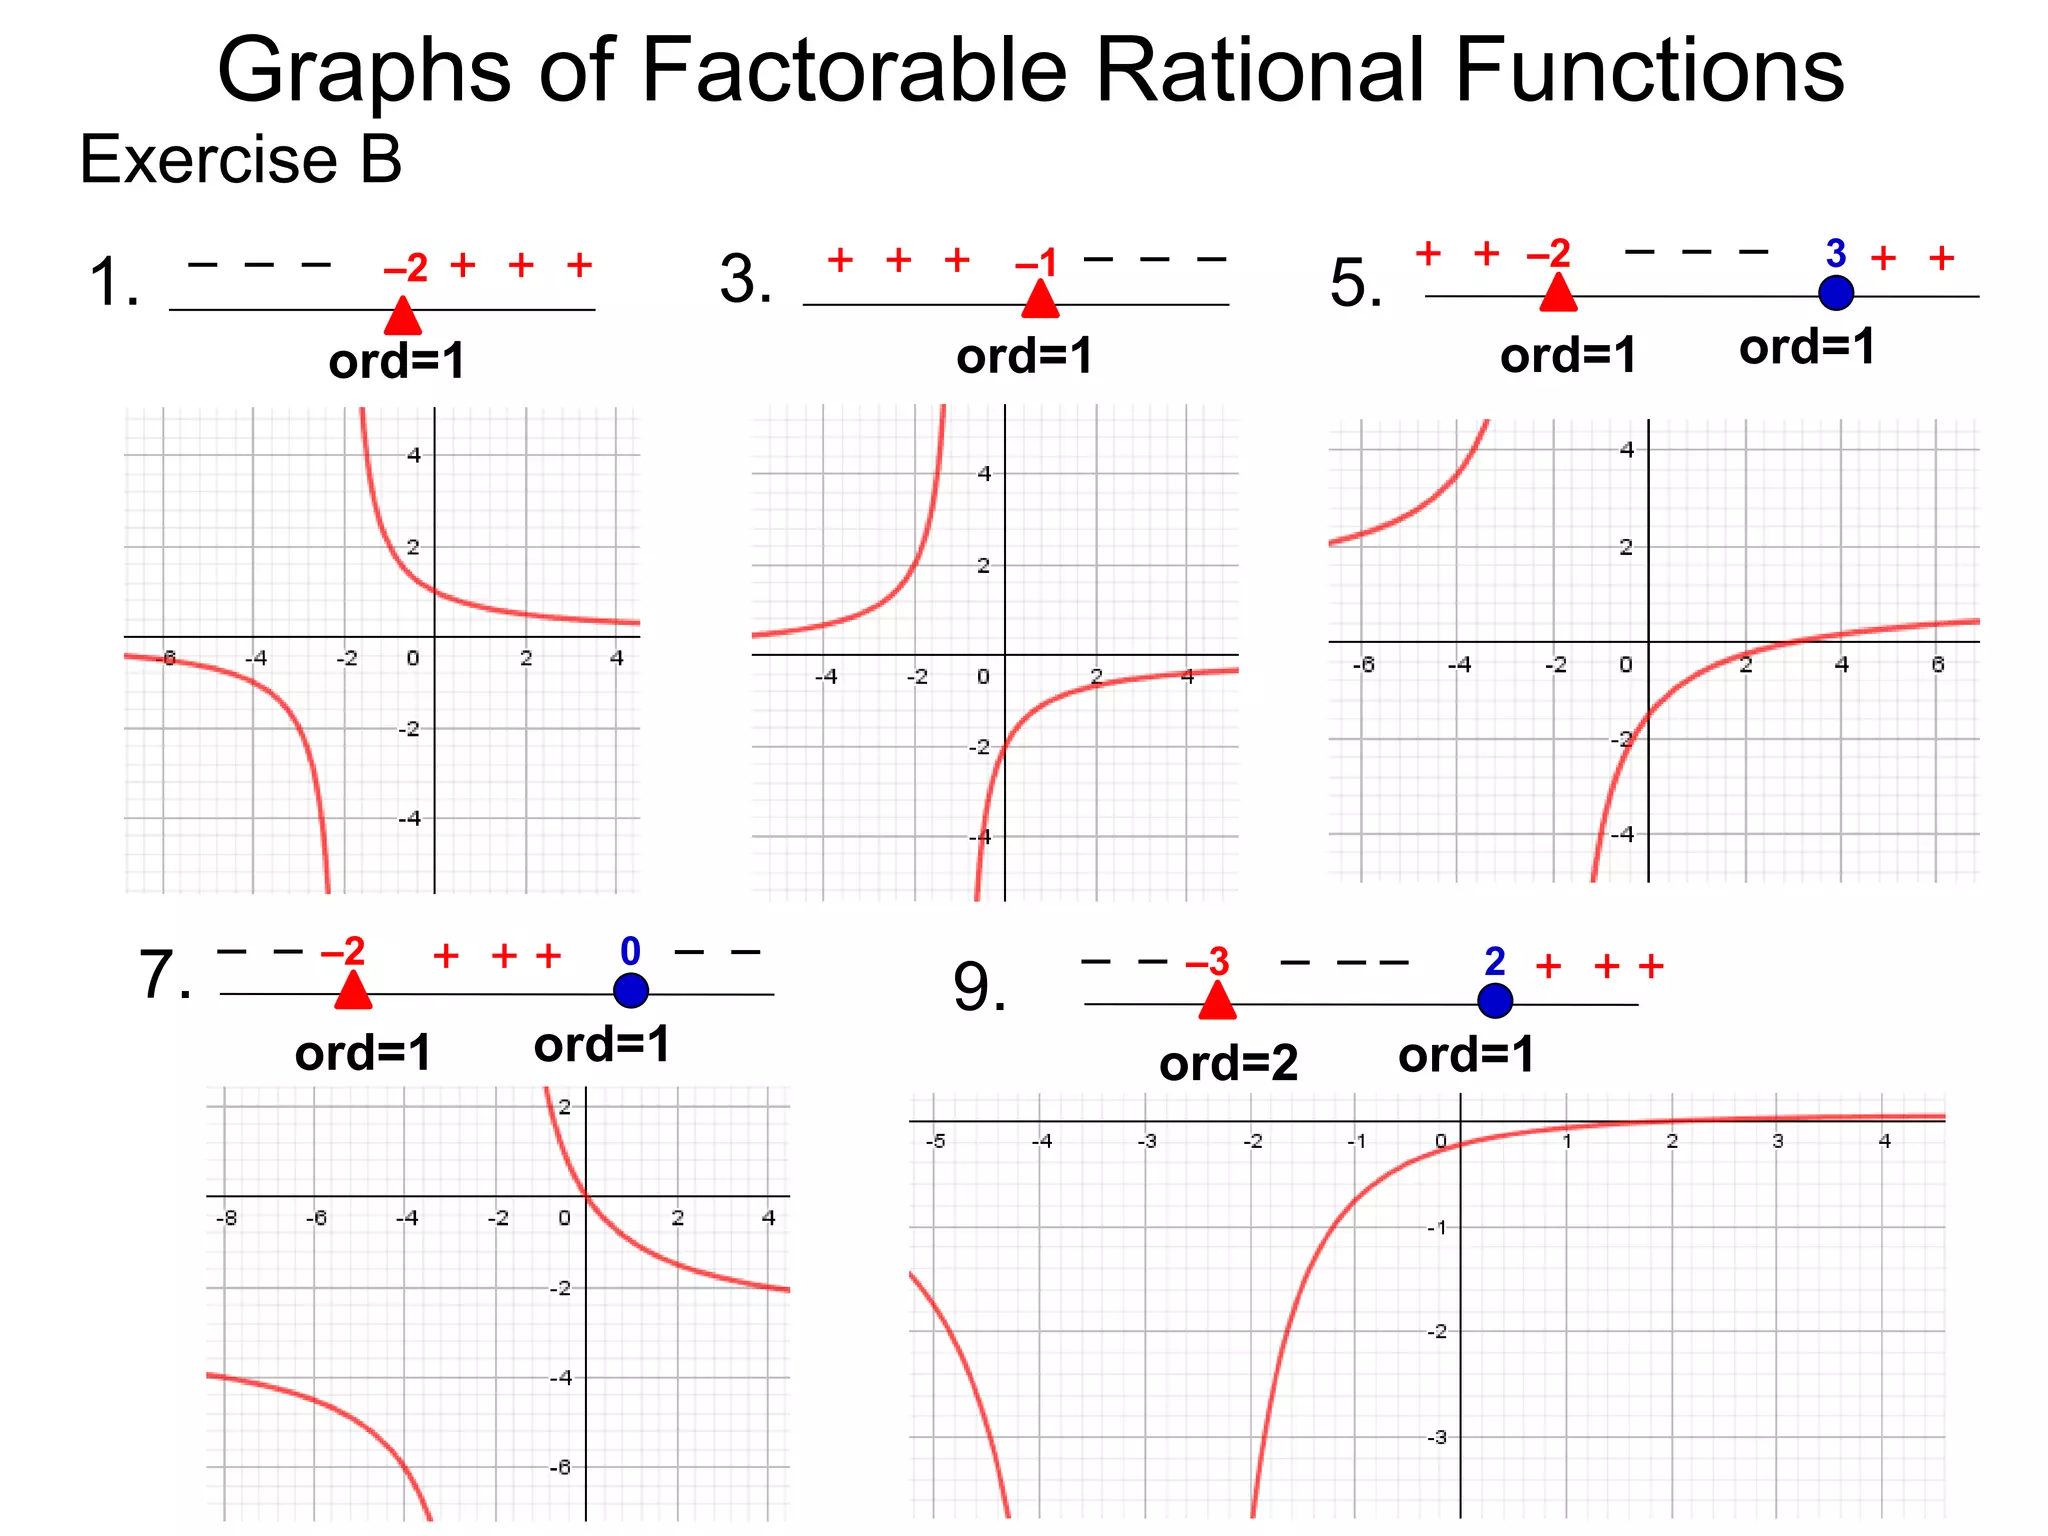
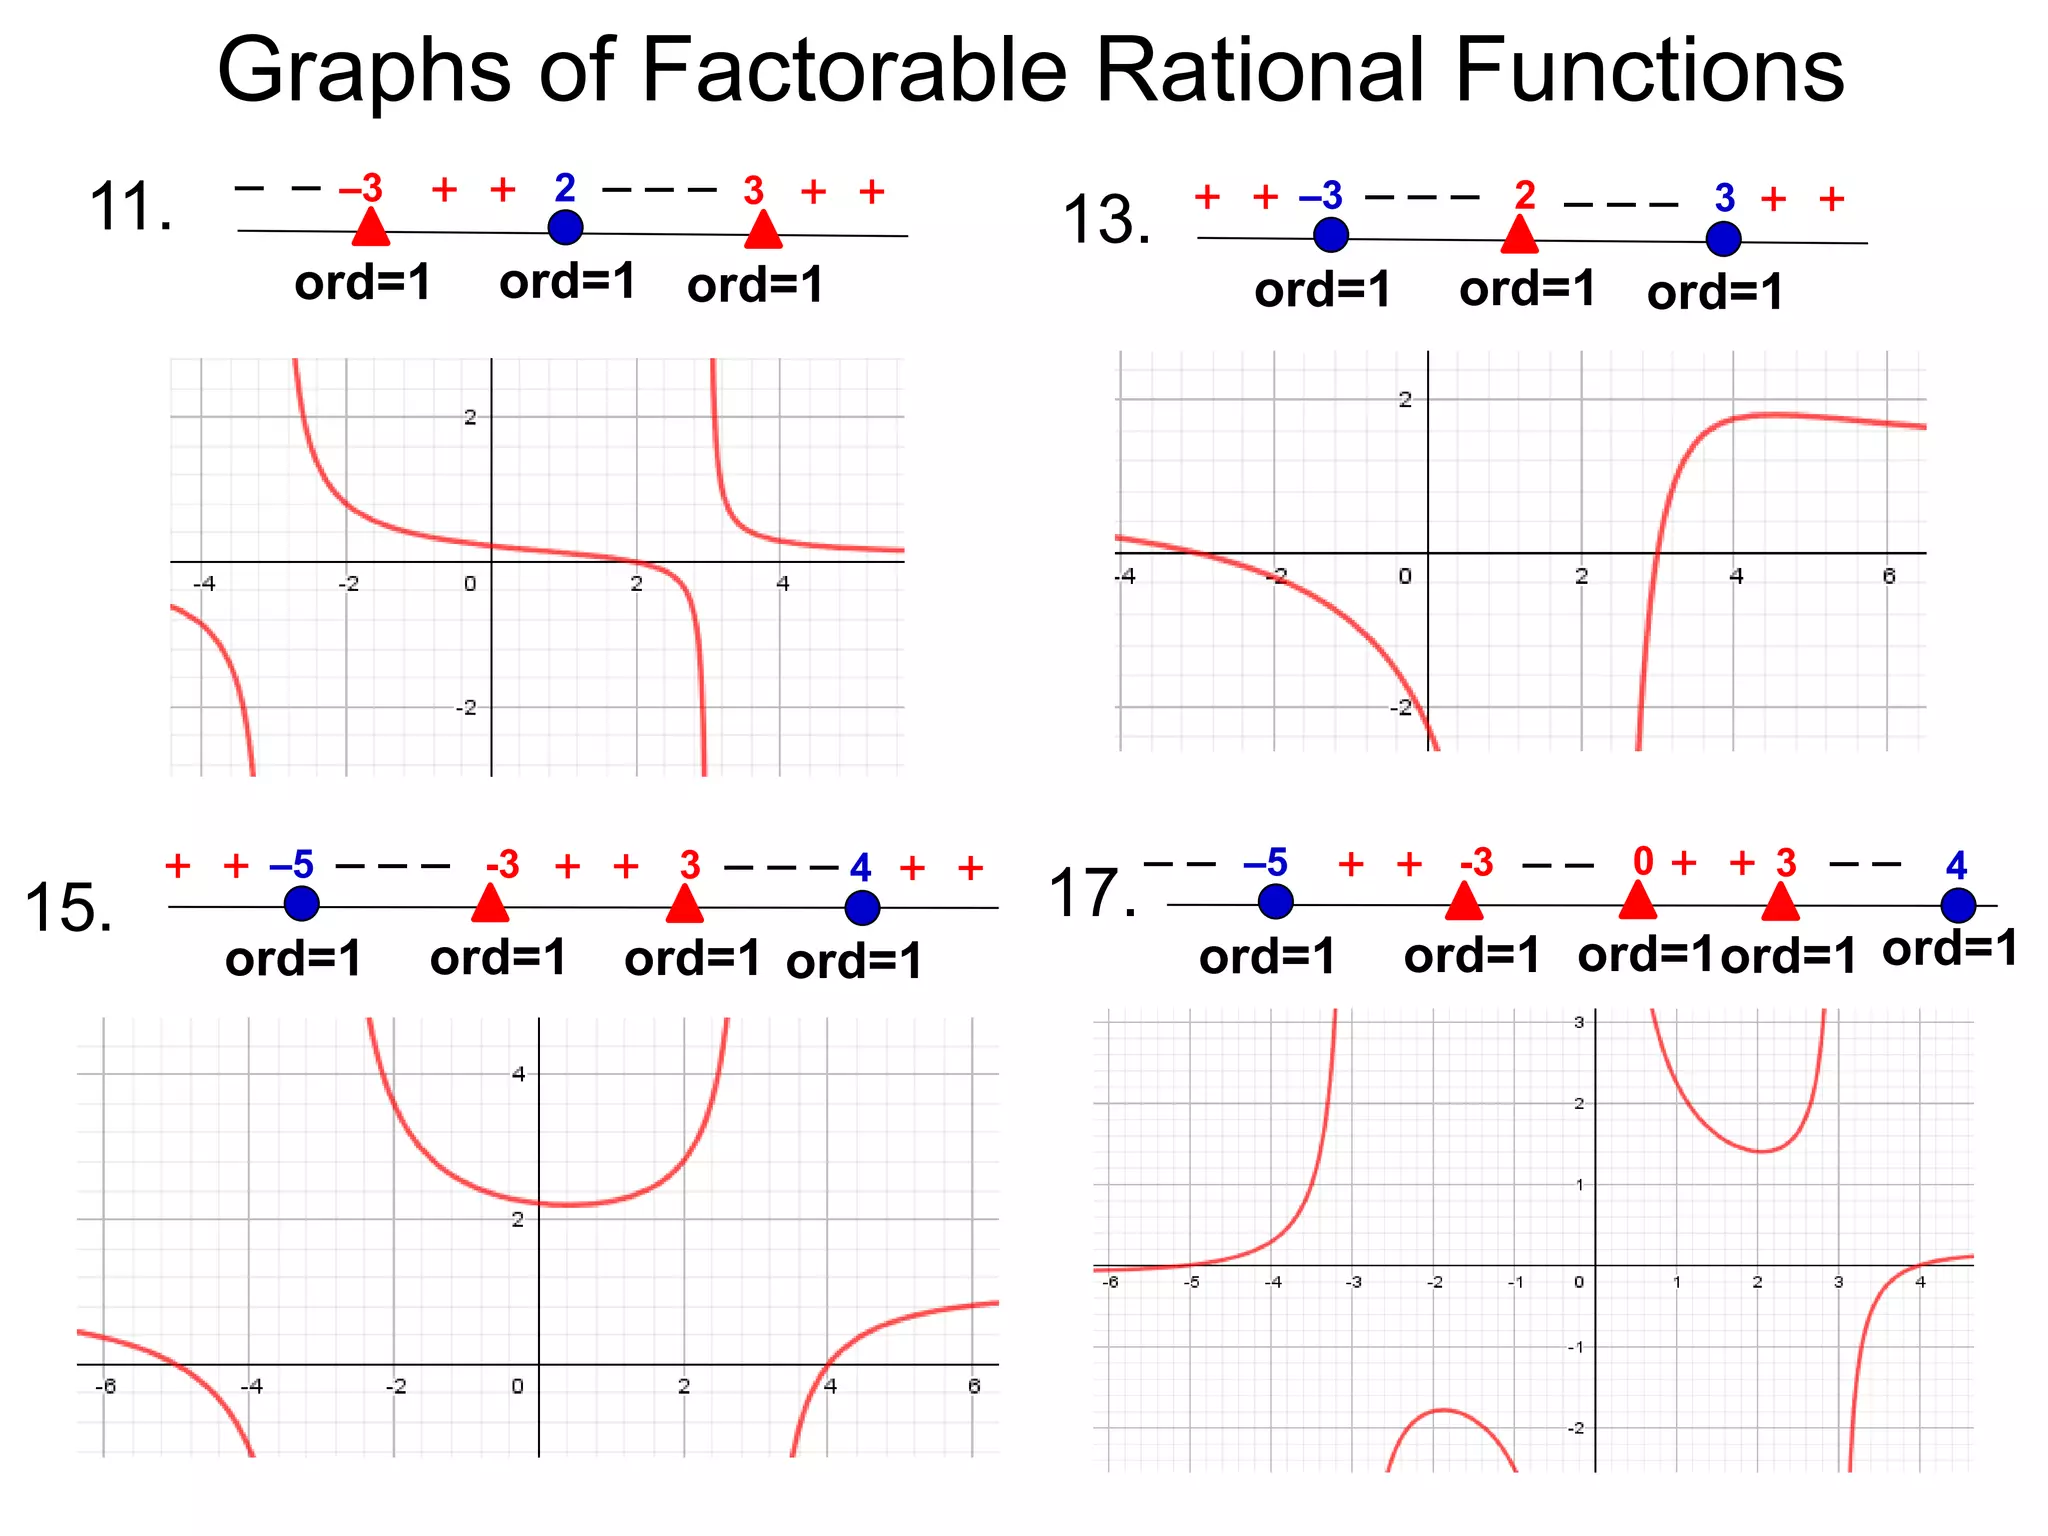
Graphs of Rational Functions
Rational functions are functions of the form
R(x) = where P(x) and Q(x) are polynomials.
P(x)
Q(x)
Graphs of Rational Functions
A rational function is factorable if both P(x) and Q(x)
are factorable.
Rational functions are functions of the form
R(x) = where P(x) and Q(x) are polynomials.
P(x)
Q(x)
Graphs of Rational Functions
A rational function is factorable if both P(x) and Q(x)
are factorable.
Unless otherwise stated, the rational functions in this
section are assumed to be reduced factorable rational
functions.
The principles of graphing rational functions are the
the same as for polynomials. We study the behaviors
and draw pieces of the graphs at important regions,
then complete the graphs by connecting them.
However, the behaviors of rational functions are more
complicated due to the presence of the denominators.
Rational functions are functions of the form
R(x) = where P(x) and Q(x) are polynomials.
P(x)
Q(x)
Vertical Asymptote
Graphs of Rational Functions
Vertical Asymptote
The function y = 1/x is not defined at x = 0.
Graphs of Rational Functions
Vertical Asymptote
The function y = 1/x is not defined at x = 0. So the
graph is not a continuous curve, it breaks at x = 0.
Graphs of Rational Functions
Vertical Asymptote
The function y = 1/x is not defined at x = 0. So the
graph is not a continuous curve, it breaks at x = 0.
For small positive x's, y = 1/x is large.
Graphs of Rational Functions
Vertical Asymptote
The function y = 1/x is not defined at x = 0. So the
graph is not a continuous curve, it breaks at x = 0.
For small positive x's, y = 1/x is large.
The closer the x is to 0, the
smaller x is,
Graphs of Rational Functions
Vertical Asymptote
The function y = 1/x is not defined at x = 0. So the
graph is not a continuous curve, it breaks at x = 0.
For small positive x's, y = 1/x is large.
The closer the x is to 0, the
smaller x is, correspondingly
the larger y = 1/x is,
Graphs of Rational Functions
Vertical Asymptote
The function y = 1/x is not defined at x = 0. So the
graph is not a continuous curve, it breaks at x = 0.
For small positive x's, y = 1/x is large.
The closer the x is to 0, the
smaller x is, correspondingly
the larger y = 1/x is, hence
the higher the point (x, 1/x) is.
(1, 1)
Graphs of Rational Functions
x=0
Vertical Asymptote
The function y = 1/x is not defined at x = 0. So the
graph is not a continuous curve, it breaks at x = 0.
For small positive x's, y = 1/x is large.
The closer the x is to 0, the
smaller x is, correspondingly
the larger y = 1/x is, hence
the higher the point (x, 1/x) is.
(1, 1)
(1/2, 2)
(1/3, 3)
The graph runs along x = 0 but
never touches x = 0 as shown.
Graphs of Rational Functions
x=0
Vertical Asymptote
The function y = 1/x is not defined at x = 0. So the
graph is not a continuous curve, it breaks at x = 0.
For small positive x's, y = 1/x is large.
The closer the x is to 0, the
smaller x is, correspondingly
the larger y = 1/x is, hence
the higher the point (x, 1/x) is.
The graph runs along x = 0 but
never touches x = 0 as shown.
Graphs of Rational Functions
(1, 1)
(1/2, 2)
(1/3, 3)
The boundary-line x = 0 is called a
vertical asymptote (VA).
x=0
Vertical Asymptote
The function y = 1/x is not defined at x = 0. So the
graph is not a continuous curve, it breaks at x = 0.
For small positive x's, y = 1/x is large.
The closer the x is to 0, the
smaller x is, correspondingly
the larger y = 1/x is, hence
the higher the point (x, 1/x) is.
The graph runs along x = 0 but
never touches x = 0 as shown.
negative x's, y = 1/x are negative
Graphs of Rational Functions
(1, 1)
(1/2, 2)
(1/3, 3)
x=0
The boundary-line x = 0 is called a
vertical asymptote (VA). For "small"
Vertical Asymptote
The function y = 1/x is not defined at x = 0. So the
graph is not a continuous curve, it breaks at x = 0.
For small positive x's, y = 1/x is large.
The closer the x is to 0, the
smaller x is, correspondingly
the larger y = 1/x is, hence
the higher the point (x, 1/x) is.
The graph runs along x = 0 but
never touches x = 0 as shown.
negative x's, y = 1/x are negative so the corresponding
graph goes downward along the asymptote as shown.
Graphs of Rational Functions
(1, 1)
(1/2, 2)
(1/3, 3)
x=0
The boundary-line x = 0 is called a
vertical asymptote (VA). For "small"
Vertical Asymptote
x=0
The function y = 1/x is not defined at x = 0. So the
graph is not a continuous curve, it breaks at x = 0.
For small positive x's, y = 1/x is large.
The closer the x is to 0, the
smaller x is, correspondingly
the larger y = 1/x is, hence
the higher the point (x, 1/x) is.
(1, 1)
(1/2, 2)
(1/3, 3)
The graph runs along x = 0 but
never touches x = 0 as shown.
negative x's, y = 1/x are negative so the corresponding
graph goes downward along the asymptote as shown.
(-1, -1)
(-1/2, -2)
(-1/3, -3)
Graphs of Rational Functions
The boundary-line x = 0 is called a
vertical asymptote (VA). For "small"
Graph of y = 1/x
x=0
As x gets larger and larger, the corresponding y = 1/x
become smaller and smaller. This means the graph
gets closer and closer to the x-axis as it goes
further and further to the right
and to the left. To the right,
because y = 1/x is positive, the
graph stays above the
x-axis. To the left, y = 1/x is
negative so the graph stays
below the x-axis. As the graph
goes further to the left. It gets
(1, 1)
(2, 1/2) (3, 1/3)
(-1, -1)
(-2, -1/2)
(-3, -1/3)
Graphs of Rational Functions
closer and closer to the x-axis.
Hence the x-axis is a horizontal asymptote (HA).
Likewise, y = 1/x2 has x = 0 as a vertical asymptote.
Graphs of Rational Functions
Likewise, y = 1/x2 has x = 0 as a vertical asymptote.
However, since 1/x2 is always positive, the graph
goes upward along both sides of the asymptote.
Graphs of Rational Functions
Likewise, y = 1/x2 has x = 0 as a vertical asymptote.
However, since 1/x2 is always positive, the graph
goes upward along both sides of the asymptote.
Graphs of Rational Functions
Graph of y = 1/x2
Likewise, y = 1/x2 has x = 0 as a vertical asymptote.
However, since 1/x2 is always positive, the graph
goes upward along both sides of the asymptote.
We list the following facts about
vertical asymptotes of a reduced
rational function.
Graphs of Rational Functions
Graph of y = 1/x2
Likewise, y = 1/x2 has x = 0 as a vertical asymptote.
However, since 1/x2 is always positive, the graph
goes upward along both sides of the asymptote.
We list the following facts about
vertical asymptotes of a reduced
rational function.
Graphs of Rational Functions
Graph of y = 1/x2
I. The vertical asymptotes occur
at where the denominator is 0
(i.e. the roots of Q(x)).
Likewise, y = 1/x2 has x = 0 as a vertical asymptote.
However, since 1/x2 is always positive, the graph
goes upward along both sides of the asymptote.
We list the following facts about
vertical asymptotes of a reduced
rational function.
Graphs of Rational Functions
Graph of y = 1/x2
II. The graph runs along either
side of the vertical asymptotes.
Whether the graph goes upward or downward
along the asymptote may be determined using the
sing-chart.
I. The vertical asymptotes occur
at where the denominator is 0
(i.e. the roots of Q(x)).
Likewise, y = 1/x2 has x = 0 as a vertical asymptote.
However, since 1/x2 is always positive, the graph
goes upward along both sides of the asymptote.
We list the following facts about
vertical asymptotes of a reduced
rational function.
Graphs of Rational Functions
Graph of y = 1/x2
II. The graph runs along either
side of the vertical asymptotes.
Whether the graph goes upward or downward
along the asymptote may be determined using the
sing-chart. There are four different cases.
I. The vertical asymptotes occur
at where the denominator is 0
(i.e. the roots of Q(x)).
Graphs of Rational Functions
The four cases of graphs along a vertical asymptote:
Graphs of Rational Functions
+
e.g. y = 1/x
The four cases of graphs along a vertical asymptote:
Graphs of Rational Functions
e.g. y = -1/x
+
e.g. y = 1/x
+
The four cases of graphs along a vertical asymptote:
Graphs of Rational Functions
e.g. y = 1/x2
e.g. y = -1/x
+
e.g. y = 1/x
+
+ +
The four cases of graphs along a vertical asymptote:
Graphs of Rational Functions
e.g. y = 1/x2
e.g. y = -1/x e.g. y = -1/x2
+
e.g. y = 1/x
+
+ +
The four cases of graphs along a vertical asymptote:
Graphs of Rational Functions
e.g. y = 1/x2
e.g. y = -1/x e.g. y = -1/x2
+
e.g. y = 1/x
+
+ +
The four cases of graphs along a vertical asymptote:
Example A: Given the
following information of
roots, sign-chart and
vertical asymptotes,
draw the graph.
Graphs of Rational Functions
e.g. y = 1/x2
e.g. y = -1/x e.g. y = -1/x2
+
e.g. y = 1/x
+
+ +
The four cases of graphs along a vertical asymptote:
Example A: Given the
following information of
roots, sign-chart and
vertical asymptotes,
draw the graph.
+
+
root
VA
VA
Graphs of Rational Functions
e.g. y = 1/x2
e.g. y = -1/x e.g. y = -1/x2
+
e.g. y = 1/x
+
+ +
The four cases of graphs along a vertical asymptote:
Example A: Given the
following information of
roots, sign-chart and
vertical asymptotes,
draw the graph.
+
+
root
VA
VA
Graphs of Rational Functions
e.g. y = 1/x2
e.g. y = -1/x e.g. y = -1/x2
+
e.g. y = 1/x
+
+ +
The four cases of graphs along a vertical asymptote:
Example A: Given the
following information of
roots, sign-chart and
vertical asymptotes,
draw the graph.
+
+
root
VA
VA
Graphs of Rational Functions
e.g. y = 1/x2
e.g. y = -1/x e.g. y = -1/x2
+
e.g. y = 1/x
+
+ +
The four cases of graphs along a vertical asymptote:
Example A: Given the
following information of
roots, sign-chart and
vertical asymptotes,
draw the graph.
+
+
root
VA
VA
Graphs of Rational Functions
e.g. y = 1/x2
e.g. y = -1/x e.g. y = -1/x2
+
e.g. y = 1/x
+
+ +
The four cases of graphs along a vertical asymptote:
Example A: Given the
following information of
roots, sign-chart and
vertical asymptotes,
draw the graph.
+
+
root
VA
VA
Graphs of Rational Functions
Horizontal Asymptotes
Graphs of Rational Functions
Horizontal Asymptotes
For x's where | x | is large (i.e. x is to the far right or
far left on the x-axis),
Graphs of Rational Functions
Horizontal Asymptotes
For x's where | x | is large (i.e. x is to the far right or
far left on the x-axis), the graph of a rational function
resembles the quotient of the leading terms of the
numerator and the denominator.
Graphs of Rational Functions
Horizontal Asymptotes
For x's where | x | is large (i.e. x is to the far right or
far left on the x-axis), the graph of a rational function
resembles the quotient of the leading terms of the
numerator and the denominator.
R(x) =
AxN + lower degree terms
BxK + lower degree terms
Specifically, if
then for x's where | x | is large, the graph of R(x)
resembles (quotient of the leading terms).
AxN
BxK
The graph may or may not level off horizontally.
If it does, then we have a horizontal asymptote (HA).
Graphs of Rational Functions
We list all the possibilities of horizontal behavior below:
Graphs of Rational Functions
We list all the possibilities of horizontal behavior below:
Theorem (Horizontal Behavior):
Graphs of Rational Functions
We list all the possibilities of horizontal behavior below:
Given that R(x) =
AxN + lower degree terms
BxK + lower degree terms
Theorem (Horizontal Behavior):
the graph of R(x) as x goes to the far right (x  ∞) and
far left (x -∞) behaves similarly to AxN/BxK = AxN-K/B.
,
Graphs of Rational Functions
We list all the possibilities of horizontal behavior below:
Given that R(x) =
AxN + lower degree terms
BxK + lower degree terms
Theorem (Horizontal Behavior):
the graph of R(x) as x goes to the far right (x  ∞) and
far left (x -∞) behaves similarly to AxN/BxK = AxN-K/B.
I. If N > K,
,
Graphs of Rational Functions
We list all the possibilities of horizontal behavior below:
Given that R(x) =
AxN + lower degree terms
BxK + lower degree terms
Theorem (Horizontal Behavior):
the graph of R(x) as x goes to the far right (x  ∞) and
far left (x -∞) behaves similarly to AxN/BxK = AxN-K/B.
I. If N > K, then the graph of R(x) resembles the
polynomial AxN-K/B.
,
We write this as lim y = ±∞.
x±∞
Graphs of Rational Functions
We list all the possibilities of horizontal behavior below:
Given that R(x) =
AxN + lower degree terms
BxK + lower degree terms
Theorem (Horizontal Behavior):
the graph of R(x) as x goes to the far right (x  ∞) and
far left (x -∞) behaves similarly to AxN/BxK = AxN-K/B.
I. If N > K, then the graph of R(x) resembles the
polynomial AxN-K/B.
II. If N = K,
,
We write this as lim y = ±∞.
x±∞
Graphs of Rational Functions
We list all the possibilities of horizontal behavior below:
Given that R(x) =
AxN + lower degree terms
BxK + lower degree terms
Theorem (Horizontal Behavior):
the graph of R(x) as x goes to the far right (x  ∞) and
far left (x -∞) behaves similarly to AxN/BxK = AxN-K/B.
I. If N > K, then the graph of R(x) resembles the
polynomial AxN-K/B.
II. If N = K, then the graph of R(x) has y = A/B as a
horizontal asymptote (HA).
,
We write this as lim y = ±∞.
x±∞
Graphs of Rational Functions
We list all the possibilities of horizontal behavior below:
Given that R(x) =
AxN + lower degree terms
BxK + lower degree terms
Theorem (Horizontal Behavior):
the graph of R(x) as x goes to the far right (x  ∞) and
far left (x -∞) behaves similarly to AxN/BxK = AxN-K/B.
I. If N > K, then the graph of R(x) resembles the
polynomial AxN-K/B.
II. If N = K, then the graph of R(x) has y = A/B as a
horizontal asymptote (HA). It is noted as lim y = A/B.
x±∞
,
We write this as lim y = ±∞.
x±∞
Graphs of Rational Functions
We list all the possibilities of horizontal behavior below:
Given that R(x) =
AxN + lower degree terms
BxK + lower degree terms
Theorem (Horizontal Behavior):
the graph of R(x) as x goes to the far right (x  ∞) and
far left (x -∞) behaves similarly to AxN/BxK = AxN-K/B.
I. If N > K, then the graph of R(x) resembles the
polynomial AxN-K/B.
II. If N = K, then the graph of R(x) has y = A/B as a
horizontal asymptote (HA). It is noted as lim y = A/B.
III. If N < K,
x±∞
,
We write this as lim y = ±∞.
x±∞
Graphs of Rational Functions
We list all the possibilities of horizontal behavior below:
Given that R(x) =
AxN + lower degree terms
BxK + lower degree terms
Theorem (Horizontal Behavior):
the graph of R(x) as x goes to the far right (x  ∞) and
far left (x -∞) behaves similarly to AxN/BxK = AxN-K/B.
I. If N > K, then the graph of R(x) resembles the
polynomial AxN-K/B.
II. If N = K, then the graph of R(x) has y = A/B as a
horizontal asymptote (HA). It is noted as lim y = A/B.
III. If N < K, then the graph of R(x) has y = 0 as a
horizontal asymptote (HA) because N – K is negative.
x±∞
,
We write this as lim y = ±∞.
x±∞
Graphs of Rational Functions
We list all the possibilities of horizontal behavior below:
Given that R(x) =
AxN + lower degree terms
BxK + lower degree terms
Theorem (Horizontal Behavior):
the graph of R(x) as x goes to the far right (x  ∞) and
far left (x -∞) behaves similarly to AxN/BxK = AxN-K/B.
I. If N > K, then the graph of R(x) resembles the
polynomial AxN-K/B.
II. If N = K, then the graph of R(x) has y = A/B as a
horizontal asymptote (HA). It is noted as lim y = A/B.
III. If N < K, then the graph of R(x) has y = 0 as a
horizontal asymptote (HA) because N – K is negative.
It is noted as lim y = 0.
x±∞
x±∞
,
We write this as lim y = ±∞.
x±∞
Graphs of Rational Functions
Steps for graphing rational functions R(x) = P(x)
Q(x)
Graphs of Rational Functions
Steps for graphing rational functions R(x) =
I. (Roots) As for graphing polynomials, find the roots
of R(x) and their orders by solving R(x) = 0.
P(x)
Q(x)
Graphs of Rational Functions
Steps for graphing rational functions R(x) =
I. (Roots) As for graphing polynomials, find the roots
of R(x) and their orders by solving R(x) = 0.
P(x)
Q(x)
II. (VA) Find the vertical asymptotes (VA) of R(x) and
their orders by solving Q(x) = 0.
Graphs of Rational Functions
Steps for graphing rational functions R(x) =
I. (Roots) As for graphing polynomials, find the roots
of R(x) and their orders by solving R(x) = 0.
P(x)
Q(x)
II. (VA) Find the vertical asymptotes (VA) of R(x) and
their orders by solving Q(x) = 0.
Steps I and II give the sign-chart,
Graphs of Rational Functions
Steps for graphing rational functions R(x) =
I. (Roots) As for graphing polynomials, find the roots
of R(x) and their orders by solving R(x) = 0.
P(x)
Q(x)
II. (VA) Find the vertical asymptotes (VA) of R(x) and
their orders by solving Q(x) = 0.
Steps I and II give the sign-chart, the graphs around
the roots (using their orders)
Graphs of Rational Functions
Steps for graphing rational functions R(x) =
I. (Roots) As for graphing polynomials, find the roots
of R(x) and their orders by solving R(x) = 0.
P(x)
Q(x)
II. (VA) Find the vertical asymptotes (VA) of R(x) and
their orders by solving Q(x) = 0.
Steps I and II give the sign-chart, the graphs around
the roots (using their orders) and the graph along the
VA (upward or downward).
Graphs of Rational Functions
Steps for graphing rational functions R(x) =
I. (Roots) As for graphing polynomials, find the roots
of R(x) and their orders by solving R(x) = 0.
P(x)
Q(x)
II. (VA) Find the vertical asymptotes (VA) of R(x) and
their orders by solving Q(x) = 0.
Steps I and II give the sign-chart, the graphs around
the roots (using their orders) and the graph along the
VA (upward or downward). From these we construct
the middle portion of the graph (as in example A).
Complete the graph with step III.
Graphs of Rational Functions
Steps for graphing rational functions R(x) =
I. (Roots) As for graphing polynomials, find the roots
of R(x) and their orders by solving R(x) = 0.
x±∞
P(x)
Q(x)
II. (VA) Find the vertical asymptotes (VA) of R(x) and
their orders by solving Q(x) = 0.
Steps I and II give the sign-chart, the graphs around
the roots (using their orders) and the graph along the
VA (upward or downward). From these we construct
the middle portion of the graph (as in example A).
Complete the graph with step III.
III. (HA) Use the above theorem to determine the
behavior of the graph to the far right and left, that is,
as .
Graphs of Rational Functions
Steps for graphing rational functions R(x) =
I. (Roots) As for graphing polynomials, find the roots
of R(x) and their orders by solving R(x) = 0.
x±∞
P(x)
Q(x)
II. (VA) Find the vertical asymptotes (VA) of R(x) and
their orders by solving Q(x) = 0.
Steps I and II give the sign-chart, the graphs around
the roots (using their orders) and the graph along the
VA (upward or downward). From these we construct
the middle portion of the graph (as in example A).
Complete the graph with step III.
III. (HA) Use the above theorem to determine the
behavior of the graph to the far right and left, that is,
as . (HA exists only if deg P < deg Q)
Graphs of Rational Functions
Example C:
Find the roots, VA and HA, if any, of R(x) =
Draw the sign-chart and sketch the graph.
x2 – 4x + 4
x2 – 1
Graphs of Rational Functions
Example C:
Find the roots, VA and HA, if any, of R(x) =
Draw the sign-chart and sketch the graph.
x2 – 4x + 4
x2 – 1
For it's root, set x2 – 4x + 4 = 0, i.e. x = 2 (ord = 2).
Graphs of Rational Functions
Example C:
Find the roots, VA and HA, if any, of R(x) =
Draw the sign-chart and sketch the graph.
x2 – 4x + 4
x2 – 1
For it's root, set x2 – 4x + 4 = 0, i.e. x = 2 (ord = 2).
For VA, set Q(x) = 0, i.e. x2 – 1 = 0  x = ± 1.
Graphs of Rational Functions
Example C:
Find the roots, VA and HA, if any, of R(x) =
Draw the sign-chart and sketch the graph.
x2 – 4x + 4
x2 – 1
For it's root, set x2 – 4x + 4 = 0, i.e. x = 2 (ord = 2).
For VA, set Q(x) = 0, i.e. x2 – 1 = 0  x = ± 1.
x=2
Graphs of Rational Functions
Example C:
Find the roots, VA and HA, if any, of R(x) =
Draw the sign-chart and sketch the graph.
x2 – 4x + 4
x2 – 1
For it's root, set x2 – 4x + 4 = 0, i.e. x = 2 (ord = 2).
For VA, set Q(x) = 0, i.e. x2 – 1 = 0  x = ± 1.
Both have order 1, so
the sign changes at
each of these values.
+
–
x=2
+
+
Graphs of Rational Functions
Example C:
Find the roots, VA and HA, if any, of R(x) =
Draw the sign-chart and sketch the graph.
x2 – 4x + 4
x2 – 1
For it's root, set x2 – 4x + 4 = 0, i.e. x = 2 (ord = 2).
For VA, set Q(x) = 0, i.e. x2 – 1 = 0  x = ± 1.
Both have order 1, so
the sign changes at
each of these values.
+
+ –
x=2
+ +
Graphs of Rational Functions
Example C:
Find the roots, VA and HA, if any, of R(x) =
Draw the sign-chart and sketch the graph.
x2 – 4x + 4
x2 – 1
For it's root, set x2 – 4x + 4 = 0, i.e. x = 2 (ord = 2).
For VA, set Q(x) = 0, i.e. x2 – 1 = 0  x = ± 1.
Both have order 1, so
the sign changes at
each of these values.
As x±∞, R(x) resembles
x2/x2 = 1, i.e. it has y = 1
as the HA.
+
+ –
x=2
+
+
Graphs of Rational Functions
Example C:
Find the roots, VA and HA, if any, of R(x) =
Draw the sign-chart and sketch the graph.
x2 – 4x + 4
x2 – 1
For it's root, set x2 – 4x + 4 = 0, i.e. x = 2 (ord = 2).
For VA, set Q(x) = 0, i.e. x2 – 1 = 0  x = ± 1.
Both have order 1, so
the sign changes at
each of these values.
As x±∞, R(x) resembles
x2/x2 = 1, i.e. it has y = 1
as the HA. Note the
graph stays above the
HA to the far left,
and below to the far right.
+
+ –
x=2
+
+
Graphs of Rational Functions
Example D:
Find the roots, VA and HA, if any, of R(x) =
Draw the sign-chart and sketch the graph.
x2 – 2x – 3
x – 2
Graphs of Rational Functions
Example D:
Find the roots, VA and HA, if any, of R(x) =
Draw the sign-chart and sketch the graph.
x2 – 2x – 3
x – 2
Set x2 – 2x – 3 = 0  (x – 3)(x + 1) = 0
so x = -1, 3 are the roots of order 1.
Graphs of Rational Functions
Example D:
Find the roots, VA and HA, if any, of R(x) =
Draw the sign-chart and sketch the graph.
x2 – 2x – 3
x – 2
Set x2 – 2x – 3 = 0  (x – 3)(x + 1) = 0
so x = -1, 3 are the roots of order 1.
For VA, set x – 2 = 0, i.e. x = 2.
Graphs of Rational Functions
Example D:
Find the roots, VA and HA, if any, of R(x) =
Draw the sign-chart and sketch the graph.
x2 – 2x – 3
x – 2
Set x2 – 2x – 3 = 0  (x – 3)(x + 1) = 0
so x = -1, 3 are the roots of order 1.
For VA, set x – 2 = 0, i.e. x = 2.
Do the sign-chart.
Graphs of Rational Functions
Example D:
Find the roots, VA and HA, if any, of R(x) =
Draw the sign-chart and sketch the graph.
x2 – 2x – 3
x – 2
Set x2 – 2x – 3 = 0  (x – 3)(x + 1) = 0
so x = -1, 3 are the roots of order 1.
For VA, set x – 2 = 0, i.e. x = 2.
x=3
Do the sign-chart.
x= –1
Graphs of Rational Functions
Example D:
Find the roots, VA and HA, if any, of R(x) =
Draw the sign-chart and sketch the graph.
x2 – 2x – 3
x – 2
Set x2 – 2x – 3 = 0  (x – 3)(x + 1) = 0
so x = -1, 3 are the roots of order 1.
For VA, set x – 2 = 0, i.e. x = 2.
x=3
Do the sign-chart.
+
–
+
–
x= –1
Graphs of Rational Functions
Example D:
Find the roots, VA and HA, if any, of R(x) =
Draw the sign-chart and sketch the graph.
x2 – 2x – 3
x – 2
Set x2 – 2x – 3 = 0  (x – 3)(x + 1) = 0
so x = -1, 3 are the roots of order 1.
For VA, set x – 2 = 0, i.e. x = 2.
Do the sign-chart. Construct the
middle part of the graph.
x=3
+
–
+
–
x= –1
Graphs of Rational Functions
Example D:
Find the roots, VA and HA, if any, of R(x) =
Draw the sign-chart and sketch the graph.
x2 – 2x – 3
x – 2
Set x2 – 2x – 3 = 0  (x – 3)(x + 1) = 0
so x = -1, 3 are the roots of order 1.
For VA, set x – 2 = 0, i.e. x = 2.
As x ±∞, the graph of R(x)
resembles the graph of the
quotient of the leading terms
x2/x = x, or y = x.
x=3
+
–
+
–
Do the sign-chart. Construct the
middle part of the graph.
x= –1
Graphs of Rational Functions
Example D:
Find the roots, VA and HA, if any, of R(x) =
Draw the sign-chart and sketch the graph.
x2 – 2x – 3
x – 2
Set x2 – 2x – 3 = 0  (x – 3)(x + 1) = 0
so x = -1, 3 are the roots of order 1.
For VA, set x – 2 = 0, i.e. x = 2.
As x ±∞, the graph of R(x)
resembles the graph of the
quotient of the leading terms
x2/x = x, or y = x.
Hence there is no HA.
x=3
Do the sign-chart. Construct the
middle part of the graph.
+
–
+
–
x= –1
Graphs of Rational Functions
http://www.lahc.edu/math/precalculus/math_260a.html
From the last few sections, we see the importance of
the factored form of polynomial formulas.
This factoring problem is the same as the problem of
finding roots of polynomials.
In the next chapter, we give the possible (completely)
factored form of real polynomials.
This result is called the
“Fundamental Theorem of Algebra”.
Graphs of Rational Functions
+ +
+ +
The graphs along poles.
Even-order Poles
Odd-order Poles
Even-order Roots
Odd-order Roots
The graphs around a roots. (See 2.9.)
order = 3, 5, 7…
Graphs of Factorable Rational Functions
Exercise A. Following are the sign charts of
simplified factorable rational function
with their roots, poles, and their orders given.
a. Write down a (any) rational formula in the
simplified factored form of any given sign chart.
b. Sketch its graphs (its “mid-section”).
–1
1.
ord=1 ord=1
1
– – – –1
2.
ord=2
ord=1
1
+ + +
–1
3.
ord=1 ord=1
1 – – – –1
4.
ord=2
ord=2
1 + + +
–1
7.
1 3 –1
8.
ord=1 ord=2
1 3
ord=2
+ +
– –
= root
= pole
(asymptote)
ord=2 ord=1 ord=1
–1
5.
1 3 –1
6.
ord=1 ord=2
1 3
ord=2
+ +
– –
ord=2 ord=1 ord=1
B. For each of the following rational functions,
identify its roots, poles and their orders.
a. Make a sign charts (as in A).
b. Determine its horizontal behavior. Sketch its graph.
1. R(x) = 2. x – 3
x + 2
2 R(x) = –1
5. R(x) = 6. x – 3
x + 2
x – 3 R(x) =
x + 2
3. R(x) = 4. 5 – x
x + 1
–2 R(x) = 1
9. (x – 3)2
R(x) = x – 2
7. R(x) = 8. 3 – 2x
x + 2
–3x R(x) =
x
10. (x + 3)2
R(x) = x + 2
11. (x – 3)(x + 3)
R(x) =
x – 2
12. R(x) =
(x – 3)(x + 3)
x – 5
Graphs of Factorable Rational Functions
B. For each of the following rational functions,
identify its roots, poles and their orders.
a. Make a sign charts (as in A).
b. Determine its horizontal behavior. Sketch its graph.
13. (x – 2)2
R(x) = 14.
(x – 4)(x + 5)
R(x) =
15. (x – 3)(x + 3)
R(x) = 16. R(x) =
(x – 3)(x + 3)
(x – 3)(x + 3) (x + 2)2
(x + 3)(x + 5)
(2x – 1)(x + 1)
(x – 4)(x + 5)
17. x(x – 3)(x + 3)
R(x) = 18. R(x) =
(x – 3)2(x + 3)
(2x – 1)(x + 1)
Graphs of Factorable Rational Functions
(Answers to odd problems) Exercise A.
1. 3.
x – 1
x + 1
(x + 1)(x – 1)
1
–
5. (x + 1)2
–
(x – 1)(x – 3) 7.
(x + 1)2(x – 3)
(x – 1)
Graphs of Factorable Rational Functions
Exercise B
1.
ord=1
–2 + + +
– – – 3.
ord=1
–1
+ + + – – –
5.
–2
ord=1
ord=1
3
+ + + +
– – –
7. –2
ord=1
ord=1
0
+ + +
– – – –
9.
–3
ord=1
ord=2
2 + + +
– – – – –
Graphs of Factorable Rational Functions
11. –3
ord=1
ord=1
2
+ +
– – – – – 3
ord=1
+ +
13. –3
ord=1
ord=1
2
+ + – – – 3
ord=1
+ +
– – –
15. 17.
–5
ord=1
ord=1
-3
+ + – – –
ord=1
+ +
+ +
ord=1
3 – – – 4 –5
ord=1
ord=1
-3
– –
ord=1
+ +
+ +
ord=1
3
– – 4
– –
ord=1
0
Graphs of Factorable Rational Functions

14 graphs of factorable rational functions x

  • 1.
  • 2.
    Graphs of RationalFunctions Rational functions are functions of the form R(x) = where P(x) and Q(x) are polynomials. P(x) Q(x)
  • 3.
    Graphs of RationalFunctions A rational function is factorable if both P(x) and Q(x) are factorable. Rational functions are functions of the form R(x) = where P(x) and Q(x) are polynomials. P(x) Q(x)
  • 4.
    Graphs of RationalFunctions A rational function is factorable if both P(x) and Q(x) are factorable. Unless otherwise stated, the rational functions in this section are assumed to be reduced factorable rational functions. Rational functions are functions of the form R(x) = where P(x) and Q(x) are polynomials. P(x) Q(x)
  • 5.
    Graphs of RationalFunctions A rational function is factorable if both P(x) and Q(x) are factorable. Unless otherwise stated, the rational functions in this section are assumed to be reduced factorable rational functions. The principles of graphing rational functions are the the same as for polynomials. We study the behaviors and draw pieces of the graphs at important regions, then complete the graphs by connecting them. Rational functions are functions of the form R(x) = where P(x) and Q(x) are polynomials. P(x) Q(x)
  • 6.
    Graphs of RationalFunctions A rational function is factorable if both P(x) and Q(x) are factorable. Unless otherwise stated, the rational functions in this section are assumed to be reduced factorable rational functions. The principles of graphing rational functions are the the same as for polynomials. We study the behaviors and draw pieces of the graphs at important regions, then complete the graphs by connecting them. However, the behaviors of rational functions are more complicated due to the presence of the denominators. Rational functions are functions of the form R(x) = where P(x) and Q(x) are polynomials. P(x) Q(x)
  • 7.
    Vertical Asymptote Graphs ofRational Functions
  • 8.
    Vertical Asymptote The functiony = 1/x is not defined at x = 0. Graphs of Rational Functions
  • 9.
    Vertical Asymptote The functiony = 1/x is not defined at x = 0. So the graph is not a continuous curve, it breaks at x = 0. Graphs of Rational Functions
  • 10.
    Vertical Asymptote The functiony = 1/x is not defined at x = 0. So the graph is not a continuous curve, it breaks at x = 0. For small positive x's, y = 1/x is large. Graphs of Rational Functions
  • 11.
    Vertical Asymptote The functiony = 1/x is not defined at x = 0. So the graph is not a continuous curve, it breaks at x = 0. For small positive x's, y = 1/x is large. The closer the x is to 0, the smaller x is, Graphs of Rational Functions
  • 12.
    Vertical Asymptote The functiony = 1/x is not defined at x = 0. So the graph is not a continuous curve, it breaks at x = 0. For small positive x's, y = 1/x is large. The closer the x is to 0, the smaller x is, correspondingly the larger y = 1/x is, Graphs of Rational Functions
  • 13.
    Vertical Asymptote The functiony = 1/x is not defined at x = 0. So the graph is not a continuous curve, it breaks at x = 0. For small positive x's, y = 1/x is large. The closer the x is to 0, the smaller x is, correspondingly the larger y = 1/x is, hence the higher the point (x, 1/x) is. Graphs of Rational Functions
  • 14.
    Vertical Asymptote The functiony = 1/x is not defined at x = 0. So the graph is not a continuous curve, it breaks at x = 0. For small positive x's, y = 1/x is large. The closer the x is to 0, the smaller x is, correspondingly the larger y = 1/x is, hence the higher the point (x, 1/x) is. (1, 1) Graphs of Rational Functions x=0
  • 15.
    Vertical Asymptote The functiony = 1/x is not defined at x = 0. So the graph is not a continuous curve, it breaks at x = 0. For small positive x's, y = 1/x is large. The closer the x is to 0, the smaller x is, correspondingly the larger y = 1/x is, hence the higher the point (x, 1/x) is. (1, 1) (1/2, 2) Graphs of Rational Functions x=0
  • 16.
    Vertical Asymptote The functiony = 1/x is not defined at x = 0. So the graph is not a continuous curve, it breaks at x = 0. For small positive x's, y = 1/x is large. The closer the x is to 0, the smaller x is, correspondingly the larger y = 1/x is, hence the higher the point (x, 1/x) is. (1, 1) (1/2, 2) (1/3, 3) Graphs of Rational Functions x=0
  • 17.
    Vertical Asymptote The functiony = 1/x is not defined at x = 0. So the graph is not a continuous curve, it breaks at x = 0. For small positive x's, y = 1/x is large. The closer the x is to 0, the smaller x is, correspondingly the larger y = 1/x is, hence the higher the point (x, 1/x) is. (1, 1) (1/2, 2) (1/3, 3) The graph runs along x = 0 but never touches x = 0 as shown. Graphs of Rational Functions x=0
  • 18.
    Vertical Asymptote The functiony = 1/x is not defined at x = 0. So the graph is not a continuous curve, it breaks at x = 0. For small positive x's, y = 1/x is large. The closer the x is to 0, the smaller x is, correspondingly the larger y = 1/x is, hence the higher the point (x, 1/x) is. The graph runs along x = 0 but never touches x = 0 as shown. Graphs of Rational Functions (1, 1) (1/2, 2) (1/3, 3) The boundary-line x = 0 is called a vertical asymptote (VA). x=0
  • 19.
    Vertical Asymptote The functiony = 1/x is not defined at x = 0. So the graph is not a continuous curve, it breaks at x = 0. For small positive x's, y = 1/x is large. The closer the x is to 0, the smaller x is, correspondingly the larger y = 1/x is, hence the higher the point (x, 1/x) is. The graph runs along x = 0 but never touches x = 0 as shown. negative x's, y = 1/x are negative Graphs of Rational Functions (1, 1) (1/2, 2) (1/3, 3) x=0 The boundary-line x = 0 is called a vertical asymptote (VA). For "small"
  • 20.
    Vertical Asymptote The functiony = 1/x is not defined at x = 0. So the graph is not a continuous curve, it breaks at x = 0. For small positive x's, y = 1/x is large. The closer the x is to 0, the smaller x is, correspondingly the larger y = 1/x is, hence the higher the point (x, 1/x) is. The graph runs along x = 0 but never touches x = 0 as shown. negative x's, y = 1/x are negative so the corresponding graph goes downward along the asymptote as shown. Graphs of Rational Functions (1, 1) (1/2, 2) (1/3, 3) x=0 The boundary-line x = 0 is called a vertical asymptote (VA). For "small"
  • 21.
    Vertical Asymptote x=0 The functiony = 1/x is not defined at x = 0. So the graph is not a continuous curve, it breaks at x = 0. For small positive x's, y = 1/x is large. The closer the x is to 0, the smaller x is, correspondingly the larger y = 1/x is, hence the higher the point (x, 1/x) is. (1, 1) (1/2, 2) (1/3, 3) The graph runs along x = 0 but never touches x = 0 as shown. negative x's, y = 1/x are negative so the corresponding graph goes downward along the asymptote as shown. (-1, -1) (-1/2, -2) (-1/3, -3) Graphs of Rational Functions The boundary-line x = 0 is called a vertical asymptote (VA). For "small"
  • 22.
    Graph of y= 1/x x=0 As x gets larger and larger, the corresponding y = 1/x become smaller and smaller. This means the graph gets closer and closer to the x-axis as it goes further and further to the right and to the left. To the right, because y = 1/x is positive, the graph stays above the x-axis. To the left, y = 1/x is negative so the graph stays below the x-axis. As the graph goes further to the left. It gets (1, 1) (2, 1/2) (3, 1/3) (-1, -1) (-2, -1/2) (-3, -1/3) Graphs of Rational Functions closer and closer to the x-axis. Hence the x-axis is a horizontal asymptote (HA).
  • 23.
    Likewise, y =1/x2 has x = 0 as a vertical asymptote. Graphs of Rational Functions
  • 24.
    Likewise, y =1/x2 has x = 0 as a vertical asymptote. However, since 1/x2 is always positive, the graph goes upward along both sides of the asymptote. Graphs of Rational Functions
  • 25.
    Likewise, y =1/x2 has x = 0 as a vertical asymptote. However, since 1/x2 is always positive, the graph goes upward along both sides of the asymptote. Graphs of Rational Functions Graph of y = 1/x2
  • 26.
    Likewise, y =1/x2 has x = 0 as a vertical asymptote. However, since 1/x2 is always positive, the graph goes upward along both sides of the asymptote. We list the following facts about vertical asymptotes of a reduced rational function. Graphs of Rational Functions Graph of y = 1/x2
  • 27.
    Likewise, y =1/x2 has x = 0 as a vertical asymptote. However, since 1/x2 is always positive, the graph goes upward along both sides of the asymptote. We list the following facts about vertical asymptotes of a reduced rational function. Graphs of Rational Functions Graph of y = 1/x2 I. The vertical asymptotes occur at where the denominator is 0 (i.e. the roots of Q(x)).
  • 28.
    Likewise, y =1/x2 has x = 0 as a vertical asymptote. However, since 1/x2 is always positive, the graph goes upward along both sides of the asymptote. We list the following facts about vertical asymptotes of a reduced rational function. Graphs of Rational Functions Graph of y = 1/x2 II. The graph runs along either side of the vertical asymptotes. I. The vertical asymptotes occur at where the denominator is 0 (i.e. the roots of Q(x)).
  • 29.
    Likewise, y =1/x2 has x = 0 as a vertical asymptote. However, since 1/x2 is always positive, the graph goes upward along both sides of the asymptote. We list the following facts about vertical asymptotes of a reduced rational function. Graphs of Rational Functions Graph of y = 1/x2 II. The graph runs along either side of the vertical asymptotes. Whether the graph goes upward or downward along the asymptote may be determined using the sing-chart. I. The vertical asymptotes occur at where the denominator is 0 (i.e. the roots of Q(x)).
  • 30.
    Likewise, y =1/x2 has x = 0 as a vertical asymptote. However, since 1/x2 is always positive, the graph goes upward along both sides of the asymptote. We list the following facts about vertical asymptotes of a reduced rational function. Graphs of Rational Functions Graph of y = 1/x2 II. The graph runs along either side of the vertical asymptotes. Whether the graph goes upward or downward along the asymptote may be determined using the sing-chart. There are four different cases. I. The vertical asymptotes occur at where the denominator is 0 (i.e. the roots of Q(x)).
  • 31.
    Graphs of RationalFunctions The four cases of graphs along a vertical asymptote:
  • 32.
    Graphs of RationalFunctions + e.g. y = 1/x The four cases of graphs along a vertical asymptote:
  • 33.
    Graphs of RationalFunctions e.g. y = -1/x + e.g. y = 1/x + The four cases of graphs along a vertical asymptote:
  • 34.
    Graphs of RationalFunctions e.g. y = 1/x2 e.g. y = -1/x + e.g. y = 1/x + + + The four cases of graphs along a vertical asymptote:
  • 35.
    Graphs of RationalFunctions e.g. y = 1/x2 e.g. y = -1/x e.g. y = -1/x2 + e.g. y = 1/x + + + The four cases of graphs along a vertical asymptote:
  • 36.
    Graphs of RationalFunctions e.g. y = 1/x2 e.g. y = -1/x e.g. y = -1/x2 + e.g. y = 1/x + + + The four cases of graphs along a vertical asymptote: Example A: Given the following information of roots, sign-chart and vertical asymptotes, draw the graph.
  • 37.
    Graphs of RationalFunctions e.g. y = 1/x2 e.g. y = -1/x e.g. y = -1/x2 + e.g. y = 1/x + + + The four cases of graphs along a vertical asymptote: Example A: Given the following information of roots, sign-chart and vertical asymptotes, draw the graph. + + root VA VA
  • 38.
    Graphs of RationalFunctions e.g. y = 1/x2 e.g. y = -1/x e.g. y = -1/x2 + e.g. y = 1/x + + + The four cases of graphs along a vertical asymptote: Example A: Given the following information of roots, sign-chart and vertical asymptotes, draw the graph. + + root VA VA
  • 39.
    Graphs of RationalFunctions e.g. y = 1/x2 e.g. y = -1/x e.g. y = -1/x2 + e.g. y = 1/x + + + The four cases of graphs along a vertical asymptote: Example A: Given the following information of roots, sign-chart and vertical asymptotes, draw the graph. + + root VA VA
  • 40.
    Graphs of RationalFunctions e.g. y = 1/x2 e.g. y = -1/x e.g. y = -1/x2 + e.g. y = 1/x + + + The four cases of graphs along a vertical asymptote: Example A: Given the following information of roots, sign-chart and vertical asymptotes, draw the graph. + + root VA VA
  • 41.
    Graphs of RationalFunctions e.g. y = 1/x2 e.g. y = -1/x e.g. y = -1/x2 + e.g. y = 1/x + + + The four cases of graphs along a vertical asymptote: Example A: Given the following information of roots, sign-chart and vertical asymptotes, draw the graph. + + root VA VA
  • 42.
    Graphs of RationalFunctions Horizontal Asymptotes
  • 43.
    Graphs of RationalFunctions Horizontal Asymptotes For x's where | x | is large (i.e. x is to the far right or far left on the x-axis),
  • 44.
    Graphs of RationalFunctions Horizontal Asymptotes For x's where | x | is large (i.e. x is to the far right or far left on the x-axis), the graph of a rational function resembles the quotient of the leading terms of the numerator and the denominator.
  • 45.
    Graphs of RationalFunctions Horizontal Asymptotes For x's where | x | is large (i.e. x is to the far right or far left on the x-axis), the graph of a rational function resembles the quotient of the leading terms of the numerator and the denominator. R(x) = AxN + lower degree terms BxK + lower degree terms Specifically, if
  • 46.
    Graphs of RationalFunctions Horizontal Asymptotes For x's where | x | is large (i.e. x is to the far right or far left on the x-axis), the graph of a rational function resembles the quotient of the leading terms of the numerator and the denominator. R(x) = AxN + lower degree terms BxK + lower degree terms Specifically, if then for x's where | x | is large, the graph of R(x) resembles (quotient of the leading terms). AxN BxK
  • 47.
    Graphs of RationalFunctions Horizontal Asymptotes For x's where | x | is large (i.e. x is to the far right or far left on the x-axis), the graph of a rational function resembles the quotient of the leading terms of the numerator and the denominator. R(x) = AxN + lower degree terms BxK + lower degree terms Specifically, if then for x's where | x | is large, the graph of R(x) resembles (quotient of the leading terms). AxN BxK The graph may or may not level off horizontally.
  • 48.
    Graphs of RationalFunctions Horizontal Asymptotes For x's where | x | is large (i.e. x is to the far right or far left on the x-axis), the graph of a rational function resembles the quotient of the leading terms of the numerator and the denominator. R(x) = AxN + lower degree terms BxK + lower degree terms Specifically, if then for x's where | x | is large, the graph of R(x) resembles (quotient of the leading terms). AxN BxK The graph may or may not level off horizontally. If it does, then we have a horizontal asymptote (HA).
  • 49.
    Graphs of RationalFunctions We list all the possibilities of horizontal behavior below:
  • 50.
    Graphs of RationalFunctions We list all the possibilities of horizontal behavior below: Theorem (Horizontal Behavior):
  • 51.
    Graphs of RationalFunctions We list all the possibilities of horizontal behavior below: Given that R(x) = AxN + lower degree terms BxK + lower degree terms Theorem (Horizontal Behavior): the graph of R(x) as x goes to the far right (x  ∞) and far left (x -∞) behaves similarly to AxN/BxK = AxN-K/B. ,
  • 52.
    Graphs of RationalFunctions We list all the possibilities of horizontal behavior below: Given that R(x) = AxN + lower degree terms BxK + lower degree terms Theorem (Horizontal Behavior): the graph of R(x) as x goes to the far right (x  ∞) and far left (x -∞) behaves similarly to AxN/BxK = AxN-K/B. I. If N > K, ,
  • 53.
    Graphs of RationalFunctions We list all the possibilities of horizontal behavior below: Given that R(x) = AxN + lower degree terms BxK + lower degree terms Theorem (Horizontal Behavior): the graph of R(x) as x goes to the far right (x  ∞) and far left (x -∞) behaves similarly to AxN/BxK = AxN-K/B. I. If N > K, then the graph of R(x) resembles the polynomial AxN-K/B. ,
  • 54.
    Graphs of RationalFunctions We list all the possibilities of horizontal behavior below: Given that R(x) = AxN + lower degree terms BxK + lower degree terms Theorem (Horizontal Behavior): the graph of R(x) as x goes to the far right (x  ∞) and far left (x -∞) behaves similarly to AxN/BxK = AxN-K/B. I. If N > K, then the graph of R(x) resembles the polynomial AxN-K/B. , We write this as lim y = ±∞. x±∞
  • 55.
    Graphs of RationalFunctions We list all the possibilities of horizontal behavior below: Given that R(x) = AxN + lower degree terms BxK + lower degree terms Theorem (Horizontal Behavior): the graph of R(x) as x goes to the far right (x  ∞) and far left (x -∞) behaves similarly to AxN/BxK = AxN-K/B. I. If N > K, then the graph of R(x) resembles the polynomial AxN-K/B. II. If N = K, , We write this as lim y = ±∞. x±∞
  • 56.
    Graphs of RationalFunctions We list all the possibilities of horizontal behavior below: Given that R(x) = AxN + lower degree terms BxK + lower degree terms Theorem (Horizontal Behavior): the graph of R(x) as x goes to the far right (x  ∞) and far left (x -∞) behaves similarly to AxN/BxK = AxN-K/B. I. If N > K, then the graph of R(x) resembles the polynomial AxN-K/B. II. If N = K, then the graph of R(x) has y = A/B as a horizontal asymptote (HA). , We write this as lim y = ±∞. x±∞
  • 57.
    Graphs of RationalFunctions We list all the possibilities of horizontal behavior below: Given that R(x) = AxN + lower degree terms BxK + lower degree terms Theorem (Horizontal Behavior): the graph of R(x) as x goes to the far right (x  ∞) and far left (x -∞) behaves similarly to AxN/BxK = AxN-K/B. I. If N > K, then the graph of R(x) resembles the polynomial AxN-K/B. II. If N = K, then the graph of R(x) has y = A/B as a horizontal asymptote (HA). It is noted as lim y = A/B. x±∞ , We write this as lim y = ±∞. x±∞
  • 58.
    Graphs of RationalFunctions We list all the possibilities of horizontal behavior below: Given that R(x) = AxN + lower degree terms BxK + lower degree terms Theorem (Horizontal Behavior): the graph of R(x) as x goes to the far right (x  ∞) and far left (x -∞) behaves similarly to AxN/BxK = AxN-K/B. I. If N > K, then the graph of R(x) resembles the polynomial AxN-K/B. II. If N = K, then the graph of R(x) has y = A/B as a horizontal asymptote (HA). It is noted as lim y = A/B. III. If N < K, x±∞ , We write this as lim y = ±∞. x±∞
  • 59.
    Graphs of RationalFunctions We list all the possibilities of horizontal behavior below: Given that R(x) = AxN + lower degree terms BxK + lower degree terms Theorem (Horizontal Behavior): the graph of R(x) as x goes to the far right (x  ∞) and far left (x -∞) behaves similarly to AxN/BxK = AxN-K/B. I. If N > K, then the graph of R(x) resembles the polynomial AxN-K/B. II. If N = K, then the graph of R(x) has y = A/B as a horizontal asymptote (HA). It is noted as lim y = A/B. III. If N < K, then the graph of R(x) has y = 0 as a horizontal asymptote (HA) because N – K is negative. x±∞ , We write this as lim y = ±∞. x±∞
  • 60.
    Graphs of RationalFunctions We list all the possibilities of horizontal behavior below: Given that R(x) = AxN + lower degree terms BxK + lower degree terms Theorem (Horizontal Behavior): the graph of R(x) as x goes to the far right (x  ∞) and far left (x -∞) behaves similarly to AxN/BxK = AxN-K/B. I. If N > K, then the graph of R(x) resembles the polynomial AxN-K/B. II. If N = K, then the graph of R(x) has y = A/B as a horizontal asymptote (HA). It is noted as lim y = A/B. III. If N < K, then the graph of R(x) has y = 0 as a horizontal asymptote (HA) because N – K is negative. It is noted as lim y = 0. x±∞ x±∞ , We write this as lim y = ±∞. x±∞
  • 61.
    Graphs of RationalFunctions Steps for graphing rational functions R(x) = P(x) Q(x)
  • 62.
    Graphs of RationalFunctions Steps for graphing rational functions R(x) = I. (Roots) As for graphing polynomials, find the roots of R(x) and their orders by solving R(x) = 0. P(x) Q(x)
  • 63.
    Graphs of RationalFunctions Steps for graphing rational functions R(x) = I. (Roots) As for graphing polynomials, find the roots of R(x) and their orders by solving R(x) = 0. P(x) Q(x) II. (VA) Find the vertical asymptotes (VA) of R(x) and their orders by solving Q(x) = 0.
  • 64.
    Graphs of RationalFunctions Steps for graphing rational functions R(x) = I. (Roots) As for graphing polynomials, find the roots of R(x) and their orders by solving R(x) = 0. P(x) Q(x) II. (VA) Find the vertical asymptotes (VA) of R(x) and their orders by solving Q(x) = 0. Steps I and II give the sign-chart,
  • 65.
    Graphs of RationalFunctions Steps for graphing rational functions R(x) = I. (Roots) As for graphing polynomials, find the roots of R(x) and their orders by solving R(x) = 0. P(x) Q(x) II. (VA) Find the vertical asymptotes (VA) of R(x) and their orders by solving Q(x) = 0. Steps I and II give the sign-chart, the graphs around the roots (using their orders)
  • 66.
    Graphs of RationalFunctions Steps for graphing rational functions R(x) = I. (Roots) As for graphing polynomials, find the roots of R(x) and their orders by solving R(x) = 0. P(x) Q(x) II. (VA) Find the vertical asymptotes (VA) of R(x) and their orders by solving Q(x) = 0. Steps I and II give the sign-chart, the graphs around the roots (using their orders) and the graph along the VA (upward or downward).
  • 67.
    Graphs of RationalFunctions Steps for graphing rational functions R(x) = I. (Roots) As for graphing polynomials, find the roots of R(x) and their orders by solving R(x) = 0. P(x) Q(x) II. (VA) Find the vertical asymptotes (VA) of R(x) and their orders by solving Q(x) = 0. Steps I and II give the sign-chart, the graphs around the roots (using their orders) and the graph along the VA (upward or downward). From these we construct the middle portion of the graph (as in example A).
  • 68.
    Graphs of RationalFunctions Steps for graphing rational functions R(x) = I. (Roots) As for graphing polynomials, find the roots of R(x) and their orders by solving R(x) = 0. P(x) Q(x) II. (VA) Find the vertical asymptotes (VA) of R(x) and their orders by solving Q(x) = 0. Steps I and II give the sign-chart, the graphs around the roots (using their orders) and the graph along the VA (upward or downward). From these we construct the middle portion of the graph (as in example A). Complete the graph with step III.
  • 69.
    Graphs of RationalFunctions Steps for graphing rational functions R(x) = I. (Roots) As for graphing polynomials, find the roots of R(x) and their orders by solving R(x) = 0. x±∞ P(x) Q(x) II. (VA) Find the vertical asymptotes (VA) of R(x) and their orders by solving Q(x) = 0. Steps I and II give the sign-chart, the graphs around the roots (using their orders) and the graph along the VA (upward or downward). From these we construct the middle portion of the graph (as in example A). Complete the graph with step III. III. (HA) Use the above theorem to determine the behavior of the graph to the far right and left, that is, as .
  • 70.
    Graphs of RationalFunctions Steps for graphing rational functions R(x) = I. (Roots) As for graphing polynomials, find the roots of R(x) and their orders by solving R(x) = 0. x±∞ P(x) Q(x) II. (VA) Find the vertical asymptotes (VA) of R(x) and their orders by solving Q(x) = 0. Steps I and II give the sign-chart, the graphs around the roots (using their orders) and the graph along the VA (upward or downward). From these we construct the middle portion of the graph (as in example A). Complete the graph with step III. III. (HA) Use the above theorem to determine the behavior of the graph to the far right and left, that is, as . (HA exists only if deg P < deg Q)
  • 71.
    Graphs of RationalFunctions Example C: Find the roots, VA and HA, if any, of R(x) = Draw the sign-chart and sketch the graph. x2 – 4x + 4 x2 – 1
  • 72.
    Graphs of RationalFunctions Example C: Find the roots, VA and HA, if any, of R(x) = Draw the sign-chart and sketch the graph. x2 – 4x + 4 x2 – 1 For it's root, set x2 – 4x + 4 = 0, i.e. x = 2 (ord = 2).
  • 73.
    Graphs of RationalFunctions Example C: Find the roots, VA and HA, if any, of R(x) = Draw the sign-chart and sketch the graph. x2 – 4x + 4 x2 – 1 For it's root, set x2 – 4x + 4 = 0, i.e. x = 2 (ord = 2). For VA, set Q(x) = 0, i.e. x2 – 1 = 0  x = ± 1.
  • 74.
    Graphs of RationalFunctions Example C: Find the roots, VA and HA, if any, of R(x) = Draw the sign-chart and sketch the graph. x2 – 4x + 4 x2 – 1 For it's root, set x2 – 4x + 4 = 0, i.e. x = 2 (ord = 2). For VA, set Q(x) = 0, i.e. x2 – 1 = 0  x = ± 1. x=2
  • 75.
    Graphs of RationalFunctions Example C: Find the roots, VA and HA, if any, of R(x) = Draw the sign-chart and sketch the graph. x2 – 4x + 4 x2 – 1 For it's root, set x2 – 4x + 4 = 0, i.e. x = 2 (ord = 2). For VA, set Q(x) = 0, i.e. x2 – 1 = 0  x = ± 1. Both have order 1, so the sign changes at each of these values. x=2
  • 76.
    Graphs of RationalFunctions Example C: Find the roots, VA and HA, if any, of R(x) = Draw the sign-chart and sketch the graph. x2 – 4x + 4 x2 – 1 For it's root, set x2 – 4x + 4 = 0, i.e. x = 2 (ord = 2). For VA, set Q(x) = 0, i.e. x2 – 1 = 0  x = ± 1. Both have order 1, so the sign changes at each of these values. + – x=2 + +
  • 77.
    Graphs of RationalFunctions Example C: Find the roots, VA and HA, if any, of R(x) = Draw the sign-chart and sketch the graph. x2 – 4x + 4 x2 – 1 For it's root, set x2 – 4x + 4 = 0, i.e. x = 2 (ord = 2). For VA, set Q(x) = 0, i.e. x2 – 1 = 0  x = ± 1. Both have order 1, so the sign changes at each of these values. + + – x=2 + +
  • 78.
    Graphs of RationalFunctions Example C: Find the roots, VA and HA, if any, of R(x) = Draw the sign-chart and sketch the graph. x2 – 4x + 4 x2 – 1 For it's root, set x2 – 4x + 4 = 0, i.e. x = 2 (ord = 2). For VA, set Q(x) = 0, i.e. x2 – 1 = 0  x = ± 1. Both have order 1, so the sign changes at each of these values. + + – x=2 + +
  • 79.
    Graphs of RationalFunctions Example C: Find the roots, VA and HA, if any, of R(x) = Draw the sign-chart and sketch the graph. x2 – 4x + 4 x2 – 1 For it's root, set x2 – 4x + 4 = 0, i.e. x = 2 (ord = 2). For VA, set Q(x) = 0, i.e. x2 – 1 = 0  x = ± 1. Both have order 1, so the sign changes at each of these values. + + – x=2 + +
  • 80.
    Graphs of RationalFunctions Example C: Find the roots, VA and HA, if any, of R(x) = Draw the sign-chart and sketch the graph. x2 – 4x + 4 x2 – 1 For it's root, set x2 – 4x + 4 = 0, i.e. x = 2 (ord = 2). For VA, set Q(x) = 0, i.e. x2 – 1 = 0  x = ± 1. Both have order 1, so the sign changes at each of these values. + + – x=2 + +
  • 81.
    Graphs of RationalFunctions Example C: Find the roots, VA and HA, if any, of R(x) = Draw the sign-chart and sketch the graph. x2 – 4x + 4 x2 – 1 For it's root, set x2 – 4x + 4 = 0, i.e. x = 2 (ord = 2). For VA, set Q(x) = 0, i.e. x2 – 1 = 0  x = ± 1. Both have order 1, so the sign changes at each of these values. + + – x=2 + +
  • 82.
    Graphs of RationalFunctions Example C: Find the roots, VA and HA, if any, of R(x) = Draw the sign-chart and sketch the graph. x2 – 4x + 4 x2 – 1 For it's root, set x2 – 4x + 4 = 0, i.e. x = 2 (ord = 2). For VA, set Q(x) = 0, i.e. x2 – 1 = 0  x = ± 1. Both have order 1, so the sign changes at each of these values. As x±∞, R(x) resembles x2/x2 = 1, i.e. it has y = 1 as the HA. + + – x=2 + +
  • 83.
    Graphs of RationalFunctions Example C: Find the roots, VA and HA, if any, of R(x) = Draw the sign-chart and sketch the graph. x2 – 4x + 4 x2 – 1 For it's root, set x2 – 4x + 4 = 0, i.e. x = 2 (ord = 2). For VA, set Q(x) = 0, i.e. x2 – 1 = 0  x = ± 1. Both have order 1, so the sign changes at each of these values. As x±∞, R(x) resembles x2/x2 = 1, i.e. it has y = 1 as the HA. + + – x=2 + +
  • 84.
    Graphs of RationalFunctions Example C: Find the roots, VA and HA, if any, of R(x) = Draw the sign-chart and sketch the graph. x2 – 4x + 4 x2 – 1 For it's root, set x2 – 4x + 4 = 0, i.e. x = 2 (ord = 2). For VA, set Q(x) = 0, i.e. x2 – 1 = 0  x = ± 1. Both have order 1, so the sign changes at each of these values. As x±∞, R(x) resembles x2/x2 = 1, i.e. it has y = 1 as the HA. + + – x=2 + +
  • 85.
    Graphs of RationalFunctions Example C: Find the roots, VA and HA, if any, of R(x) = Draw the sign-chart and sketch the graph. x2 – 4x + 4 x2 – 1 For it's root, set x2 – 4x + 4 = 0, i.e. x = 2 (ord = 2). For VA, set Q(x) = 0, i.e. x2 – 1 = 0  x = ± 1. Both have order 1, so the sign changes at each of these values. As x±∞, R(x) resembles x2/x2 = 1, i.e. it has y = 1 as the HA. Note the graph stays above the HA to the far left, and below to the far right. + + – x=2 + +
  • 86.
    Graphs of RationalFunctions Example D: Find the roots, VA and HA, if any, of R(x) = Draw the sign-chart and sketch the graph. x2 – 2x – 3 x – 2
  • 87.
    Graphs of RationalFunctions Example D: Find the roots, VA and HA, if any, of R(x) = Draw the sign-chart and sketch the graph. x2 – 2x – 3 x – 2 Set x2 – 2x – 3 = 0  (x – 3)(x + 1) = 0 so x = -1, 3 are the roots of order 1.
  • 88.
    Graphs of RationalFunctions Example D: Find the roots, VA and HA, if any, of R(x) = Draw the sign-chart and sketch the graph. x2 – 2x – 3 x – 2 Set x2 – 2x – 3 = 0  (x – 3)(x + 1) = 0 so x = -1, 3 are the roots of order 1. For VA, set x – 2 = 0, i.e. x = 2.
  • 89.
    Graphs of RationalFunctions Example D: Find the roots, VA and HA, if any, of R(x) = Draw the sign-chart and sketch the graph. x2 – 2x – 3 x – 2 Set x2 – 2x – 3 = 0  (x – 3)(x + 1) = 0 so x = -1, 3 are the roots of order 1. For VA, set x – 2 = 0, i.e. x = 2. Do the sign-chart.
  • 90.
    Graphs of RationalFunctions Example D: Find the roots, VA and HA, if any, of R(x) = Draw the sign-chart and sketch the graph. x2 – 2x – 3 x – 2 Set x2 – 2x – 3 = 0  (x – 3)(x + 1) = 0 so x = -1, 3 are the roots of order 1. For VA, set x – 2 = 0, i.e. x = 2. x=3 Do the sign-chart. x= –1
  • 91.
    Graphs of RationalFunctions Example D: Find the roots, VA and HA, if any, of R(x) = Draw the sign-chart and sketch the graph. x2 – 2x – 3 x – 2 Set x2 – 2x – 3 = 0  (x – 3)(x + 1) = 0 so x = -1, 3 are the roots of order 1. For VA, set x – 2 = 0, i.e. x = 2. x=3 Do the sign-chart. + – + – x= –1
  • 92.
    Graphs of RationalFunctions Example D: Find the roots, VA and HA, if any, of R(x) = Draw the sign-chart and sketch the graph. x2 – 2x – 3 x – 2 Set x2 – 2x – 3 = 0  (x – 3)(x + 1) = 0 so x = -1, 3 are the roots of order 1. For VA, set x – 2 = 0, i.e. x = 2. Do the sign-chart. Construct the middle part of the graph. x=3 + – + – x= –1
  • 93.
    Graphs of RationalFunctions Example D: Find the roots, VA and HA, if any, of R(x) = Draw the sign-chart and sketch the graph. x2 – 2x – 3 x – 2 Set x2 – 2x – 3 = 0  (x – 3)(x + 1) = 0 so x = -1, 3 are the roots of order 1. For VA, set x – 2 = 0, i.e. x = 2. Do the sign-chart. Construct the middle part of the graph. x=3 + – + – x= –1
  • 94.
    Graphs of RationalFunctions Example D: Find the roots, VA and HA, if any, of R(x) = Draw the sign-chart and sketch the graph. x2 – 2x – 3 x – 2 Set x2 – 2x – 3 = 0  (x – 3)(x + 1) = 0 so x = -1, 3 are the roots of order 1. For VA, set x – 2 = 0, i.e. x = 2. Do the sign-chart. Construct the middle part of the graph. x=3 + – + – x= –1
  • 95.
    Graphs of RationalFunctions Example D: Find the roots, VA and HA, if any, of R(x) = Draw the sign-chart and sketch the graph. x2 – 2x – 3 x – 2 Set x2 – 2x – 3 = 0  (x – 3)(x + 1) = 0 so x = -1, 3 are the roots of order 1. For VA, set x – 2 = 0, i.e. x = 2. Do the sign-chart. Construct the middle part of the graph. x=3 + – + – x= –1
  • 96.
    Graphs of RationalFunctions Example D: Find the roots, VA and HA, if any, of R(x) = Draw the sign-chart and sketch the graph. x2 – 2x – 3 x – 2 Set x2 – 2x – 3 = 0  (x – 3)(x + 1) = 0 so x = -1, 3 are the roots of order 1. For VA, set x – 2 = 0, i.e. x = 2. Do the sign-chart. Construct the middle part of the graph. x=3 + – + – x= –1
  • 97.
    Graphs of RationalFunctions Example D: Find the roots, VA and HA, if any, of R(x) = Draw the sign-chart and sketch the graph. x2 – 2x – 3 x – 2 Set x2 – 2x – 3 = 0  (x – 3)(x + 1) = 0 so x = -1, 3 are the roots of order 1. For VA, set x – 2 = 0, i.e. x = 2. As x ±∞, the graph of R(x) resembles the graph of the quotient of the leading terms x2/x = x, or y = x. x=3 + – + – Do the sign-chart. Construct the middle part of the graph. x= –1
  • 98.
    Graphs of RationalFunctions Example D: Find the roots, VA and HA, if any, of R(x) = Draw the sign-chart and sketch the graph. x2 – 2x – 3 x – 2 Set x2 – 2x – 3 = 0  (x – 3)(x + 1) = 0 so x = -1, 3 are the roots of order 1. For VA, set x – 2 = 0, i.e. x = 2. As x ±∞, the graph of R(x) resembles the graph of the quotient of the leading terms x2/x = x, or y = x. Hence there is no HA. x=3 + – + – Do the sign-chart. Construct the middle part of the graph. x= –1
  • 99.
    Graphs of RationalFunctions Example D: Find the roots, VA and HA, if any, of R(x) = Draw the sign-chart and sketch the graph. x2 – 2x – 3 x – 2 Set x2 – 2x – 3 = 0  (x – 3)(x + 1) = 0 so x = -1, 3 are the roots of order 1. For VA, set x – 2 = 0, i.e. x = 2. As x ±∞, the graph of R(x) resembles the graph of the quotient of the leading terms x2/x = x, or y = x. Hence there is no HA. x=3 + – + – Do the sign-chart. Construct the middle part of the graph. x= –1
  • 100.
    Graphs of RationalFunctions Example D: Find the roots, VA and HA, if any, of R(x) = Draw the sign-chart and sketch the graph. x2 – 2x – 3 x – 2 Set x2 – 2x – 3 = 0  (x – 3)(x + 1) = 0 so x = -1, 3 are the roots of order 1. For VA, set x – 2 = 0, i.e. x = 2. As x ±∞, the graph of R(x) resembles the graph of the quotient of the leading terms x2/x = x, or y = x. Hence there is no HA. x=3 Do the sign-chart. Construct the middle part of the graph. + – + – x= –1
  • 101.
    Graphs of RationalFunctions http://www.lahc.edu/math/precalculus/math_260a.html From the last few sections, we see the importance of the factored form of polynomial formulas. This factoring problem is the same as the problem of finding roots of polynomials. In the next chapter, we give the possible (completely) factored form of real polynomials. This result is called the “Fundamental Theorem of Algebra”.
  • 102.
    Graphs of RationalFunctions + + + + The graphs along poles. Even-order Poles Odd-order Poles Even-order Roots Odd-order Roots The graphs around a roots. (See 2.9.) order = 3, 5, 7…
  • 103.
    Graphs of FactorableRational Functions Exercise A. Following are the sign charts of simplified factorable rational function with their roots, poles, and their orders given. a. Write down a (any) rational formula in the simplified factored form of any given sign chart. b. Sketch its graphs (its “mid-section”). –1 1. ord=1 ord=1 1 – – – –1 2. ord=2 ord=1 1 + + + –1 3. ord=1 ord=1 1 – – – –1 4. ord=2 ord=2 1 + + + –1 7. 1 3 –1 8. ord=1 ord=2 1 3 ord=2 + + – – = root = pole (asymptote) ord=2 ord=1 ord=1 –1 5. 1 3 –1 6. ord=1 ord=2 1 3 ord=2 + + – – ord=2 ord=1 ord=1
  • 104.
    B. For eachof the following rational functions, identify its roots, poles and their orders. a. Make a sign charts (as in A). b. Determine its horizontal behavior. Sketch its graph. 1. R(x) = 2. x – 3 x + 2 2 R(x) = –1 5. R(x) = 6. x – 3 x + 2 x – 3 R(x) = x + 2 3. R(x) = 4. 5 – x x + 1 –2 R(x) = 1 9. (x – 3)2 R(x) = x – 2 7. R(x) = 8. 3 – 2x x + 2 –3x R(x) = x 10. (x + 3)2 R(x) = x + 2 11. (x – 3)(x + 3) R(x) = x – 2 12. R(x) = (x – 3)(x + 3) x – 5 Graphs of Factorable Rational Functions
  • 105.
    B. For eachof the following rational functions, identify its roots, poles and their orders. a. Make a sign charts (as in A). b. Determine its horizontal behavior. Sketch its graph. 13. (x – 2)2 R(x) = 14. (x – 4)(x + 5) R(x) = 15. (x – 3)(x + 3) R(x) = 16. R(x) = (x – 3)(x + 3) (x – 3)(x + 3) (x + 2)2 (x + 3)(x + 5) (2x – 1)(x + 1) (x – 4)(x + 5) 17. x(x – 3)(x + 3) R(x) = 18. R(x) = (x – 3)2(x + 3) (2x – 1)(x + 1) Graphs of Factorable Rational Functions
  • 106.
    (Answers to oddproblems) Exercise A. 1. 3. x – 1 x + 1 (x + 1)(x – 1) 1 – 5. (x + 1)2 – (x – 1)(x – 3) 7. (x + 1)2(x – 3) (x – 1) Graphs of Factorable Rational Functions
  • 107.
    Exercise B 1. ord=1 –2 ++ + – – – 3. ord=1 –1 + + + – – – 5. –2 ord=1 ord=1 3 + + + + – – – 7. –2 ord=1 ord=1 0 + + + – – – – 9. –3 ord=1 ord=2 2 + + + – – – – – Graphs of Factorable Rational Functions
  • 108.
    11. –3 ord=1 ord=1 2 + + –– – – – 3 ord=1 + + 13. –3 ord=1 ord=1 2 + + – – – 3 ord=1 + + – – – 15. 17. –5 ord=1 ord=1 -3 + + – – – ord=1 + + + + ord=1 3 – – – 4 –5 ord=1 ord=1 -3 – – ord=1 + + + + ord=1 3 – – 4 – – ord=1 0 Graphs of Factorable Rational Functions