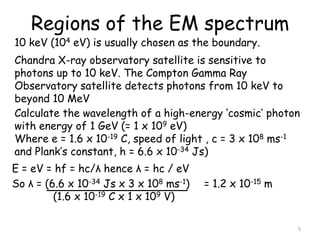
1. Spectra provide insight into the structure of atoms and distant astronomical objects. The electromagnetic spectrum ranges from gamma rays to radio waves.
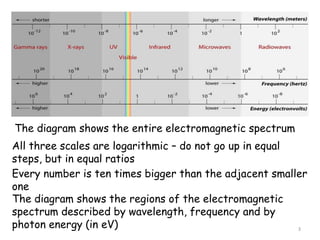
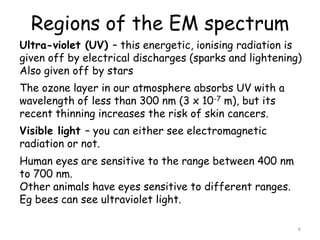
2. The diagram shows the electromagnetic spectrum divided into regions by wavelength, frequency, and photon energy. There are no abrupt boundaries between regions.
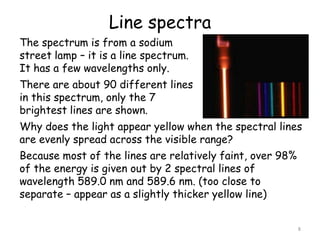
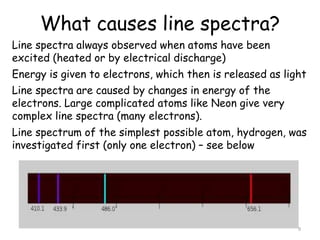
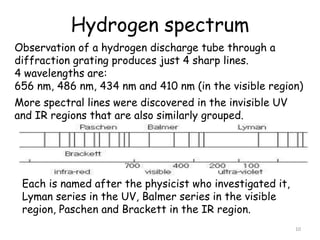
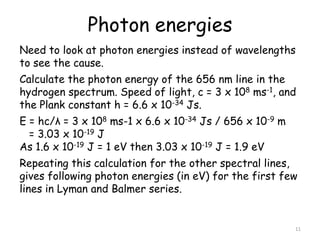
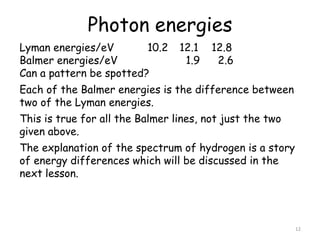
3. Line spectra occur when atoms are excited and energy is released as light at specific wavelengths. The hydrogen spectrum contains distinct lines that are explained by differences in electron energy levels.


![Structure Of Atom[1] Monika Khurana](https://cdn.slidesharecdn.com/ss_thumbnails/structure-of-atom1-monika-khurana-1193579725970972-1-thumbnail.jpg?width=640&height=640&fit=bounds)


