
Recommended
More Related Content
What's hot
What's hot (20)
Similar to Chapter 3 Arrangement of Electrons in the Atom
Similar to Chapter 3 Arrangement of Electrons in the Atom (20)
Recently uploaded
Recently uploaded (20)
Chapter 3 Arrangement of Electrons in the Atom
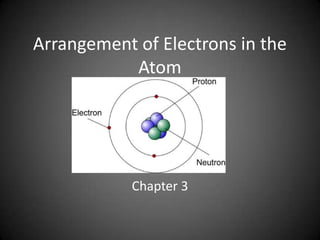
- 1. Arrangement of Electrons in the Atom Chapter 3
- 2. Location of the Electron The next question to be answered by atomic scientists concerned the location of the electrons! Ernest Rutherford had a proposal for this!
- 3. Ernest Rutherford proposed that the electrons could orbit the nucleus like the planets orbit the sun. • This explanation however defied the laws of physics • Electrons revolving around the nucleus would lose energy and would spiral into the nucleus
- 4. Rutherford’s Explanation was obviously wrong and another model of the arrangement of electrons had to be devised It was a young Danish Physicist called Niels Bohr who provided an insight into the arrangement of Electrons in the Atom that helped to solve the problem
- 5. Bohr’s Study of Spectra • Bohr developed his theory about the arrangement of electrons in atoms by studying what were known as the Spectra of Elements
- 6. White Light • White light when passed through a prism is broken up into an array of colours • Such an array is called a spectrum • Thus the spectrum is the spread of colours that come out of the prism
- 7. Continuous Spectrum • This spread or array of colours is known as a continuous spectrum or rainbow • Rainbows are formed when the water droplets in the sky act as prisms and separate the sunlight into its colours
- 8. But what happens if we use a type of light that is not made from white light but only part of it? • If a glass tube is filled with Hydrogen at low pressure and an electric current is passed through it, a spectrum is produced that is different to that given by white light
- 9. A Line Spectrum for Hydrogen • Instead of seeing a Continuous spectrum of all the colours of the rainbow Bohr saw a series of narrow lines
- 10. Line or Emission Spectrum • Since it consists of lines it is called a Line Spectrum to distinguish it from a Continuous Spectrum ( or Rainbow) produced using white light. • It is more accurately called an Emission Spectrum as it has been emitted when the electric current was passed through the hydrogen gas
- 11. Emission Spectra of Different Elements • When the Hydrogen in the discharge tube was replaced by other elements like Sodium and Mercury it was found that these elements also produced spectra. • Each of these spectra were unique to that element
- 12. Emission Spectra of Different Elements
- 13. Each Element has a unique Emission Spectrum • This meant that • Elements present in the examining the spectrum sample of salt being produced from light burnt could then be from a burning sample identified by comparing of a salt should give you them to known spectra a unique pattern of stored on a computer lines database. • This pattern could then be compared to known spectra
- 14. Spectra of most elements of the periodic table • http://jersey.uoregon.edu/vlab/elements/Ele ments.html
- 15. To Study Emission Spectra using a Spectrometer • Experiment 3.1 • Page 12 • Method A and Method B • To be written up properly following guidelines as shown for homework
- 16. Flame Tests • Experiment 3.2 Page 13 • When salts of certain metals are heated in a bunsen burner’s flame the colours obtained can be used to identify the metals in unknown compounds
- 17. Results for Flame Test • Metal Present in the Colour Salt being burnt • Lithium • Crimson • Potassium • Lilac • Barium • Green • Strontium • Red • Copper • Blue-green • Sodium • Yellow
- 19. But what has the study of spectra got to do with the structure of the atom?
- 20. Niels Bohr’s Insight Bohr realised that any model of the Atom needed to explain two observations 1) Why the Emission Spectra of the Elements are Line Spectra rather than Continuous Spectra, 2) Why the Emission Spectrum of each element is unique to that element
- 21. Bohr’s Explanation for the Emission Line Spectrum of Hydrogen 1) Electrons revolve around the nucleus in fixed paths called Orbits or Energy levels 2) Electrons in any one orbit have a fixed or quantised amount of energy 3) Electrons in an energy level do not gain or lose energy 4) When atoms absorb energy electrons jump from a lower energy level to a higher energy level 5) At these higher levels the electrons are less stable and do not remain there for long but fall back down 6) When an electron falls back to any energy level it loses energy in the form of light
- 22. These photons of light because they have a fixed amount of energy also have a specific frequency and thus colour
- 23. Bohr represented each energy level by the letter n He called the lowest energy level the n = 1 level The next highest the n = 2 level and so on….
- 24. Hydrogen’s electron is normally found at the n = 1 level This electron is said to be in the ground state (or unexcited state) When heated and after absorbing energy it jumps to a higher level or is said to have an excited state
- 25. After remaining a short time it drops down to a lower energy level emitting a definite amount of energy This definite energy is equal to the difference between the two energy levels This definite amount of energy appears as a line of a particular colour in the emission spectrum Each colour corresponds to a particular wavelength or frequency of light
- 26. Spectra of most elements of the periodic table • http://jersey.uoregon.edu/vlab/elements/Ele ments.html
- 27. The Types of Light or Energy Transitions (or Emission Lines) produced ranged from Infra-Red to Visible to Ultra-Violet Light So some are visible and others are invisible.
- 28. A Mathematical relationship exists between the energy emitted and frequency of the light E = hf • E is the amount of energy emitted from the atom • h is just a number called Planck’s constant • f is the frequency or wavelength of the light emitted [Shown as ∆E = hv in diagrams above where v = wavelength]
- 29. Each definite amount of energy emitted gives rise to a line in the emission spectrum This can be calculated from the equation E2 - E1 = hf where E represents the n energy level Since only definite amounts of energy are emitted this implies that electrons can occupy only definite energy levels Therefore energy levels must exist in the atom
- 30. Bohr’s Theory • Bohr examined the spectrum of hydrogen and measured the wavelengths of the visible light seen through the spectroscope • He compared these values to those calculated using his theory and found them to be an exact match
- 31. Electromagnetic Spectrum He predicted the existence of other series of lines in the ultra-violet and infra-red regions of the spectrum both of which are invisible
- 32. An Element’s Unique Emission Spectrum • Bohr’s Theory also explained why each electron had its own unique emission spectrum. • Since each element has its own particular number of electrons then there will be different numbers and types of transitions for each element, thus giving rise to a different emission line spectrum in each case.
- 33. Emission Series Lymann Invisible - Ultra-violet Balmer Visible Paschen Invisible - Infra-Red
- 34. Absorption Spectra • There is another type of spectrum apart from the emission spectrum • The Absorption spectrum is obtained when white light is passed through a gaseous sample of an element and analysed • It is found that the light coming out has certain wavelengths missing or dark lines present
- 35. Natural Sunlight’s Absorption Spectrum
- 36. Emission vs. Absorption Spectra Emission Absorption • Produced when a hot gas •Produced when white light is glows giving off light shone through a tube of gas which absorbs some of the light
- 37. Emission vs. Absorption Spectrums Emission Spectrum Absorption Spectrum • Consists of coloured lines • Consists of dark lines against a dark background against a coloured background Atomic Absorption Spectrometry is therefore a very useful analytical tool used by chemists to detect the presence of certain elements and to measure the concentrations of these elements
- 38. Energy Sub-levels • As time went by the study of spectra became ever more sophisticated • Scientists now found that many lines which appeared to be one were in fact made up several lines close together • For example what appeared to be a single yellow line in Sodium’s emission spectrum was found in fact to consist of two yellow lines very close together
- 39. Sodium’s Spectrum Full Spectrum showing a single yellow line Zooming in on the yellow line
- 40. Energy Sub-Levels • These two lines could not be due to electrons dropping to two different energy levels as this would give rise to lines much further apart • In order to explain this observation scientist proposed that - Each main energy level except the first was made up of a number of sublevels all of which were close in energy
- 41. Energy Sub-Levels It was discovered that the number of sub- levels was the same as the value of n for the main energy level So the n =2 main energy level had 2 sub-levels The n = 3 main energy level had 3 sub-levels And the n = 4 main energy level had 4 sub-levels
- 42. S, p, d & f sub-levels These sub-levels were now labelled The sub-level of lowest energy being called the s sub-level The next highest called the p sub-level The one above that as the d sub-level And the one of highest energy was called the f sub-level
- 43. Wave Nature of the Electron • Bohr’s Theory works very well for hydrogen but when his theory is applied to atoms with more than one electron, it fails to account or many of the lines in the emission spectra of these atoms • So for other elements
- 44. Louis de Broglie In 1924 a French Scientist called Louis Le Broglie suggested that all moving particles had a wave motion associated with them This was called a ‘Wave Particle Duality’
- 46. Werner Heisenberg If the electron has a wave motion it clearly is not travelling along a precise path or energy level predicted by Bohr A German Physicist tackled this problem mathematically and put forward a very famous principle called Heisenberg Uncertainty Principle
- 47. Heisenberg Uncertainty Principle • “It is impossible to measure at the same time both the velocity and the position of the electron”
- 48. Improving Bohr’s Idea • Bohr’s Model saw electrons moving with a certain speed in orbits at fixed distances from the nucleus. • Heisenberg stated that you cannot say this about the electron as you cannot measure both the speed and the distance from the nucleus at the same time • This led to scientists to change Bohr’s idea to the probability of finding an electron at a particular position inside the atom and a new picture of the atom
- 49. Atomic Orbitals • Imagine taking hundreds of photos of an atom of hydrogen and its electron spinning around it and combining them all together. You would get a picture like the one shown below