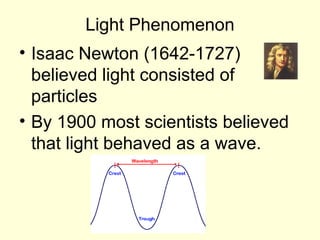
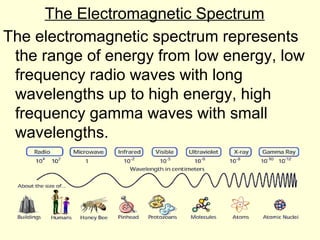
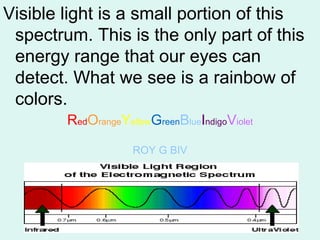
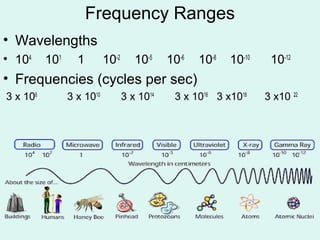
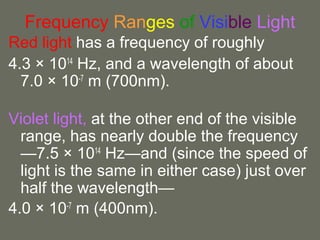
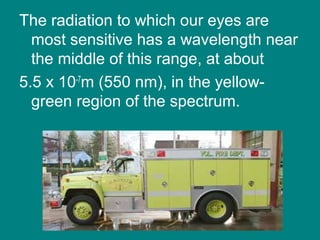
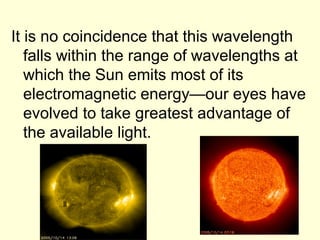
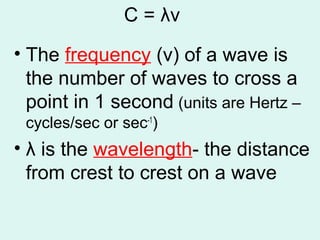
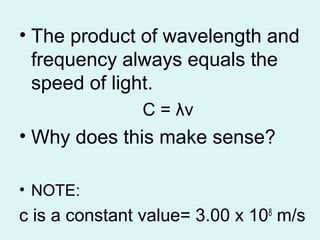
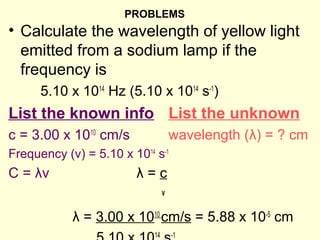
SlideShare a Scribd company logo
1 of 26
Light
and t he
Elect romagnet ic
Spect rum
Light Phenomenon
• Isaac Newton (1642-1727)
believed light consisted of
particles
• By 1900 most scientists believed
that light behaved as a wave.
The Electromagnetic Spectrum
The electromagnetic spectrum represents
the range of energy from low energy, low
frequency radio waves with long
wavelengths up to high energy, high
frequency gamma waves with small
wavelengths.
Visible light is a small portion of this
spectrum. This is the only part of this
energy range that our eyes can
detect. What we see is a rainbow of
colors.
RedOrangeYellowGreenBlueIndigoViolet
ROY G BIV
Frequency Ranges
• Wavelengths
• 104
101
1 10-2
10-5
10-6
10-8
10-10
10-12
• Frequencies (cycles per sec)
3 x 10⁶
3 x 10¹⁰
3 x 10¹⁴
3 x 10¹⁶
3 x10¹⁸
3 x10 22
Frequency Ranges of Visible Light
Red light has a frequency of roughly
4.3 × 10¹⁴
Hz, and a wavelength of about
7.0 × 10⁻⁷
m (700nm).
Violet light, at the other end of the visible
range, has nearly double the frequency
—7.5 × 10¹⁴
Hz—and (since the speed of
light is the same in either case) just over
half the wavelength—
4.0 × 10⁻⁷
m (400nm).
The radiation to which our eyes are
most sensitive has a wavelength near
the middle of this range, at about
5.5 x 10⁻⁷
m (550 nm), in the yellow-
green region of the spectrum.
It is no coincidence that this wavelength
falls within the range of wavelengths at
which the Sun emits most of its
electromagnetic energy—our eyes have
evolved to take greatest advantage of
the available light.
C = λν
• The frequency (v) of a wave is
the number of waves to cross a
point in 1 second (units are Hertz –
cycles/sec or sec-1
)
• λ is the wavelength- the distance
from crest to crest on a wave
• The product of wavelength and
frequency always equals the
speed of light.
C = λν
• Why does this make sense?
• NOTE:
c is a constant value= 3.00 x 10⁸
m/s
• Calculate the wavelength of yellow light
emitted from a sodium lamp if the
frequency is
5.10 x 10¹⁴
Hz (5.10 x 10¹⁴
s-1
)
List the known info List the unknown
c = 3.00 x 10¹⁰
cm/s wavelength (λ) = ? cm
Frequency (v) = 5.10 x 10¹⁴
s-1
C = λv λ = c
v
λ = 3.00 x 10¹⁰
cm/s = 5.88 x 10⁻⁵
cm
14 -1
PROBLEMS
YOUR TURN
1- What is the wavelength of radiation
with a frequency of 1.50 x 10¹³
s-1
?
2- What frequency is radiation with a
wavelength of 5.00 x 10⁻⁶
cm? In what
region of the electromagnetic
spectrum is this radiation?
• The colors we see in objects are the
colors that are reflected, all other colors
are absorbed. A red t-shirt appears red
because red is reflected to our eyes and
the other colors are absorbed.
• When all colors are being reflected we see
white light (white isn’t really a color)
• When all wavelengths of light are being
absorbed we see black (black also, isn’t
really a color)
• A false-color image is made when the
satellite records data about brightness
of the light waves reflecting off the
Earth's surface.
• These brightnesses are represented by
numerical values - and these values can
then be color-coded. It is just like painting
by number.
• The next slide shows a true color vs. false
color image of the planet Uranus. Satellite
images can be gathered in true color
(what our eyes would see) and false color
(to make it look better)
• The true color image on left is how
our eyes would see it.
• The false color image is enhanced to
bring out subtle details to make it
easier to study Uranus’ cloud
structure.
Atoms and Light
• The movement of electrons inside of
atoms produces light and other
electromagnetic radiation.
• Sunlight produces every color in the
rainbow but…
• Each element gives off only certain
frequencies of light, called spectral lines.
In effect each element has its own
signature of spectral lines allowing us to
identify which element we have or what
stars are made of.
Below is a picture of the spectral lines
given off by hydrogen. Note there are 3
different frequencies.
• The emission spectra makes it
possible to identify inaccessible
substances. Most of our knowledge of
the universe comes from studying the
emission spectra of stars.
• Below is the spectra of a few more
elements.
Helium
• Neon
• Argon
• In a star, there are many elements
present. The way we can tell which are
there is to look at the spectrum of the
star.
• From spectral lines astronomers can
determine not only the element, but the
temperature and density of that element
in the star
• Emission lines can also tell us about the
magnetic field of the star. The width of
the line can tell us how fast the material
is moving
• If the lines shift back and forth, it
means that the star may be orbiting
another star - the spectrum will give
the information to estimate the mass
and size of the star system and the
companion star.
• Around a compact object (black hole,
neutron star), the material is heated to the
point it gives off X-rays, and the material
falls onto the black hole or neutron star.
By looking at the spectrum of X-rays being
emitted by that object and its surrounding
disk, we can learn about these objects.
• Albert Einstein returned to the idea that
light existed as particles. He proposed that
light could be described as quanta of
energy that behave as if they were
particles. Light quanta are called
photons.
• While it was difficult for scientists to
believe (they can be stubborn) it did
explain the photoelectric effect
(previously a mystery)
• A certain frequency has to be achieved or the effect
does not work
The photoelectric effect – When light shines
on metals, electrons (photoelectrons) are
ejected from their surface.
Red light will not cause
electrons to eject!
• The photoelectric effect has practical
applications in photoelectrical cells used
for solar powered cars, and solar powered
calculators.

More Related Content

What's hot

Electromagnetic Spectrum
Electromagnetic SpectrumElectromagnetic Spectrum
Electromagnetic Spectrumchooyz
 
The electromagnetic spectrum
The electromagnetic spectrumThe electromagnetic spectrum
The electromagnetic spectrumAshley Dyer
 
electromagnetic spectrum & its uses
 electromagnetic spectrum & its uses  electromagnetic spectrum & its uses
electromagnetic spectrum & its uses Tarun Joshi
 
Electromagnetic spectrum
Electromagnetic spectrumElectromagnetic spectrum
Electromagnetic spectrumRileyAntler
 
Electromagnetic spectrum
Electromagnetic spectrumElectromagnetic spectrum
Electromagnetic spectrumSamia Dogar
 
Electromagnetic spectrum
Electromagnetic spectrumElectromagnetic spectrum
Electromagnetic spectrumBrandi
 
Electromagnetic spectrum
Electromagnetic spectrumElectromagnetic spectrum
Electromagnetic spectrumryedevaught
 
3 electromagnetic radiation
3 electromagnetic radiation3 electromagnetic radiation
3 electromagnetic radiationValerie Evans
 
Electromagnetic spectrum
Electromagnetic spectrumElectromagnetic spectrum
Electromagnetic spectrumSabrina Medel
 
F:\Electromagnetic Spectrum
F:\Electromagnetic SpectrumF:\Electromagnetic Spectrum
F:\Electromagnetic Spectrumjc_elprofe
 
The Electromagnetic Spectrum
The Electromagnetic SpectrumThe Electromagnetic Spectrum
The Electromagnetic SpectrumJan Parker
 
Electromagnetic spectrum #1
Electromagnetic spectrum #1Electromagnetic spectrum #1
Electromagnetic spectrum #1mrsjudson
 
Electromagnetic radiation
Electromagnetic radiationElectromagnetic radiation
Electromagnetic radiationSiyavula
 
Electromagnetic spectrum & laws of radiation and its application in physiothe...
Electromagnetic spectrum & laws of radiation and its application in physiothe...Electromagnetic spectrum & laws of radiation and its application in physiothe...
Electromagnetic spectrum & laws of radiation and its application in physiothe...Dr. Rushikesh K. Joshi, PT
 
Electromagnetic Waves
Electromagnetic WavesElectromagnetic Waves
Electromagnetic WavesJoan Shinkle
 
Electromagnetic Spectrum
Electromagnetic SpectrumElectromagnetic Spectrum
Electromagnetic SpectrumSamia Dogar
 
Electromagnetic waves
Electromagnetic wavesElectromagnetic waves
Electromagnetic wavesKANNAN
 

What's hot (20)

Electromagnetic Spectrum
Electromagnetic SpectrumElectromagnetic Spectrum
Electromagnetic Spectrum
 
The electromagnetic spectrum
The electromagnetic spectrumThe electromagnetic spectrum
The electromagnetic spectrum
 
electromagnetic spectrum & its uses
 electromagnetic spectrum & its uses  electromagnetic spectrum & its uses
electromagnetic spectrum & its uses
 
Electromagnetic spectrum
Electromagnetic spectrumElectromagnetic spectrum
Electromagnetic spectrum
 
Electromagnetic spectrum
Electromagnetic spectrumElectromagnetic spectrum
Electromagnetic spectrum
 
Electromagnetic spectrum
Electromagnetic spectrumElectromagnetic spectrum
Electromagnetic spectrum
 
Electromagnetic spectrum
Electromagnetic spectrumElectromagnetic spectrum
Electromagnetic spectrum
 
3 electromagnetic radiation
3 electromagnetic radiation3 electromagnetic radiation
3 electromagnetic radiation
 
Electromagnetic spectrum
Electromagnetic spectrumElectromagnetic spectrum
Electromagnetic spectrum
 
Electromagnetic spectrum
Electromagnetic spectrumElectromagnetic spectrum
Electromagnetic spectrum
 
F:\Electromagnetic Spectrum
F:\Electromagnetic SpectrumF:\Electromagnetic Spectrum
F:\Electromagnetic Spectrum
 
The Electromagnetic Spectrum
The Electromagnetic SpectrumThe Electromagnetic Spectrum
The Electromagnetic Spectrum
 
Electromagnetic spectrum #1
Electromagnetic spectrum #1Electromagnetic spectrum #1
Electromagnetic spectrum #1
 
Electromagnetic radiation
Electromagnetic radiationElectromagnetic radiation
Electromagnetic radiation
 
Electromagnetic spectrum & laws of radiation and its application in physiothe...
Electromagnetic spectrum & laws of radiation and its application in physiothe...Electromagnetic spectrum & laws of radiation and its application in physiothe...
Electromagnetic spectrum & laws of radiation and its application in physiothe...
 
3 EM SPECTRUM
3 EM SPECTRUM3 EM SPECTRUM
3 EM SPECTRUM
 
Electro magnetic wave(bpp)
Electro magnetic wave(bpp)Electro magnetic wave(bpp)
Electro magnetic wave(bpp)
 
Electromagnetic Waves
Electromagnetic WavesElectromagnetic Waves
Electromagnetic Waves
 
Electromagnetic Spectrum
Electromagnetic SpectrumElectromagnetic Spectrum
Electromagnetic Spectrum
 
Electromagnetic waves
Electromagnetic wavesElectromagnetic waves
Electromagnetic waves
 

Similar to Light and em spectrum

Electromagnetis Spectrum - Good.ppt
Electromagnetis Spectrum - Good.pptElectromagnetis Spectrum - Good.ppt
Electromagnetis Spectrum - Good.pptKathleenSaldon
 
9_2020_05_07!07_18_38_AM.pdf
9_2020_05_07!07_18_38_AM.pdf9_2020_05_07!07_18_38_AM.pdf
9_2020_05_07!07_18_38_AM.pdfZuniRehman
 
Electromagnetic spectrum_lecture 1.pptx
Electromagnetic spectrum_lecture 1.pptxElectromagnetic spectrum_lecture 1.pptx
Electromagnetic spectrum_lecture 1.pptxmichelle894942
 
Electromagnetic spectrum
Electromagnetic spectrumElectromagnetic spectrum
Electromagnetic spectrumHASSAN Orakzai
 
Electromagnetic spectrum
Electromagnetic spectrumElectromagnetic spectrum
Electromagnetic spectrumHASSAN Orakzai
 
IR Spectroscopy - Sudheerkumar Kamarapu, M. Pharmacy Lecture pdf
IR Spectroscopy - Sudheerkumar Kamarapu, M. Pharmacy Lecture pdfIR Spectroscopy - Sudheerkumar Kamarapu, M. Pharmacy Lecture pdf
IR Spectroscopy - Sudheerkumar Kamarapu, M. Pharmacy Lecture pdfDr. Sudheer Kumar Kamarapu
 
Basics of radiation and production of x rays
Basics of radiation and production of x raysBasics of radiation and production of x rays
Basics of radiation and production of x raysdbc9427
 
Principles of Remote Sensing
Principles of Remote Sensing Principles of Remote Sensing
Principles of Remote Sensing Ariful Islam
 
Remote sensing
Remote sensingRemote sensing
Remote sensingSiva Rajah
 
2. Introduction to Spectroscopy 2022.pptx
2. Introduction to Spectroscopy 2022.pptx2. Introduction to Spectroscopy 2022.pptx
2. Introduction to Spectroscopy 2022.pptxWilliamkambi
 
laser-ppt.ppt
laser-ppt.pptlaser-ppt.ppt
laser-ppt.pptrooogh915
 

Similar to Light and em spectrum (20)

Electromagnetis Spectrum - Good.ppt
Electromagnetis Spectrum - Good.pptElectromagnetis Spectrum - Good.ppt
Electromagnetis Spectrum - Good.ppt
 
6 b0a22e9a7c5461d8c11bc0ef0942658
6 b0a22e9a7c5461d8c11bc0ef09426586 b0a22e9a7c5461d8c11bc0ef0942658
6 b0a22e9a7c5461d8c11bc0ef0942658
 
Light
LightLight
Light
 
Electromagnetic radiation
Electromagnetic radiationElectromagnetic radiation
Electromagnetic radiation
 
9_2020_05_07!07_18_38_AM.pdf
9_2020_05_07!07_18_38_AM.pdf9_2020_05_07!07_18_38_AM.pdf
9_2020_05_07!07_18_38_AM.pdf
 
properties of light
properties of lightproperties of light
properties of light
 
EMRadiation.ppt
EMRadiation.pptEMRadiation.ppt
EMRadiation.ppt
 
Electromagnetic spectrum_lecture 1.pptx
Electromagnetic spectrum_lecture 1.pptxElectromagnetic spectrum_lecture 1.pptx
Electromagnetic spectrum_lecture 1.pptx
 
Electromagnetic spectrum
Electromagnetic spectrumElectromagnetic spectrum
Electromagnetic spectrum
 
Electromagnetic spectrum
Electromagnetic spectrumElectromagnetic spectrum
Electromagnetic spectrum
 
AtomII.ppt
AtomII.pptAtomII.ppt
AtomII.ppt
 
IR Spectroscopy - Sudheerkumar Kamarapu, M. Pharmacy Lecture pdf
IR Spectroscopy - Sudheerkumar Kamarapu, M. Pharmacy Lecture pdfIR Spectroscopy - Sudheerkumar Kamarapu, M. Pharmacy Lecture pdf
IR Spectroscopy - Sudheerkumar Kamarapu, M. Pharmacy Lecture pdf
 
Basics of radiation and production of x rays
Basics of radiation and production of x raysBasics of radiation and production of x rays
Basics of radiation and production of x rays
 
Strawberry model2new
Strawberry model2newStrawberry model2new
Strawberry model2new
 
Principles of Remote Sensing
Principles of Remote Sensing Principles of Remote Sensing
Principles of Remote Sensing
 
Remote sensing
Remote sensingRemote sensing
Remote sensing
 
LIGHT.pptx
LIGHT.pptxLIGHT.pptx
LIGHT.pptx
 
2. Introduction to Spectroscopy 2022.pptx
2. Introduction to Spectroscopy 2022.pptx2. Introduction to Spectroscopy 2022.pptx
2. Introduction to Spectroscopy 2022.pptx
 
Light
LightLight
Light
 
laser-ppt.ppt
laser-ppt.pptlaser-ppt.ppt
laser-ppt.ppt
 

Light and em spectrum

  • 1. Light and t he Elect romagnet ic Spect rum
  • 2. Light Phenomenon • Isaac Newton (1642-1727) believed light consisted of particles • By 1900 most scientists believed that light behaved as a wave.
  • 3. The Electromagnetic Spectrum The electromagnetic spectrum represents the range of energy from low energy, low frequency radio waves with long wavelengths up to high energy, high frequency gamma waves with small wavelengths.
  • 4. Visible light is a small portion of this spectrum. This is the only part of this energy range that our eyes can detect. What we see is a rainbow of colors. RedOrangeYellowGreenBlueIndigoViolet ROY G BIV
  • 5. Frequency Ranges • Wavelengths • 104 101 1 10-2 10-5 10-6 10-8 10-10 10-12 • Frequencies (cycles per sec) 3 x 10⁶ 3 x 10¹⁰ 3 x 10¹⁴ 3 x 10¹⁶ 3 x10¹⁸ 3 x10 22
  • 6. Frequency Ranges of Visible Light Red light has a frequency of roughly 4.3 × 10¹⁴ Hz, and a wavelength of about 7.0 × 10⁻⁷ m (700nm). Violet light, at the other end of the visible range, has nearly double the frequency —7.5 × 10¹⁴ Hz—and (since the speed of light is the same in either case) just over half the wavelength— 4.0 × 10⁻⁷ m (400nm).
  • 7. The radiation to which our eyes are most sensitive has a wavelength near the middle of this range, at about 5.5 x 10⁻⁷ m (550 nm), in the yellow- green region of the spectrum.
  • 8. It is no coincidence that this wavelength falls within the range of wavelengths at which the Sun emits most of its electromagnetic energy—our eyes have evolved to take greatest advantage of the available light.
  • 9. C = λν • The frequency (v) of a wave is the number of waves to cross a point in 1 second (units are Hertz – cycles/sec or sec-1 ) • λ is the wavelength- the distance from crest to crest on a wave
  • 10. • The product of wavelength and frequency always equals the speed of light. C = λν • Why does this make sense? • NOTE: c is a constant value= 3.00 x 10⁸ m/s
  • 11. • Calculate the wavelength of yellow light emitted from a sodium lamp if the frequency is 5.10 x 10¹⁴ Hz (5.10 x 10¹⁴ s-1 ) List the known info List the unknown c = 3.00 x 1010 cm/s wavelength (λ) = ? cm Frequency (v) = 5.10 x 10¹⁴ s-1 C = λv λ = c v λ = 3.00 x 1010 cm/s = 5.88 x 10⁻⁵ cm 14 -1 PROBLEMS
  • 12. YOUR TURN 1- What is the wavelength of radiation with a frequency of 1.50 x 10¹³ s-1 ? 2- What frequency is radiation with a wavelength of 5.00 x 10⁻⁶ cm? In what region of the electromagnetic spectrum is this radiation?
  • 13. • The colors we see in objects are the colors that are reflected, all other colors are absorbed. A red t-shirt appears red because red is reflected to our eyes and the other colors are absorbed. • When all colors are being reflected we see white light (white isn’t really a color)
  • 14. • When all wavelengths of light are being absorbed we see black (black also, isn’t really a color) • A false-color image is made when the satellite records data about brightness of the light waves reflecting off the Earth's surface.
  • 15. • These brightnesses are represented by numerical values - and these values can then be color-coded. It is just like painting by number. • The next slide shows a true color vs. false color image of the planet Uranus. Satellite images can be gathered in true color (what our eyes would see) and false color (to make it look better)
  • 16. • The true color image on left is how our eyes would see it. • The false color image is enhanced to bring out subtle details to make it easier to study Uranus’ cloud structure.
  • 17. Atoms and Light • The movement of electrons inside of atoms produces light and other electromagnetic radiation. • Sunlight produces every color in the rainbow but… • Each element gives off only certain frequencies of light, called spectral lines. In effect each element has its own signature of spectral lines allowing us to identify which element we have or what stars are made of.
  • 18. Below is a picture of the spectral lines given off by hydrogen. Note there are 3 different frequencies.
  • 19. • The emission spectra makes it possible to identify inaccessible substances. Most of our knowledge of the universe comes from studying the emission spectra of stars. • Below is the spectra of a few more elements. Helium
  • 21. • In a star, there are many elements present. The way we can tell which are there is to look at the spectrum of the star. • From spectral lines astronomers can determine not only the element, but the temperature and density of that element in the star • Emission lines can also tell us about the magnetic field of the star. The width of the line can tell us how fast the material is moving
  • 22. • If the lines shift back and forth, it means that the star may be orbiting another star - the spectrum will give the information to estimate the mass and size of the star system and the companion star.
  • 23. • Around a compact object (black hole, neutron star), the material is heated to the point it gives off X-rays, and the material falls onto the black hole or neutron star. By looking at the spectrum of X-rays being emitted by that object and its surrounding disk, we can learn about these objects.
  • 24. • Albert Einstein returned to the idea that light existed as particles. He proposed that light could be described as quanta of energy that behave as if they were particles. Light quanta are called photons. • While it was difficult for scientists to believe (they can be stubborn) it did explain the photoelectric effect (previously a mystery)
  • 25. • A certain frequency has to be achieved or the effect does not work The photoelectric effect – When light shines on metals, electrons (photoelectrons) are ejected from their surface. Red light will not cause electrons to eject!
  • 26. • The photoelectric effect has practical applications in photoelectrical cells used for solar powered cars, and solar powered calculators.