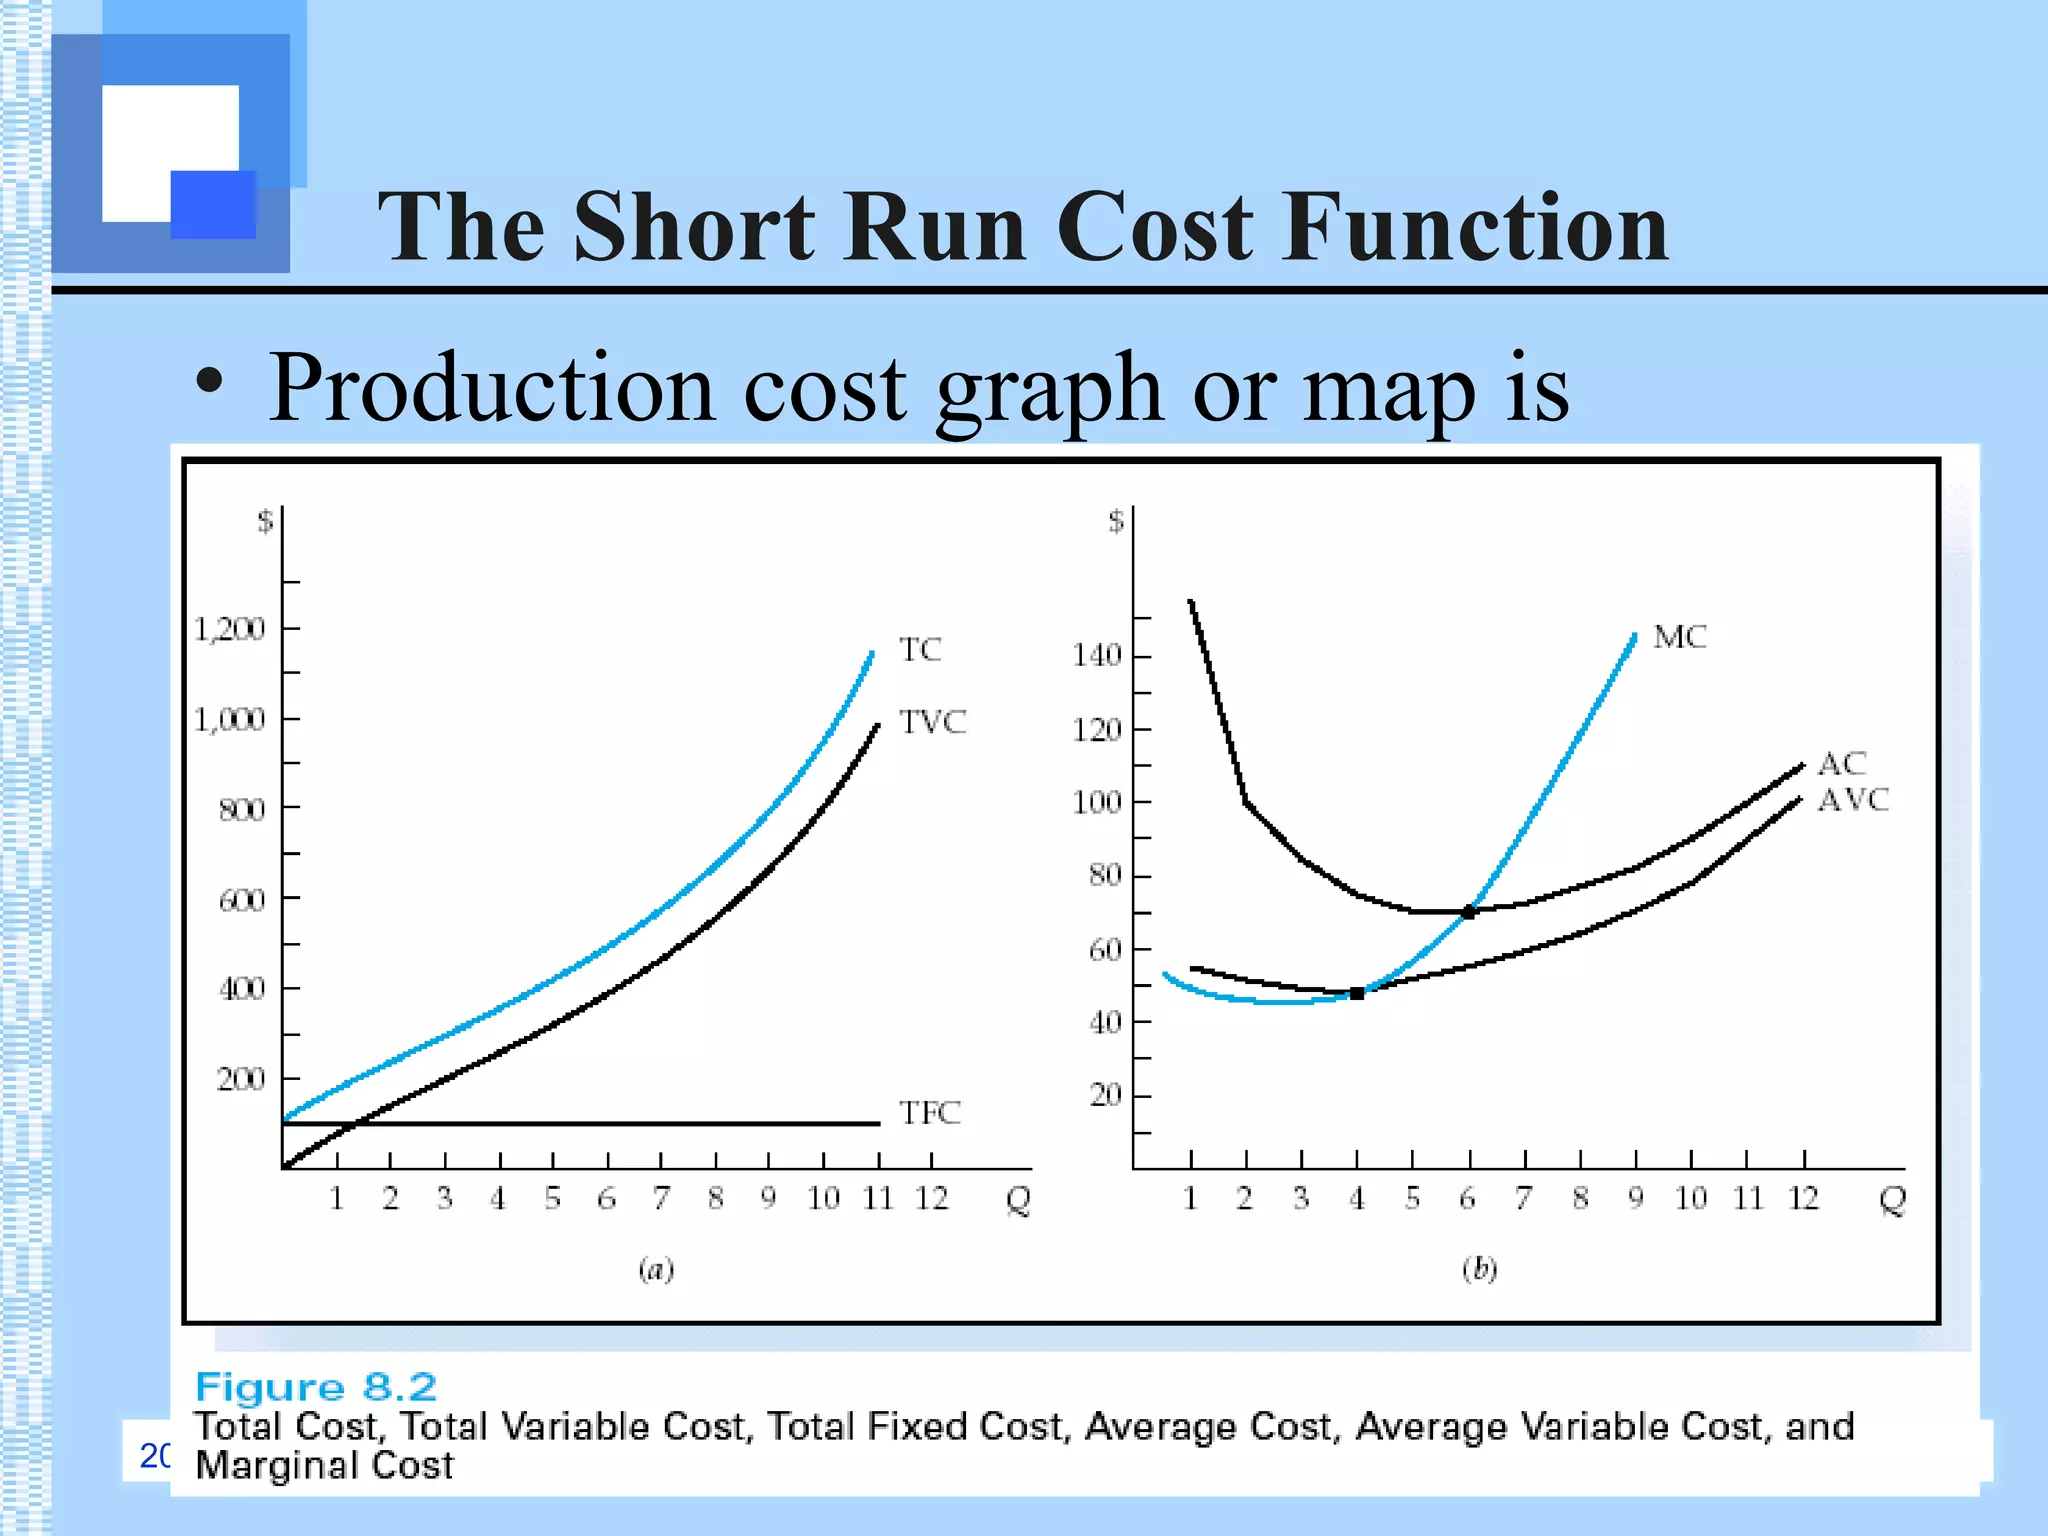
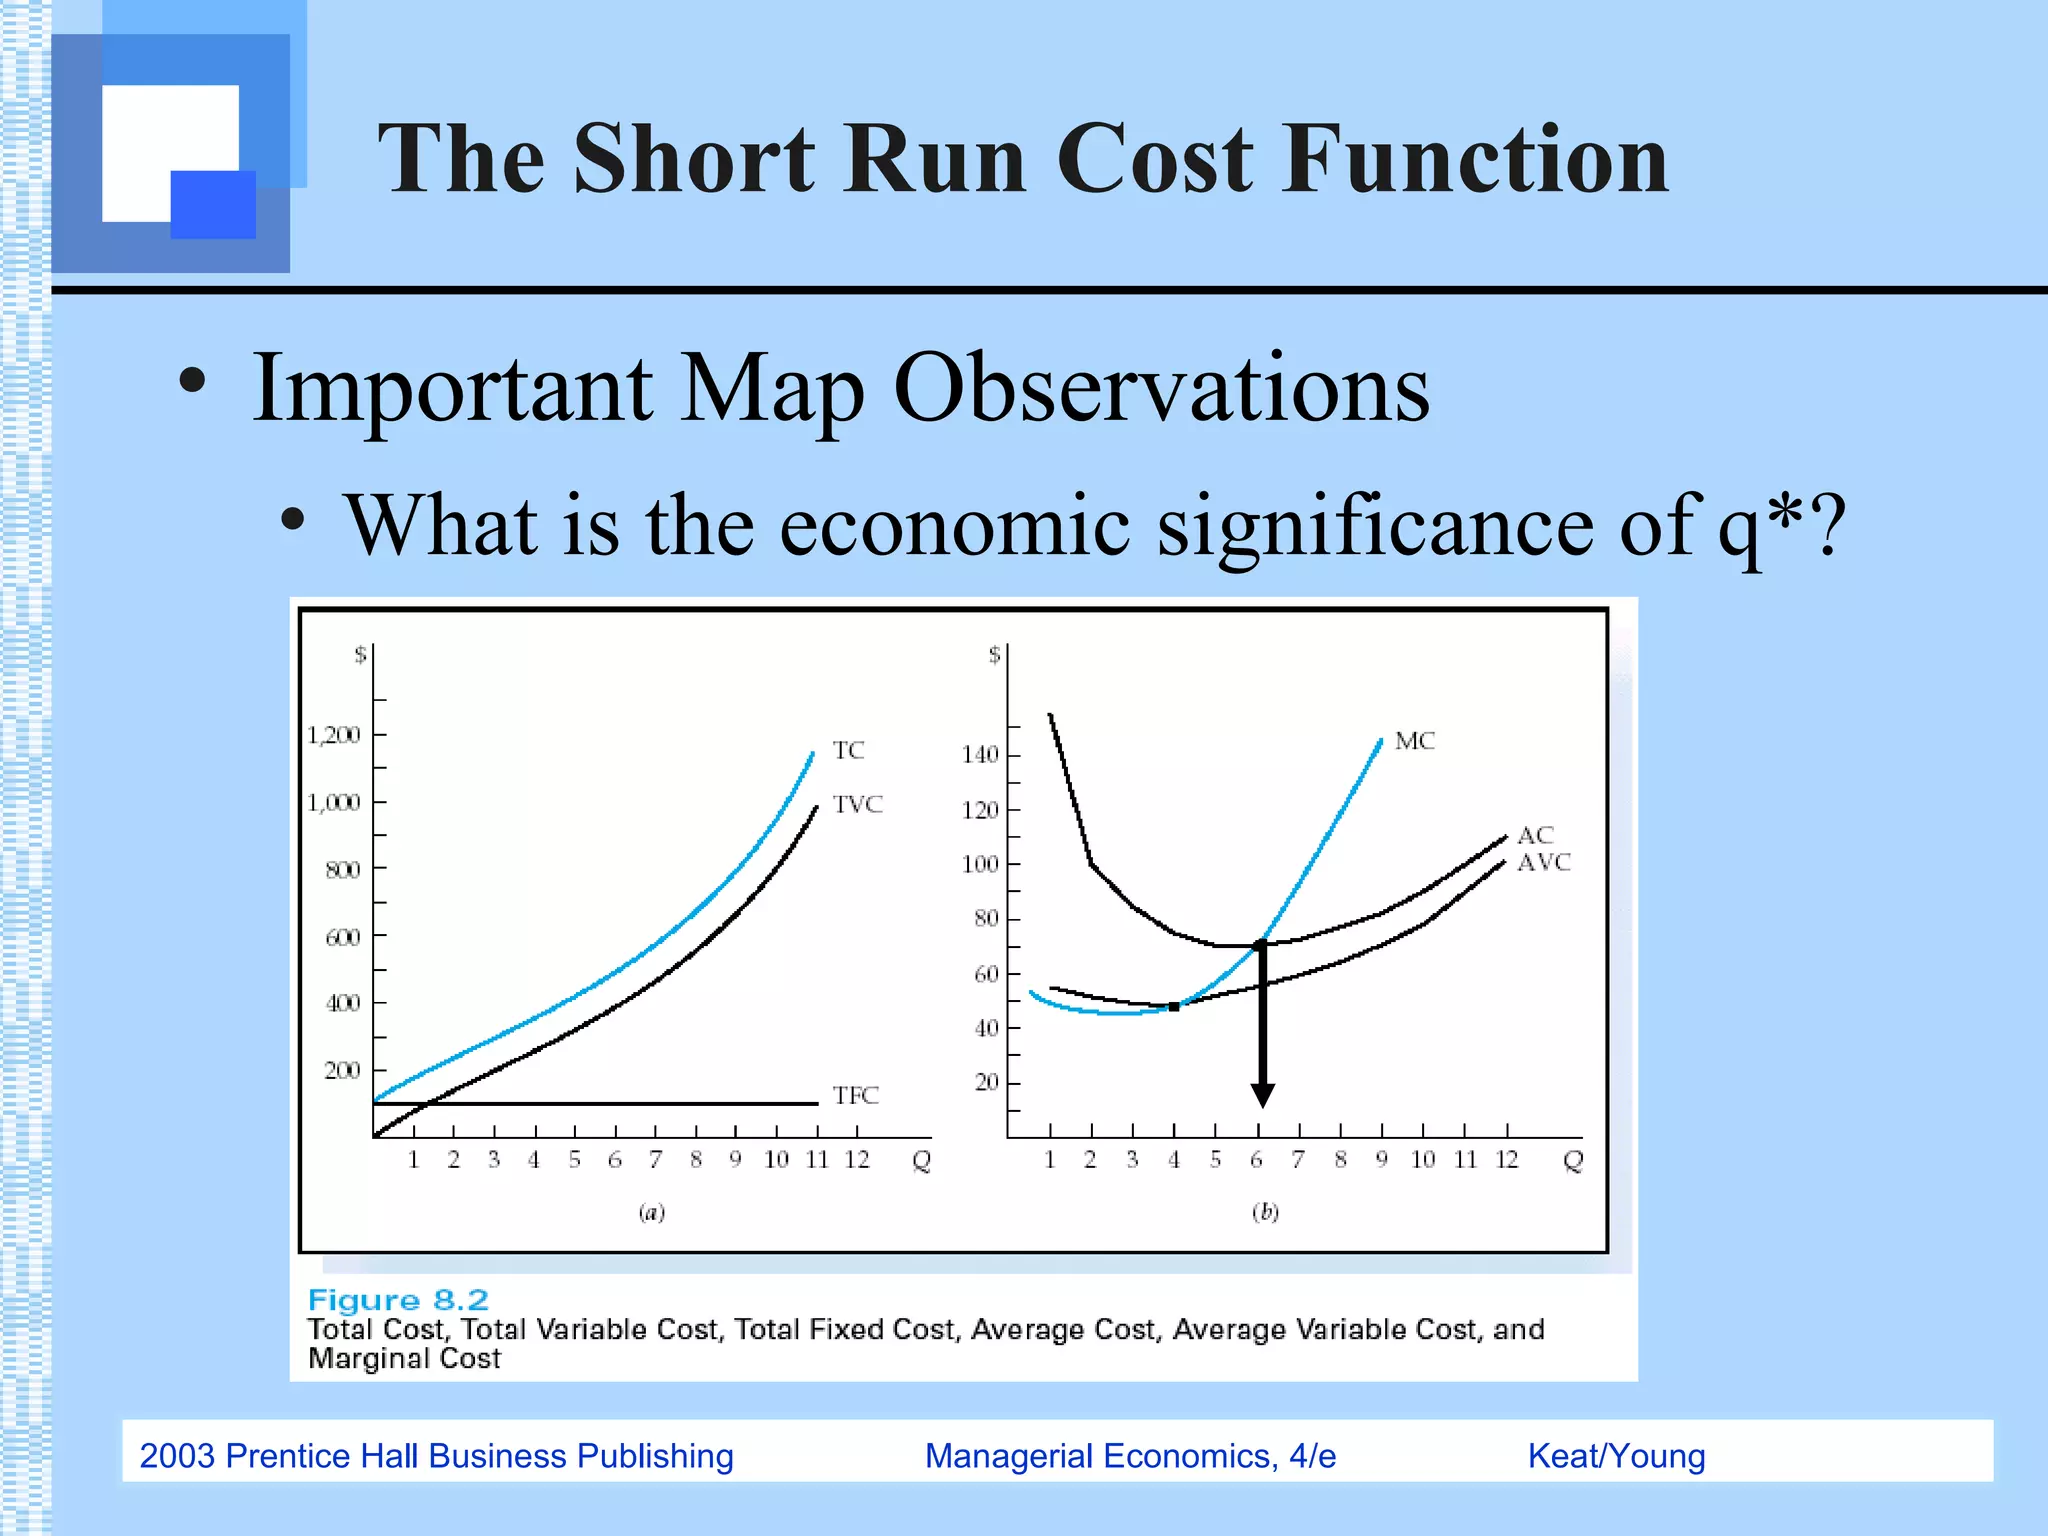
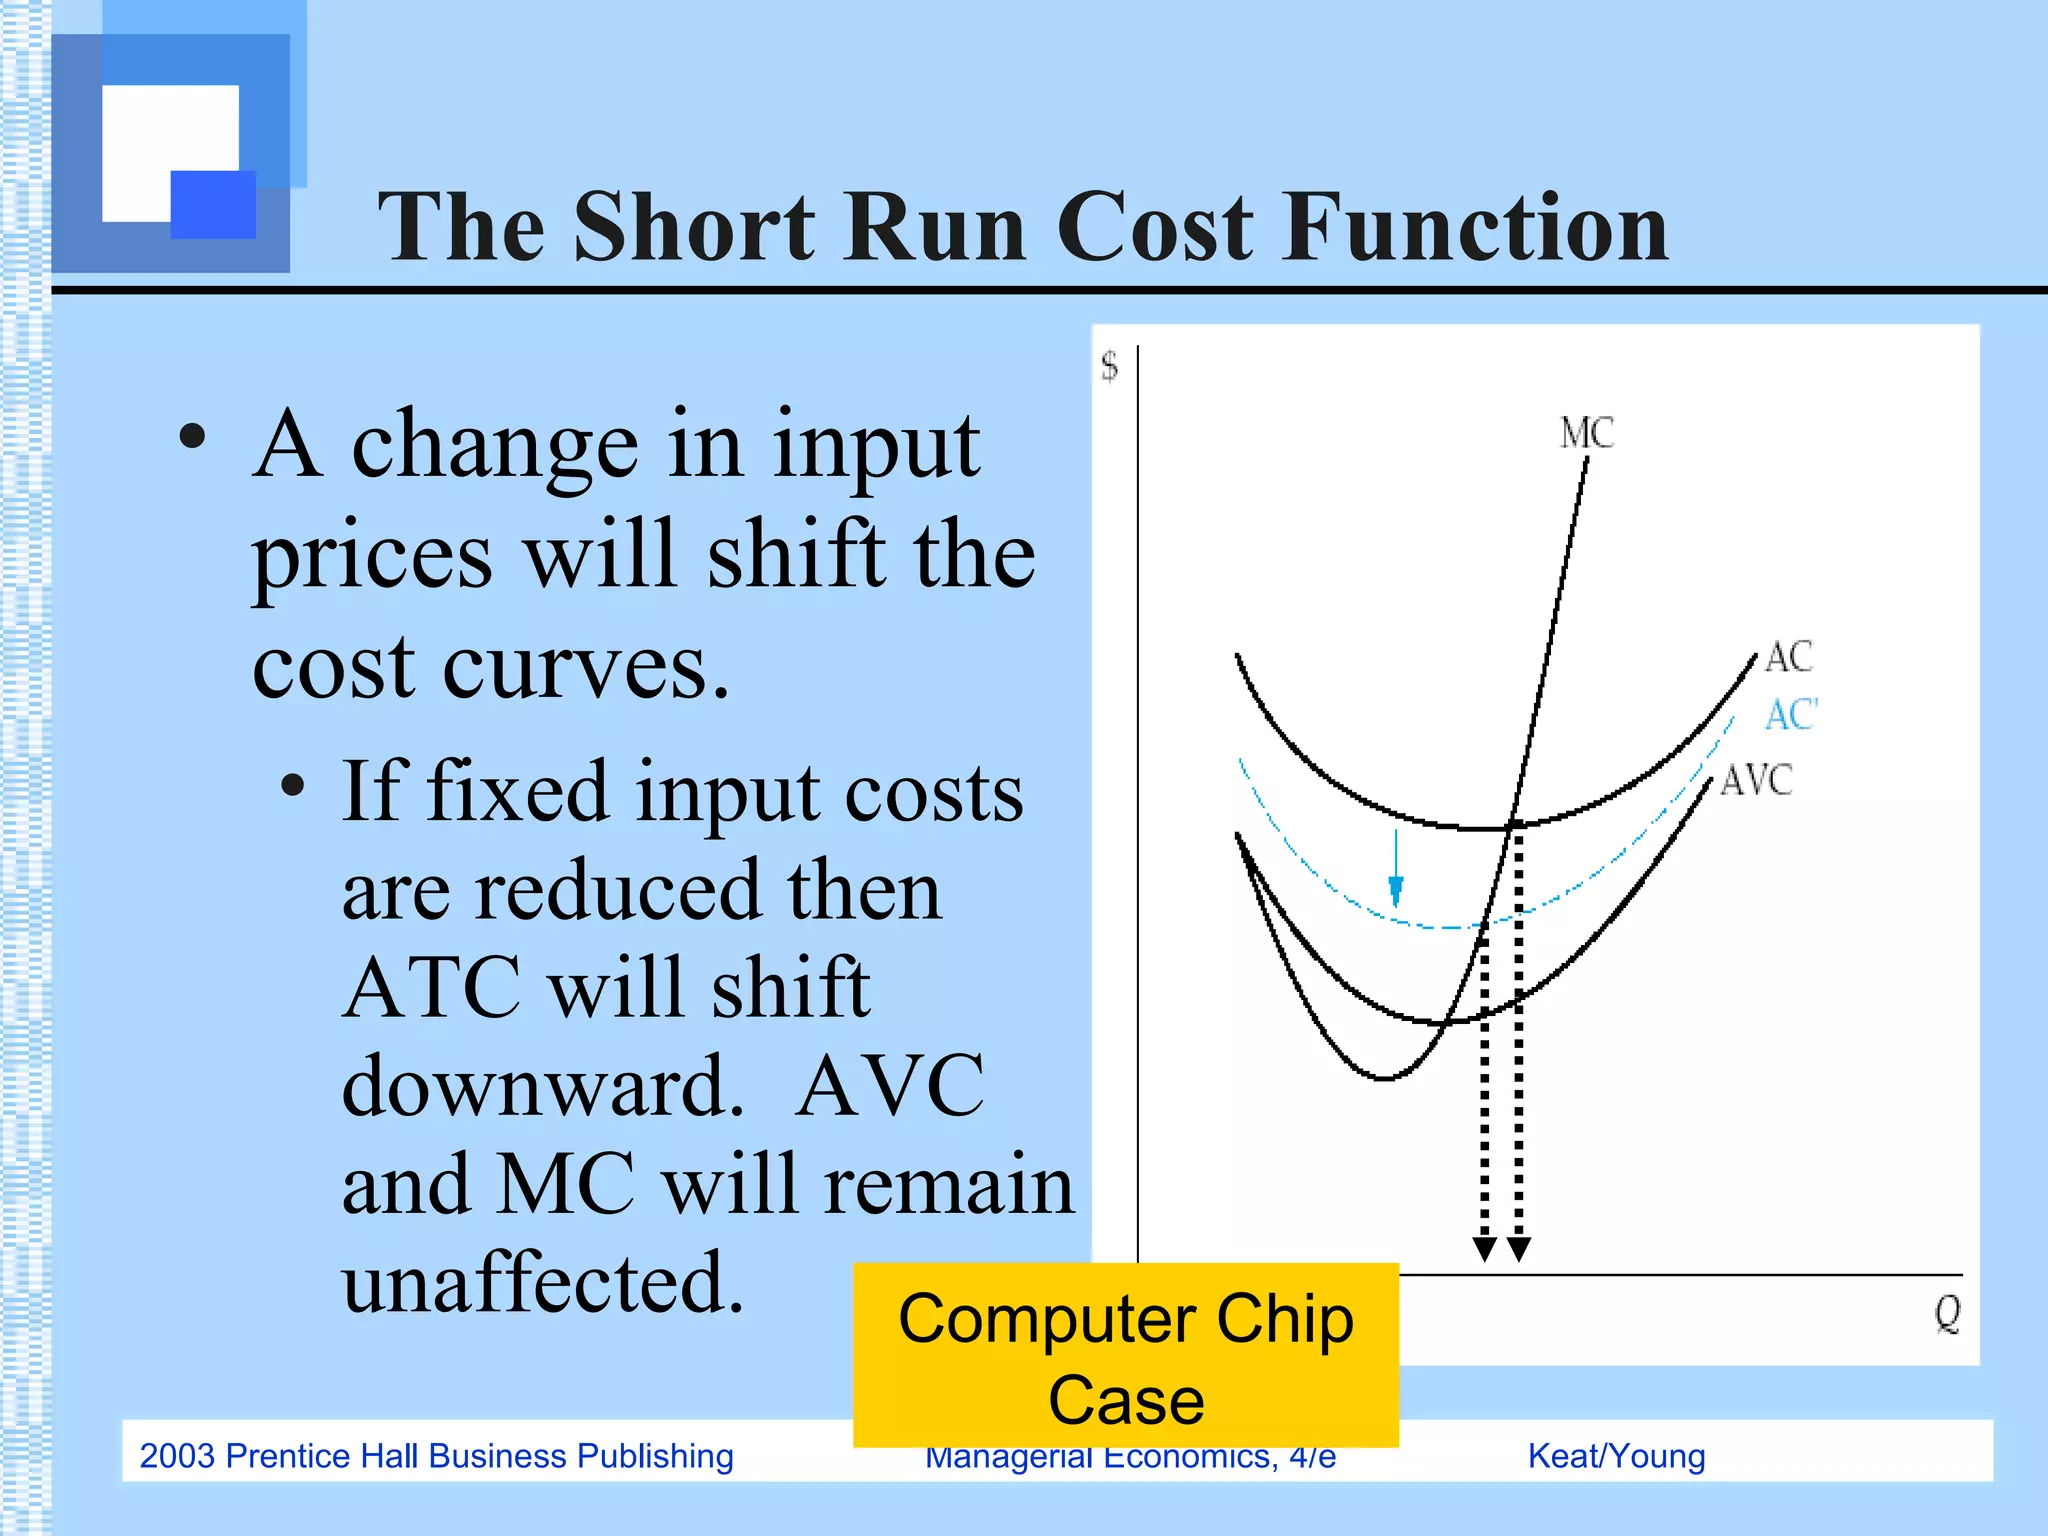
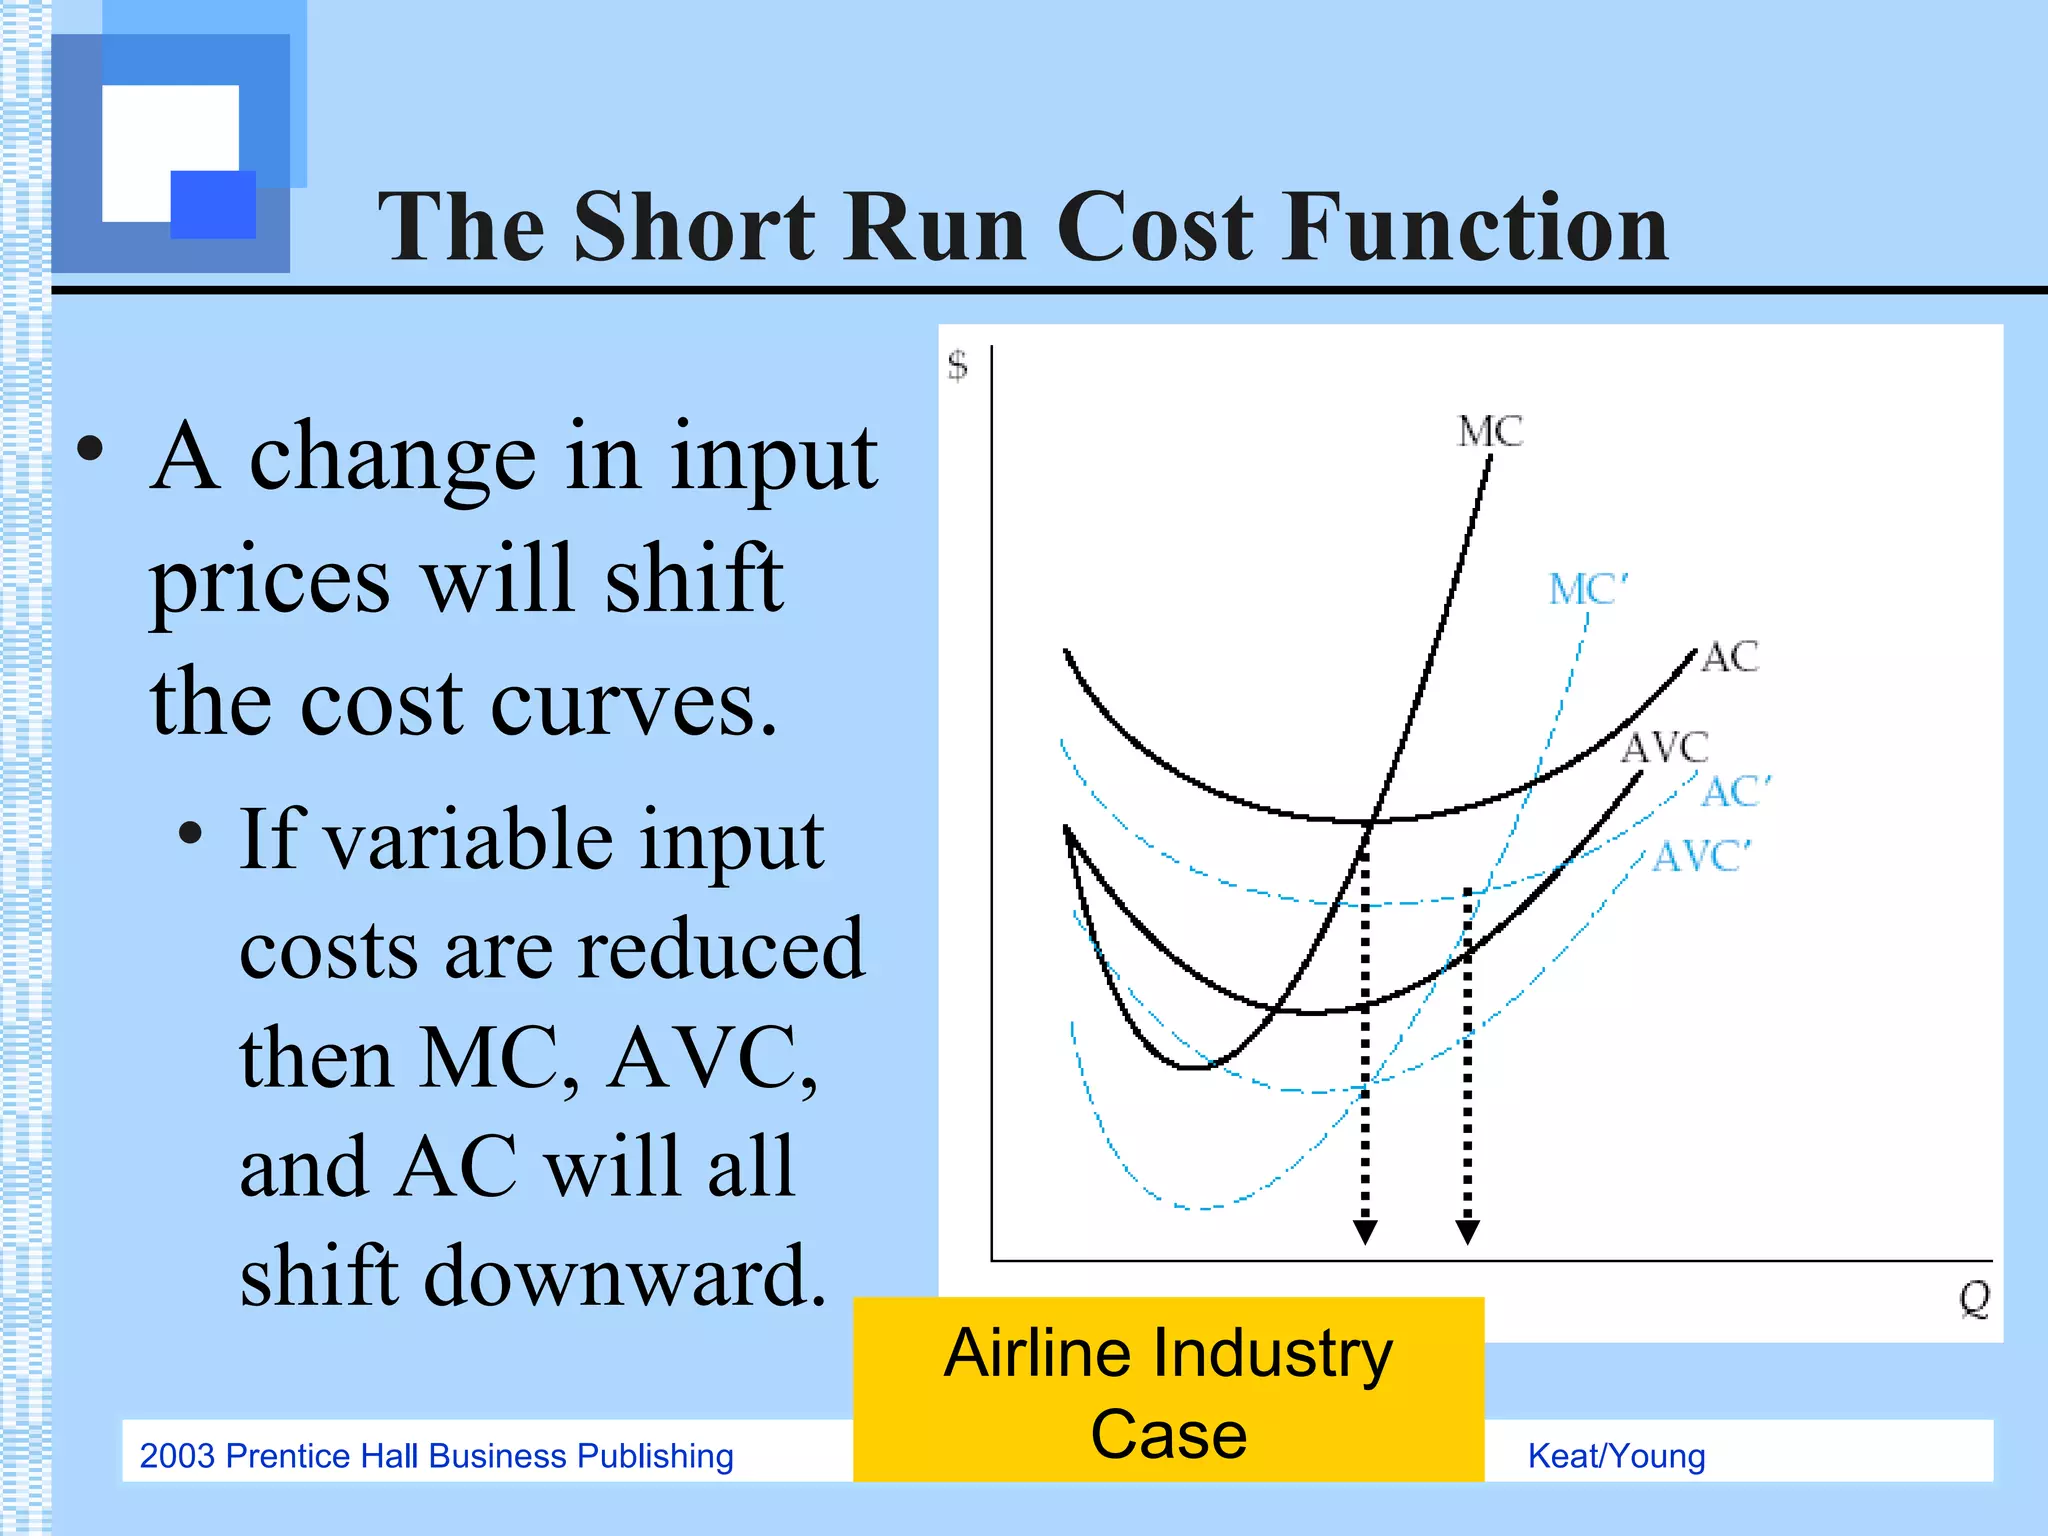
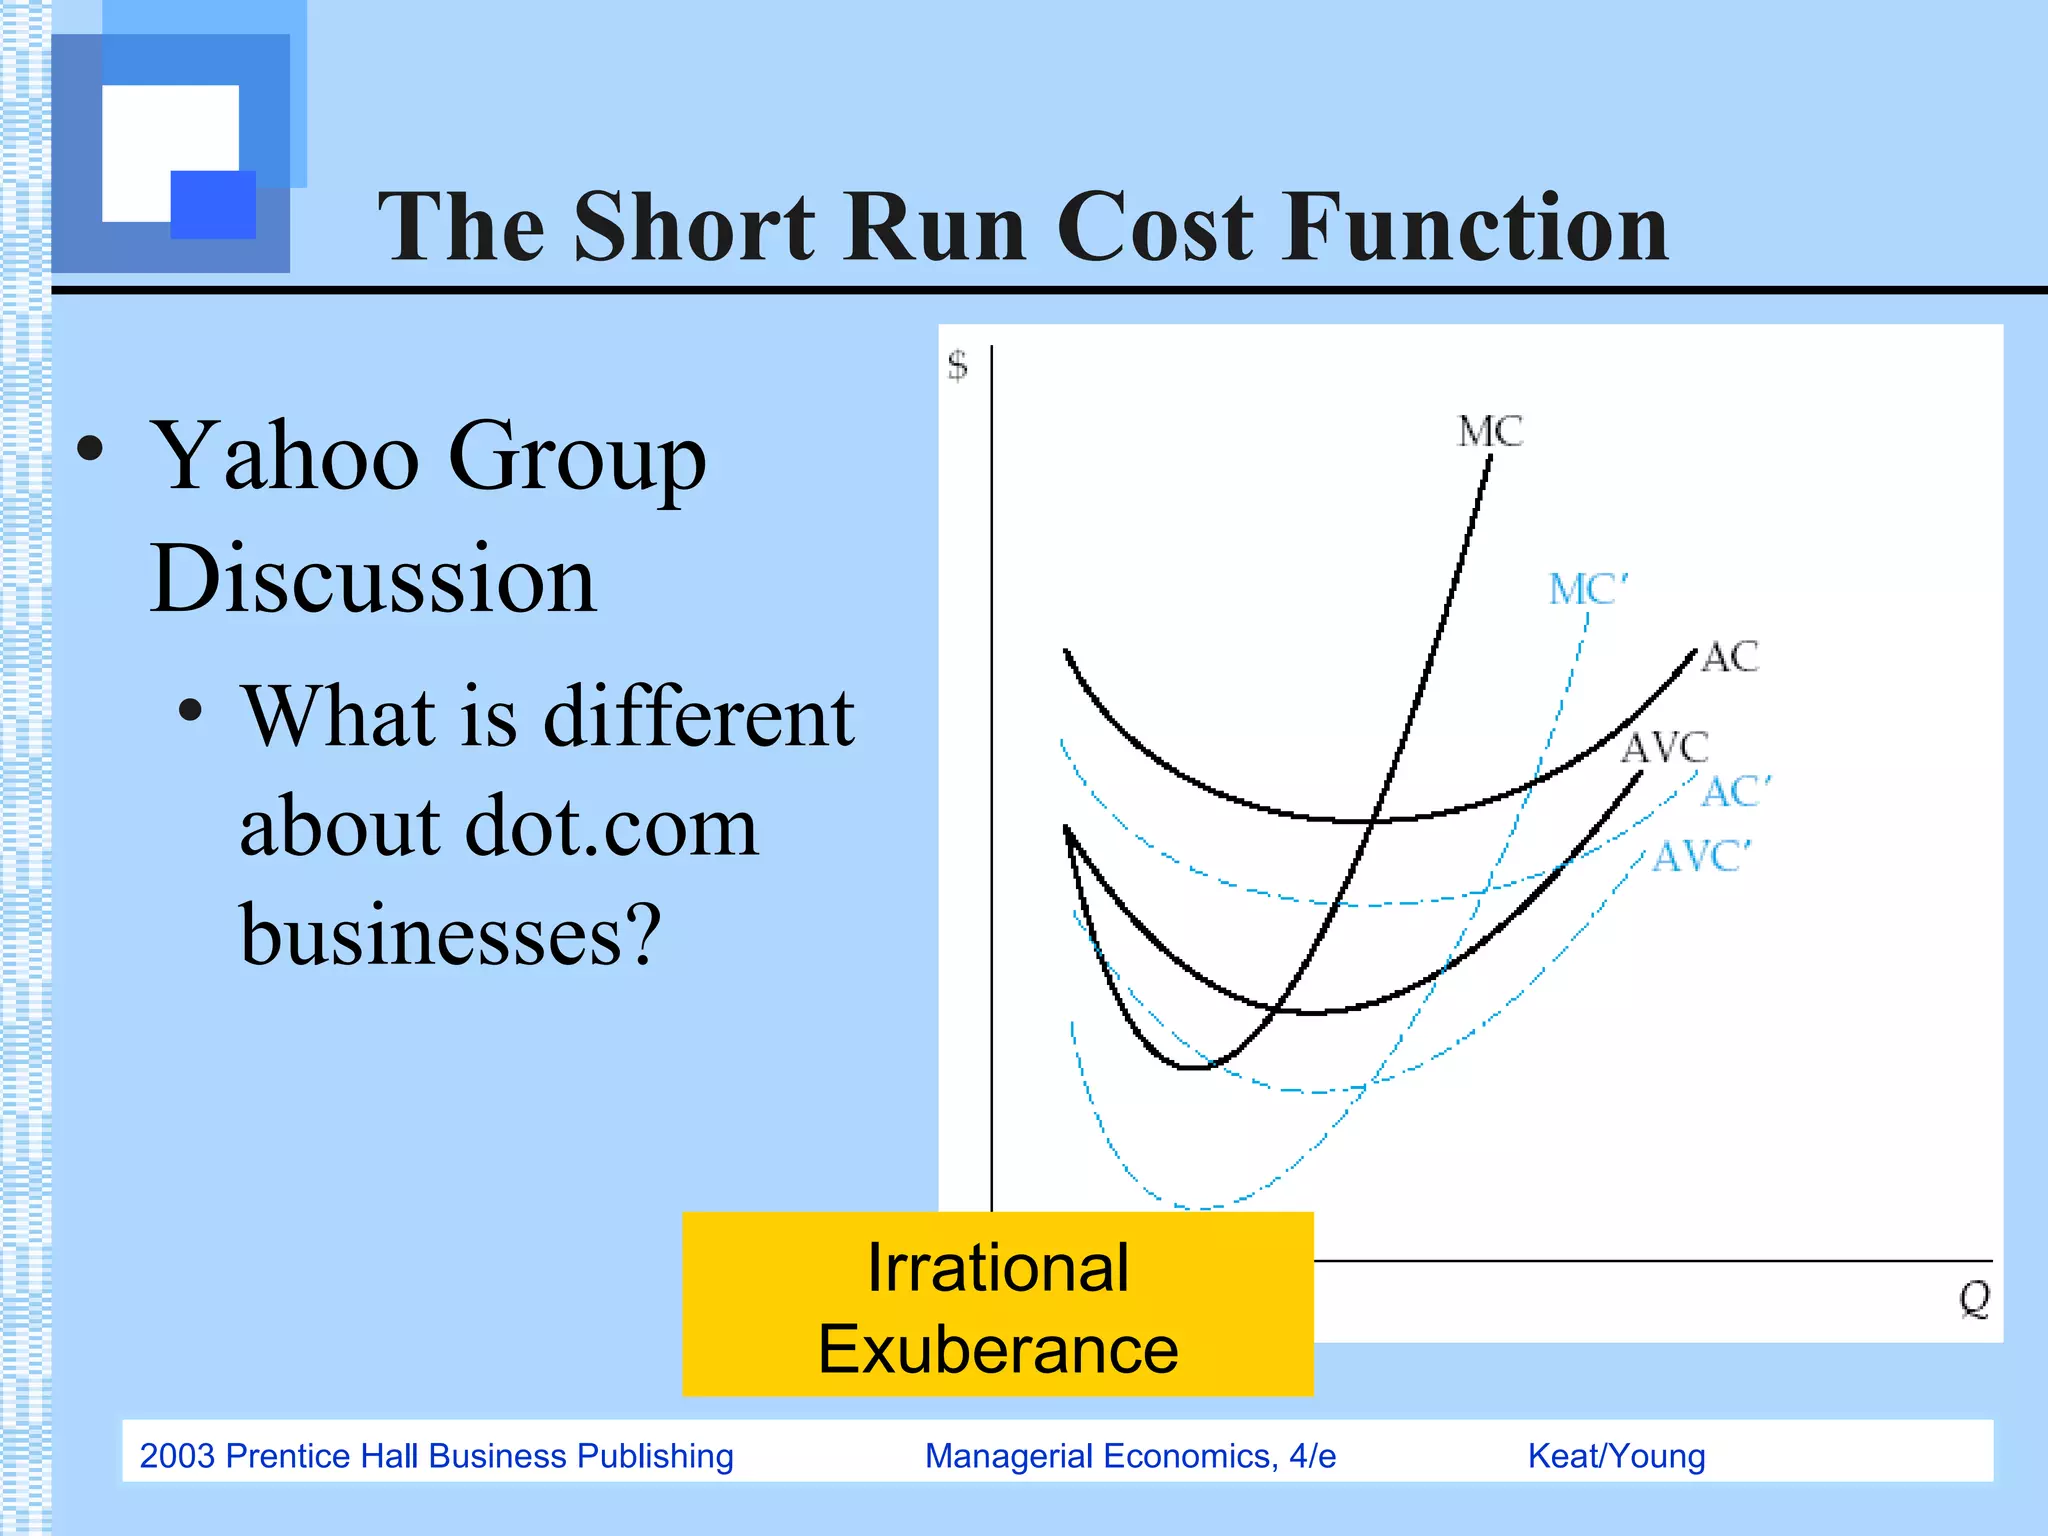
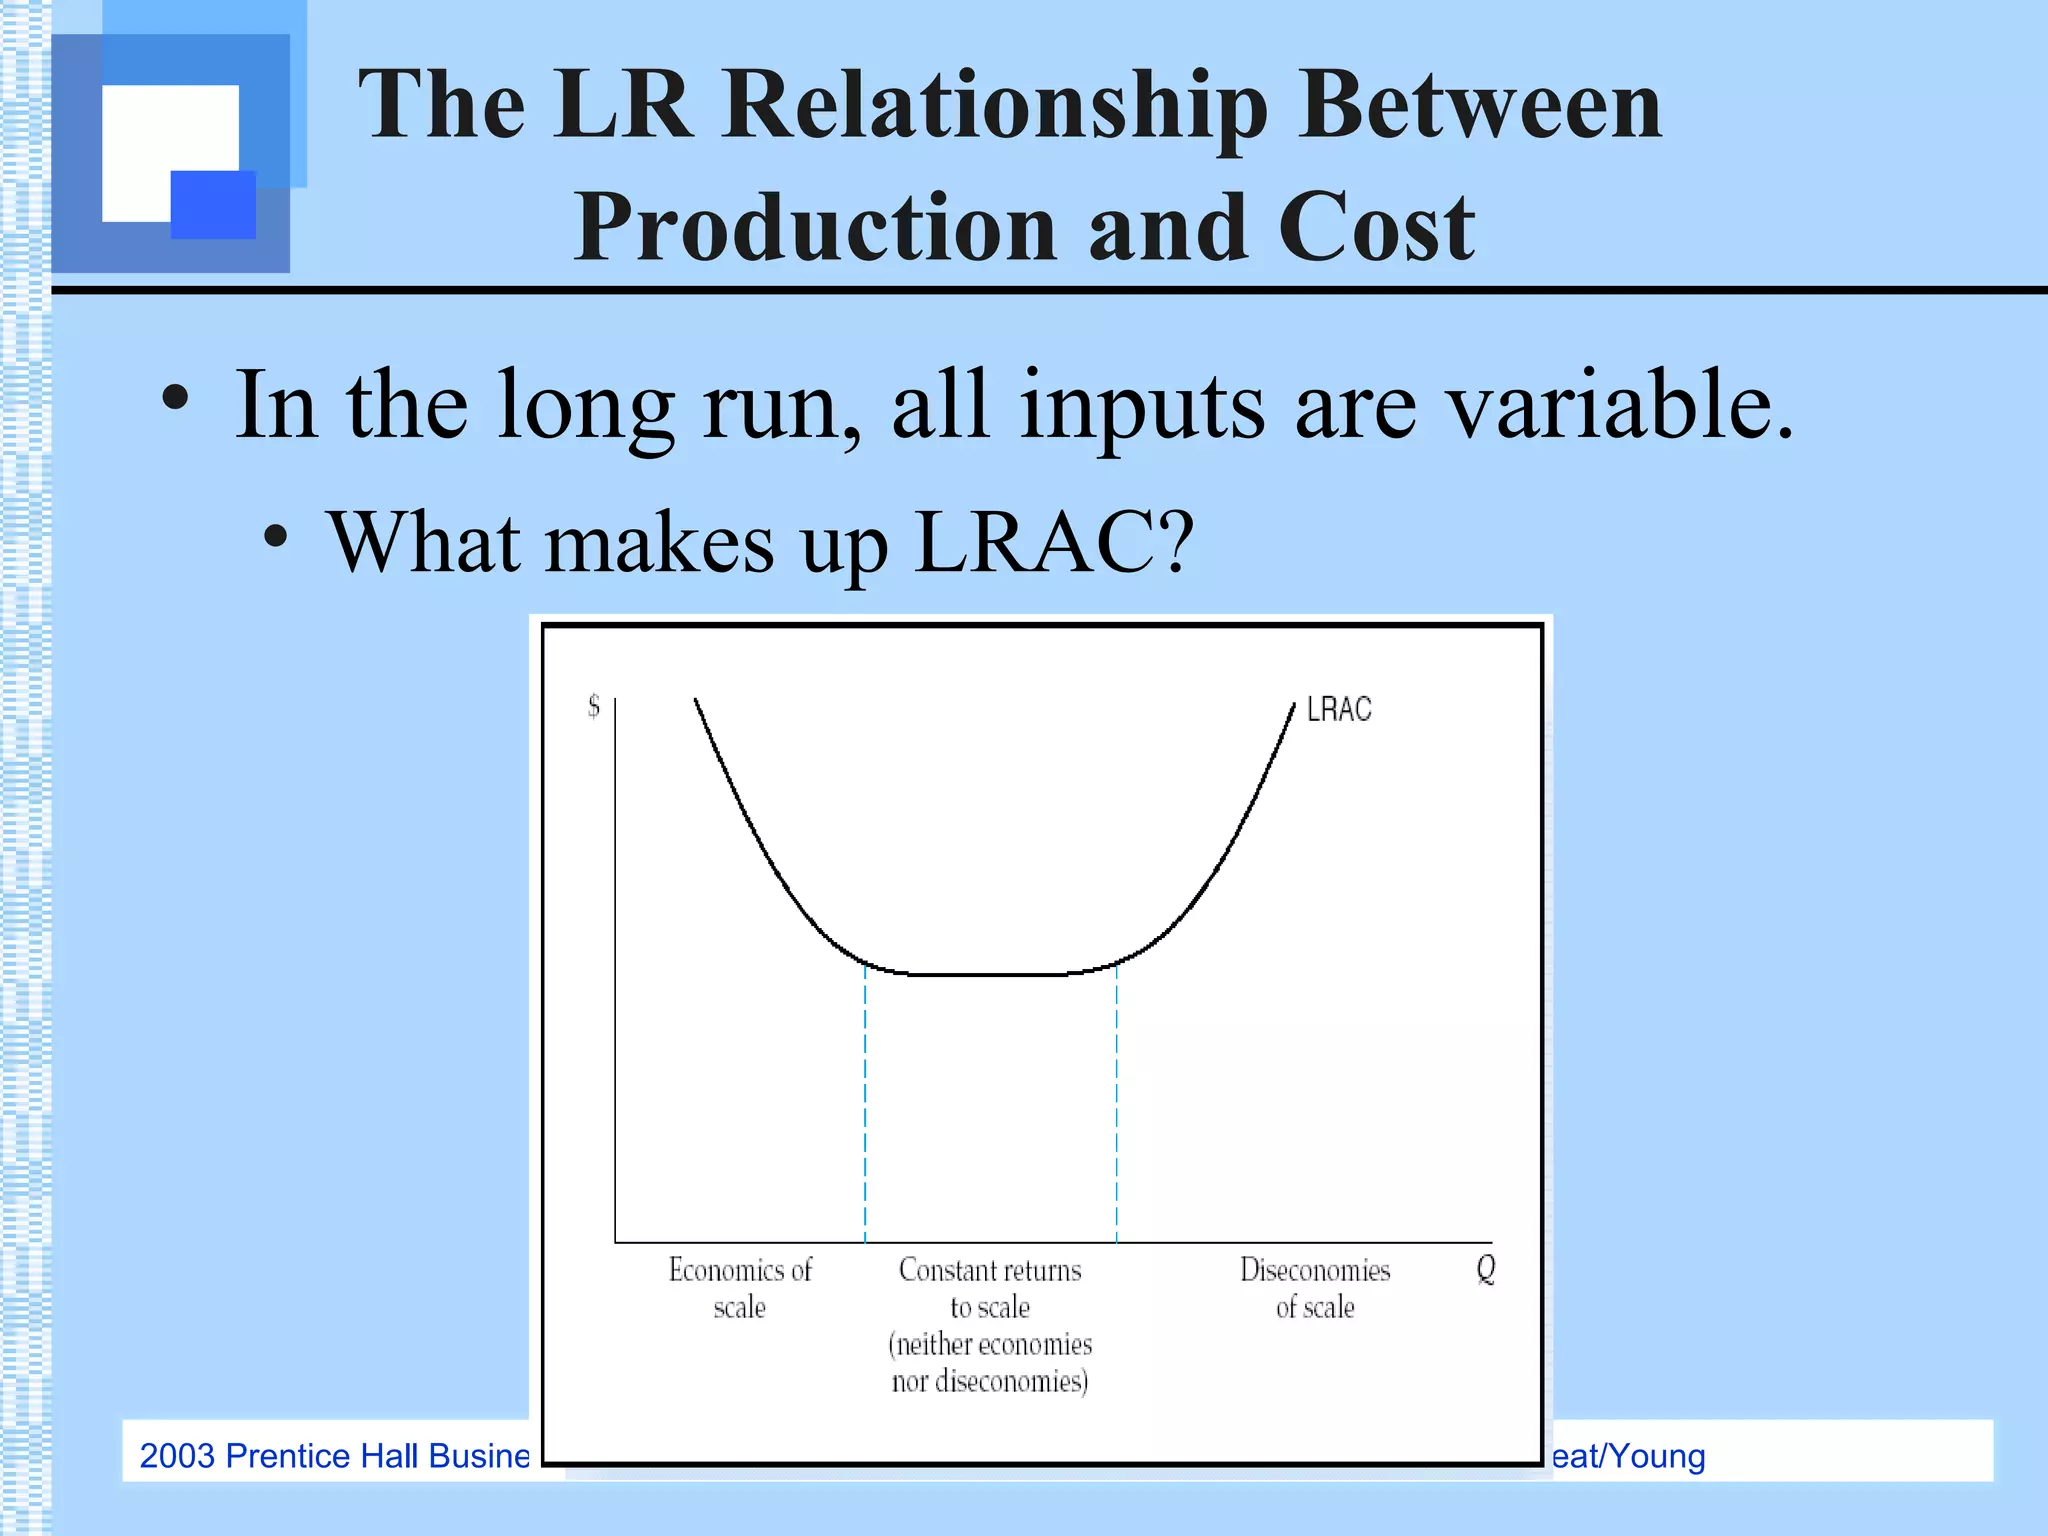
Chapter 8Chapter 8
The Theory
and
Estimation of
Cost
Managerial Economics:
Economic Tools for Today’s
Decision Makers, 4/e By Paul
Keat and Philip Young
2003 Prentice Hall Business Publishing Managerial Economics, 4/e Keat/Young
Before We Start…Group Presentation
• So popular?
Q = aL
b
K
1-borc
• b+c > 1 IRTS
• b+c = 1 CRTS
• b+c < 1 DRTS
• Short Run Analysis: MPK = c Q/K
& MPL = b Q/L
• b & c are elasticities of K & L
factors
• LogQ=loga+blogL+clogK + dlogT
where T  technology
2003 Prentice Hall Business Publishing Managerial Economics, 4/e Keat/Young
The Theory and
Estimation of Cost
• Definition of Cost
• The Short Run Relationship Between
Production and Cost
• The Short Run Cost Function
• The Long Run Relationship Between
Production and Cost
• The Long Run Cost Function
• The Learning Curve
2003 Prentice Hall Business Publishing Managerial Economics, 4/e Keat/Young
Definition of Cost
• A cost is relevant if it is affected by a
management decision.
• Historical cost is incurred at the time of
procurement
• Replacement cost is necessary to replace
inventory
• Are historical costs relevant?
2003 Prentice Hall Business Publishing Managerial Economics, 4/e Keat/Young
Definition of Cost
• There are two types of cost associated
with economic analysis
• Opportunity cost is the value that is
forgone in choosing one activity over the
next best alternative
• Out-of-pocket cost is actual transfer of
value that occur
• Which cost is relevant?
2003 Prentice Hall Business Publishing Managerial Economics, 4/e Keat/Young
Definition of Cost
• There are two types of cost associated
with time
• Incremental cost varies with the range
of options available in the decision
making process.
• Sunk cost does not vary with decision
options.
• Is sunk cost relevant?
2003 Prentice Hall Business Publishing Managerial Economics, 4/e Keat/Young
SR Relationship Between
Production and Cost
• A firm’s cost structure is related to its
production process.
• Costs are determined by the production
technology and input prices.
• Assuming that the firm is a “price taker” in
the input market.
2003 Prentice Hall Business Publishing Managerial Economics, 4/e Keat/Young
SR Relationship Between
Production and Cost
• Total variable cost
(TVC) is associated
with the variable
input
• Assume w=$500
per unit (price-
taker)
Total
Input
(L) Q (TP) MP
TVC
(wL)
0 0 0
1 1,000 1,000 500
2 3,000 2,000 1,000
3 6,000 3,000 1,500
4 8,000 2,000 2,000
5 9,000 1,000 2,500
6 9,500 500 3,000
7 9,850 350 3,500
8 10,000 150 4,000
9 9,850 -150 4,500
2003 Prentice Hall Business Publishing Managerial Economics, 4/e Keat/Young
SR Relationship Between
Production and Cost
• TP and TVC are mirror images of
each other
Kings Dominion
Example
2003 Prentice Hall Business Publishing Managerial Economics, 4/e Keat/Young
SR Relationship Between
Production and Cost
• Total cost (TC) is the cost associated
with all of the inputs. It is the sum of
TVC and TFC.
• TC=TFC+TVC
• Marginal Costs
• Average Costs
Tool Set for
Production Cost
Analysis
vs.
Production Process
Analysis
2003 Prentice Hall Business Publishing Managerial Economics, 4/e Keat/Young
SR Relationship Between
Production and Cost
• Marginal cost (MC) is the change in
total cost associated a change in output.
Q
TC
MC
∆
∆
=
Q
TVC
Q
TVC
Q
TFC
Q
TVCTFC
Q
TC
MC
∆
∆
+=
∆
∆
+
∆
∆
=
∆
+∆
=
∆
∆
= 0
)(
2003 Prentice Hall Business Publishing Managerial Economics, 4/e Keat/Young
SR Relationship Between
Production and Cost
• Add marginal
cost to the
table
Total
Input
(L) Q MP
TVC
(wL) MC
0 0 0
1 1,000 1,000 500 0.50
2 3,000 2,000 1,000 0.25
3 6,000 3,000 1,500 0.17
4 8,000 2,000 2,000 0.25
5 9,000 1,000 2,500 0.50
6 9,500 500 3,000 1.00
7 9,850 350 3,500 1.43
8 10,000 150 4,000 3.33
9 9,850 -150 4,500
2003 Prentice Hall Business Publishing Managerial Economics, 4/e Keat/Young
SR Relationship Between
Production and Cost
• Observe that:
• When MP is
increasing,
MC is
decreasing.
• When MP is
decreasing,
MC is
increasing.
Total
Input
(L) Q MP
TVC
(wL) MC
0 0 0
1 1,000 1,000 500 0.50
2 3,000 2,000 1,000 0.25
3 6,000 3,000 1,500 0.17
4 8,000 2,000 2,000 0.25
5 9,000 1,000 2,500 0.50
6 9,500 500 3,000 1.00
7 9,850 350 3,500 1.43
8 10,000 150 4,000 3.33
9 9,850 -150 4,500
2003 Prentice Hall Business Publishing Managerial Economics, 4/e Keat/Young
SR Relationship Between
Production and Cost
• The relationship between MP and
MC is
MP
w
MP
w
Q
L
w
Q
Lw
Q
TVC
MC =•=
∆
∆
•=
∆
ƥ
=
∆
∆
=
1
Law of diminishing returns implies that
MC will eventually increase! Why?
2003 Prentice Hall Business Publishing Managerial Economics, 4/e Keat/Young
The Short Run Cost Function
• Average total cost (ATC) is the
average per-unit cost of using all of the
firm’s inputs (TC/Q)
• Average variable cost (AVC) is the
average per-unit cost of using the firm’s
variable inputs (TVC/Q)
• Average fixed cost (AFC) is the average
per-unit cost of using the firm’s fixed
inputs (TFC/Q)
2003 Prentice Hall Business Publishing Managerial Economics, 4/e Keat/Young
The Short Run Cost Function
• Add ATC = AFC + AVC to the table
2003 Prentice Hall Business Publishing Managerial Economics, 4/e Keat/Young
The Short Run Cost Function
• ATC = AFC + AVC
2003 Prentice Hall Business Publishing Managerial Economics, 4/e Keat/Young
The Short Run Cost Function
• Production cost graph or map is
2003 Prentice Hall Business Publishing Managerial Economics, 4/e Keat/Young
The Short Run Cost Function
• Important Map Observations
• AFC declines steadily over the range of
production. Why?
• In general, ATC is u-shaped. Why?
• MC intersects the minimum point (q*) on
ATC. Why?
2003 Prentice Hall Business Publishing Managerial Economics, 4/e Keat/Young
The Short Run Cost Function
• Important Map Observations
• What is the economic significance of q*?
2003 Prentice Hall Business Publishing Managerial Economics, 4/e Keat/Young
The Short Run Cost Function
• Average total cost (ATC) is the
average per-unit cost of using all of the
firm’s inputs (TC/Q)
• At Q* - ATC is minimized or inputs
are used most efficiently given the
production function
Going at 55 MPH
2003 Prentice Hall Business Publishing Managerial Economics, 4/e Keat/Young
The Short Run Cost Function
• A change in input
prices will shift the
cost curves.
• If fixed input costs
are reduced then
ATC will shift
downward. AVC
and MC will remain
unaffected. Computer Chip
Case
2003 Prentice Hall Business Publishing Managerial Economics, 4/e Keat/Young
The Short Run Cost Function
• A change in input
prices will shift
the cost curves.
• If variable input
costs are reduced
then MC, AVC,
and AC will all
shift downward.
Airline Industry
Case
2003 Prentice Hall Business Publishing Managerial Economics, 4/e Keat/Young
The Short Run Cost Function
• Yahoo Group
Discussion
• What is different
about dot.com
businesses?
Irrational
Exuberance
2003 Prentice Hall Business Publishing Managerial Economics, 4/e Keat/Young
The LR Relationship Between
Production and Cost
• In the long run, all inputs are variable.
• What makes up LRAC?
2003 Prentice Hall Business Publishing Managerial Economics, 4/e Keat/Young
The Long-Run Cost Function
• LRAC is made up
for SRACs
• SRAC curves
represent various
plant sizes
• Once a plant size is
chosen, per-unit
production costs are
found by moving
along that particular
SRAC curve
2003 Prentice Hall Business Publishing Managerial Economics, 4/e Keat/Young
The Long-Run Cost Function
• The LRAC is the lower envelope of all
of the SRAC curves.
• Minimum efficient scale is the lowest
output level for which LRAC is
minimized
Is LRAC a function of market size?
What are implications?
2003 Prentice Hall Business Publishing Managerial Economics, 4/e Keat/Young
The Long-Run Cost Function
• Reasons for Economies of Scale…
Increasing returns to scale
Specialization in the use of labor and capital
• Economies in maintaining inventory
• Discounts from bulk purchases
• Lower cost of raising capital funds
• Spreading promotional and R&D costs
Management efficiencies
2003 Prentice Hall Business Publishing Managerial Economics, 4/e Keat/Young
The Long-Run Cost Function
• Reasons for Diseconomies of Scale…
 Decreasing returns to scale
 Input market imperfections
 Management coordination and control
problems
2003 Prentice Hall Business Publishing Managerial Economics, 4/e Keat/Young
The Learning Curve
• Measures the
percentage decrease in
additional labor cost
each time output
doubles.
• An “80 percent” learning
curve implies that the
labor costs associated
with the incremental
output will decrease to
80% of their previous
level.
2003 Prentice Hall Business Publishing Managerial Economics, 4/e Keat/Young
The Learning Curve
• A downward slope in the learning
curve indicates the presence of the
learning curve effect
• Why? Workers improve their
productivity with practice
• The learning curve effect shifts the
SRAC downward
2003 Prentice Hall Business Publishing Managerial Economics, 4/e Keat/Young
Production Cost Homework
• Page 378
• Problem 10

1517 cost-theory and estimation of cost

  • 1.
    Chapter 8Chapter 8 TheTheory and Estimation of Cost Managerial Economics: Economic Tools for Today’s Decision Makers, 4/e By Paul Keat and Philip Young
  • 2.
    2003 Prentice HallBusiness Publishing Managerial Economics, 4/e Keat/Young Before We Start…Group Presentation • So popular? Q = aL b K 1-borc • b+c > 1 IRTS • b+c = 1 CRTS • b+c < 1 DRTS • Short Run Analysis: MPK = c Q/K & MPL = b Q/L • b & c are elasticities of K & L factors • LogQ=loga+blogL+clogK + dlogT where T  technology
  • 3.
    2003 Prentice HallBusiness Publishing Managerial Economics, 4/e Keat/Young The Theory and Estimation of Cost • Definition of Cost • The Short Run Relationship Between Production and Cost • The Short Run Cost Function • The Long Run Relationship Between Production and Cost • The Long Run Cost Function • The Learning Curve
  • 4.
    2003 Prentice HallBusiness Publishing Managerial Economics, 4/e Keat/Young Definition of Cost • A cost is relevant if it is affected by a management decision. • Historical cost is incurred at the time of procurement • Replacement cost is necessary to replace inventory • Are historical costs relevant?
  • 5.
    2003 Prentice HallBusiness Publishing Managerial Economics, 4/e Keat/Young Definition of Cost • There are two types of cost associated with economic analysis • Opportunity cost is the value that is forgone in choosing one activity over the next best alternative • Out-of-pocket cost is actual transfer of value that occur • Which cost is relevant?
  • 6.
    2003 Prentice HallBusiness Publishing Managerial Economics, 4/e Keat/Young Definition of Cost • There are two types of cost associated with time • Incremental cost varies with the range of options available in the decision making process. • Sunk cost does not vary with decision options. • Is sunk cost relevant?
  • 7.
    2003 Prentice HallBusiness Publishing Managerial Economics, 4/e Keat/Young SR Relationship Between Production and Cost • A firm’s cost structure is related to its production process. • Costs are determined by the production technology and input prices. • Assuming that the firm is a “price taker” in the input market.
  • 8.
    2003 Prentice HallBusiness Publishing Managerial Economics, 4/e Keat/Young SR Relationship Between Production and Cost • Total variable cost (TVC) is associated with the variable input • Assume w=$500 per unit (price- taker) Total Input (L) Q (TP) MP TVC (wL) 0 0 0 1 1,000 1,000 500 2 3,000 2,000 1,000 3 6,000 3,000 1,500 4 8,000 2,000 2,000 5 9,000 1,000 2,500 6 9,500 500 3,000 7 9,850 350 3,500 8 10,000 150 4,000 9 9,850 -150 4,500
  • 9.
    2003 Prentice HallBusiness Publishing Managerial Economics, 4/e Keat/Young SR Relationship Between Production and Cost • TP and TVC are mirror images of each other Kings Dominion Example
  • 10.
    2003 Prentice HallBusiness Publishing Managerial Economics, 4/e Keat/Young SR Relationship Between Production and Cost • Total cost (TC) is the cost associated with all of the inputs. It is the sum of TVC and TFC. • TC=TFC+TVC • Marginal Costs • Average Costs Tool Set for Production Cost Analysis vs. Production Process Analysis
  • 11.
    2003 Prentice HallBusiness Publishing Managerial Economics, 4/e Keat/Young SR Relationship Between Production and Cost • Marginal cost (MC) is the change in total cost associated a change in output. Q TC MC ∆ ∆ = Q TVC Q TVC Q TFC Q TVCTFC Q TC MC ∆ ∆ += ∆ ∆ + ∆ ∆ = ∆ +∆ = ∆ ∆ = 0 )(
  • 12.
    2003 Prentice HallBusiness Publishing Managerial Economics, 4/e Keat/Young SR Relationship Between Production and Cost • Add marginal cost to the table Total Input (L) Q MP TVC (wL) MC 0 0 0 1 1,000 1,000 500 0.50 2 3,000 2,000 1,000 0.25 3 6,000 3,000 1,500 0.17 4 8,000 2,000 2,000 0.25 5 9,000 1,000 2,500 0.50 6 9,500 500 3,000 1.00 7 9,850 350 3,500 1.43 8 10,000 150 4,000 3.33 9 9,850 -150 4,500
  • 13.
    2003 Prentice HallBusiness Publishing Managerial Economics, 4/e Keat/Young SR Relationship Between Production and Cost • Observe that: • When MP is increasing, MC is decreasing. • When MP is decreasing, MC is increasing. Total Input (L) Q MP TVC (wL) MC 0 0 0 1 1,000 1,000 500 0.50 2 3,000 2,000 1,000 0.25 3 6,000 3,000 1,500 0.17 4 8,000 2,000 2,000 0.25 5 9,000 1,000 2,500 0.50 6 9,500 500 3,000 1.00 7 9,850 350 3,500 1.43 8 10,000 150 4,000 3.33 9 9,850 -150 4,500
  • 14.
    2003 Prentice HallBusiness Publishing Managerial Economics, 4/e Keat/Young SR Relationship Between Production and Cost • The relationship between MP and MC is MP w MP w Q L w Q Lw Q TVC MC =•= ∆ ∆ •= ∆ ∆• = ∆ ∆ = 1 Law of diminishing returns implies that MC will eventually increase! Why?
  • 15.
    2003 Prentice HallBusiness Publishing Managerial Economics, 4/e Keat/Young The Short Run Cost Function • Average total cost (ATC) is the average per-unit cost of using all of the firm’s inputs (TC/Q) • Average variable cost (AVC) is the average per-unit cost of using the firm’s variable inputs (TVC/Q) • Average fixed cost (AFC) is the average per-unit cost of using the firm’s fixed inputs (TFC/Q)
  • 16.
    2003 Prentice HallBusiness Publishing Managerial Economics, 4/e Keat/Young The Short Run Cost Function • Add ATC = AFC + AVC to the table
  • 17.
    2003 Prentice HallBusiness Publishing Managerial Economics, 4/e Keat/Young The Short Run Cost Function • ATC = AFC + AVC
  • 18.
    2003 Prentice HallBusiness Publishing Managerial Economics, 4/e Keat/Young The Short Run Cost Function • Production cost graph or map is
  • 19.
    2003 Prentice HallBusiness Publishing Managerial Economics, 4/e Keat/Young The Short Run Cost Function • Important Map Observations • AFC declines steadily over the range of production. Why? • In general, ATC is u-shaped. Why? • MC intersects the minimum point (q*) on ATC. Why?
  • 20.
    2003 Prentice HallBusiness Publishing Managerial Economics, 4/e Keat/Young The Short Run Cost Function • Important Map Observations • What is the economic significance of q*?
  • 21.
    2003 Prentice HallBusiness Publishing Managerial Economics, 4/e Keat/Young The Short Run Cost Function • Average total cost (ATC) is the average per-unit cost of using all of the firm’s inputs (TC/Q) • At Q* - ATC is minimized or inputs are used most efficiently given the production function Going at 55 MPH
  • 22.
    2003 Prentice HallBusiness Publishing Managerial Economics, 4/e Keat/Young The Short Run Cost Function • A change in input prices will shift the cost curves. • If fixed input costs are reduced then ATC will shift downward. AVC and MC will remain unaffected. Computer Chip Case
  • 23.
    2003 Prentice HallBusiness Publishing Managerial Economics, 4/e Keat/Young The Short Run Cost Function • A change in input prices will shift the cost curves. • If variable input costs are reduced then MC, AVC, and AC will all shift downward. Airline Industry Case
  • 24.
    2003 Prentice HallBusiness Publishing Managerial Economics, 4/e Keat/Young The Short Run Cost Function • Yahoo Group Discussion • What is different about dot.com businesses? Irrational Exuberance
  • 25.
    2003 Prentice HallBusiness Publishing Managerial Economics, 4/e Keat/Young The LR Relationship Between Production and Cost • In the long run, all inputs are variable. • What makes up LRAC?
  • 26.
    2003 Prentice HallBusiness Publishing Managerial Economics, 4/e Keat/Young The Long-Run Cost Function • LRAC is made up for SRACs • SRAC curves represent various plant sizes • Once a plant size is chosen, per-unit production costs are found by moving along that particular SRAC curve
  • 27.
    2003 Prentice HallBusiness Publishing Managerial Economics, 4/e Keat/Young The Long-Run Cost Function • The LRAC is the lower envelope of all of the SRAC curves. • Minimum efficient scale is the lowest output level for which LRAC is minimized Is LRAC a function of market size? What are implications?
  • 28.
    2003 Prentice HallBusiness Publishing Managerial Economics, 4/e Keat/Young The Long-Run Cost Function • Reasons for Economies of Scale… Increasing returns to scale Specialization in the use of labor and capital • Economies in maintaining inventory • Discounts from bulk purchases • Lower cost of raising capital funds • Spreading promotional and R&D costs Management efficiencies
  • 29.
    2003 Prentice HallBusiness Publishing Managerial Economics, 4/e Keat/Young The Long-Run Cost Function • Reasons for Diseconomies of Scale…  Decreasing returns to scale  Input market imperfections  Management coordination and control problems
  • 30.
    2003 Prentice HallBusiness Publishing Managerial Economics, 4/e Keat/Young The Learning Curve • Measures the percentage decrease in additional labor cost each time output doubles. • An “80 percent” learning curve implies that the labor costs associated with the incremental output will decrease to 80% of their previous level.
  • 31.
    2003 Prentice HallBusiness Publishing Managerial Economics, 4/e Keat/Young The Learning Curve • A downward slope in the learning curve indicates the presence of the learning curve effect • Why? Workers improve their productivity with practice • The learning curve effect shifts the SRAC downward
  • 32.
    2003 Prentice HallBusiness Publishing Managerial Economics, 4/e Keat/Young Production Cost Homework • Page 378 • Problem 10