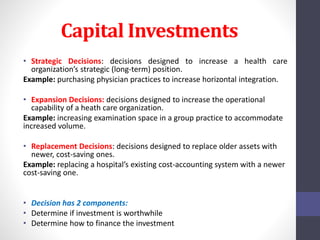
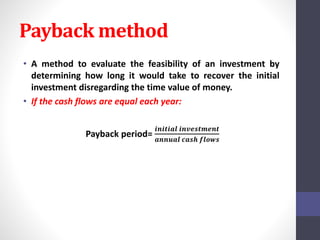
Downloaded 728 times


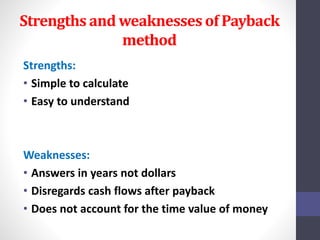
![Example 1:
Givens Years 0 1 2 3 4 5
1. Initial investment ($15,000,0
00)
2. Net opening cash
flows
$2,000,000 $4,000,000 $5,000,000 $8,000,000 $16,000,000
Givens 0 1 2 3 4 5
A. Initial
investment
[Given 1] ($15,000,0
00)
B. Net opening cash
flows
[Given 2] $2,000,000 $4,000,000 $5,000,000 $8,000,000 $16,000,000
C. Cumulative Cash
Flows
(a) ($15,000,0
00)
$13,000,00
0
$9,000,000 $4,000,000 $4,000,000 $20,000,000
Solution:
Payback = year 3.5](https://image.slidesharecdn.com/07chap-141214164505-conversion-gate01/85/Chapter-7-The-Investment-Decision-8-320.jpg)
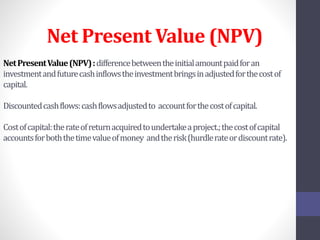
![Example 2:
Givens Years 0 1 2 3 4 5
1. Initial investment ($28,000)
2. Net opening cash
flows
$8,000 $8,000 $8,000 $8,000 $8,000
Givens 0 1 2 3 4 5
A. Initial
investment
[Given 1] ($28,000)
B. Net opening cash
flows
[Given 2] $8,000 $8,000 $8,000 $8,000 $8,000
C. Cumulative Cash
Flows
(a) ($28,000) $20,000 $12,000 $4,000 $4,000 $12,000
Solution:
Payback = year 3.5](https://image.slidesharecdn.com/07chap-141214164505-conversion-gate01/85/Chapter-7-The-Investment-Decision-9-320.jpg)
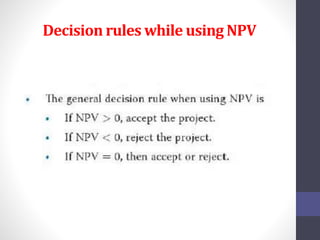
![Taking example 1: discount rate = 15%
Givens 0 1 2 3 4 5
A. Initial
investment
[Given 1] ($15,000,0
00)
B. Net opening cash
flows
[Given 2] $2,000,000 $4,000,000 $5,000,000 $8,000,000 $16,000,000
C. Cumulative Cash
Flows
(a) ($15,000,0
00)
$13,000,00
0
$9,000,000 $4,000,000 $4,000,000 $20,000,000
Givens 0 1 2 3 4 5
D. Present value
interest factors
for 15%
ퟏ
(ퟏ + 풊)풏
[Table
B3]
0.8696 0.7561 0.6575 0.5718 0.4972
E. Present value
of cash flows
[B X D] $1,739,13
0
$3,024,57
5
$3,287,581 $4,574,026 $7,954,828
F. Sum of annual
Cash Flows
[Sum E] $20,580,1
40
G1. Net Present
Value
[A + F] $5,580,14
0
G2. Net Present
value function
$5,580,14
0](https://image.slidesharecdn.com/07chap-141214164505-conversion-gate01/85/Chapter-7-The-Investment-Decision-12-320.jpg)
![Taking example 2: discount rate = 20%
Givens 0 1 2 3 4 5
A. Initial
investment
[Given 1] ($28,000)
B. Net opening cash
flows
[Given 2] $8,000 $8,000 $8,000 $8,000 $8,000
C. Cumulative Cash
Flows
(a) ($28,000) $20,000 $12,000 $4,000 $4,000 $12,000
Givens 0 1 2 3 4 5
D. Present value
interest factors
for 15%
ퟏ
(ퟏ + 풊)풏
[Table
B3]
0.8333 0.6944 0.5787 0.4823 0.4019
E. Present value
of cash flows
[B X D] $6,667 $5,556 $4,630 $3,868 $3,215
F. Sum of annual
Cash Flows
[Sum E] $23,925
G1. Net Present
Value
[A + F] $4,075
G2. Net Present
value function
$4,075](https://image.slidesharecdn.com/07chap-141214164505-conversion-gate01/85/Chapter-7-The-Investment-Decision-13-320.jpg)
![Example 3:
Givens (in thousands) Years 0 1 2 3 4 5
1. Initial investment ($5,500)
2. Net Revenues $3,000 $3,000 $3,000 $3,000 $3,000 $3,000
3. Cash operating
expenses
$1,200 $1,200 $1,200 $1,200 $1,200 $1,200
4. Depreciation
Expenses
[a] $940 $940 $940 $940 $940 $940
5. Sale of Asset at
salvage value
$800
6. Cost of capital 12%
7. Change in net
working capital
$0 $0 $0 $0 $0 $0
[a] ($5,500,000 Purchase price - $800,000 salvage value) / 5 years = $940 (in ‘000)](https://image.slidesharecdn.com/07chap-141214164505-conversion-gate01/85/Chapter-7-The-Investment-Decision-14-320.jpg)
![Solution:
Non-Profit Analysis Years 0 1 2 3 4 5
A. Initial investment [Given 1] ($5,500)
B. Net Revenues [Given 2] $3,000 $3,000 $3,000 $3,000 $3,000 $3,000
C. Less: cash operating
expenses before
depreciation
[Given 3] $1,200 $1,200 $1,200 $1,200 $1,200 $1,200
D. Less: Depreciation
Expense
[Given 4] $940 $940 $940 $940 $940 $940
E. Operating Income [B – C - D] 860 860 860 860 860 860
F. Add: Depreciation
Expense
[Given 4] $940 $940 $940 $940 $940 $940
G. Net Operating Cash
Flows
[E+F] 1,800 1,800 1,800 1,800 1,800 1,800
H. Add: sale of assets at
salvage value
[Given 5] 800
I. Adjustments for
changing in working
capital
-[Given 7) $0 $0 $0 $0 $0 $0
J. Recapture of Net
working capital
-[Sum I] $ 0
K. Project cash flows [G+H+I+J] (5,500) $1,800 $1,800 $1,800 $1,800 $2,600](https://image.slidesharecdn.com/07chap-141214164505-conversion-gate01/85/Chapter-7-The-Investment-Decision-15-320.jpg)
![Non-Profit Analysis Years 0 1 2 3 4 5
L. Cost of Capital [Given 6] 12% 12% 12% 12% 12%
M. Present value interest
factors
ퟏ
(ퟏ + 풊)풏
[Table B3] 0.8929 0.7972 0.7118 0.6355 0.5674
N. Annual PV of Cash
flows
[K X M] 1,607 1,435 1,281 1,144 1,475
O. PV of cash Flows [Sum N] $6,943
P. Net Present Value [A + O] $ 1,443
Q. Net Present Value
function check
$ 1,443
Accept Project because NPV is Positive](https://image.slidesharecdn.com/07chap-141214164505-conversion-gate01/85/Chapter-7-The-Investment-Decision-16-320.jpg)
![Example 4: Taking example 1 discount rate = 20%
Givens 0 1 2 3 4 5
A. Initial
investment
[Given 1] ($15,000,0
00)
B. Net opening cash
flows
[Given 2] $2,000,000 $4,000,000 $5,000,000 $8,000,000 $16,000,000
C. Cumulative Cash
Flows
(a) ($15,000,0
00)
$13,000,00
0
$9,000,000 $4,000,000 $4,000,000 $20,000,000
Givens 0 1 2 3 4 5
D. Present value
interest factors
for 15%
ퟏ
(ퟏ + 풊)풏
[Table
B3]
0.8696 0.7561 0.6575 0.5718 0.4972
E. Present value
of cash flows
[B X D] $1,739,13
0
$3,024,57
5
$3,287,581 $4,574,026 $7,954,828
F. Sum of annual
Cash Flows
[Sum E] $20,580,1
40
G1. Net Present
Value
[A + F] $5,580,14
0
G2. Net Present
value function
$5,580,14
0](https://image.slidesharecdn.com/07chap-141214164505-conversion-gate01/85/Chapter-7-The-Investment-Decision-21-320.jpg)
![Givens 0 1 2 3 4 5
H. Present Value
interest factors
for 20%
ퟏ
(ퟏ + 풊)풏
[Table
B3]
0.6944 0.5787 0.4823 0.5718 0.4019
I. Present Values
of Cash Flows
[B X H] $1,666,66
7
$2,777,77
8
$2,893,519 $3,858,025 $6,430,041
J. Sum of Present
Value of cash
flows
[Sum I] $17,626,0
29
K1. Net Present
Value
[A + J] $2, 626,
029
K2. Net Present
Value Function
$2, 626,
029
L. Internal Rate
of Return
25.56%](https://image.slidesharecdn.com/07chap-141214164505-conversion-gate01/85/Chapter-7-The-Investment-Decision-22-320.jpg)


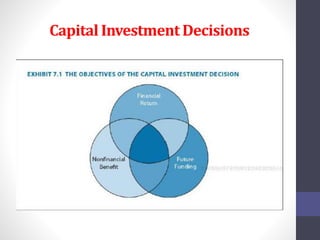
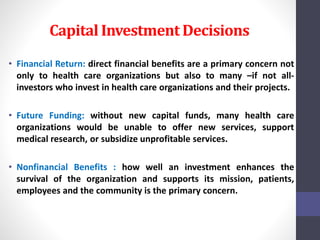
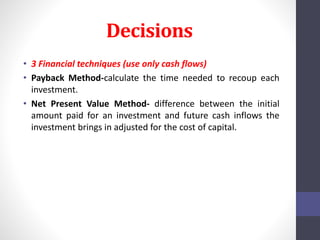
The document discusses methods for evaluating capital investment decisions in healthcare organizations. It introduces the payback period method, which calculates the number of years to recover an initial investment without considering the time value of money. The net present value (NPV) method is presented, which discounts future cash flows to account for the cost of capital and calculates the difference between the initial investment and discounted cash flows. The internal rate of return (IRR) method is also covered, which is the discount rate that makes the NPV equal to zero. Decision rules for accepting or rejecting projects using NPV and IRR are provided.


![5) capital_budgeting_(1)_-(2)[1].ppt.pdf](https://cdn.slidesharecdn.com/ss_thumbnails/5capitalbudgeting121-250323135834-146732f6-thumbnail.jpg?width=640&height=640&fit=bounds)