Download to read offline
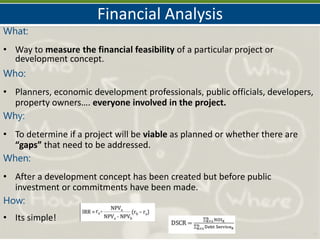

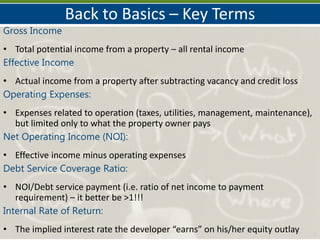
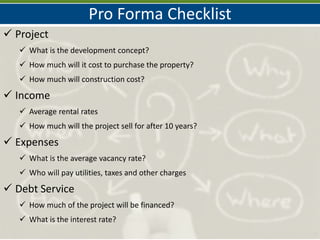
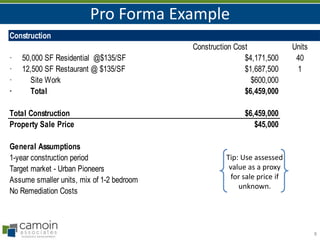
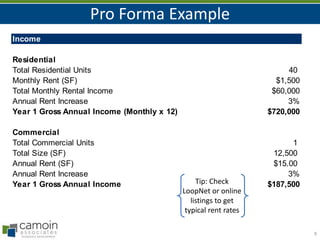
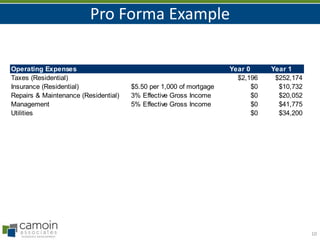
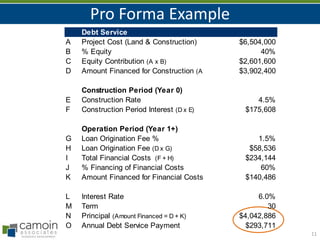
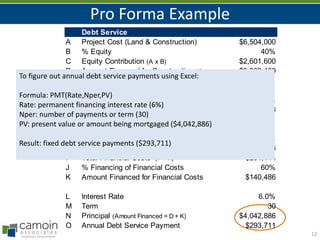
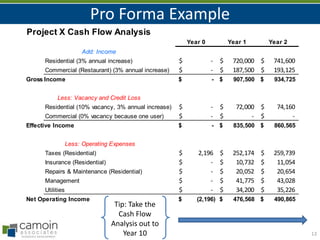
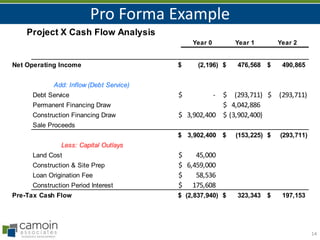


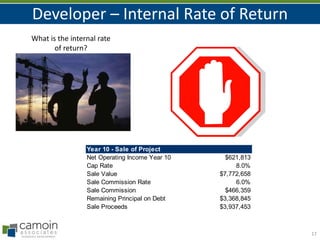
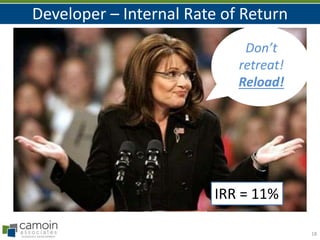


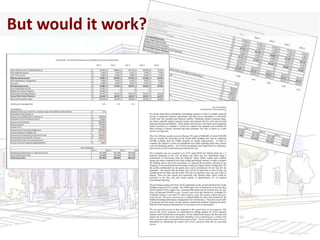


This document provides an overview of financial analysis for planners and discusses how to conduct a pro forma analysis of development projects. It defines key terms like gross income, effective income, operating expenses, net operating income, debt service coverage ratio, and internal rate of return. It then walks through an example pro forma for a mixed-use development project, showing how to calculate items like income, expenses, debt service, cash flows, debt service coverage ratio, and internal rate of return. The document stresses that financial analysis is important to determine if a project is financially feasible and discusses what to do if a project does not work from a numbers perspective.


