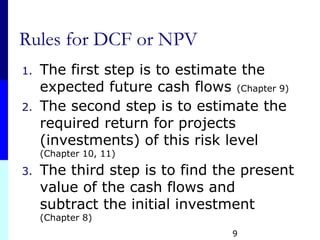
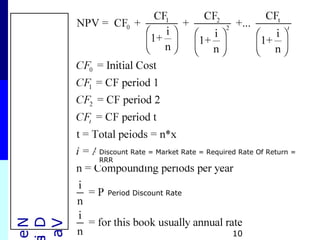
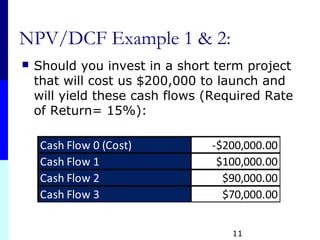
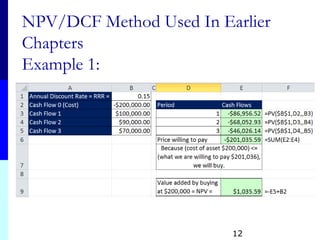
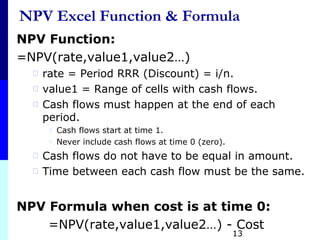
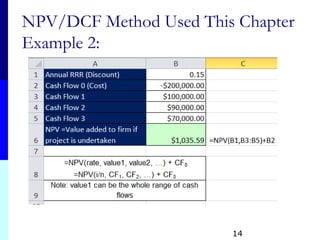
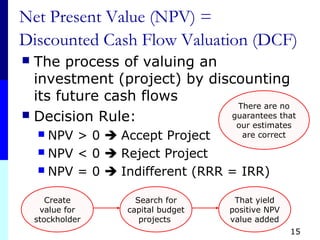
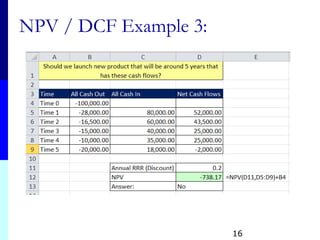
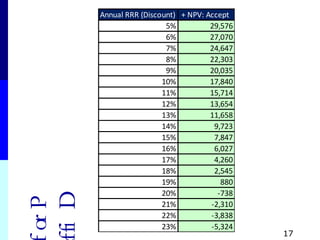
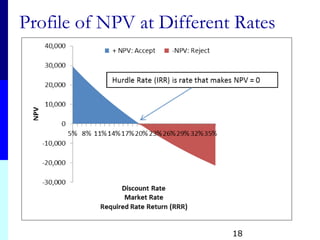
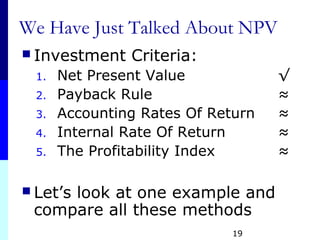
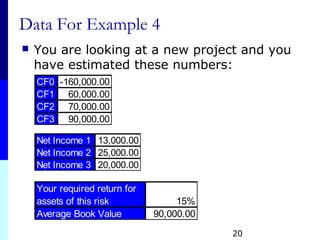
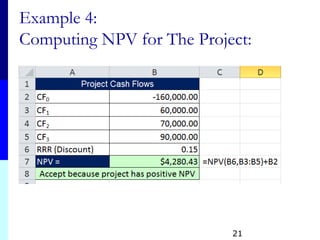
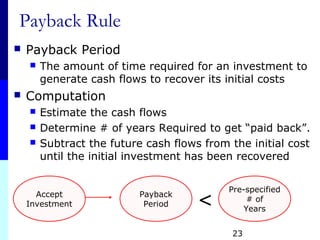
The document discusses various investment criteria for capital budgeting decisions, with a focus on net present value (NPV). It defines NPV as the difference between the present value of a project's expected future cash flows and the initial investment cost. The document also discusses other criteria like payback period, accounting rate of return, and internal rate of return. It provides examples to demonstrate how to calculate NPV and compares it to other criteria. It emphasizes that NPV is preferable because it considers the time value of money and risk, and indicates whether a project will increase firm value.
This document provides an overview and instructor resources for a chapter on capital budgeting techniques from the textbook "Principles of Managerial Finance" by Lawrence J. Gitman. The chapter covers net present value, internal rate of return, payback period, and risk-adjusted discount rates. It includes sample problems, spreadsheet templates, and a study guide for classroom use. The document lists learning goals, solutions to review questions, and solutions to sample problems calculating various capital budgeting metrics for multiple projects.
The document discusses various aspects of capital structure including:
- Defining capital structure and the components that make up a company's financial structure
- Approaches to determine the appropriate capital structure such as EBIT-EPS, valuation, and cash flow approaches
- The concept of optimal capital structure which maximizes share price value and minimizes cost of capital
- Different forms of capital structure such as equity only, combinations of equity and debt, etc.
- The concepts of leverage including operating, financial, and combined leverage and how they impact risk and returns
The document summarizes the evolution of modern portfolio theory from its origins in Harry Markowitz's mean-variance model to subsequent developments like the Sharpe single-index model and CAPM. It discusses how Markowitz showed investors could maximize returns for a given risk level by holding efficient portfolios on the efficient frontier. The Sharpe model reduced the inputs needed for portfolio risk estimation by correlating assets to a market index rather than each other. CAPM then defined the market portfolio as the efficient portfolio and allowed a risk-free asset, changing the shape of the efficient frontier.
The document discusses techniques for measuring investment risk and return, including portfolio diversification. It covers key concepts such as:
- Standard deviation and expected return are commonly used to measure investment risk and expected gains.
- Diversification across multiple investments with low correlations can reduce a portfolio's overall risk.
- Correlation measures how investment returns move together, while regression finds the statistical relationship between them to see how diversification may impact risk.
- Systematic risk cannot be diversified away, while uncorrelated idiosyncratic risks can be reduced through diversification. Alternative risk measures like value-at-risk are also discussed.
This document discusses various topics related to stocks, dividends, and equity markets. It begins by explaining how stock values are related to dividends and dividend growth. It then covers features of common and preferred stocks. The document also discusses how corporate directors are elected and provides an overview of stock markets. Several examples are provided to illustrate stock valuation models including models for constant dividends, constant dividend growth, and non-constant growth. The key differences between debt and equity are also summarized.
1. The chapter discusses the concepts of working capital management, including defining working capital and its components.
2. It analyzes the trade-offs between liquidity, profitability and risk for different levels of current assets. Specifically, it notes profitability varies inversely with liquidity while profitability increases with risk.
3. The chapter also covers approaches to financing current assets, such as hedging short-term assets with short-term financing versus using more long-term financing, and how the current assets decision interacts with the liability structure choice.
This document provides an overview of capital budgeting techniques for evaluating investment projects, including net present value (NPV), internal rate of return (IRR), payback period, and profitability index. It discusses the strengths and weaknesses of each method. The key points are:
- NPV discounts future cash flows to determine if a project's value exceeds its cost, and is the preferred decision criteria. IRR and payback period can give incorrect answers in some situations.
- IRR is the discount rate that yields an NPV of zero, but it has limitations like multiple rates of return or being unreliable for mutually exclusive projects.
- Payback period ignores the time value of money and cash flows after
This document provides an overview of managerial finance. It defines finance and describes the role of the financial manager. The financial manager's responsibilities include raising capital, investing funds to earn a profit, and deciding whether to reinvest profits or distribute them to investors. The document also outlines various career opportunities in finance, different forms of business organization, and the goal of maximizing shareholder wealth. It discusses the relationship between managerial finance, economics, and accounting.
financial management chapter 4 Risk and Returnsufyanraza1
This document provides an overview of key concepts related to risk and return in investments. It defines investment returns as the financial results of an investment expressed in dollar or percentage terms. Investment risk is the probability that the actual return will be lower than expected. Standard deviation measures the stand-alone risk of an investment, while beta measures the risk relative to the overall market. Diversifying investments across multiple uncorrelated assets reduces risk. The Security Market Line shows the relationship between risk and required return based on the Capital Asset Pricing Model.
This document discusses various topics relating to financial assets, including cash, marketable securities, receivables, and notes receivable. It provides information on how these assets are valued for financial statements, cash management techniques, accounting for uncollectible accounts receivable, and calculating interest revenue for notes receivable. Worked examples are provided to illustrate estimating credit losses and recording interest earned on a short-term note receivable.
This document discusses the weighted average cost of capital (WACC) and its components. It addresses how to calculate WACC using the costs of debt, preferred stock, and common equity weighted by the target capital structure. It also discusses adjusting component costs for taxes and risk and determining the weights. Project risk can be standalone, corporate, or market risk and may require adjusting the composite WACC. Risk adjustments are made subjectively based on a project's estimated beta.
This document summarizes key concepts from Chapter 5 of the textbook "Principles of Managerial Finance" by Lawrence J. Gitman. The chapter focuses on risk and return fundamentals including measuring risk of single and multiple assets, the benefits of diversification, and the Capital Asset Pricing Model (CAPM). It provides an overview of the chapter topics, study guide examples, answers to review questions, and solutions to problems to help instructors teach the concepts.
This chapter discusses various capital budgeting techniques for evaluating investment projects, including net present value (NPV), internal rate of return (IRR), payback period, and profitability index. It recommends using NPV as the primary decision rule, as NPV accounts for the time value of money and considers all cash flows. IRR can produce incorrect decisions for projects with multiple IRRs, differing scales of investments, or non-standard cash flow timing. Payback period ignores the time value of money.
The document discusses the role of financial management. It explains that financial management concerns acquiring, financing, and managing assets to achieve an overall goal. It also discusses the goal of the firm being shareholder wealth maximization and the potential agency problems that can arise from the separation of ownership and management in corporations.
This document discusses the cost of capital components, including debt, preferred stock, and common equity. It provides methods for estimating the cost of each component, such as using bond yields for the cost of debt and the dividend yield model for the cost of preferred stock. The document also discusses weighting the components to calculate a weighted average cost of capital (WACC) and how the WACC should be adjusted for divisions that have different risks than the overall company.
Ramesh Kumar N presents information on capital budgeting analysis. He has over 32 years of experience in banking and finance. Capital budgeting is the process of analyzing long-term investment projects to determine if they will increase shareholder value. It is a critical decision for companies, as projects involve large investments and risks. Techniques for evaluating projects include payback period, net present value (NPV), internal rate of return (IRR), and profitability index. NPV is the preferred method as it considers all cash flows and time value of money, consistent with maximizing shareholder wealth.
Here are the key points about reverse repo rate from the document:
- Reverse repo rate is the rate at which the central bank of a country (Reserve Bank of India in case of India) borrows money from commercial banks.
- It is a monetary policy instrument used by the central bank to control money supply. An increase in reverse repo rate will decrease money supply and vice versa.
- When reverse repo rate is increased, it provides more incentive for commercial banks to park their funds with the central bank, thus decreasing the money available in the market.
Capital Budgeting is about how one should evaluate the financing options based on the superior financial performance through mathematical techniques. These techniques have been discussed in the presentation in detail.
This document discusses various capital budgeting techniques used to evaluate investment projects, including payback period, internal rate of return, net present value, and profitability index. It provides an example of applying these methods to evaluate a proposed project for Basket Wonders involving an initial $40,000 investment and cash flows of $10,000, $12,000, $15,000, $10,000, and $7,000 over the next 5 years. Using the required rates of 13% and maximum payback of 3.5 years, all methods except payback period indicate the project should be rejected.
Asset and liability management - Principles and Practices of BankingVIRUPAKSHA GOUD
This document discusses asset liability management (ALM) in banks. It defines ALM as the process of managing a bank's balance sheet to allow for different interest rate and liquidity scenarios. The key risks addressed by ALM are discussed as interest rate risk, currency risk, and liquidity risk. Tools for ALM include information systems to gather asset and liability data, establishing an ALCO committee to set risk limits and make decisions, and ongoing risk measurement and management processes. Specific techniques covered are the structural liquidity statement, interest rate gap analysis, and risk measurement methods like duration and simulation.
This document summarizes key concepts from Chapter 5 of the textbook "Fundamentals of Financial Management" regarding risk and return. It defines return, expected return, risk, and standard deviation as measures of risk. It provides examples of how to calculate expected return and standard deviation for discrete distributions. It also discusses risk attitudes, portfolio return and risk, systematic and unsystematic risk, and the Capital Asset Pricing Model.
1) The document discusses risk and return in the context of the Capital Asset Pricing Model (CAPM). It provides examples of how to calculate expected returns, variance, standard deviation, and covariance for individual securities.
2) It then explains how a portfolio's expected return is a weighted average of the individual securities' expected returns. The portfolio's variance depends on the securities' individual variances as well as their covariances.
3) Diversification reduces a portfolio's risk because unsystematic risk can be eliminated through diversification, whereas systematic risk cannot. The market portfolio represents the minimum risk portfolio for a given level of return.
This document discusses capital requirements for banks and the Basel accords. It provides context for why capital requirements are needed due to risks banks face from loans and investments. It summarizes the objectives and key aspects of Basel I, which was an initial international agreement on capital standards in 1988. It then discusses weaknesses in Basel I that led to its revision and the introduction of Basel II in 2004, which aimed to make capital requirements more risk-sensitive. The document outlines the three pillars of Basel II - minimum capital requirements, supervisory review, and market discipline. It also provides details on the approaches to calculating capital requirements for credit, market and operational risks under Basel II.
The document discusses financial planning and cash flow analysis. It covers topics such as analyzing a firm's cash flow, developing the statement of cash flows, operating cash flow, free cash flow, and the financial planning process. The financial planning process involves long-term strategic planning as well as short-term operating plans and budgets, including cash budgets which forecast expected cash inflows and outflows. Cash flow analysis is important for valuation and financial decision making.
This document discusses various models for portfolio management including the Markowitz model, Sharpe's single index model, Jensen model, and Treynor's model. The Markowitz model aims to minimize risk and maximize return by combining assets. Sharpe's single index model assumes stock prices move with the market index. The Jensen model measures performance by calculating alpha, the return over the expected return based on the risk of the portfolio. Treynor's model measures excess return per unit of systematic risk as measured by a portfolio's beta.
The document discusses money markets and the various securities traded within them. Money markets provide short-term funding for participants and a place for investors to store excess cash. Major securities discussed include Treasury bills, certificates of deposit, commercial paper, and repurchase agreements. These instruments vary in issuers, maturity length, and liquidity. Money markets help corporations and governments manage mismatches between cash inflows and outflows.
This document discusses capital adequacy, capital planning, and approaches to measuring capital adequacy for banks and financial institutions. It defines capital and capital adequacy, and explains that capital adequacy measures a bank's ability to repay depositors and creditors. It also discusses the need for capital adequacy and capital planning to support growth, absorb losses, ensure public confidence, and identify future capital needs. Finally, it outlines different approaches used to measure capital adequacy, including ratio approaches, risk-based approaches, and portfolio approaches.
The document discusses various capital budgeting decision criteria for evaluating investment projects, including net present value (NPV), internal rate of return (IRR), payback period, discounted payback period, average accounting return, and profitability index. It provides the definitions, calculations, and advantages/disadvantages of each method. The key points are that NPV is the preferred decision rule as it accounts for time value of money and risk, while IRR can be unreliable for projects with non-conventional cash flows or when comparing mutually exclusive projects.
The document discusses various capital budgeting methods used to evaluate investment projects. It describes the net present value (NPV) and profitability index (PI) methods. For NPV, a project is accepted if NPV is positive and rejected if negative. PI is the ratio of present value of cash inflows to outflows; a project is accepted if PI is greater than 1 and rejected if less than 1. An example NPV calculation is shown. The document also lists advantages and disadvantages of the NPV method.
This document provides an overview of capital budgeting principles and techniques. It discusses key concepts such as identifying relevant cash flows, evaluation techniques like payback period, accounting rate of return, net present value, and internal rate of return. It also covers the capital budgeting process and types of investment decisions such as expansion, replacement, and contingent investments. The document is intended to teach students about evaluating long-term investment projects and making capital budgeting decisions.
This document provides an overview of various capital budgeting techniques. It begins by introducing capital budgeting techniques under certainty, which are divided into non-discounted cash flow criteria and discounted cash flow criteria. The non-discounted criteria discussed are payback period and accounting rate of return. The discounted cash flow criteria discussed are net present value, internal rate of return, and profitability index. The document then explores each technique in detail and discusses their strengths and weaknesses for evaluating investment projects. It provides examples to illustrate how to calculate each technique.
Intermediate term financing refers to loans between 1 to 10 years. It is provided by private banks, finance companies, and insurance companies. Term loans must be repaid in regular installments over a set period of time and have various repayment structures like straight repayment, balloon payment, or deferred principal payment. Borrowers are subject to covenants restricting dividends, debt levels, and asset sales during the loan term.
The document discusses the Philippine economy and the role of business. It identifies several difficulties hampering the Philippine economy, including low productivity, corruption, a declining currency, and an unfavorable trade balance. It also defines business and classifies the different kinds of business into commerce, industry, and services. The objectives of business are identified as providing goods and services to society, satisfying personal objectives like profits, and protecting social resources in an economical manner.
Bonds, preferred stocks and common stocksSalman Irshad
The document discusses various types of bonds, preferred stocks, and common stocks. It begins by defining basic bond terms like principal amount, coupon rate, maturity date, and bond ratings. It then describes different types of bonds such as secured bonds (mortgage, equipment trust), unsecured bonds (debentures, subordinated), and bonds classified by coupon payments (zero coupon, fixed-rate, floating-rate) or issuer (government, municipal, corporate). The document also discusses bond retirement methods like sinking funds, serial bonds, and call provisions.
Strategic financial management refers to both the financial implications of business strategies and the strategic management of finances. It takes a long-term perspective to facilitate growth, sustainability, and competitive advantage. Strategic financial management deals with investment, financing, liquidity, and dividend decisions and applies financial techniques to strategic decision making to help achieve objectives. An effective strategic financial plan considers scenarios, start-up costs, ongoing costs, revenue, objectives, and what the planning process will accomplish for the organization.
The document discusses capital budgeting, which refers to the process of evaluating long-term investment projects. It describes the various techniques used to evaluate capital budgeting proposals, including non-discounting methods like payback period and accounting rate of return, as well as discounted cash flow methods like net present value, internal rate of return, and profitability index. The stages of the capital budgeting process and sources of financing for capital budgeting decisions are also outlined.
Capital budgeting refers to the process of evaluating investment projects and determining whether they should be accepted or rejected. There are traditional and discounted cash flow methods for evaluating projects. Traditional methods include payback period and accounting rate of return, which do not consider the time value of money. Discounted cash flow methods like net present value (NPV) and internal rate of return (IRR) discount future cash flows to determine if a project will provide sufficient returns. The capital budgeting process involves project generation, evaluation using techniques like NPV or IRR, and selection of projects that meet acceptance criteria.
This document discusses various investment criteria for capital budgeting decisions, with a focus on net present value (NPV). It defines NPV as the difference between the present value of a project's future cash flows and the initial investment cost. The document provides examples of calculating NPV for projects and discusses how NPV accounts for the time value of money and risk. It also discusses other criteria like payback period, accounting rate of return, and internal rate of return. It notes that the internal rate of return is the discount rate that makes the NPV equal to zero. The document compares the advantages and disadvantages of each method and emphasizes that NPV is generally the best criteria to use for capital budgeting decisions.
The document outlines capital budgeting decision criteria such as net present value, internal rate of return, payback period, and profitability index. It provides examples of how to calculate and apply these criteria, including setting up cash flows, computing NPV and IRR, and using pro forma financial statements for project evaluation. The document also discusses key concepts in capital budgeting such as incremental cash flows, multiple rates of return, and mutually exclusive projects.
The group is analyzing an investment in Lockheed's Tri Star aircraft. They are considering whether to invest in the L-1011 Tri Star or its competitors, the DC-10 trijet and Airbus A-300B. The group will use capital budgeting techniques like net present value (NPV) and internal rate of return (IRR) to evaluate the investments and make a recommendation. Capital budgeting is the process used by businesses to determine whether projects such as new equipment or facilities provide sufficient returns to justify the capital expenditures required.
The document discusses present worth analysis and evaluating mutually exclusive project alternatives. It provides examples of calculating net present worth (NPW) to evaluate single projects and compare alternatives. The key points are:
1. Present worth analysis uses discounted cash flow techniques to calculate the net present value (NPW) of projects by discounting cash inflows and outflows.
2. Projects with a positive NPW that exceeds the minimum acceptable rate of return should be accepted.
3. Mutually exclusive alternatives must be compared over an equal time period using NPW.
4. The analysis period may differ from project lifetimes, requiring adjustments like estimating salvage value.
The document discusses various capital budgeting techniques used to evaluate long-term investment projects. It describes traditional methods like payback period and accounting rate of return, as well as discounted cash flow methods like net present value, internal rate of return, and profitability index. These time-adjusted methods account for the time value of money and required rate of return when analyzing projects. The document also discusses factors that introduce risk and uncertainty into capital budgeting decisions.
PGBM01 - MBA Financial Management And Control (2015-16 Trm1 A)Lecture 9 lon...Aquamarine Emerald
This document provides an overview of long-term decision making processes and techniques. It discusses the characteristics of long-term investments, the typical decision making process including initial investigation, evaluation, authorization, implementation and monitoring. It then covers techniques for evaluating investments, including payback period, accounting rate of return, net present value and internal rate of return. An example calculation compares two potential investment projects using these techniques, and recommends selecting the project with the highest net present value or internal rate of return.
The document discusses various capital budgeting techniques for evaluating investment projects. It outlines steps for estimating cash flows, including determining net cash outflows, annual cash flows, and final year cash flows. It then explains several evaluation techniques like average rate of return, payback period, discounted payback period, net present value, internal rate of return, and profitability index. The techniques consider factors like time value of money, risk, and whether the technique is consistent with maximizing shareholder wealth. NPV is highlighted as the preferred technique, though others provide supplementary insights into risk, costs, and returns.
The document discusses various capital budgeting techniques used to evaluate investment projects, including:
1) The cash payback period method which calculates the years to recover initial costs from annual cash flows.
2) The net present value method which discounts future cash flows to determine if a project's present value exceeds costs.
3) The internal rate of return method which calculates the discount rate that sets a project's present value of cash flows equal to its costs.
4) The annual rate of return and profitability index methods which evaluate profitability as a percentage of investment size. Post-audits of actual results are recommended to improve future investment analyses.
Basic terms review
Capital budgeting introduction
Capital budgeting technique
Sensitivity analysis
Scenario analysis
present value
potential difficulties and strength of capital budgeting
Capital budgeting involves planning expenditures for long-term assets that provide returns over several years. It is an important process that requires evaluating projects carefully due to their large size, long-term implications, and irreversible nature. Key aspects of capital budgeting include identifying and evaluating investment proposals, determining which provide the highest expected rates of return, and preparing a capital expenditure budget. Various techniques can be used to evaluate projects, including payback period, accounting rate of return, net present value, internal rate of return, and risk-adjusted methods that account for uncertainty in projected cash flows.
The document discusses various capital budgeting techniques used to evaluate investment projects. It defines key terms like capital budgeting, net present value (NPV), internal rate of return (IRR), payback period, accounting rate of return, profitability index, and modified internal rate of return (MIRR). Examples are provided to demonstrate how to use these methods to calculate NPV, IRR, payback period, and profitability index for investment projects. The modified IRR is also introduced as an alternative to regular IRR in situations where IRR may not provide a unique solution.
Capital budgeting is the process of evaluating long-term investments to maximize shareholder wealth. It involves assessing projects that require fixed assets operating for over one year. The key evaluation techniques are payback period, net present value (NPV), and internal rate of return (IRR), with NPV preferred as it considers total cash flows over time. NPV accepts projects when the present value of inflows exceeds outflows, while IRR accepts projects when the rate of return exceeds the cost of capital.
Investment Decision — Capital Budgeting Techniques — Pay Back Method — Accounting Rate Of Return — NPV — IRR — Discounted Pay Back Method — Capital Rationing — Risk Adjusted Techniques Of Capital Budgeting. — Capital Budgeting Practices.
This document discusses various capital budgeting techniques used to evaluate long-term investment projects. It defines key terms like capital budgeting, cash flows, payback period, discounted payback period, net present value (NPV), internal rate of return (IRR), and profitability index (PI). Formulas for calculating each technique are provided along with examples and decisions criteria. The document also presents a sample assignment comparing two mutually exclusive investment projects based on different evaluation criteria.
This document discusses various capital budgeting techniques used to evaluate potential major projects or investments. It describes traditional non-discounted methods like payback period and accounting rate of return. It also explains discounted cash flow methods like net present value (NPV), profitability index, and internal rate of return (IRR). For each method, it provides examples to demonstrate how to calculate them and how they are used to evaluate projects. The key information is that capital budgeting evaluates the potential cash flows of projects to determine if returns meet benchmarks and whether projects should be accepted or rejected.
The difference between the present value of cash inflows and the present value of cash outflows. NPV is used in capital budgeting to analyze the profitability of an investment or project.
The document discusses various capital budgeting techniques used to analyze long-term investment projects. It describes methods like net present value (NPV), internal rate of return (IRR), payback period, and accounting rate of return. These techniques discount future cash flows to evaluate projects based on factors like profitability, risk, and investment recovery time. The document provides examples of applying these methods to hypothetical projects and comparing the results.
The document discusses various capital budgeting techniques used to evaluate investment projects. It covers topics like the capital budgeting process, investment criteria including payback period, accounting rate of return, net present value, internal rate of return and modified internal rate of return. It provides examples and outlines the key advantages and limitations of each technique.
This document discusses capital budgeting and investment decision making. It defines capital budgeting as the analysis of potential additions to fixed assets that are important long-term decisions for a firm's future. There are three types of capital budgeting projects: independent projects whose cash flows are unrelated; mutually exclusive projects where accepting one precludes the other; and contingent projects where one is dependent on another. The document outlines capital budgeting processes and techniques for evaluating projects, including net present value, internal rate of return, profitability index, payback period, and accounting rate of return. It provides an example project and calculations for each technique to determine whether to accept or reject the project.
Capital budgeting is used to evaluate long-term investment projects. There are two types of capital budgeting decisions - screening decisions determine if a project meets an acceptance standard, and preference decisions select among competing options. Common evaluation methods include payback period, net present value (NPV), and internal rate of return. NPV discounts future cash flows to determine if a project's present value of cash inflows exceeds the present value of cash outflows.
The document discusses various aspects of corporate communication including defining communication, the components and models of communication processes, communicating in work teams, non-verbal communication, business meetings, and business etiquette. It provides details on how information is transmitted between individuals and organizations, the stimulus, filter, message, medium, destination, and feedback in communication, and guidelines for effective communication in meetings, teams, and business settings.
The document discusses key concepts in organizing, including:
1) The definition of an organization as the coordination of people's activities to achieve common goals through division of labor and authority hierarchies.
2) The organizing process involves identifying activities, grouping them, assigning duties, and delegating authority.
3) Important determinants of organizational structure include goals, strategy, size, technology, and the external environment.
4) Span of management refers to the number of direct reports a manager has, which is determined by factors like the work, technology, abilities of managers and subordinates, and degree of decentralization.
This document discusses non-verbal communication and body language. It defines non-verbal communication as communication through gestures, facial expressions, eye contact, posture, touch, and other bodily cues rather than spoken words. It then examines various aspects of non-verbal communication including personal appearance, posture, gestures, facial expressions, eye contact, spatial distances, touch, and artifacts. The document suggests that body language plays a significant role in oral communication and interprets messages on a subconscious level.
The minutes summarize the 1st academic meeting held on October 24, 2009 at IBMR. Key points:
1) Three committees were formed - one to prepare meeting minutes, an internal examination committee headed by Mr. Ravi Eggoni, and an attendance committee headed by Mr. Bidyanand Jha.
2) The executive director, Mr. L.B. Rao, emphasized the importance of teamwork to make IBMR a top business school.
3) It was decided that the first internal exam will be on November 17, 2009. Mr. Eggoni will display the exam timetable by October 28. The exam will include different types of questions worth a total of 50 marks over 1 hour
The document outlines an executive communication course to be completed by November 16, 2009. Unit 1 on types of communication and principles of effective communication is complete. Unit 2 on correspondence including letters for different situations is complete except for sales promotion letters and customer complaints. Future units will cover report writing, non-verbal communication, conducting meetings, and group discussions. The five units must be finished by the specified date.
Dyadic communication refers to an interaction between two individuals. It provides ideal conditions for close-range feedback as the interactions are person-to-person. Fidelity is high as reactions are mutually observable. Common forms of dyadic communication include face-to-face conversations, telephone conversations, interviews, and instruction. Face-to-face conversation is the most common, linking people socially and professionally through informal exchanges of views and ideas, with participants alternating between speaking and listening roles. Effective face-to-face conversations require analyzing one's habits, maintaining interest, flexibility in topics, and courtesy.
The document discusses various barriers to communication, including environmental barriers like noise, individual barriers like judging others, and organizational barriers where messages get distorted as they pass through hierarchies. It provides an example of how a message about viewing a comet gets distorted as it passes through different levels in an organization. Other barriers mentioned include wrong choice of communication channel, linguistic barriers between cultures, and conflicting nonverbal communication. The document recommends overcoming these barriers through encouraging feedback, creating an open climate, using multiple communication channels, active listening, careful wording, and selecting the right channel.
Business Finance Chapter 11 Risk and returnTinku Kumar
This chapter discusses predicting stock market returns and measuring risk. It introduces expected returns and standard deviation as measures of average return and risk. It then discusses how new, unexpected information can impact stock prices and returns. It also introduces beta as a measure of a stock's systematic, market risk. The chapter concludes by discussing the security market line and capital asset pricing model, which relate expected return and risk by establishing the market risk premium.
This document summarizes key lessons from analyzing historical capital market returns between 1926-2008:
1. There is typically a reward for bearing more risk, as seen by higher average returns for asset classes like stocks compared to less risky treasury bills. However, riskier assets also experience greater variability in returns.
2. Variability, or volatility, in returns is a measure of risk. Greater variability is seen in scatter plots and frequency distributions that show a wider spread of returns for riskier assets like stocks versus less variable returns for treasury bills.
3. While history shows average returns that reward risk, the future is unpredictable and past performance does not guarantee future results, as seen from periods like 2000-2002
This document discusses various topics related to making capital investment decisions, including relevant cash flows for projects, cash flows from accounting numbers, MACRS tax depreciation rules, and sensitivity analysis. It provides examples of calculating net present value from pro forma financial statements and cash flows. It emphasizes that actual future cash flows are unknown and discusses using scenario and sensitivity analysis to account for forecasting risk when evaluating projects.
This chapter discusses corporate strategy and foreign direct investment. It covers the theory of the multinational corporation, including why firms engage in FDI and different types of market integration. The chapter also examines the strategy of the multinational enterprise depending on the firm's stage of development. Finally, it outlines the necessary elements for designing a global expansion strategy, such as selecting a mode of entry, adjusting the effectiveness of the entry mode, and estimating how long competitive advantages will last overseas.
This document discusses considerations for multinational capital budgeting. It compares capital budgeting analyses from the perspective of a parent company versus a subsidiary and identifies factors that create differences in their cash flows, such as taxes, regulations on transferring funds, and exchange rate movements. The document also outlines inputs needed for multinational capital budgeting analyses and methods for assessing risk.
This chapter discusses how multinational corporations (MNCs) can manage economic exposure and translation exposure from exchange rate fluctuations. Economic exposure refers to the impact of exchange rates on a firm's future cash flows. An MNC can assess its economic exposure under different exchange rate scenarios and then restructure operations like changing foreign sales, suppliers, or debt levels to balance exchange-rate-sensitive cash flows. Translation exposure results from translating subsidiary financials into the parent currency for reporting. While it does not directly affect cash flows, some firms hedge it using forward contracts to offset potential impact on reported earnings. Effective management of exposure requires long-term strategies rather than short-term fixes.
The document discusses the Foreign Exchange Management Act (FEMA) of India. It provides the following key details:
1. FEMA was passed in 1999 to replace the Foreign Exchange Regulation Act and make foreign exchange offenses civil offenses. It extends to all of India.
2. Unlike the previous act, FEMA took a more liberal approach by making everything permitted unless specifically prohibited, compared to prohibiting everything unless permitted.
3. The act gave the central government power to impose restrictions on foreign exchange transactions and the holding of foreign assets by Indian residents.
This document provides an overview of international financial management. It discusses the globalized business environment and the financial challenges that managers face. Key topics covered include international financial markets, the goals and risks of multinational corporations, types of foreign exchange exposure, and important terms in international finance such as letters of credit, balance of payments, and authorized dealers. The document aims to introduce readers to the complex field of managing financial issues that arise in international trade and global business operations.
This document discusses foreign direct investment (FDI), international portfolio investment, and multinational capital budgeting. It provides reasons why firms invest abroad, how FDI flows occur, determinants of FDI volume, composition of FDI, direction of FDI flows, and processes for multinational capital budgeting. Key points include firms investing abroad for new markets, resources, and efficiencies; FDI occurring through exports, joint ventures, and acquisitions; volume of FDI depending on factors like profitability, infrastructure, and policies; composition including physical assets, intellectual property, and equity; and methods for evaluating foreign investment projects.
The document provides an overview of India's foreign exchange management policy and foreign trade scenario over the years. It discusses the evolution from strict controls under FERA to a more liberalized management system under FEMA. Foreign exchange reserves have increased substantially from $6 billion in 1991 to over $270 billion in 2007 due to large capital inflows. Exports and imports have both increased steadily over the years, with imports generally exceeding exports, leading to a trade deficit.
This document discusses various mechanisms used by multinational corporations to transfer funds between subsidiaries to reduce taxes and take advantage of regulatory differences. It describes mechanisms like transfer pricing, where internal prices are adjusted to shift profits between high and low tax jurisdictions. Reinvoicing centers, where a center in a low tax nation handles invoicing to gain currency and tax advantages, are also discussed. The document provides examples and details of these various intercompany fund transfer mechanisms used by multinational financial systems.
The document provides a sample test for an Alternate Investment course. It includes 31 multiple choice questions testing concepts related to hedge funds, real estate, venture capital, and other alternative investments. Key topics covered include types of biases that can affect hedge fund performance tracking, calculating net asset value and property valuations, stages of venture capital investing, and characteristics of different fund structures like ETFs, open-end funds, and closed-end funds. The majority of the questions can be answered by applying basic financial concepts to information provided in the question stem.
The document contains a 13 question quiz on fixed income concepts. The questions cover topics like bond pricing, duration, convexity, yield curves, and spreads. Sample questions calculate the price value of a basis point (PVBP) for a bond, determine the duration of a bond portfolio, and identify the order of market yields for different types of municipal bonds from highest to lowest.
Abhay Bhutada, the Managing Director of Poonawalla Fincorp Limited, is an accomplished leader with over 15 years of experience in commercial and retail lending. A Qualified Chartered Accountant, he has been pivotal in leveraging technology to enhance financial services. Starting his career at Bank of India, he later founded TAB Capital Limited and co-founded Poonawalla Finance Private Limited, emphasizing digital lending. Under his leadership, Poonawalla Fincorp achieved a 'AAA' credit rating, integrating acquisitions and emphasizing corporate governance. Actively involved in industry forums and CSR initiatives, Abhay has been recognized with awards like "Young Entrepreneur of India 2017" and "40 under 40 Most Influential Leader for 2020-21." Personally, he values mindfulness, enjoys gardening, yoga, and sees every day as an opportunity for growth and improvement.
2. Elemental Economics - Mineral demand.pdfNeal Brewster
After this second you should be able to: Explain the main determinants of demand for any mineral product, and their relative importance; recognise and explain how demand for any product is likely to change with economic activity; recognise and explain the roles of technology and relative prices in influencing demand; be able to explain the differences between the rates of growth of demand for different products.
Financial Assets: Debit vs Equity Securities.pptxWrito-Finance
financial assets represent claim for future benefit or cash. Financial assets are formed by establishing contracts between participants. These financial assets are used for collection of huge amounts of money for business purposes.
Two major Types: Debt Securities and Equity Securities.
Debt Securities are Also known as fixed-income securities or instruments. The type of assets is formed by establishing contracts between investor and issuer of the asset.
• The first type of Debit securities is BONDS. Bonds are issued by corporations and government (both local and national government).
• The second important type of Debit security is NOTES. Apart from similarities associated with notes and bonds, notes have shorter term maturity.
• The 3rd important type of Debit security is TRESURY BILLS. These securities have short-term ranging from three months, six months, and one year. Issuer of such securities are governments.
• Above discussed debit securities are mostly issued by governments and corporations. CERTIFICATE OF DEPOSITS CDs are issued by Banks and Financial Institutions. Risk factor associated with CDs gets reduced when issued by reputable institutions or Banks.
Following are the risk attached with debt securities: Credit risk, interest rate risk and currency risk
There are no fixed maturity dates in such securities, and asset’s value is determined by company’s performance. There are two major types of equity securities: common stock and preferred stock.
Common Stock: These are simple equity securities and bear no complexities which the preferred stock bears. Holders of such securities or instrument have the voting rights when it comes to select the company’s board of director or the business decisions to be made.
Preferred Stock: Preferred stocks are sometime referred to as hybrid securities, because it contains elements of both debit security and equity security. Preferred stock confers ownership rights to security holder that is why it is equity instrument
<a href="https://www.writofinance.com/equity-securities-features-types-risk/" >Equity securities </a> as a whole is used for capital funding for companies. Companies have multiple expenses to cover. Potential growth of company is required in competitive market. So, these securities are used for capital generation, and then uses it for company’s growth.
Concluding remarks
Both are employed in business. Businesses are often established through debit securities, then what is the need for equity securities. Companies have to cover multiple expenses and expansion of business. They can also use equity instruments for repayment of debits. So, there are multiple uses for securities. As an investor, you need tools for analysis. Investment decisions are made by carefully analyzing the market. For better analysis of the stock market, investors often employ financial analysis of companies.
5 Tips for Creating Standard Financial ReportsEasyReports
Well-crafted financial reports serve as vital tools for decision-making and transparency within an organization. By following the undermentioned tips, you can create standardized financial reports that effectively communicate your company's financial health and performance to stakeholders.
Falcon stands out as a top-tier P2P Invoice Discounting platform in India, bridging esteemed blue-chip companies and eager investors. Our goal is to transform the investment landscape in India by establishing a comprehensive destination for borrowers and investors with diverse profiles and needs, all while minimizing risk. What sets Falcon apart is the elimination of intermediaries such as commercial banks and depository institutions, allowing investors to enjoy higher yields.
BONKMILLON Unleashes Its Bonkers Potential on Solana.pdfcoingabbar
Introducing BONKMILLON - The Most Bonkers Meme Coin Yet
Let's be real for a second – the world of meme coins can feel like a bit of a circus at times. Every other day, there's a new token promising to take you "to the moon" or offering some groundbreaking utility that'll change the game forever. But how many of them actually deliver on that hype?
Lecture slide titled Fraud Risk Mitigation, Webinar Lecture Delivered at the Society for West African Internal Audit Practitioners (SWAIAP) on Wednesday, November 8, 2023.
OJP data from firms like Vicinity Jobs have emerged as a complement to traditional sources of labour demand data, such as the Job Vacancy and Wages Survey (JVWS). Ibrahim Abuallail, PhD Candidate, University of Ottawa, presented research relating to bias in OJPs and a proposed approach to effectively adjust OJP data to complement existing official data (such as from the JVWS) and improve the measurement of labour demand.
1. Net Present Value And
Other Investment Criteria
Chapter 8
TINKU
IBMR - H
2. 2
Topics
1. First Look at Capital Budgeting
2. Investment Criteria:
1. Net Present Value √
2. Payback Rule ≈
3. Accounting Rates Of Return ≈
4. Internal Rate Of Return ≈
5. The Profitability Index ≈
3. 3
Financial Management
Goal Of Financial Management:
Increasing the value of the equity
Capital Budgeting:
Acquire long-term assets
Because long-term assets:
Determine the nature of the firm
Are hard decisions to reverse
They are the most important decisions for the
financial manager
Selecting Assets
Whish assets to invest in?
There are many options.
Which do we pick?
4. 4
Good Decision Criteria For
Capital Budgeting
We need to ask ourselves the
following questions when evaluating
decision criteria
Does the decision rule adjust for the
time value of money?
Does the decision rule adjust for risk?
Does the decision rule provide
information on whether we are creating
value for the firm?
5. Net Present Value = NPV
The difference between the market value and
it’s cost = Value Added.
Example:
Point of View = Asset Buyer
If:
Cost = -$200,000
Market Value (Present Value Future Cash Flows) =
$201,036
NPV = $201,036 - $200,000 = $1,036
We examine a potential investment in light of its
likely effect on the price of the firm’s shares
NPV/(# of shares outstanding)
5
6. 6
NPV
If there is a market for assets similar
to the one we are considering investing
in, we use that market and our
decision making is simplified
When we cannot observe a market
price for at least a roughly comparable
investment, capital budgeting is made
difficult… then we use:
Discounted Cash Flow
Valuation (DCF) to get our NPV
DCF gives us an estimate of market value.
9. 9
Rules for DCF or NPV
1. The first step is to estimate the
expected future cash flows (Chapter 9)
2. The second step is to estimate the
required return for projects
(investments) of this risk level
(Chapter 10, 11)
3. The third step is to find the present
value of the cash flows and
subtract the initial investment
(Chapter 8)
11. NPV/DCF Example 1 & 2:
Should you invest in a short term project
that will cost us $200,000 to launch and
will yield these cash flows (Required Rate
of Return= 15%):
11
Cash Flow 0 (Cost) -$200,000.00
Cash Flow 1 $100,000.00
Cash Flow 2 $90,000.00
Cash Flow 3 $70,000.00
13. NPV Excel Function & Formula
NPV Function:
=NPV(rate,value1,value2…)
⃰ rate = Period RRR (Discount) = i/n.
⃰ value1 = Range of cells with cash flows.
⃰ Cash flows must happen at the end of each
period.
⃰ Cash flows start at time 1.
⃰ Never include cash flows at time 0 (zero).
⃰ Cash flows do not have to be equal in amount.
⃰ Time between each cash flow must be the same.
NPV Formula when cost is at time 0:
=NPV(rate,value1,value2…) - Cost
13
15. 15
Net Present Value (NPV) =
Discounted Cash Flow Valuation (DCF)
The process of valuing an
investment (project) by discounting
its future cash flows
Decision Rule:
NPV > 0 Accept Project
NPV < 0 Reject Project
NPV = 0 Indifferent (RRR = IRR)
Create
value for
stockholder
Search for
capital budget
projects
That yield
positive NPV
value added
There are no
guarantees that
our estimates
are correct
19. 19
We Have Just Talked About NPV
Investment Criteria:
1. Net Present Value √
2. Payback Rule ≈
3. Accounting Rates Of Return ≈
4. Internal Rate Of Return ≈
5. The Profitability Index ≈
Let’s look at one example and
compare all these methods
20. 20
Data For Example 4
You are looking at a new project and you
have estimated these numbers:
CF0 -160,000.00
CF1 60,000.00
CF2 70,000.00
CF3 90,000.00
Net Income 1 13,000.00
Net Income 2 25,000.00
Net Income 3 20,000.00
Your required return for
assets of this risk 15%
Average Book Value 90,000.00
22. 22
Advantages of NPV Rule
Rule adjusts for the time value of
money
Rule adjusts for risk (RRR - Discount Rate)
Rule provides information on
whether we are creating value for
the firm
23. 23
Payback Rule
Payback Period
The amount of time required for an investment to
generate cash flows to recover its initial costs
Computation
Estimate the cash flows
Determine # of years Required to get “paid back”.
Subtract the future cash flows from the initial cost
until the initial investment has been recovered
Accept
Investment
Payback
Period
Pre-specified
# of
Years
<
24. 24
Data For Example 5
You are looking at a new project and you
have estimated these numbers:
CF0 -160,000.00
CF1 60,000.00
CF2 70,000.00
CF3 90,000.00
Net Income 1 13,000.00
Net Income 2 25,000.00
Net Income 3 20,000.00
Your required return for
assets of this risk 15%
Average Book Value 90,000.00
25. 25
Example 5:
Computing Payback For The Project
Assume we will accept the project if it pays
back within two years.
Year 1: 160,000 – 60,000 = 100,00 still to
recover
Year 2: 100,000 – 70,000 = 30,000 still to
recover
Do we accept or reject the project?
Reject. The project did not pay back
within 2 years.
27. 27
Decision Criteria Test - Payback
Does the payback rule account for
the time value of money?
Does the payback rule account for
the risk of the cash flows?
Does the payback rule provide an
indication about the increase in
value?
Should we consider the payback rule
for our primary decision criteria?
28. 28
Advantages & Disadvantages of Payback
Advantages
Easy to understand
Cost to do this analysis
is minimal – good for
small investment
decisions
Adjusts for uncertainty
of later cash flows
(gets rid of them)
Biased towards liquidity
(tends to favor
investments that free
up cash for other uses
more quickly)
Disadvantages
Ignores the time value of money
Fails to consider risk differences
Risky or very risky projects are
treated the same
Requires an arbitrary cutoff
point
Ignores cash flows beyond the
cutoff date
Biased against long-term
projects, such as research and
development, and new projects
Does not guarantee a single
answer
Does not ask the right question:
Does it increase equity value?
You have to estimate the cash
flows any way, so why not take
the extra time to calculate NPV?
29. Problems with Payback Rule:
29
Years Required to Pay Back Investment = 2
Year Pro A Pro B Pro C
0 -$250 $250 -$250
1 100 100 100
2 100 100 200
3 -250 100
4 250 100
Accept or Reject?
Yes, but is it year 2
or 4?
No. Because only
$200 by year 2.
Yes. Because $300
Cash In by year 2.
Problems: We get 2 answers
Ignores cash flows
after year 2.
This project has a
negative NPV -
ignores time value
of $.
NPV = $535.50 -$11.81
Required Return: 0.15
30. 30
Average Accounting Return = AAR
There are many different definitions for
Average Accounting Return.
Here is one:
Here is another:
Calculate (Return On Assets = ROA) for
each year and then average the ROAs.
Average Net Income
Average Book Value
= AAR
31. Average Accounting Return = AAR
Steps in calculating AAR:
1. Estimate All Revenue and Expenses over
the life of the asset.
2. Calculate the Net Income for each year.
3. Estimate Book Value over life of asset.
Note that the average book value depends on
how the asset is depreciated.
1. Decide on target cutoff AAR rate
2. Decision Rule:
Accept the project if the calculated
AAR > cutoff AAR rate.
31
32. 32
Average Book Value =
When Straight Line Depreciation is
used:
(Cost + Salvage)/2
When a Non- Straight Line
Depreciation is used:
(BV0 + BV1 +…BVt)/(t+1)
33. 33
Data For Example 6
You are looking at a new project and you
have estimated these numbers:
CF0 -160,000.00
CF1 60,000.00
CF2 70,000.00
CF3 90,000.00
Net Income 1 13,000.00
Net Income 2 25,000.00
Net Income 3 20,000.00
Your required return for
assets of this risk 15%
Average Book Value 90,000.00
34. 34
Com
Exa
Year 1 Year 2 Year 3
Revenue $80,000 $70,000 $65,000
Expenses (including
Depreciation and Tax) $67,000 $45,000 $45,000
Net Income $13,000 $25,000 $20,000
Average Net Income $19,333 =AVERAGE(B4:D4)
Original Cost $180,000
Salvage $0
Years 3
Striaght Line Deprectaion $60,000 =(B8-B9)/B10
Time 0 Time 1 Time 2 Time 3
Book Value = Historical
Cost - Accumulated
Depreication $180,000 $120,000 $60,000 $0
Average Book Value $90,000 =AVERAGE(B14:E14)
Average Book Value $90,000 =B8/2
AAR 0.214814815 =B6/B17
Target AAR 0.25
Decision: Reject Project
35. 35
Decision Criteria Test - AAR
Does the AAR rule account for the
time value of money?
Does the AAR rule account for the
risk of the cash flows?
Does the AAR rule provide an
indication about the increase in
value?
Should we consider the AAR rule for
our primary decision criteria?
36. 36
Advantages and Disadvantages of
AAR
Advantages
Easy to calculate
Needed
information will
usually be
available
Disadvantages
Not a true rate of
return; time value of
money is ignored
Uses an arbitrary
benchmark cutoff rate
Based on accounting
net income and book
values, not cash flows
and market values
38. Solve For Rate
Remember:
Chapter 5 (Annuities and Multiple Cash Flows)
Chapter 6 (Bonds)
We learned that we can solve for rate.
For Annuities or Bonds we were able to look at
cash flows and determine the rate.
Chapter 8 (Multiple Cash Flows for Buying Assets)
Just as YTM was “internal rate” of cash flows for
bonds, IRR will be “internal rate” of cash flows
for capital budgeting.
We solve for the rate at which the NPV is zero
and that becomes the hurdle rate between +
NPV and – NPV. 38
39. IRR = Internal Rate of Return
To Understand What IRR means, build a NPV Profile and
look for the rate at which NPV = $0
This tells you the rate of return for the cash flows from
the project.
Project Cash Flows
CF0 -160,000.00
CF1 60,000.00
CF2 70,000.00
CF3 90,000.00
Required Rate Return 0.15
RRR NPV
14.00% 7,241.74
14.50% 5,750.17
15.00% 4,280.43
15.50% 2,832.09
16.00% 1,404.73
16.50% 0.00
17.00% -1,386.63
17.50% -2,753.47
18.00% -4,100.89
18.50% -5,429.27
19.00% -6,738.96
0)
39
40. IRR = Internal Rate of Return
IRR = Rate at Which NPV = $0
40
All RRR below
IRR, add value
(+NPV)
All RRR above
IRR, subtract
value (-NPV)
0)
41. 41
IRR = Internal Rate of Return =“Break Even Rate”
Definition: Rate that makes the NPV = $0
Decision Rule:
Most important alternative to NPV.
It is often used in practice and is intuitively appealing.
Calculation based entirely on the estimated cash flows
and is independent of interest rates found elsewhere
Formula inputs are cash flows only!
Accept
Investment
IRR RRR
>
42. IRR Excel Function
IRR Function:
=IRR(values,guess)
⃰ values = range of cells with cash flows. Cash out is
negative, cash in is positive. Range of values must contain
at least one positive and one negative value.
⃰ Guess is not required. But if you get a #NUM! error, try
different guesses – ones you think might be close.
⃰ Cash flows must happen at the end of each period.
⃰ Cash flows start at time 0.
⃰ Cash flows do not have to be equal in amount.
⃰ Time between each cash flow must be the same.
⃰ IRR gives you the period rate. If you give it annual cash
flows, it gives you annual rate, if you give it monthly cash
flows, it gives you monthly rate.
⃰ **Don’t use IRR for investments that have non-conventional cash flows (cash flow
other than time 0 is negative) or the investments are mutually exclusive alternatives
and initial cash flows are substantially different or timing are substantially different.
42
43. 43
Data For Example 7
You are looking at a new project and you
have estimated these numbers:
CF0 -160,000.00
CF1 60,000.00
CF2 70,000.00
CF3 90,000.00
Net Income 1 13,000.00
Net Income 2 25,000.00
Net Income 3 20,000.00
Your required return for
assets of this risk 15%
Average Book Value 90,000.00
44. 44
Computing IRR For The Project
Example 7:
Formula Inputs
are cash flows
– that’s it!
If you do not
have Excel or a
financial
calculator, then
this becomes a
trial and error
process.
45. Trial And Error Process: Build Profile And
“Zero In On” the IRR.
45
Project Cash Flows
CF0 -1,000.00
CF1 1,200.00
Solve for directly when
exponent is 4 or less (But no
need to).
NPV = -CF0 + CF1/(1+IRR)
0 = -1,000 + 1,200/(1+IRR)
1,000 = 1,200/(1+IRR)
1 + IRR = 1,200/1,000
IRR = 1,200/1,000 -1
IRR = 0.2
Project Cash Flows
CF0 -160,000.00
CF1 60,000.00
CF2 70,000.00
CF3 90,000.00
Required Rate Return 0.15
Increment 0.005
RRR (Discount) + NPV
14.0% 7,241.74
14.5% 5,750.17
15.0% 4,280.43
15.5% 2,832.09
16.0% 1,404.73
16.5% -2.05
17.0% -1,388.65
17.5% -2,755.46
18.0% -4,102.85
18.5% -5,431.20
46. 46
Decision Criteria Test - IRR
Does the IRR rule account for the
time value of money?
Does the IRR rule account for the
risk of the cash flows?
Does the IRR rule provide an
indication about the increase in
value?
Should we consider the IRR rule for
our primary decision criteria?
No! Because of two circumstances…
47. 47
Advantages of IRR
Knowing a return is intuitively appealing.
It is a simple way to communicate the
value of a project to someone who
doesn’t know all the estimation details.
If the IRR is high enough, you may not
need to estimate a required return, which
is often a difficult task.
In the working world, many people use
IRR.
48. 48
Summary of Decisions For The
Project
Summary
Net Present Value Accept
Payback Period Reject
Average Accounting Return Reject
Internal Rate of Return Accept
49. Define
Mutually Exclusive
A situation were
taking one project
prevents you from
taking another
project.
Ex: With the land,
you can build a farm
or a factory, not
both.
Not Both.
Independent
Taking one project does
not affect the taking of
another project.
Ex: If you buy machine A,
you can also buy machine
B, or not.
Ex: Cash flows from
Project A do not affect
cash flows for Project B.
Projects that are Not
Mutually Exclusive are
said to be Independent.
49
50. 50
NPV & IRR
NPV and IRR will generally give us the same
decision if:
Conventional Cash Flows =
Cash flow time 0 is negative.
Remaining cash flows are positive.
Projects (investments) Are Independent:
The decision to accept/reject this project does not
affect the decision to accept/reject any other project.
Independent = “not mutually exclusive”.
OK to use
IRR or NPV
Both give
same
answer.
51. 51
DO NOT Use IRR, Instead Use NPV
DO NOT use IRR for projects that have
non-conventional cash flows
DO NOT use IRR for projects that are
mutually exclusive.
NOT OK to use IRR
Use NPV instead
52. 52
IRR and Nonconventional Cash
Flows
When the cash flows change sign more
than once, there is more than one IRR
When you solve for IRR you are solving
for the root of an equation and when you
cross the x-axis more than once, there
will be more than one return that solves
the equation
If you have more than one IRR, which
one do you use to make your decision?
54. 54
Summary of Decision Rules
The NPV is positive at a required
return of 15%, so you should
Accept.
If you use Excel, you would get an
IRR of 14% which would tell you to
Reject.
You need to recognize that there are
non-conventional cash flows and use
NPV for decision rule.
55. 55
IRR and Mutually Exclusive Projects
So far we have only asked the question:
“Should we invest our $ in Project A?”
But what if we ask: “Should we invest our $
in Project A or B?”
Mutually exclusive projects
If you choose one, you can’t choose the
other
Example: You can choose Investment A or
B, but not both.
56. 56
Example 9: Mutually Exclusive Projects
The required return
for both projects is
10%.
Which project
should you accept
and why?
Period Cash Flow A Cash Flow B
0 -5,500.0 -5,500.0
1 2,500.0 1,100.0
2 2,200.0 2,200.0
3 2,200.0 2,750.0
4 1,650.0 3,000.0
57. Example 9: NPV and IRR Can Give Different Answers.
For These Cash Flows, When RRR = 10%, We Get
Different Answers.
Total cash flows are
larger, but payback
more slowly, so
higher NPV at low
RRR
Mutually Exclusive Projects (Investements)
RRR 10%
Period Cash Flow A Cash Flow B
0 -5,500.0 -5,500.0
1 2,500.0 1,100.0
2 2,200.0 2,200.0
3 2,200.0 2,750.0
4 1,650.0 3,000.0
IRR 0.2183 0.1986
NPV 1,370.8 1,433.3
At RRR = 10%, we use NPV as criteria and accept B.
57
58. Example 9: NPV and IRR
NPV Profile shows that NPV depends on RRR.
IRR is the same no matter what the RRR is.
Bigger cash flows in
early years means
they are less affected
by large RRR (cash
flows closer to time
zero are less affected
by discounting (less
time to compound))
Payback is quicker,
so higher NPV at
high RRR.
Mutually Exclusive Projects (Investements)
RRR 17%
Period Cash Flow A Cash Flow B
0 -5,500.0 -5,500.0
1 2,500.0 1,100.0
2 2,200.0 2,200.0
3 2,200.0 2,750.0
4 1,650.0 3,000.0
IRR 0.2183 0.1986
NPV 498.0 365.3
At RRR = 17%, we use NPV as criteria and accept A. 58
59. NPV B > NPV A,
When Discount
Rate < 12%
Ranking conflict:
IRR & NPV give
different answers
NPV A > NPV B,
When Discount
Rate > 12%
No ranking conflict:
IRR and NPV
give same answer
Example 9: NPV Profile shows that
NPV depends on RRR.
ME – Don’t Use IRR, use NPV.
NPV B
NPV A
59
60. 60
Conflicts Between NPV and IRR
NPV directly measures the increase
in value to the firm
Whenever there is a conflict
between NPV and another decision
rule, you should always use NPV
IRR is unreliable in the following
situations
Non-conventional cash flows
Mutually exclusive projects
62. Modified Internal Rate of Return (MIRR)
3 different methods
Controversial:
Not one way to calculate MIRR (different results that with
large values and long time frames can lead to large
differences).
Is it really a rate if it comes from modified cash flows?
Why not just use NPV?
If you use a discount rate to get modified cash flows, you
can not get a true IRR.
Cash reinvested may be unrealistic because, who knows if
the rate that you are using for discounting is the same
rate that would be applied to a cash flow that might be
used for any number of things.
62
63. 63
Profitability Index (Benefit Cost Ratio)
PI Formula= PVFCF/Initial Cost
PI > 1, accept project
PI < 1, reject project
Measures the benefit per unit cost, based on the
time value of money
A profitability index of 1.1 implies that for every
$1 of investment, we create an additional $0.10
in value
Use this PI Formula = PVFCF/Initial Cost – 1
This measure can be very useful in situations
where we have limited capital (can’t do all
projects, then select greater PI)
65. 65
Advantages and Disadvantages of
Profitability Index
Advantages
Closely related to
NPV, generally
leading to identical
decisions
Easy to understand
and communicate
May be useful
when available
investment funds
are limited
Disadvantages
May lead to
incorrect decisions
in comparisons of
mutually exclusive
investments
Scale is not
revealed
10/5 = 1000/500
66. 66
Capital Budgeting In Practice
We should consider several investment
criteria when making decisions
NPV and IRR are the most commonly
used primary investment criteria
Payback is a commonly used secondary
investment criteria
Why so many? Because they are all only
estimates!
The financial manager acts in the
stockholder’s best interest by identifying
and taking positive NPV projects
68. 68
Quick Quiz
Consider an investment that costs $150,000
and has a cash inflow of $38,500 every year
for 6 years and in 7th
year the cash flow is
$2,000. The required return is 15% and
required payback is 3 years.
What is the payback period?
What is the NPV?
What is the IRR?
Should we accept the project?
What decision rule should be the primary
decision method?
When is the IRR rule unreliable?
70. Multiple IRRs
Descartes Rule of Signs
Polynomial of degree n→n roots
When you solve for IRR you are solving for
the root of an equation
One positive ?? real root per sign change
Remaining are imaginary (i2
= -1)
0
)IRR1(
CFn
0t
t
t
=
+
∑=
71. Two Reasons NPV Profiles Cross
Size (scale) differences.
Smaller project frees up funds sooner
for investment.
The higher the opportunity cost, the
more valuable these funds, so high
discount rate favors small projects.
Timing differences.
Project with faster payback provides
more CF in early years for
reinvestment.
If discount rate is high, early CF
especially good
72. Reinvestment Rate Assumption
IRR assumes reinvestment at IRR
NPV assumes reinvestment at the
firm’s weighted average cost of
capital (opportunity cost of capital)
More realistic
NPV method is best
NPV should be used to choose
between mutually exclusive
projects
Editor's Notes
This example will be used for each of the decision rules so that the students can compare the different rules and see that conflicts can arise. This illustrates the importance of recognizing which decision rules provide the best information for making decisions that will increase owner wealth.
The payback period is year 3 if you assume that the cash flows occur at the end of the year as we do with all of the other decision rules. If we assume that the cash flows occur evenly throughout the year, then the project pays back in 2.34 years.
The answer to all of these questions is no.
The example in the book uses straight line depreciation to a zero salvage; that is why you can take the initial investment and divide by 2. If you use MACRS, you need to compute the BV in each period and take the average in the standard way.
This example will be used for each of the decision rules so that the students can compare the different rules and see that conflicts can arise. This illustrates the importance of recognizing which decision rules provide the best information for making decisions that will increase owner wealth.
Students may ask where you came up with the 25%, point out that this is one of the drawbacks of this rule. There is no good theory for determining what the return should be. We generally just use some rule of thumb.
The answer to all of these questions is no. In fact, this rule is even worse than the payback rule in that it doesn’t even use cash flows for the analysis. It uses net income and book value.
This example will be used for each of the decision rules so that the students can compare the different rules and see that conflicts can arise. This illustrates the importance of recognizing which decision rules provide the best information for making decisions that will increase owner wealth.
Many of the financial calculators will compute the IRR as soon as it is pressed; others require that you press compute.
The answer to all of these questions is yes, although it is not always as obvious. The IRR rule accounts for time value because it is finding the rate of return that equates all of the cash flows on a time value basis. The IRR rule accounts for the risk of the cash flows because you compare it to the required return, which is determined by the risk of the project. The IRR rule provides an indication of value because we will always increase value if we can earn a return greater than our required return. We should consider the IRR rule as our primary decision criteria, but as we will see, it has some problems that the NPV does not have. That is why we end up choosing the NPV as our ultimate decision rule.
You should point out, however, that if you get a very large IRR that you should go back and look at your cash flow estimation again. In competitive markets, extremely high IRRs should be rare.
So what should we do – we have two rules that indicate to accept and two that indicate to reject.
As long as we do not have limited capital, we should choose project A. Students will often argue that you should choose B because then you can invest the additional $100 in another good project, say C. The point is that if we do not have limited capital, we can invest in A and C and still be better off. If we have limited capital, then we will need to examine what combinations of projects with A provide the highest NPV and what combinations of projects with B provide the highest NPV. You then go with the set that will create the most value. If you have limited capital and a large number of mutually exclusive projects, then you will want to set up a computer program to determine the best combination of projects within the budget constraints. The important point is that we DO NOT use IRR to choose between projects regardless of whether or not we have limited capital.
Even though payback and AAR should not be used to make the final decision, we should consider the project very carefully if they suggest rejection. There may be more risk than we have considered or we may want to pay additional attention to our cash flow estimations. Sensitivity and scenario analysis can be used to help us evaluate our cash flows. The fact that payback is commonly used as a secondary criteria may be because short paybacks allow firms to have funds sooner to invest in other projects without going to the capital markets
Payback period = 4 years NPV = -2758.72 IRR = 7.93%