Downloaded 714 times
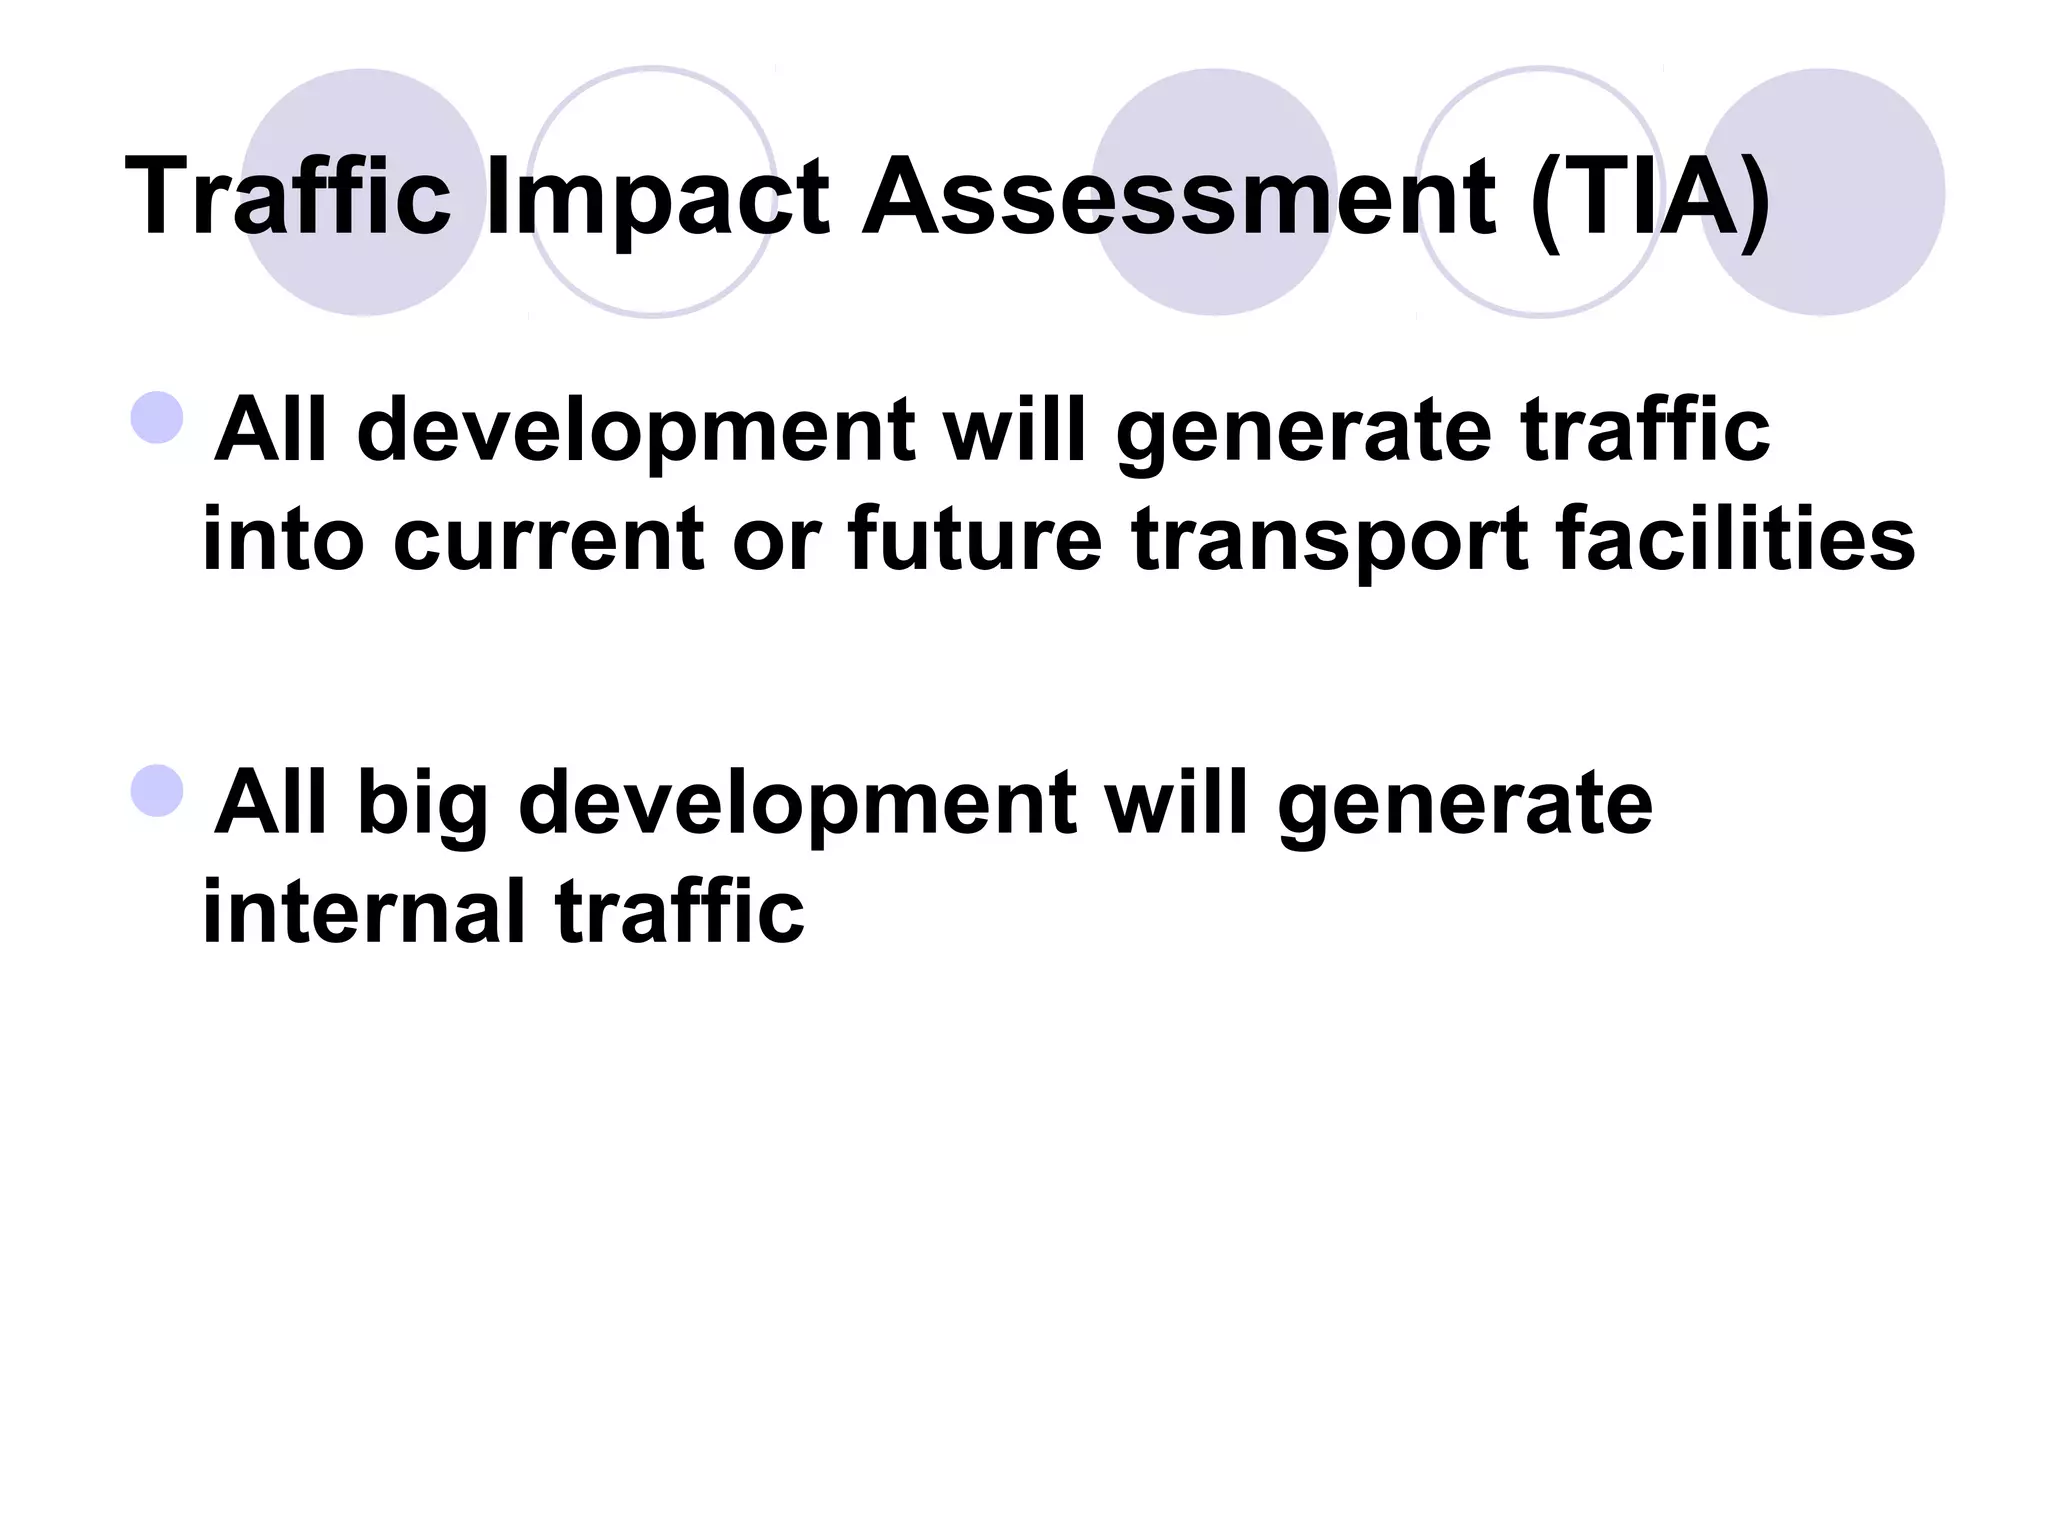
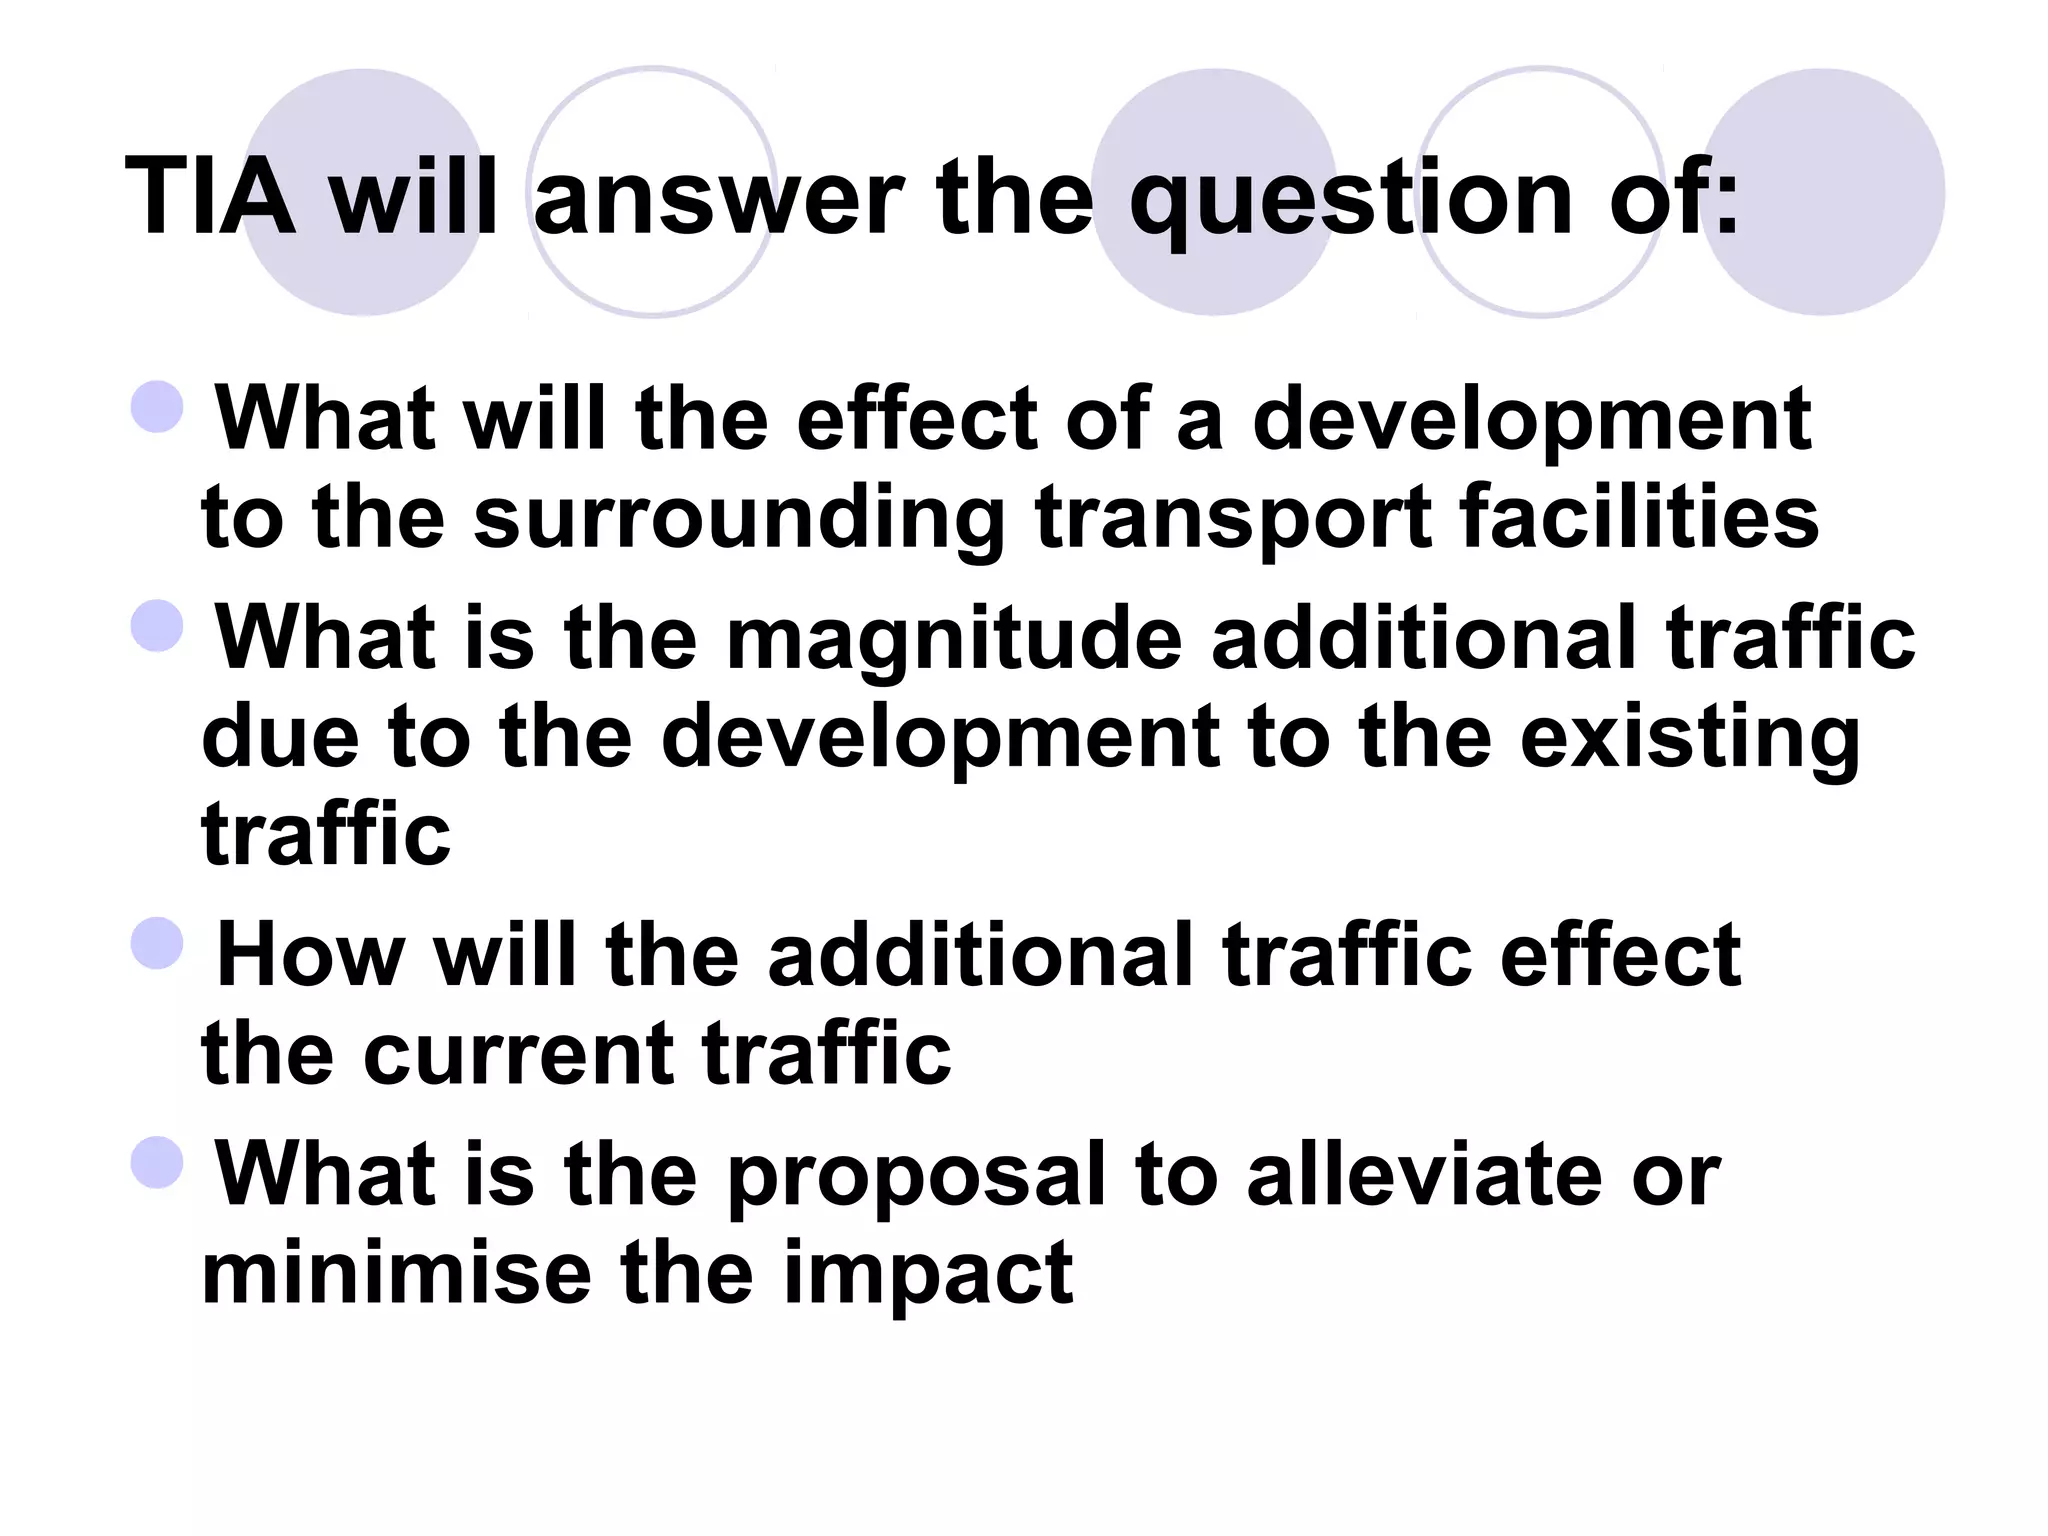
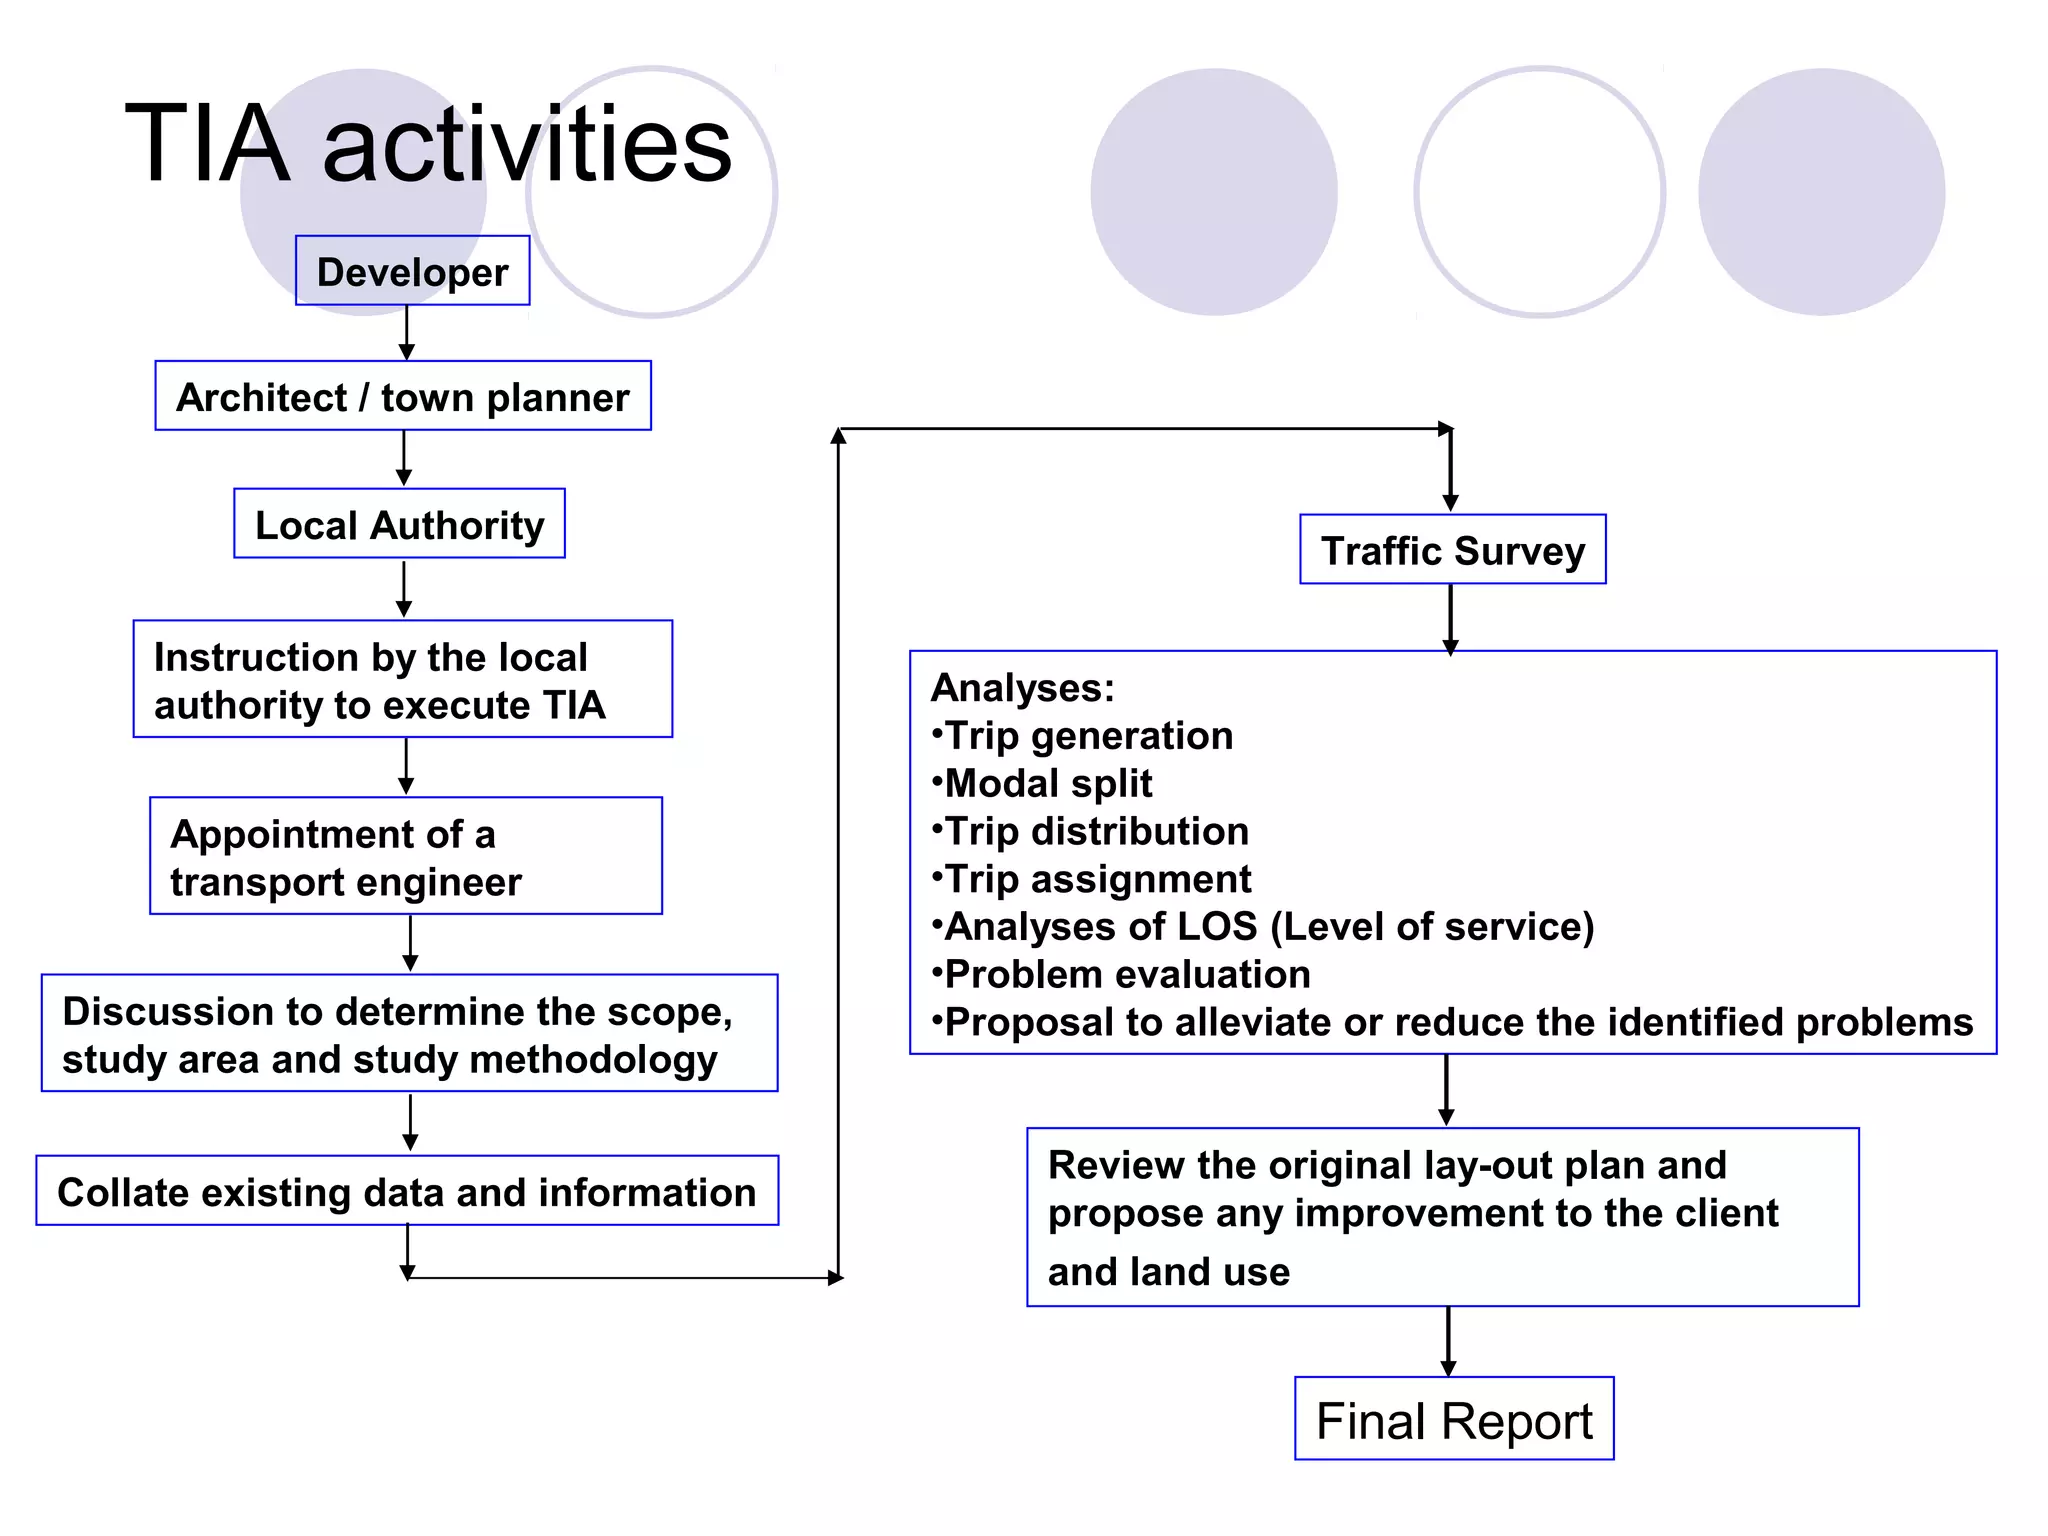
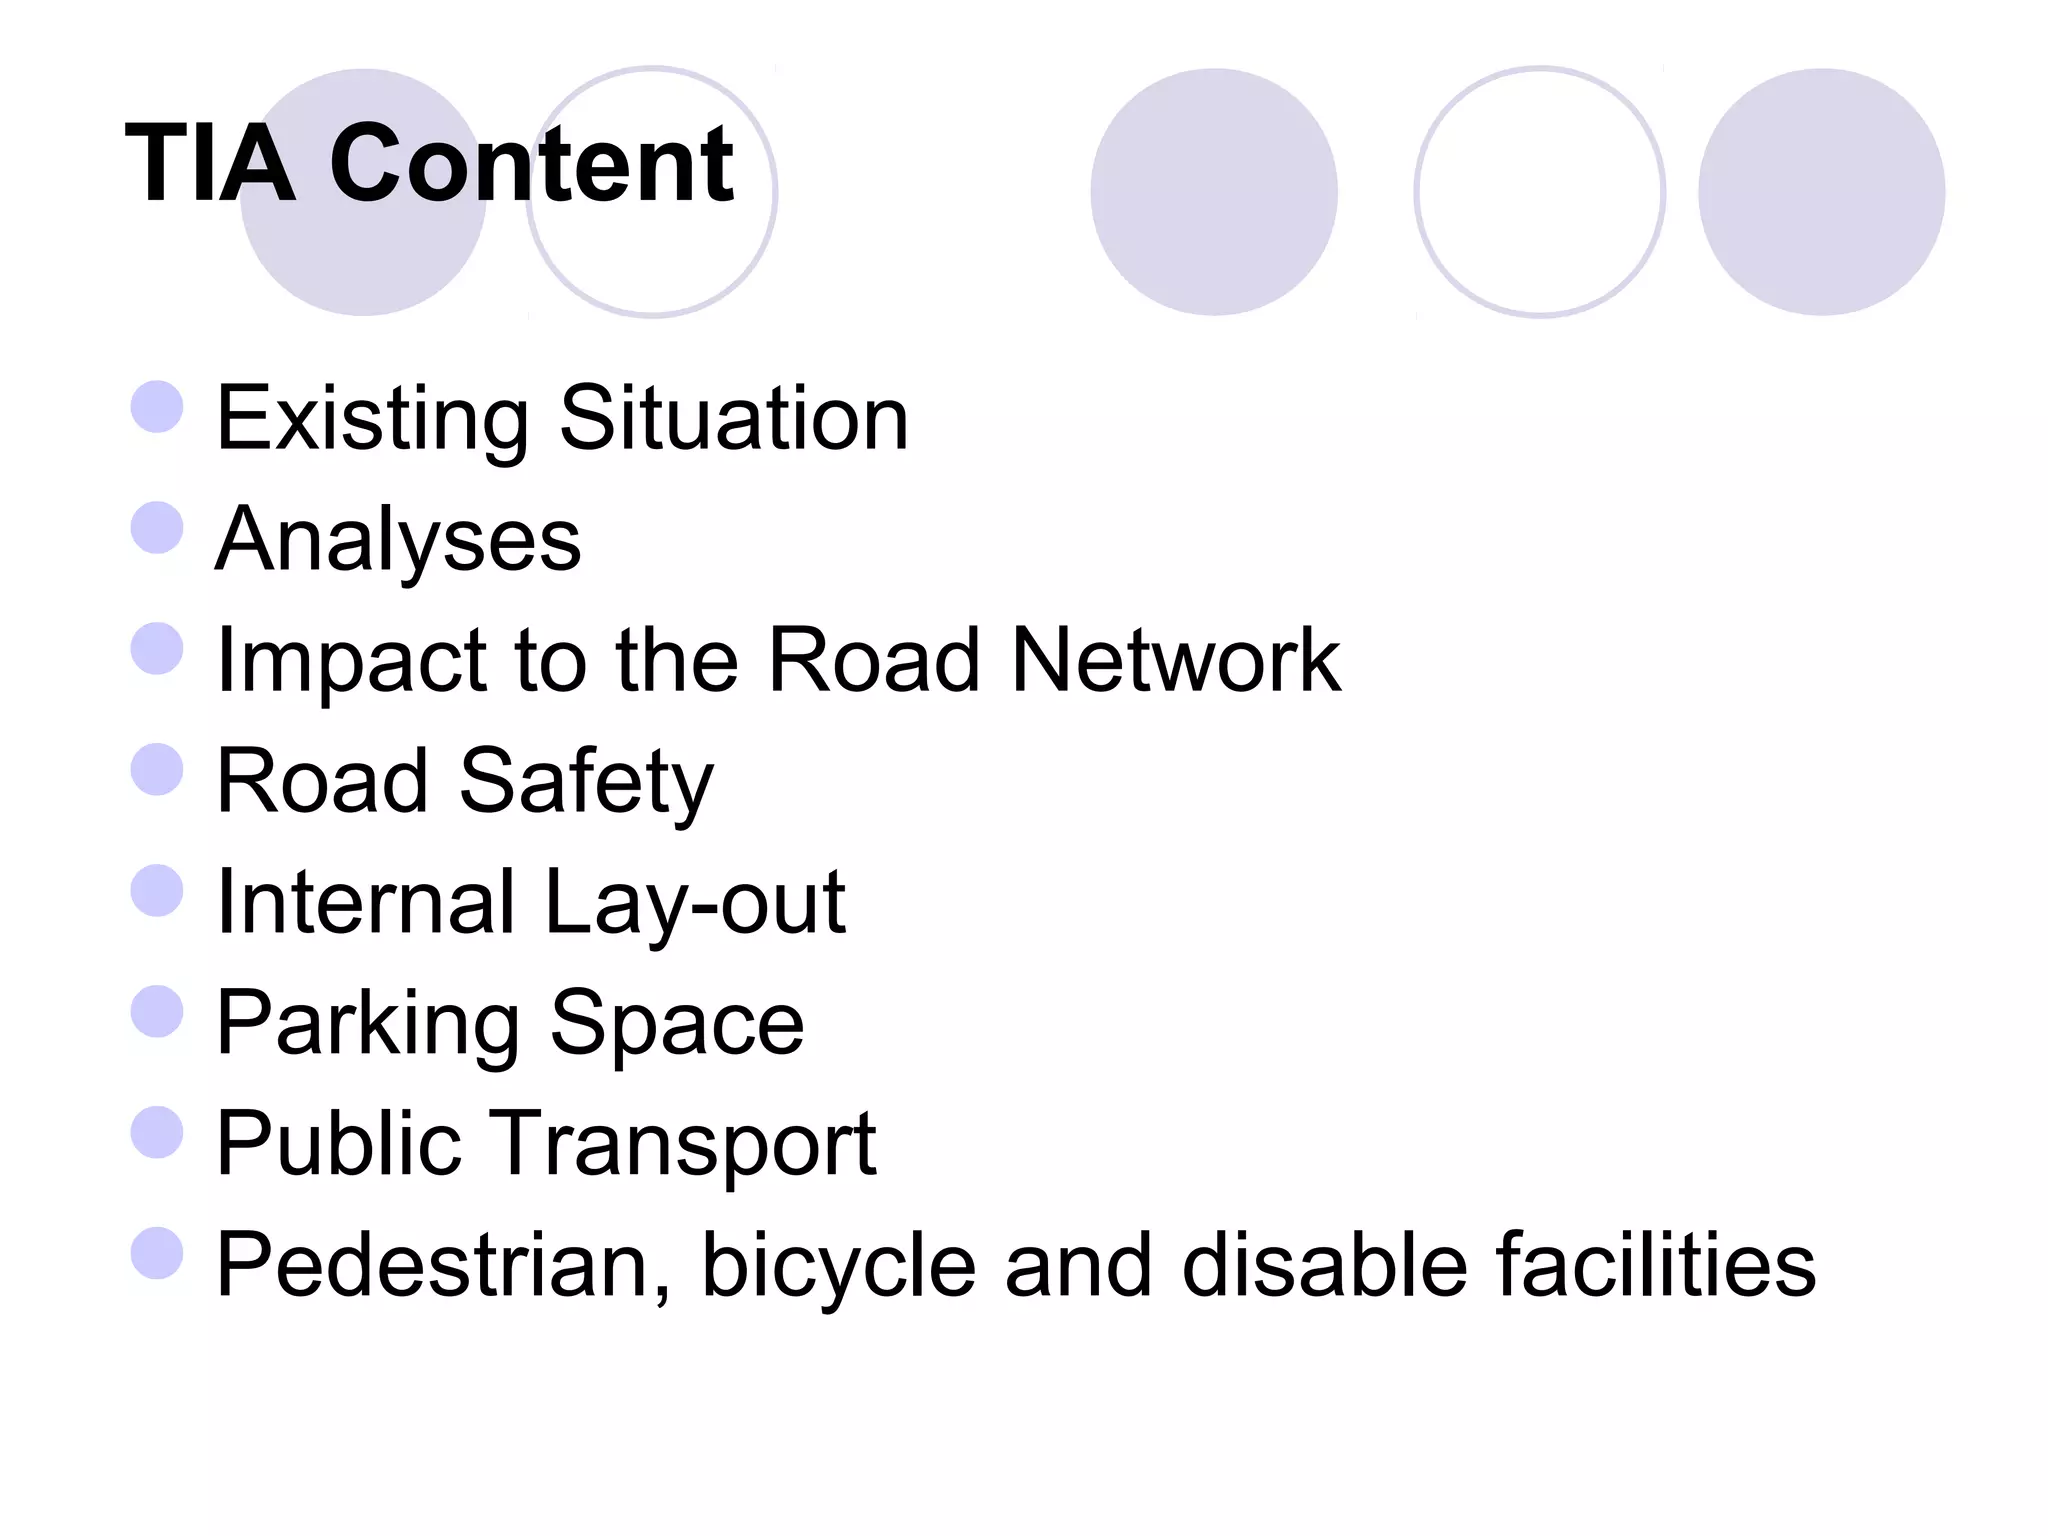
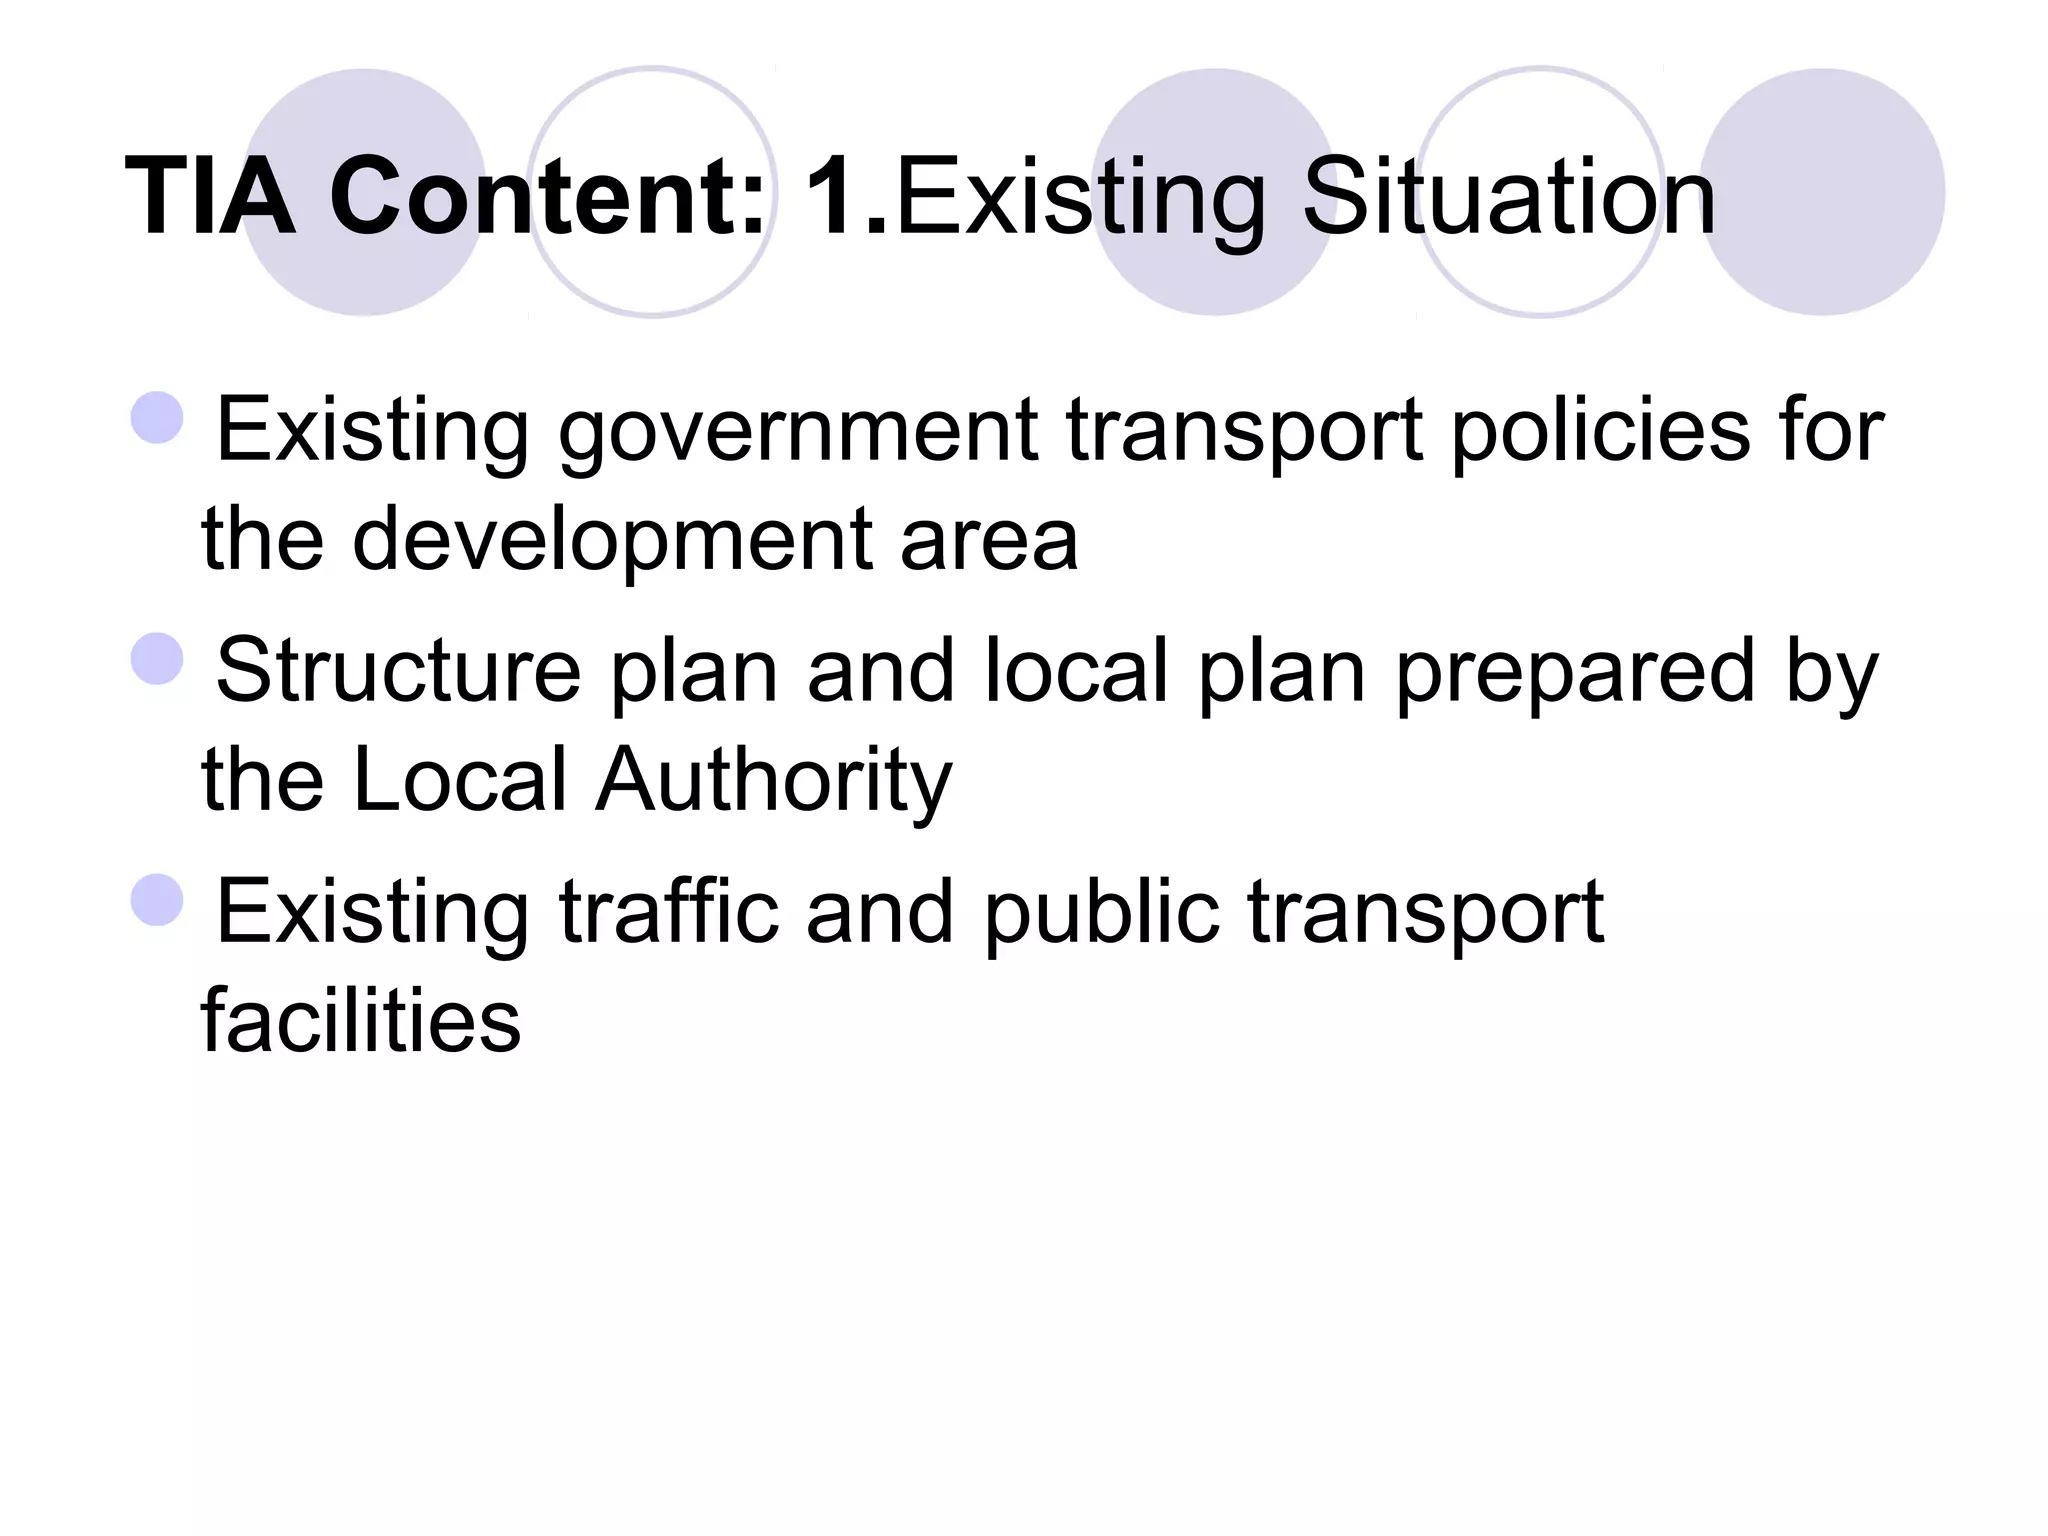
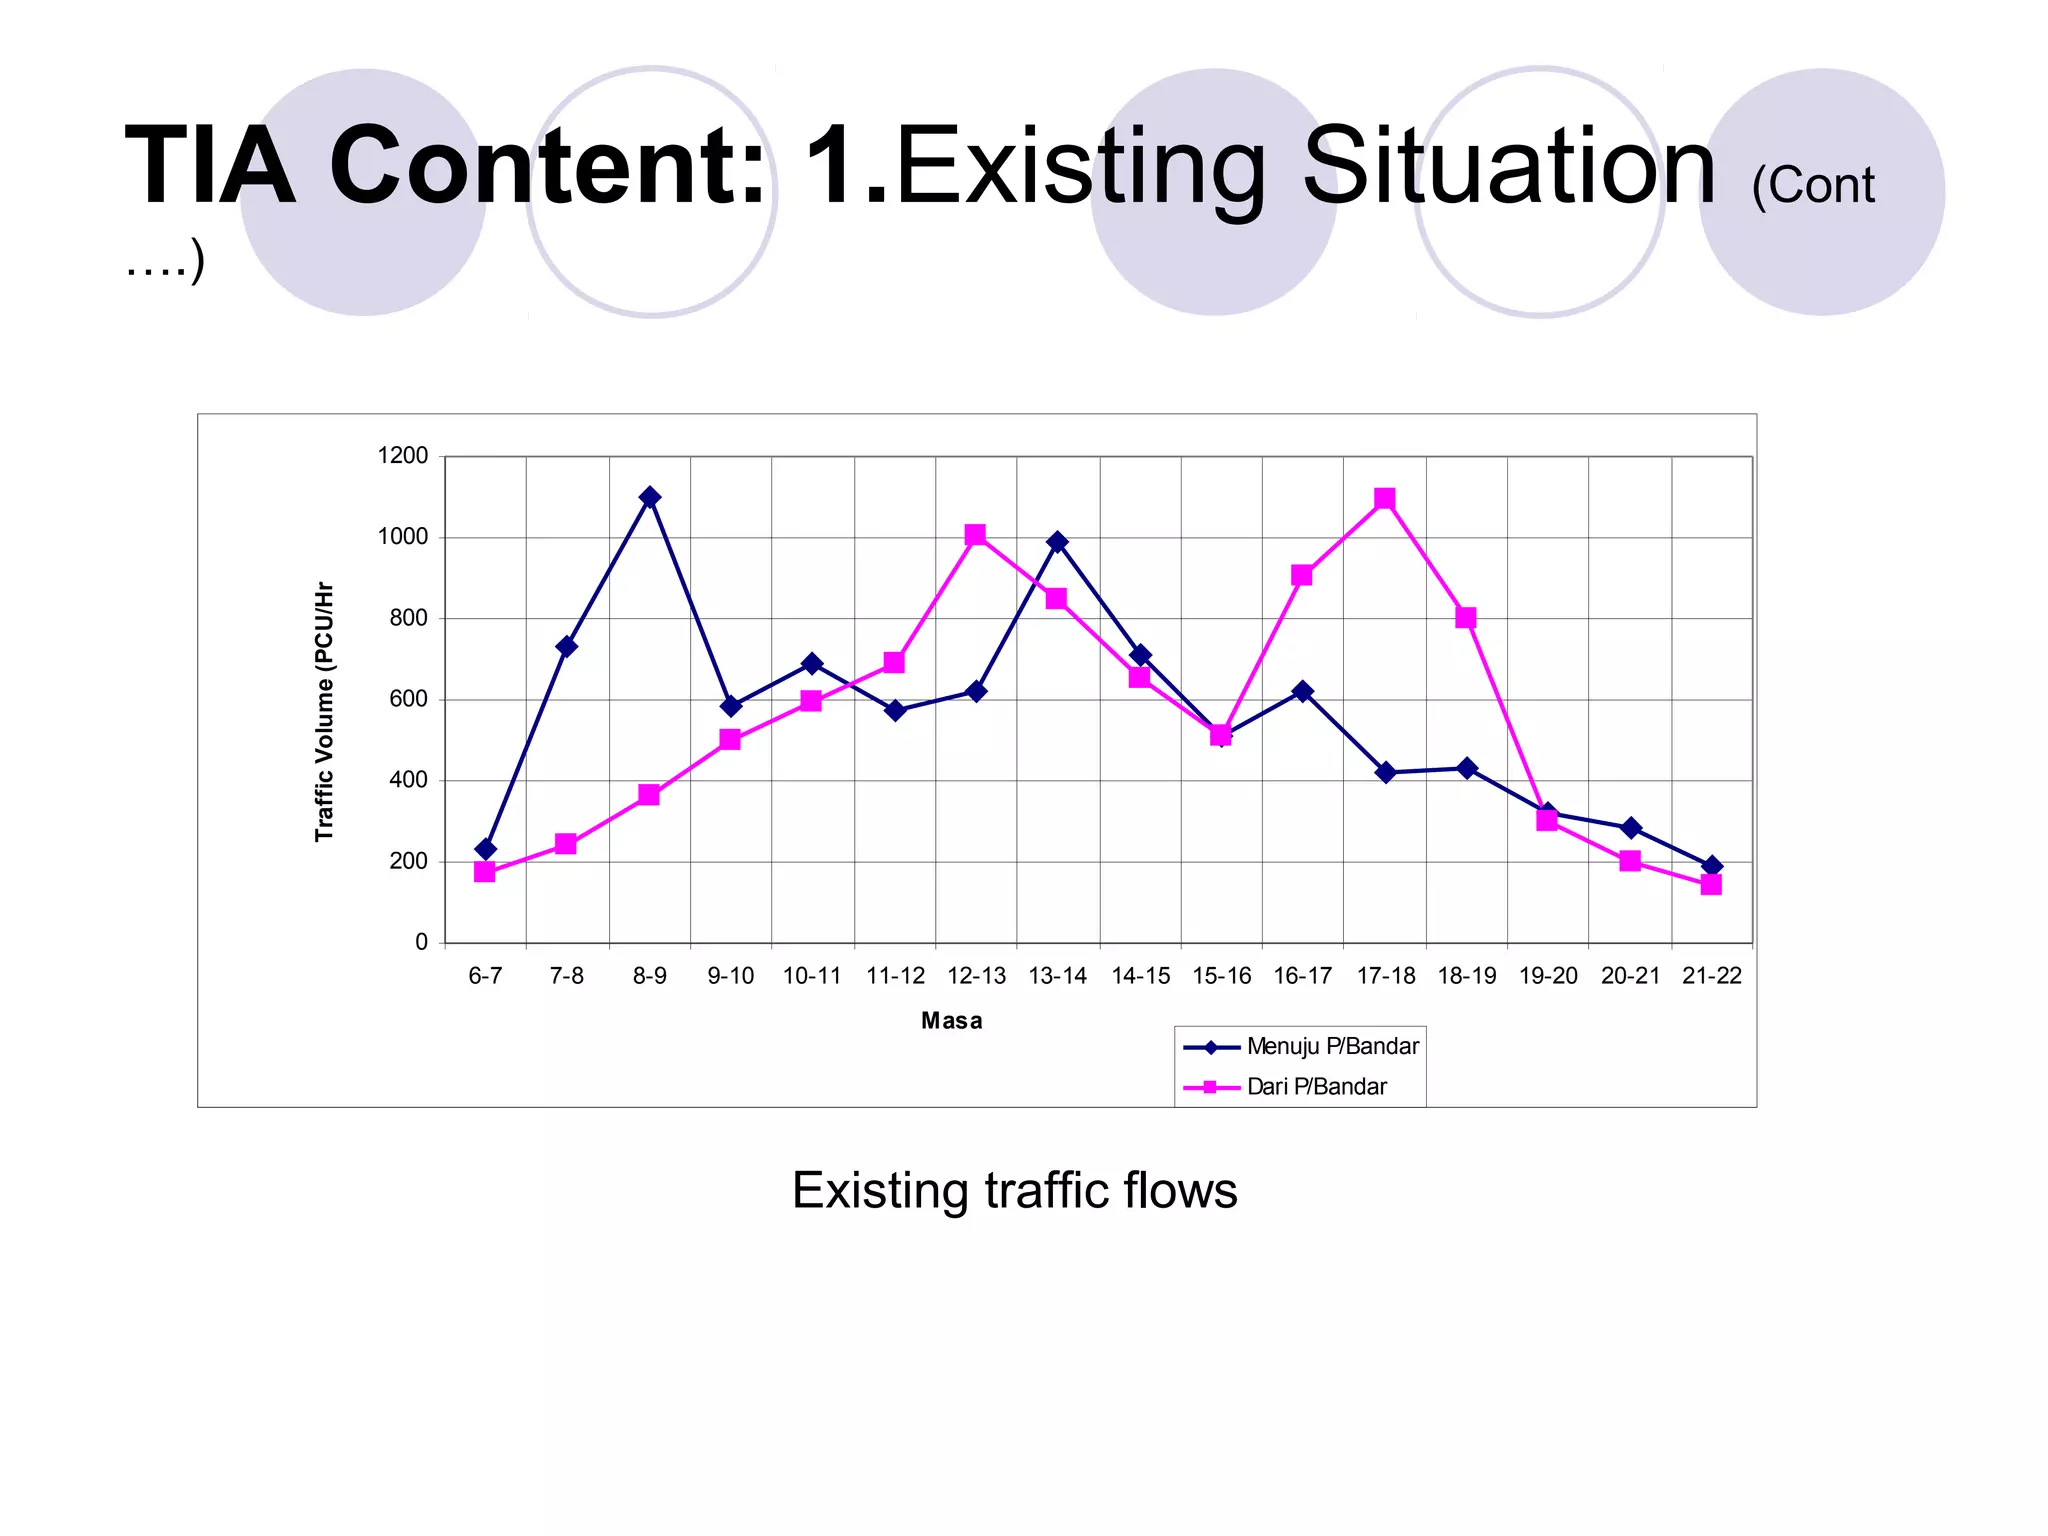
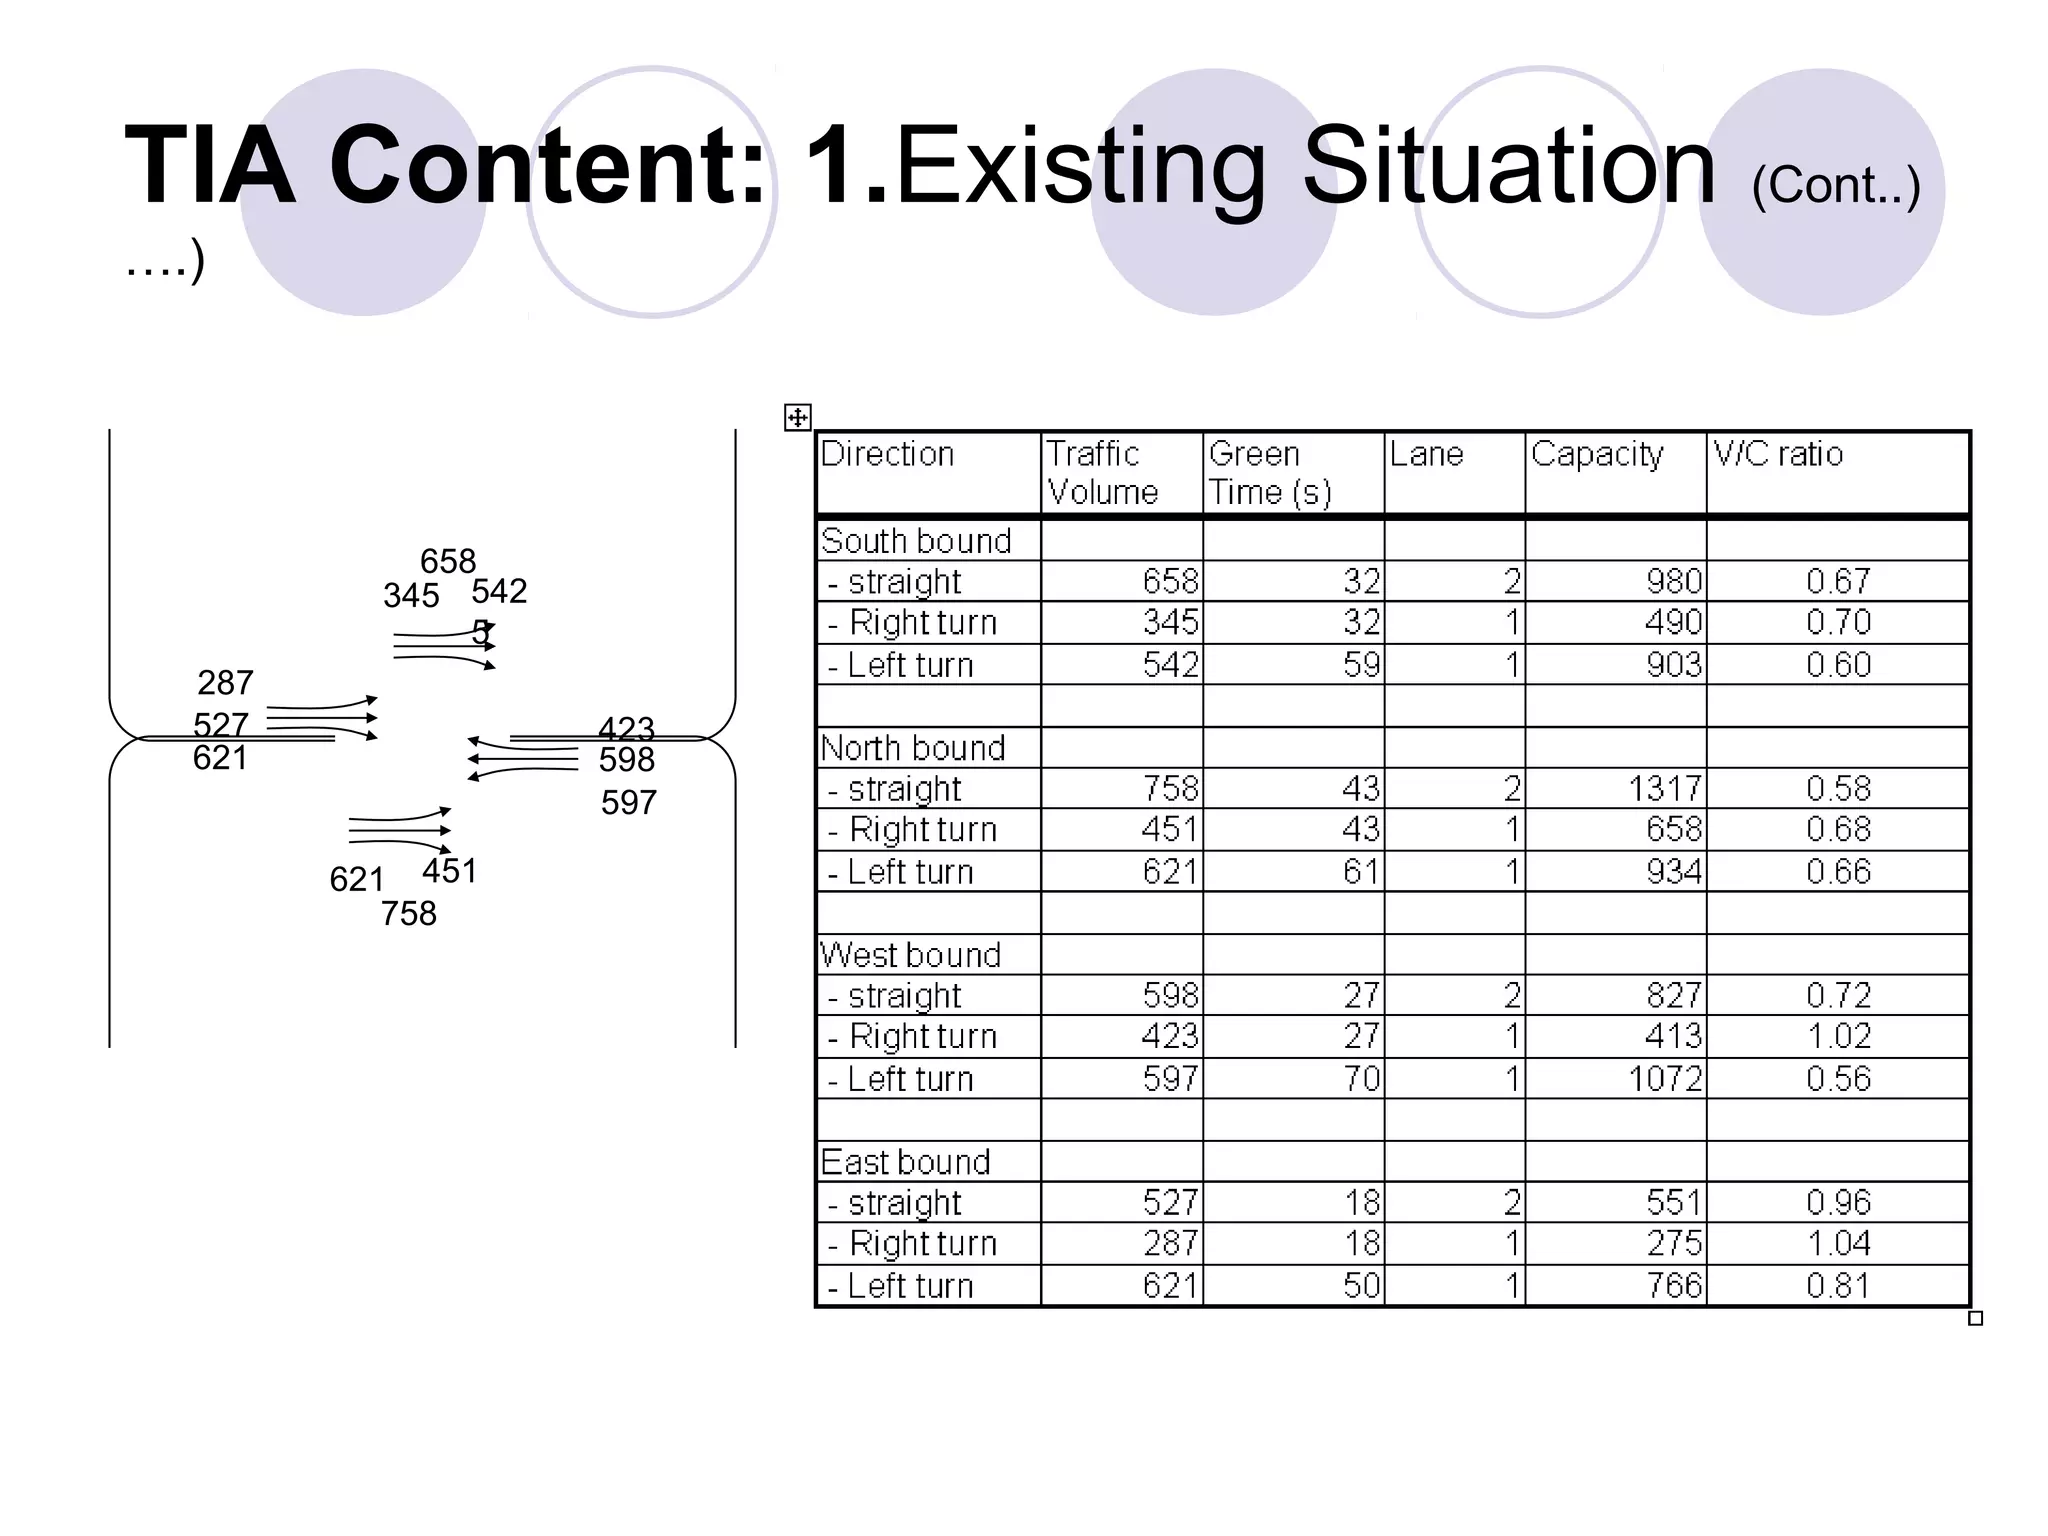
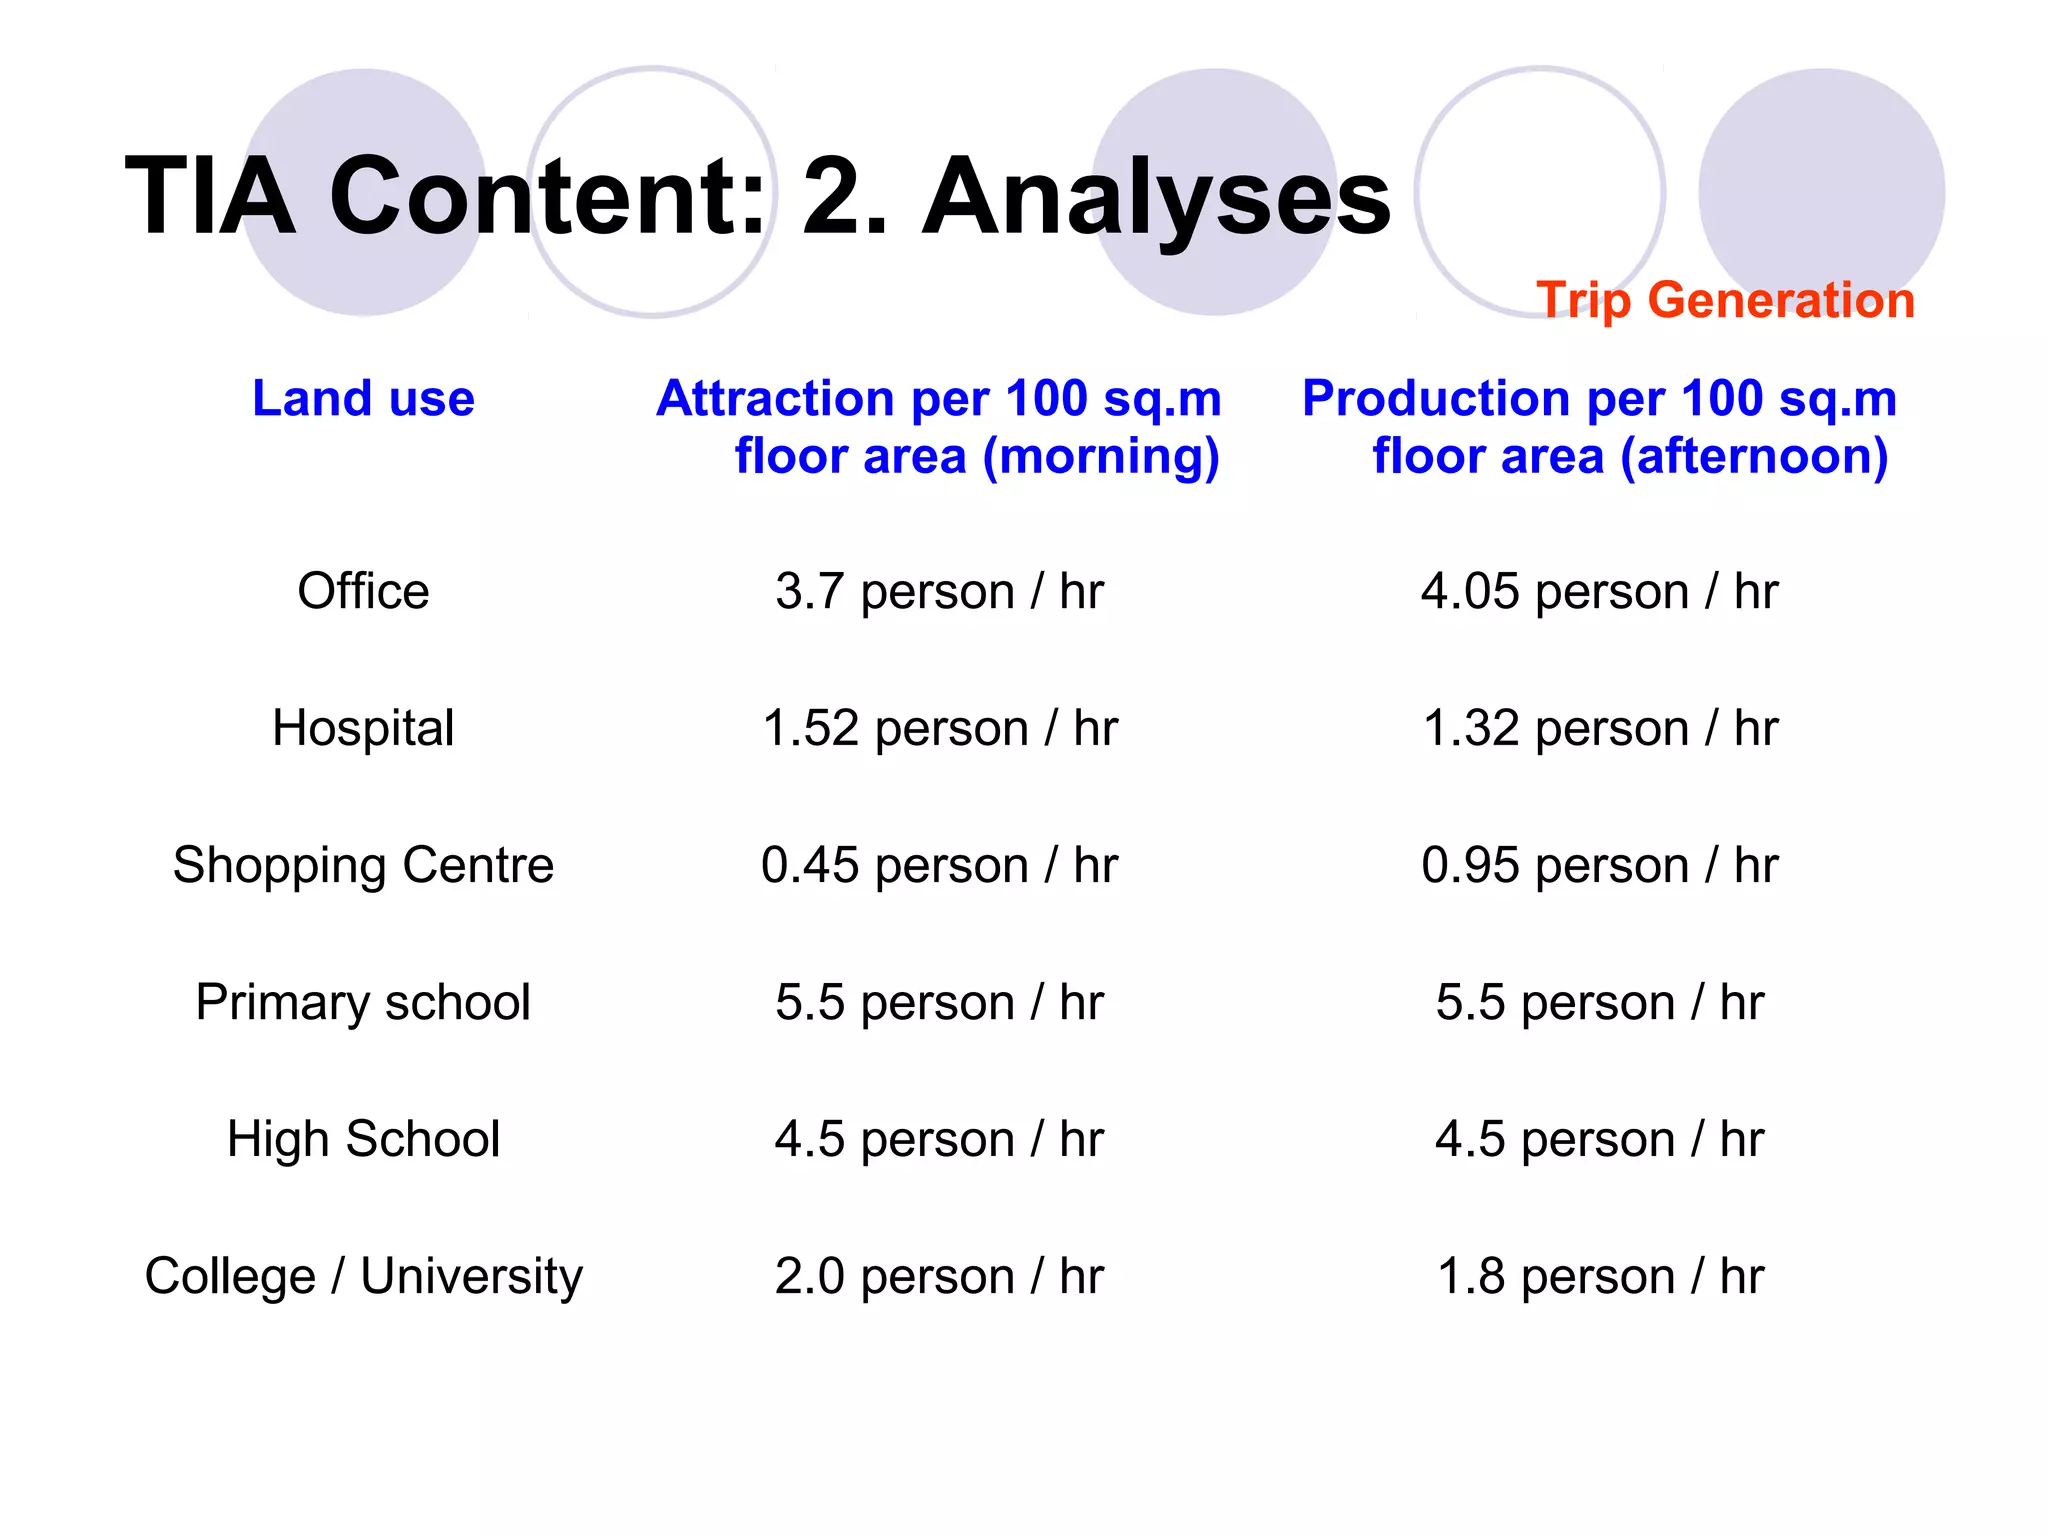
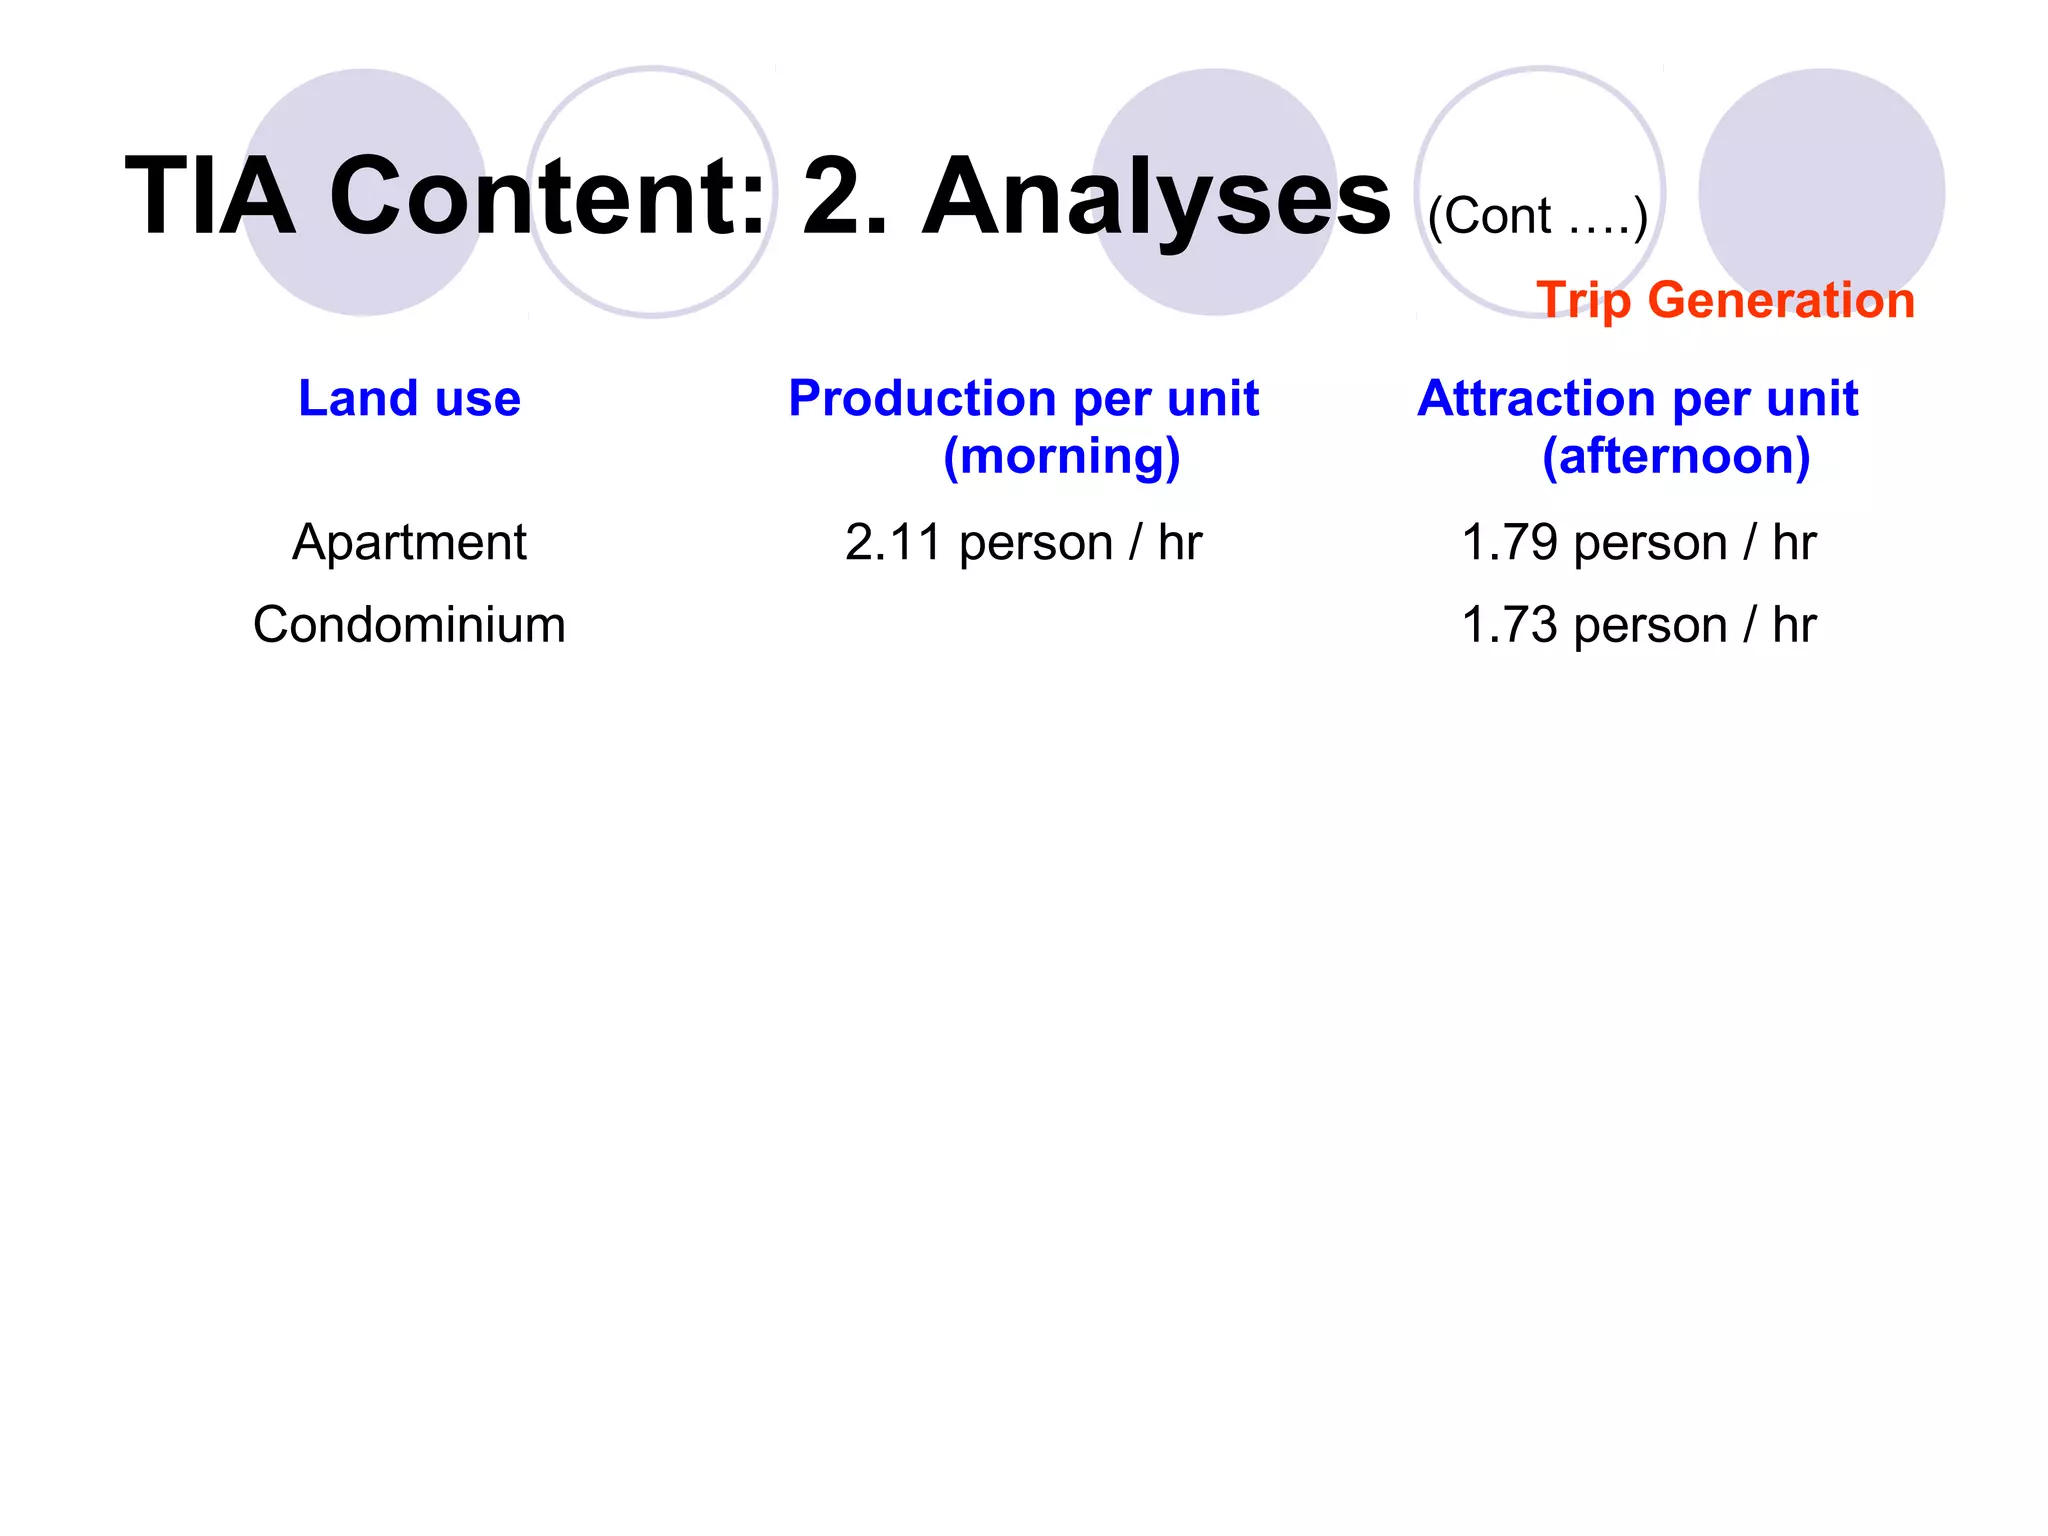
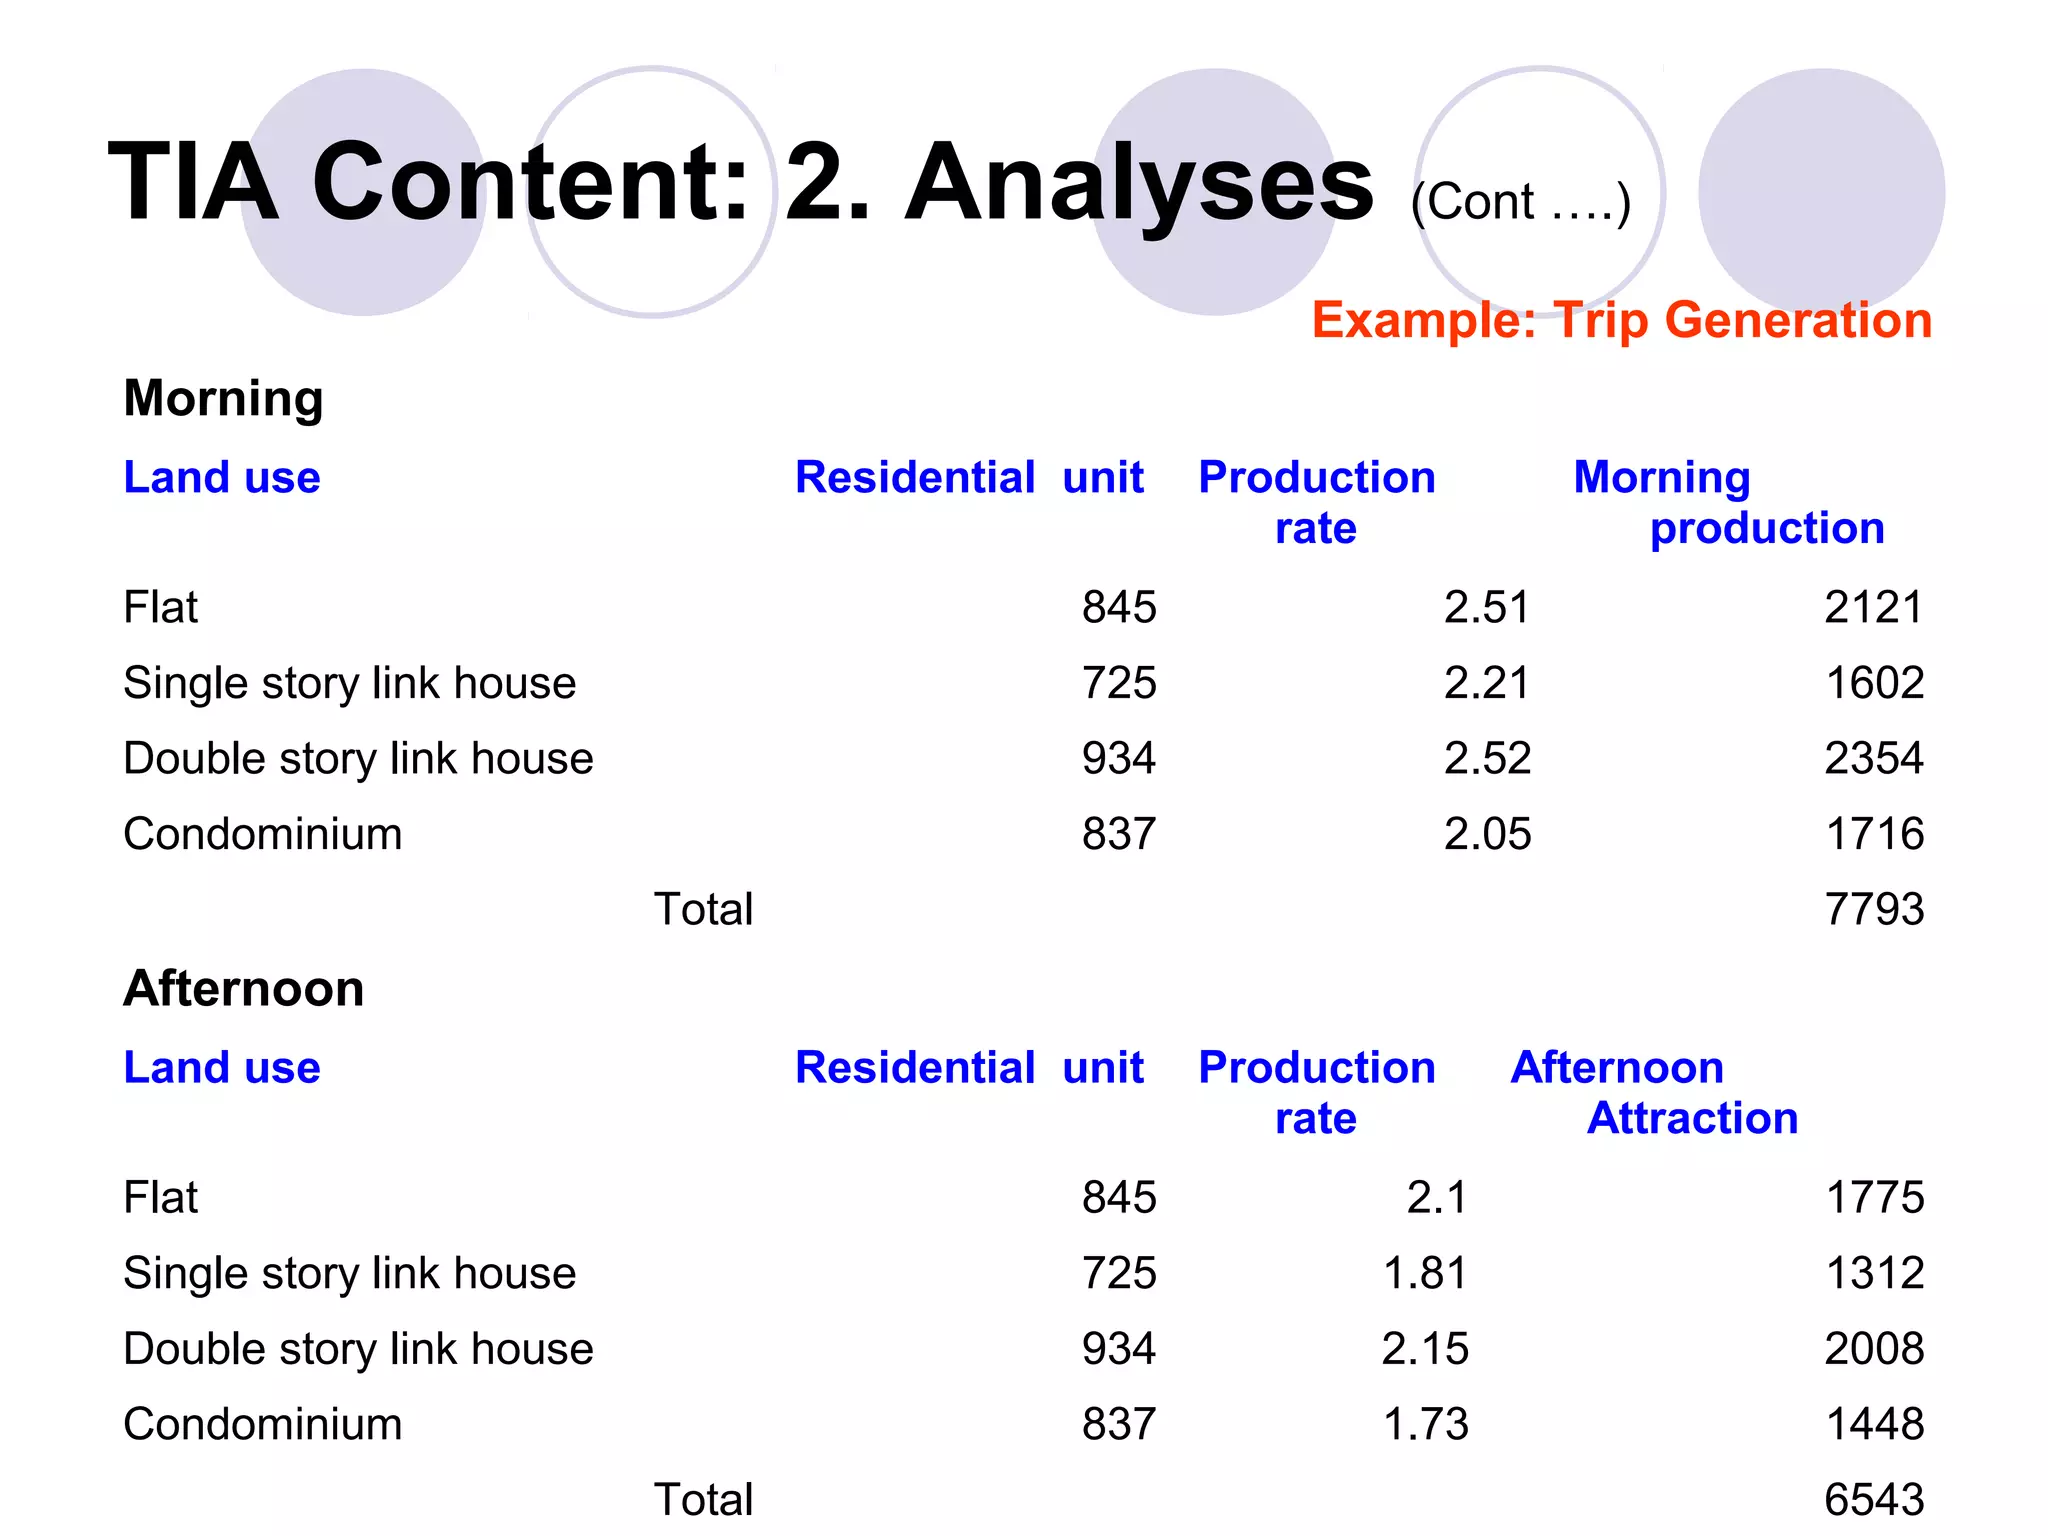
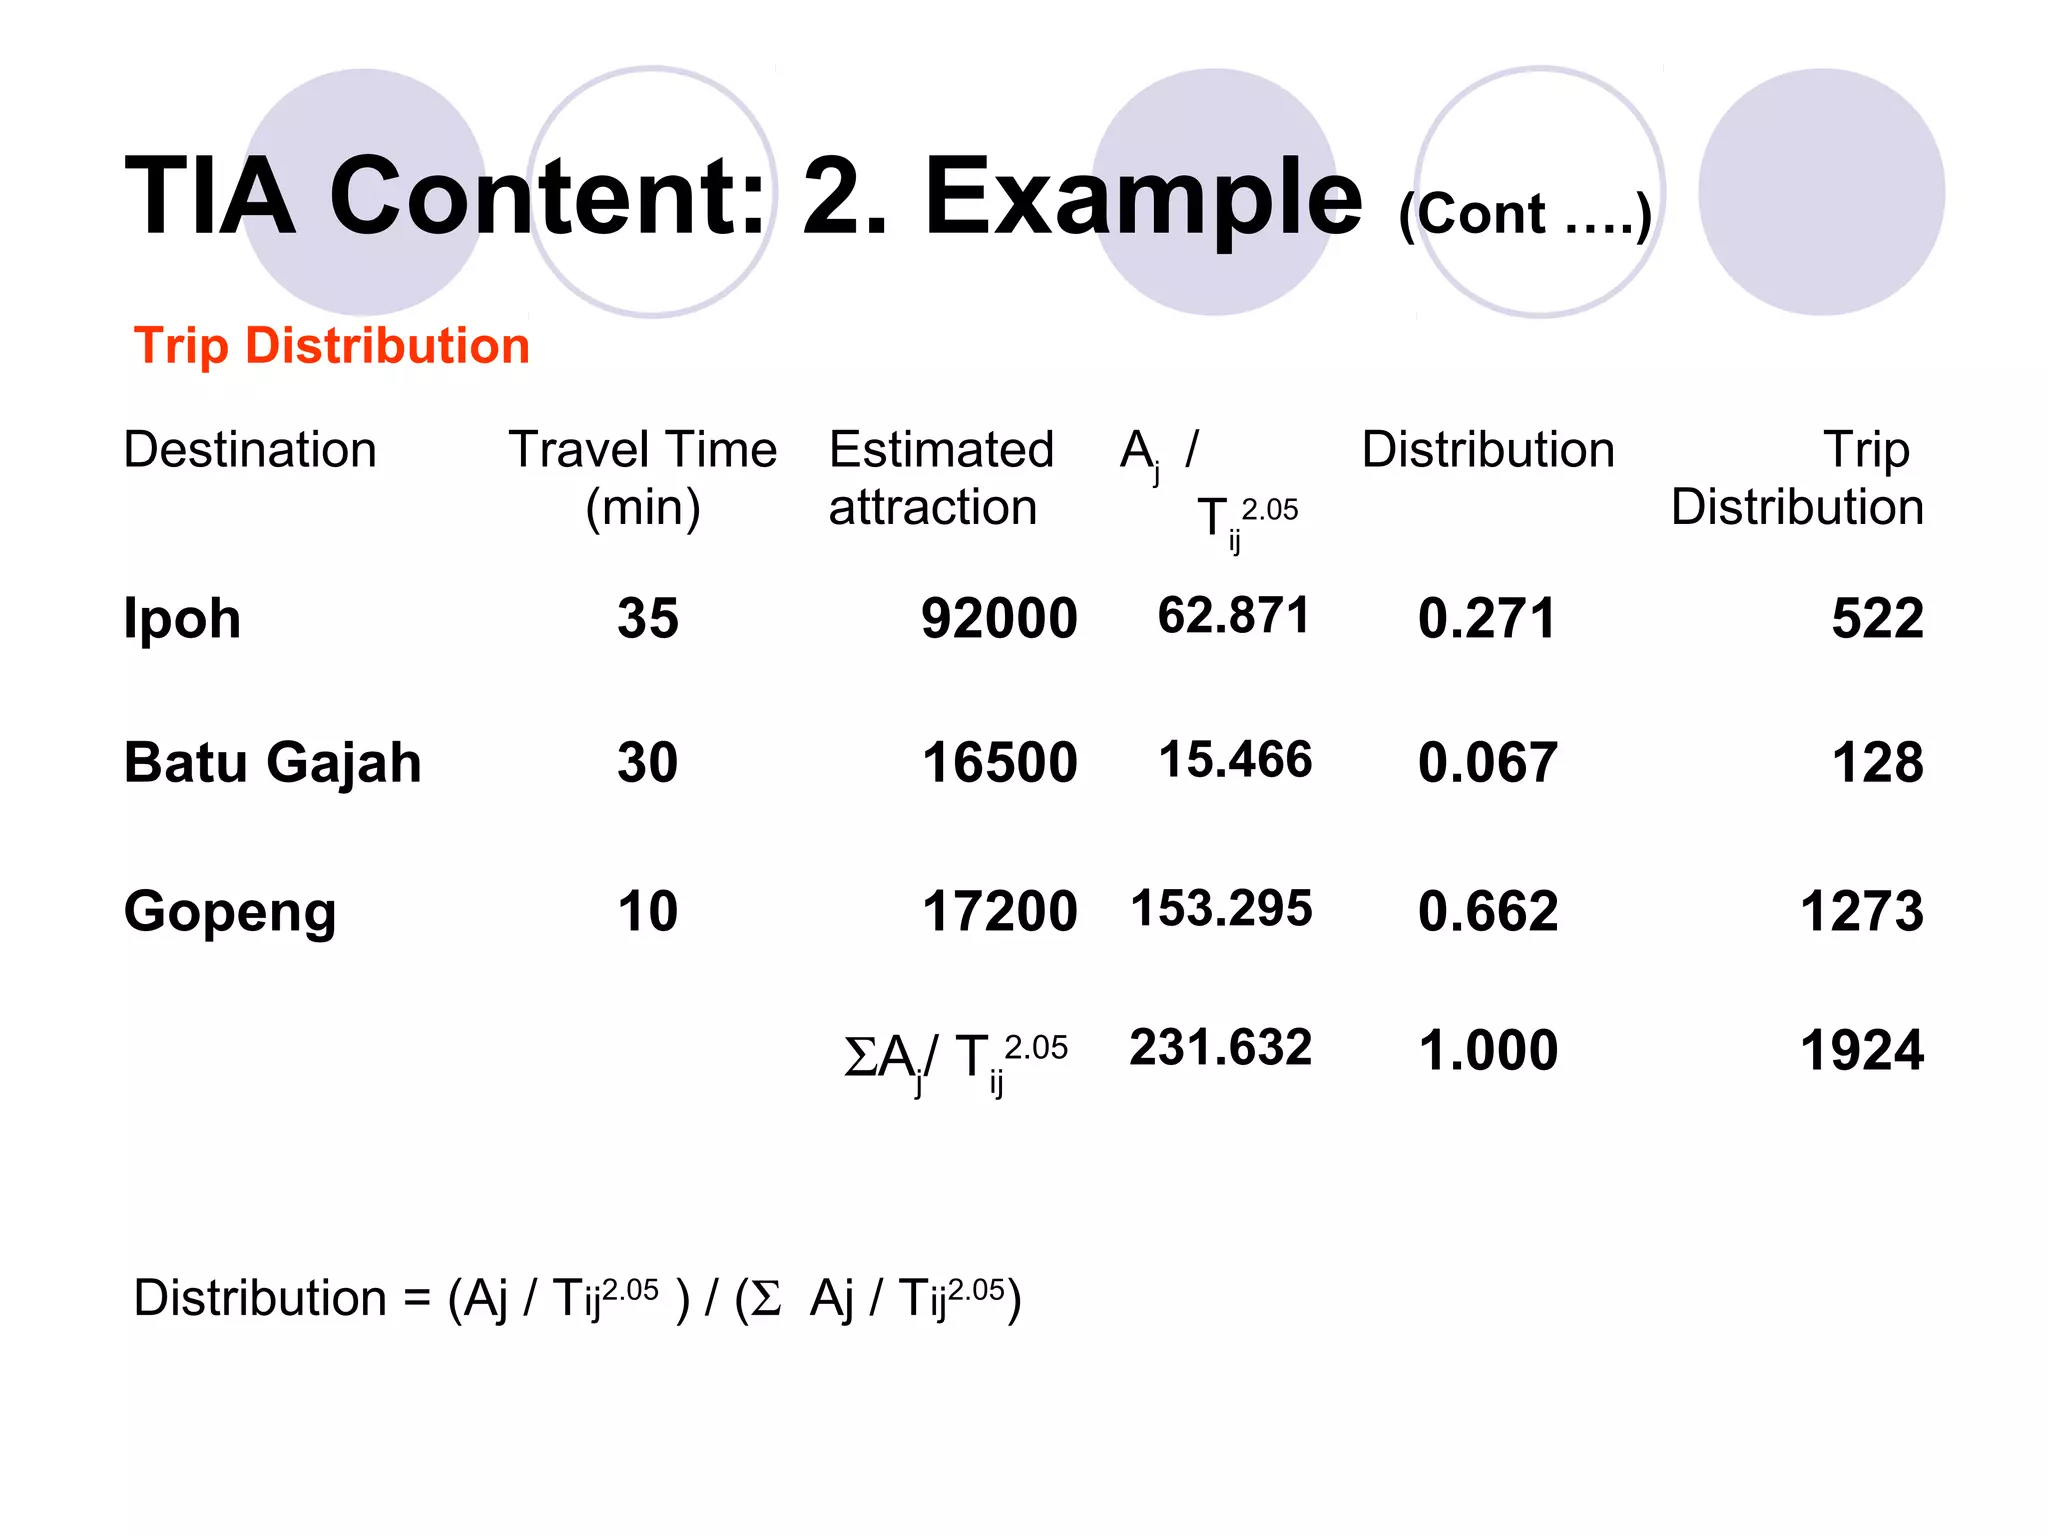
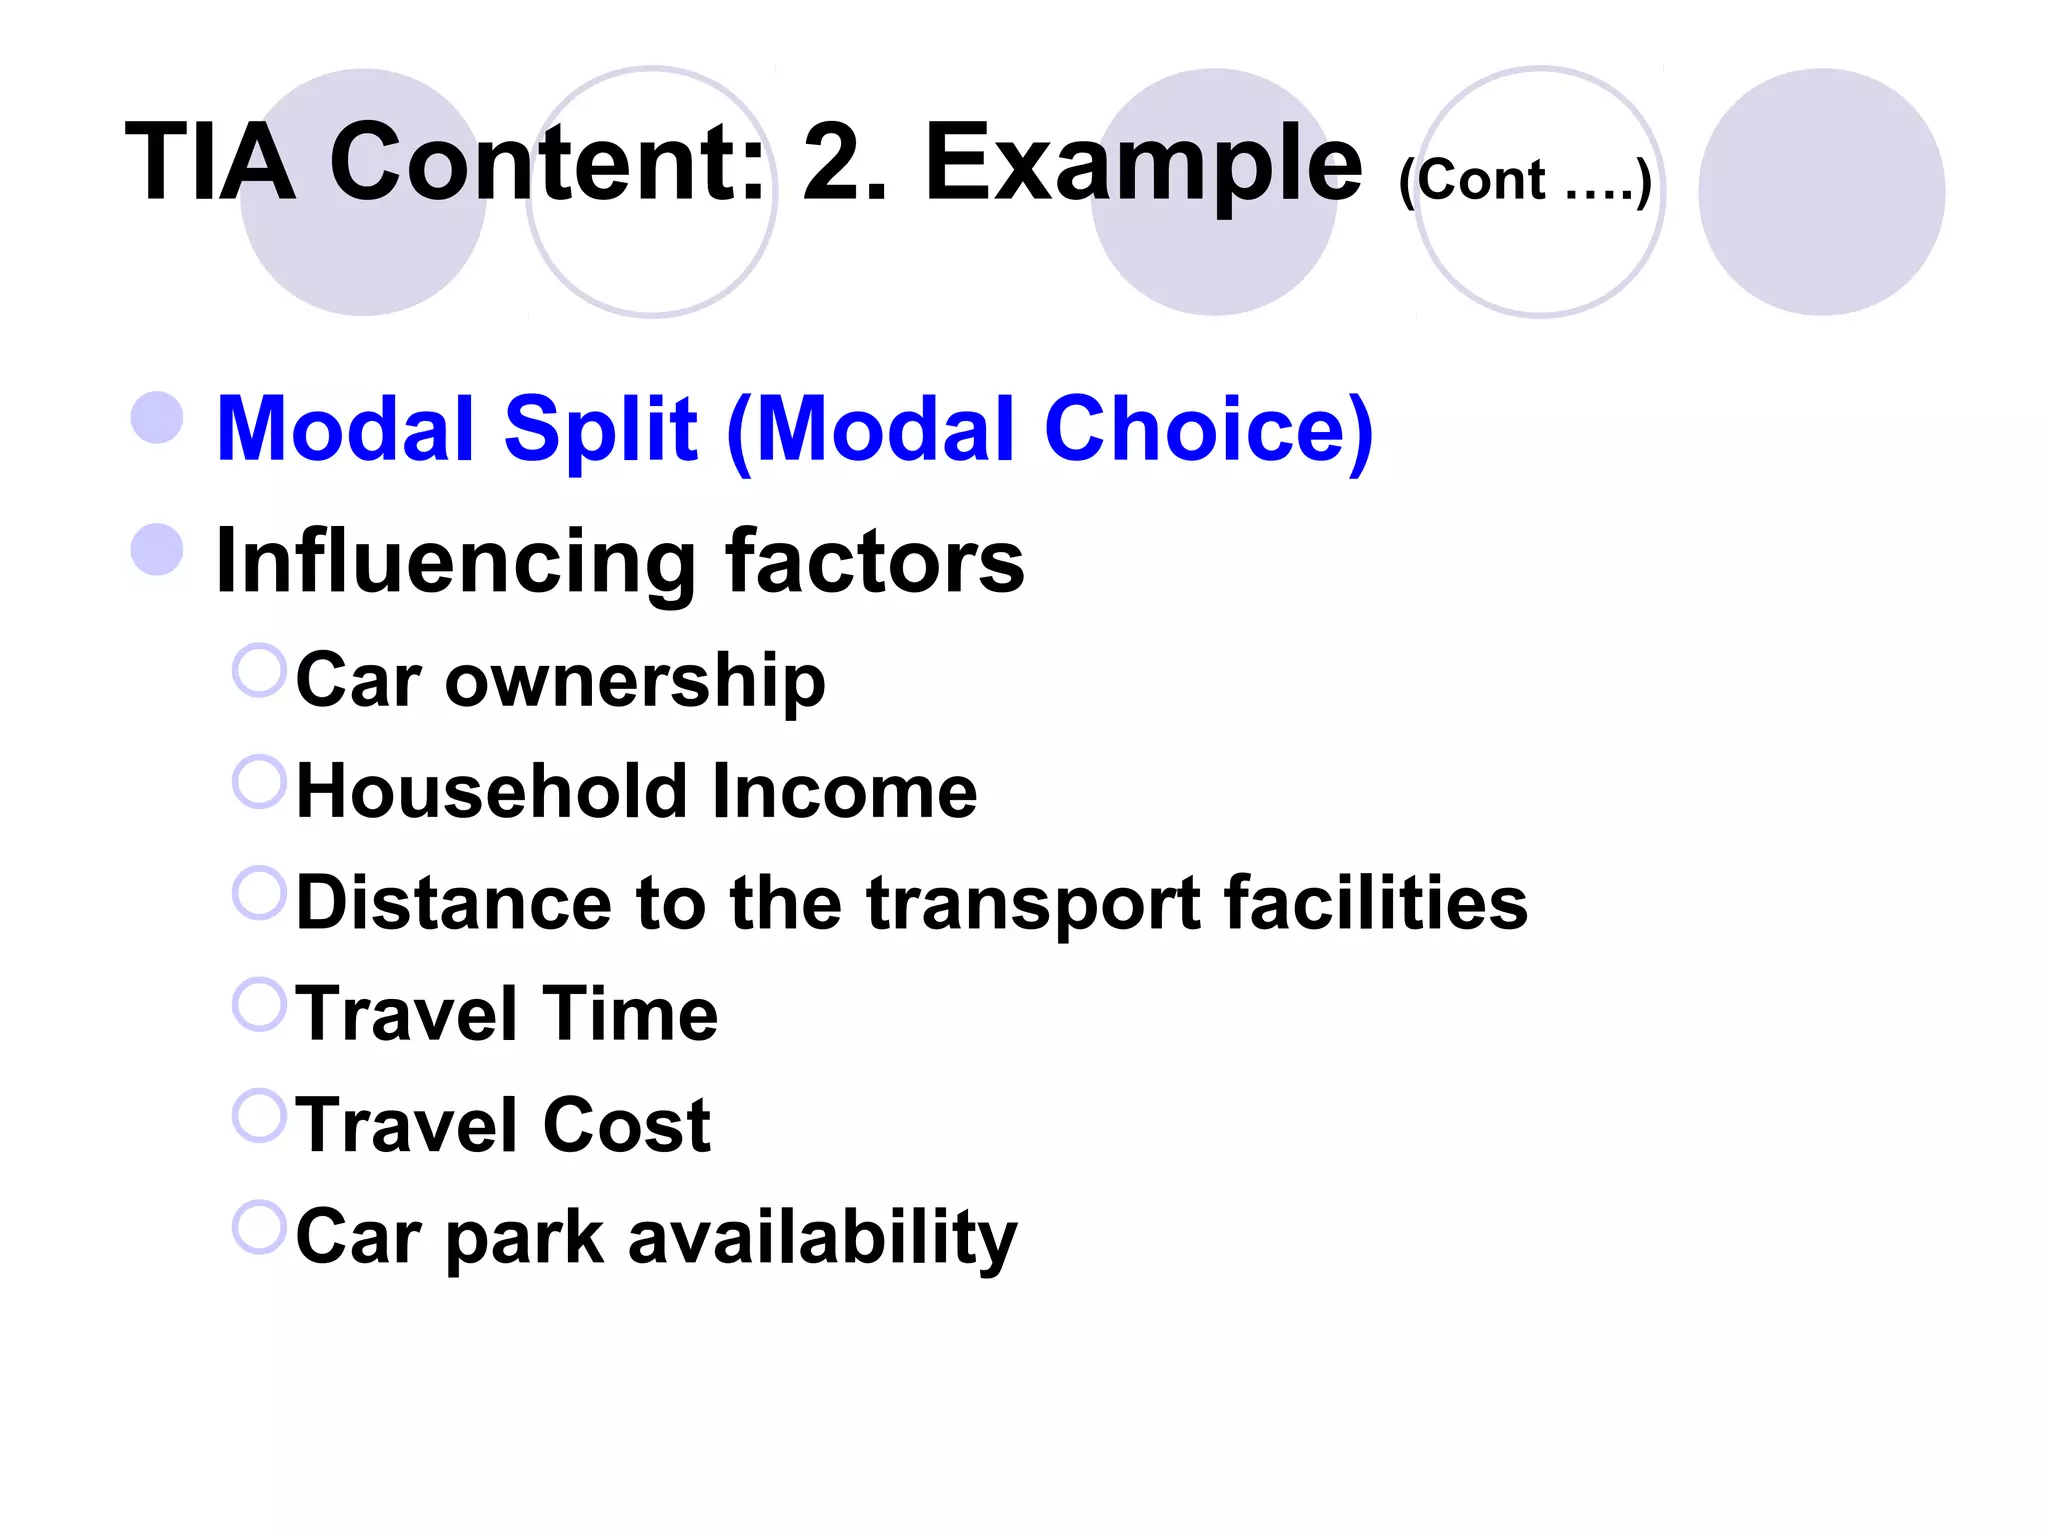
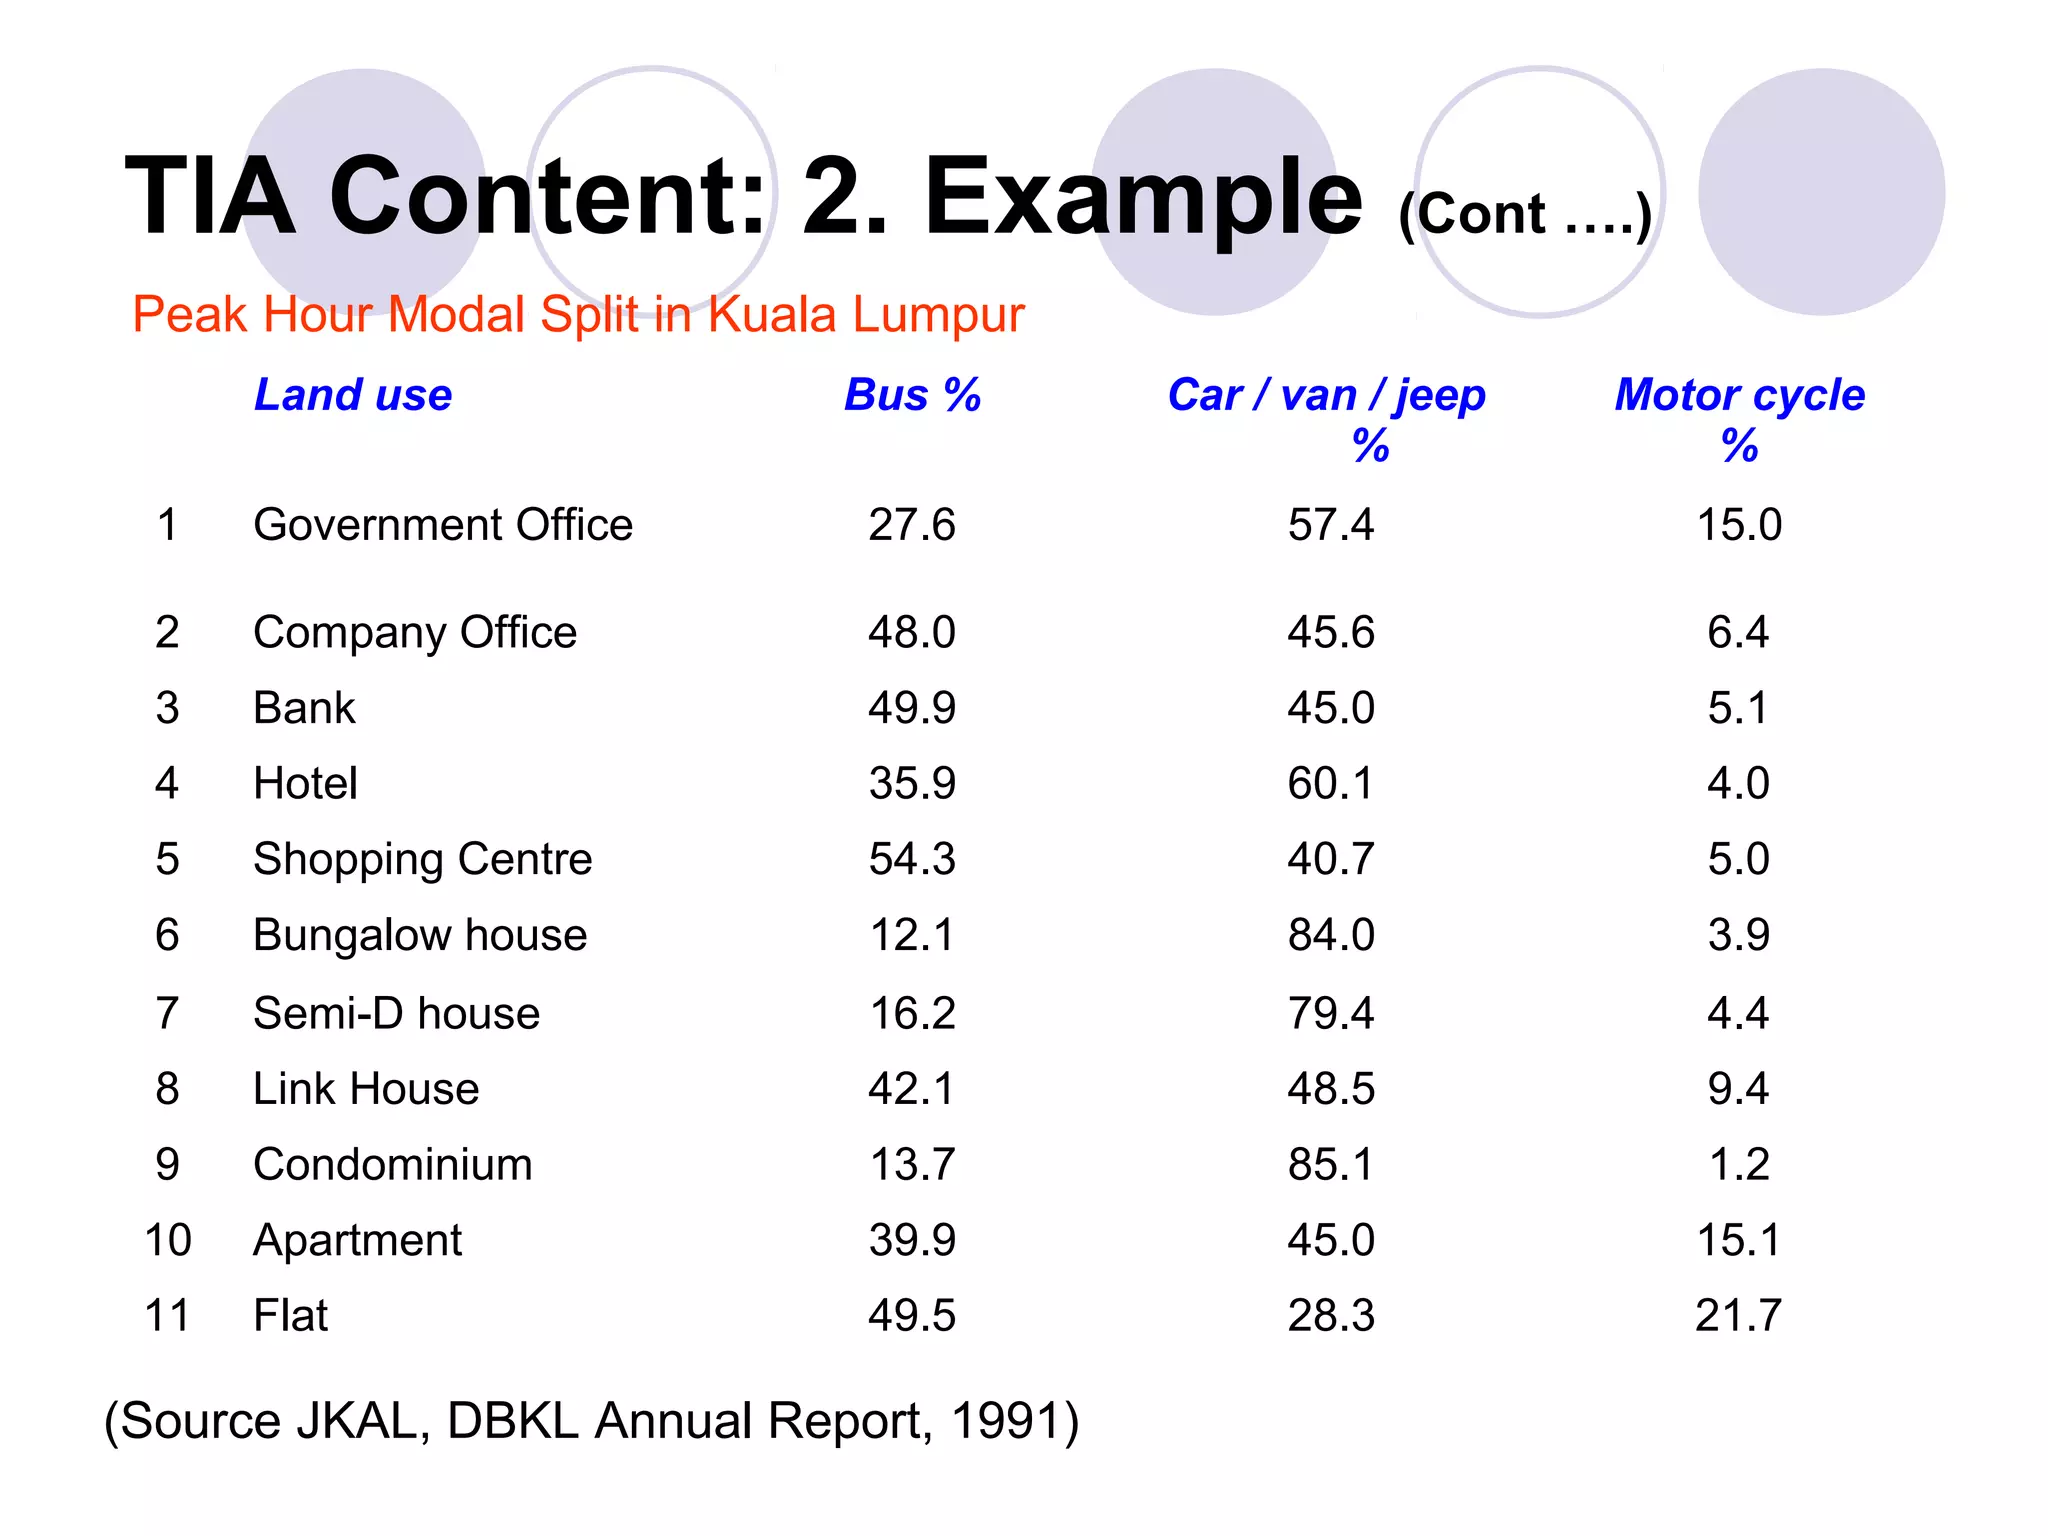
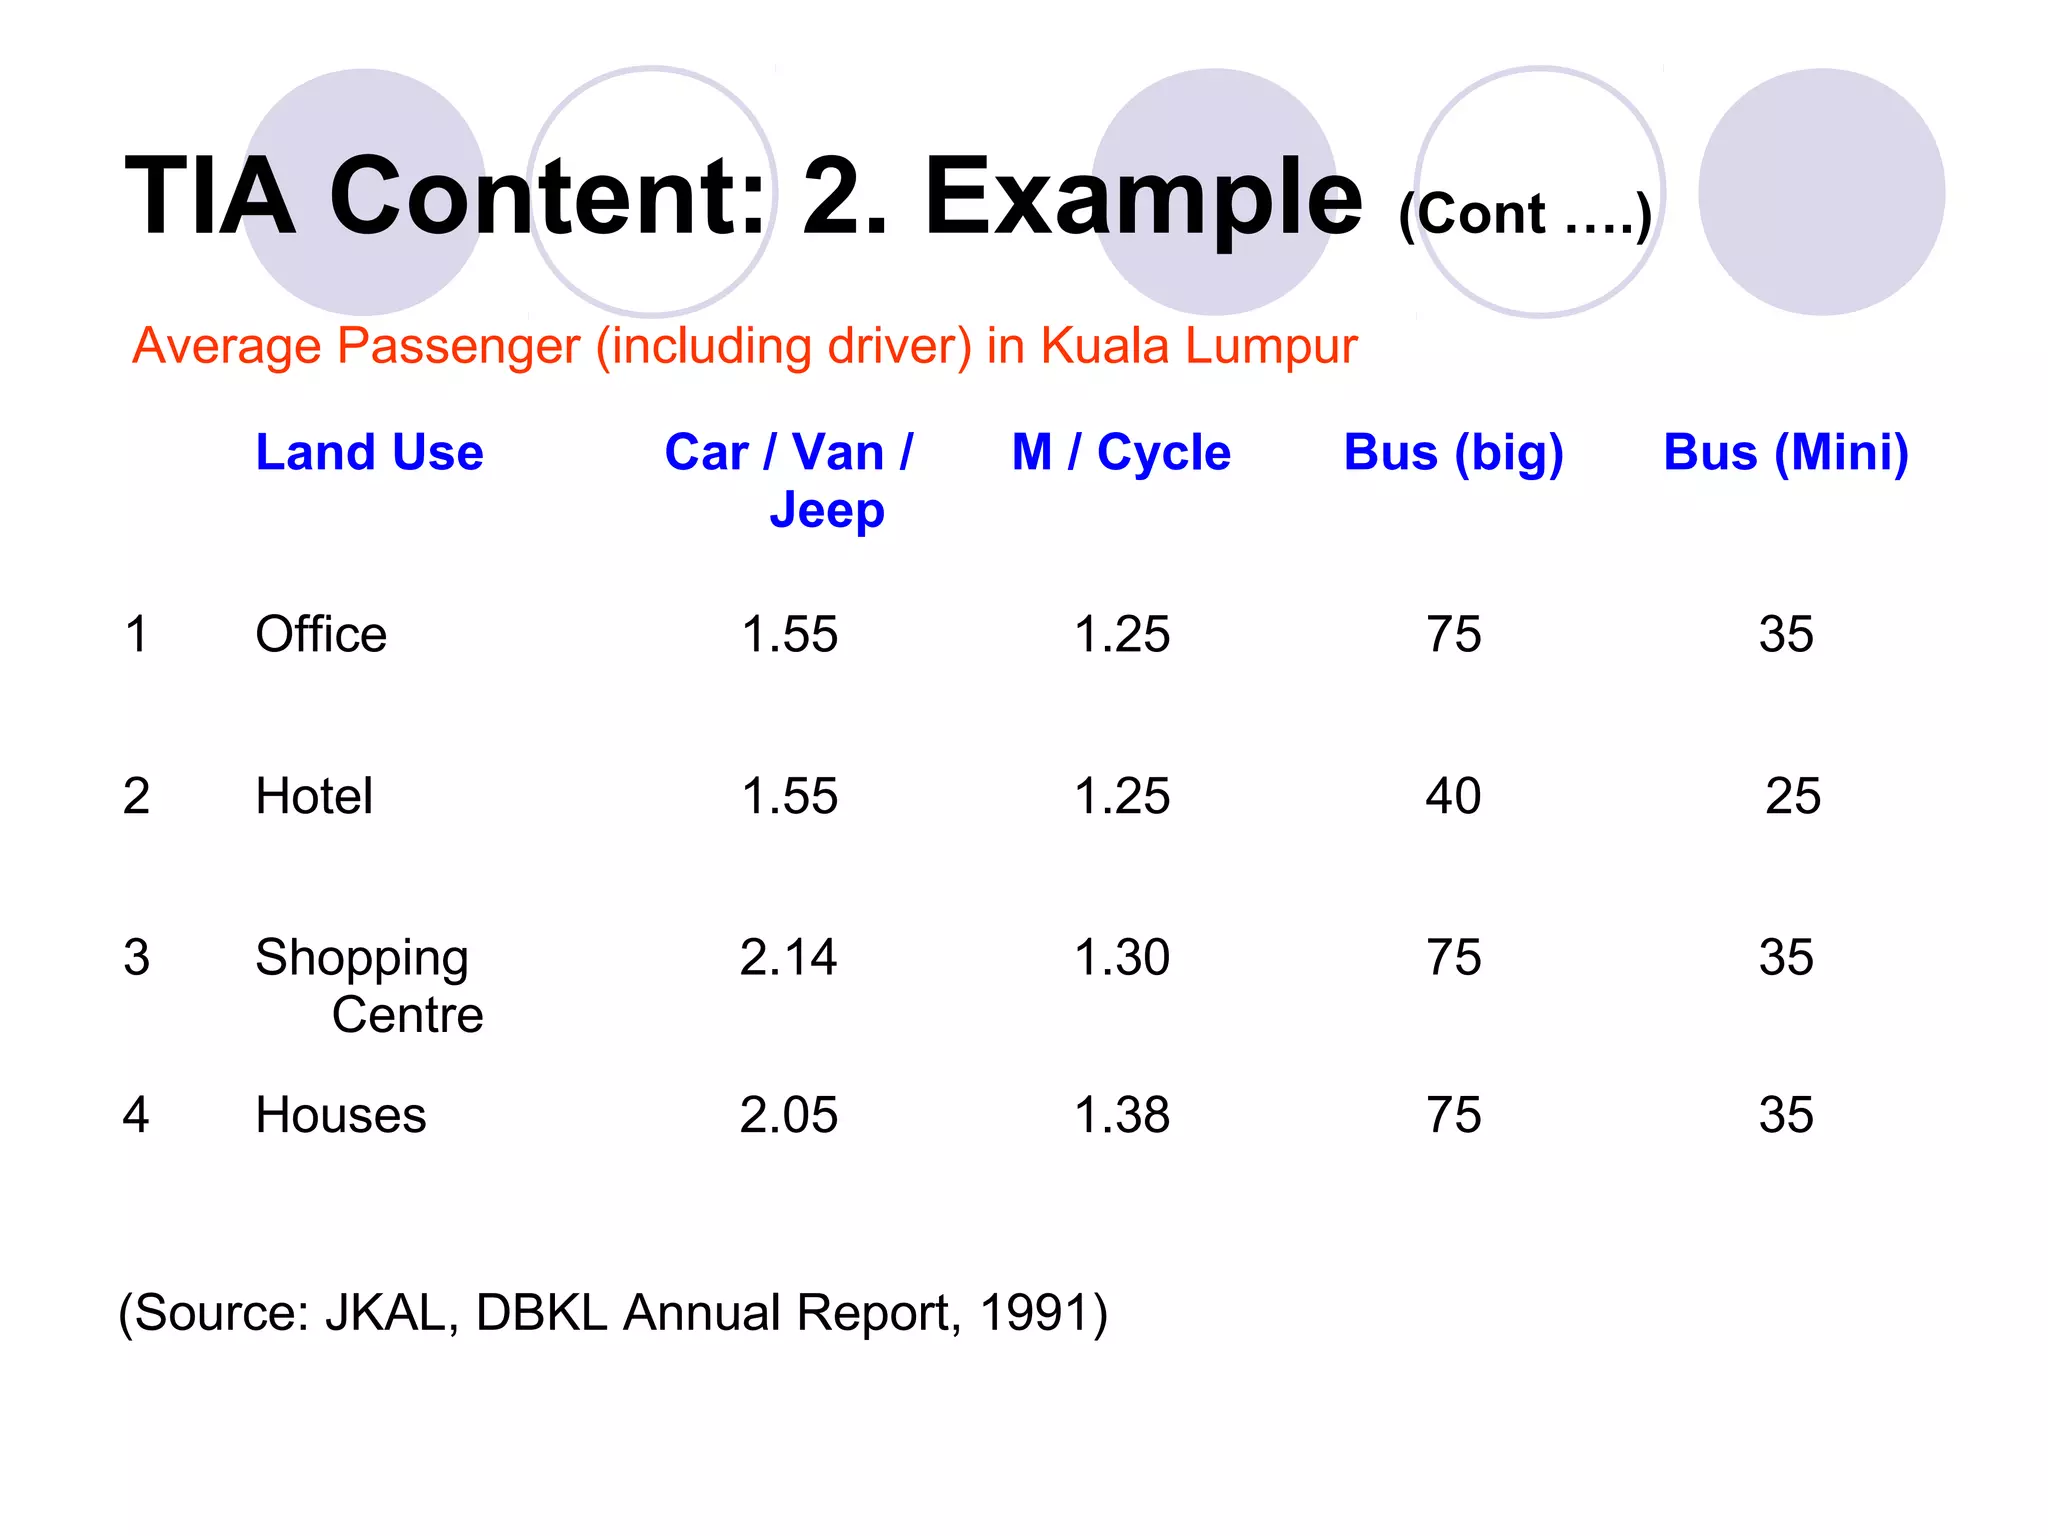
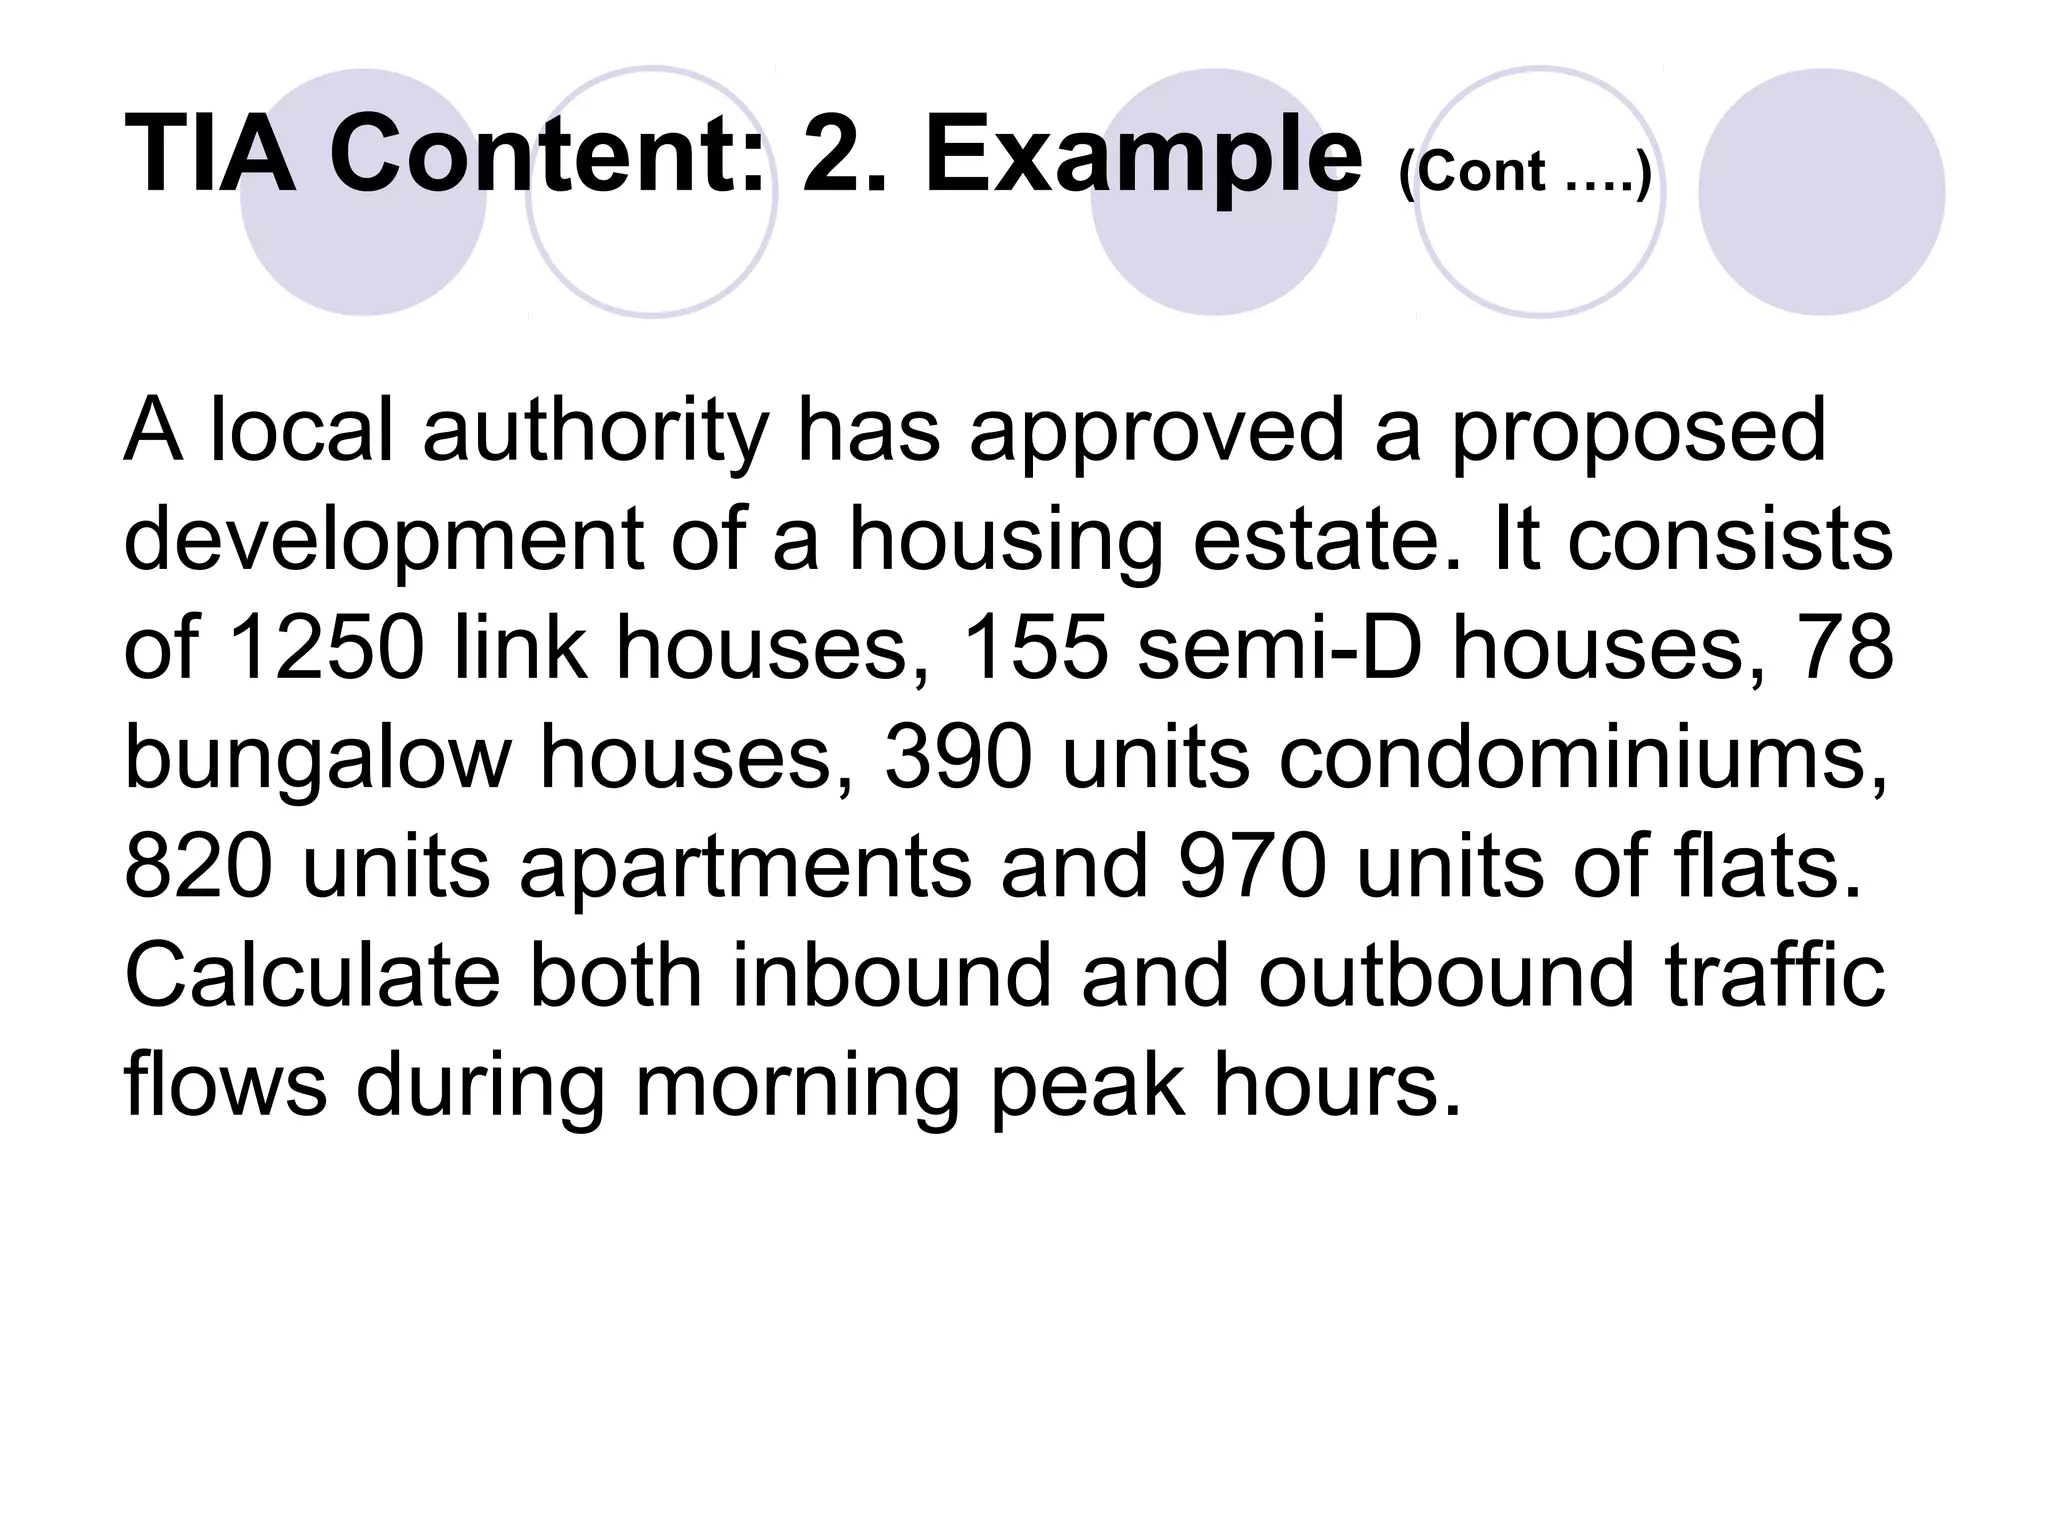
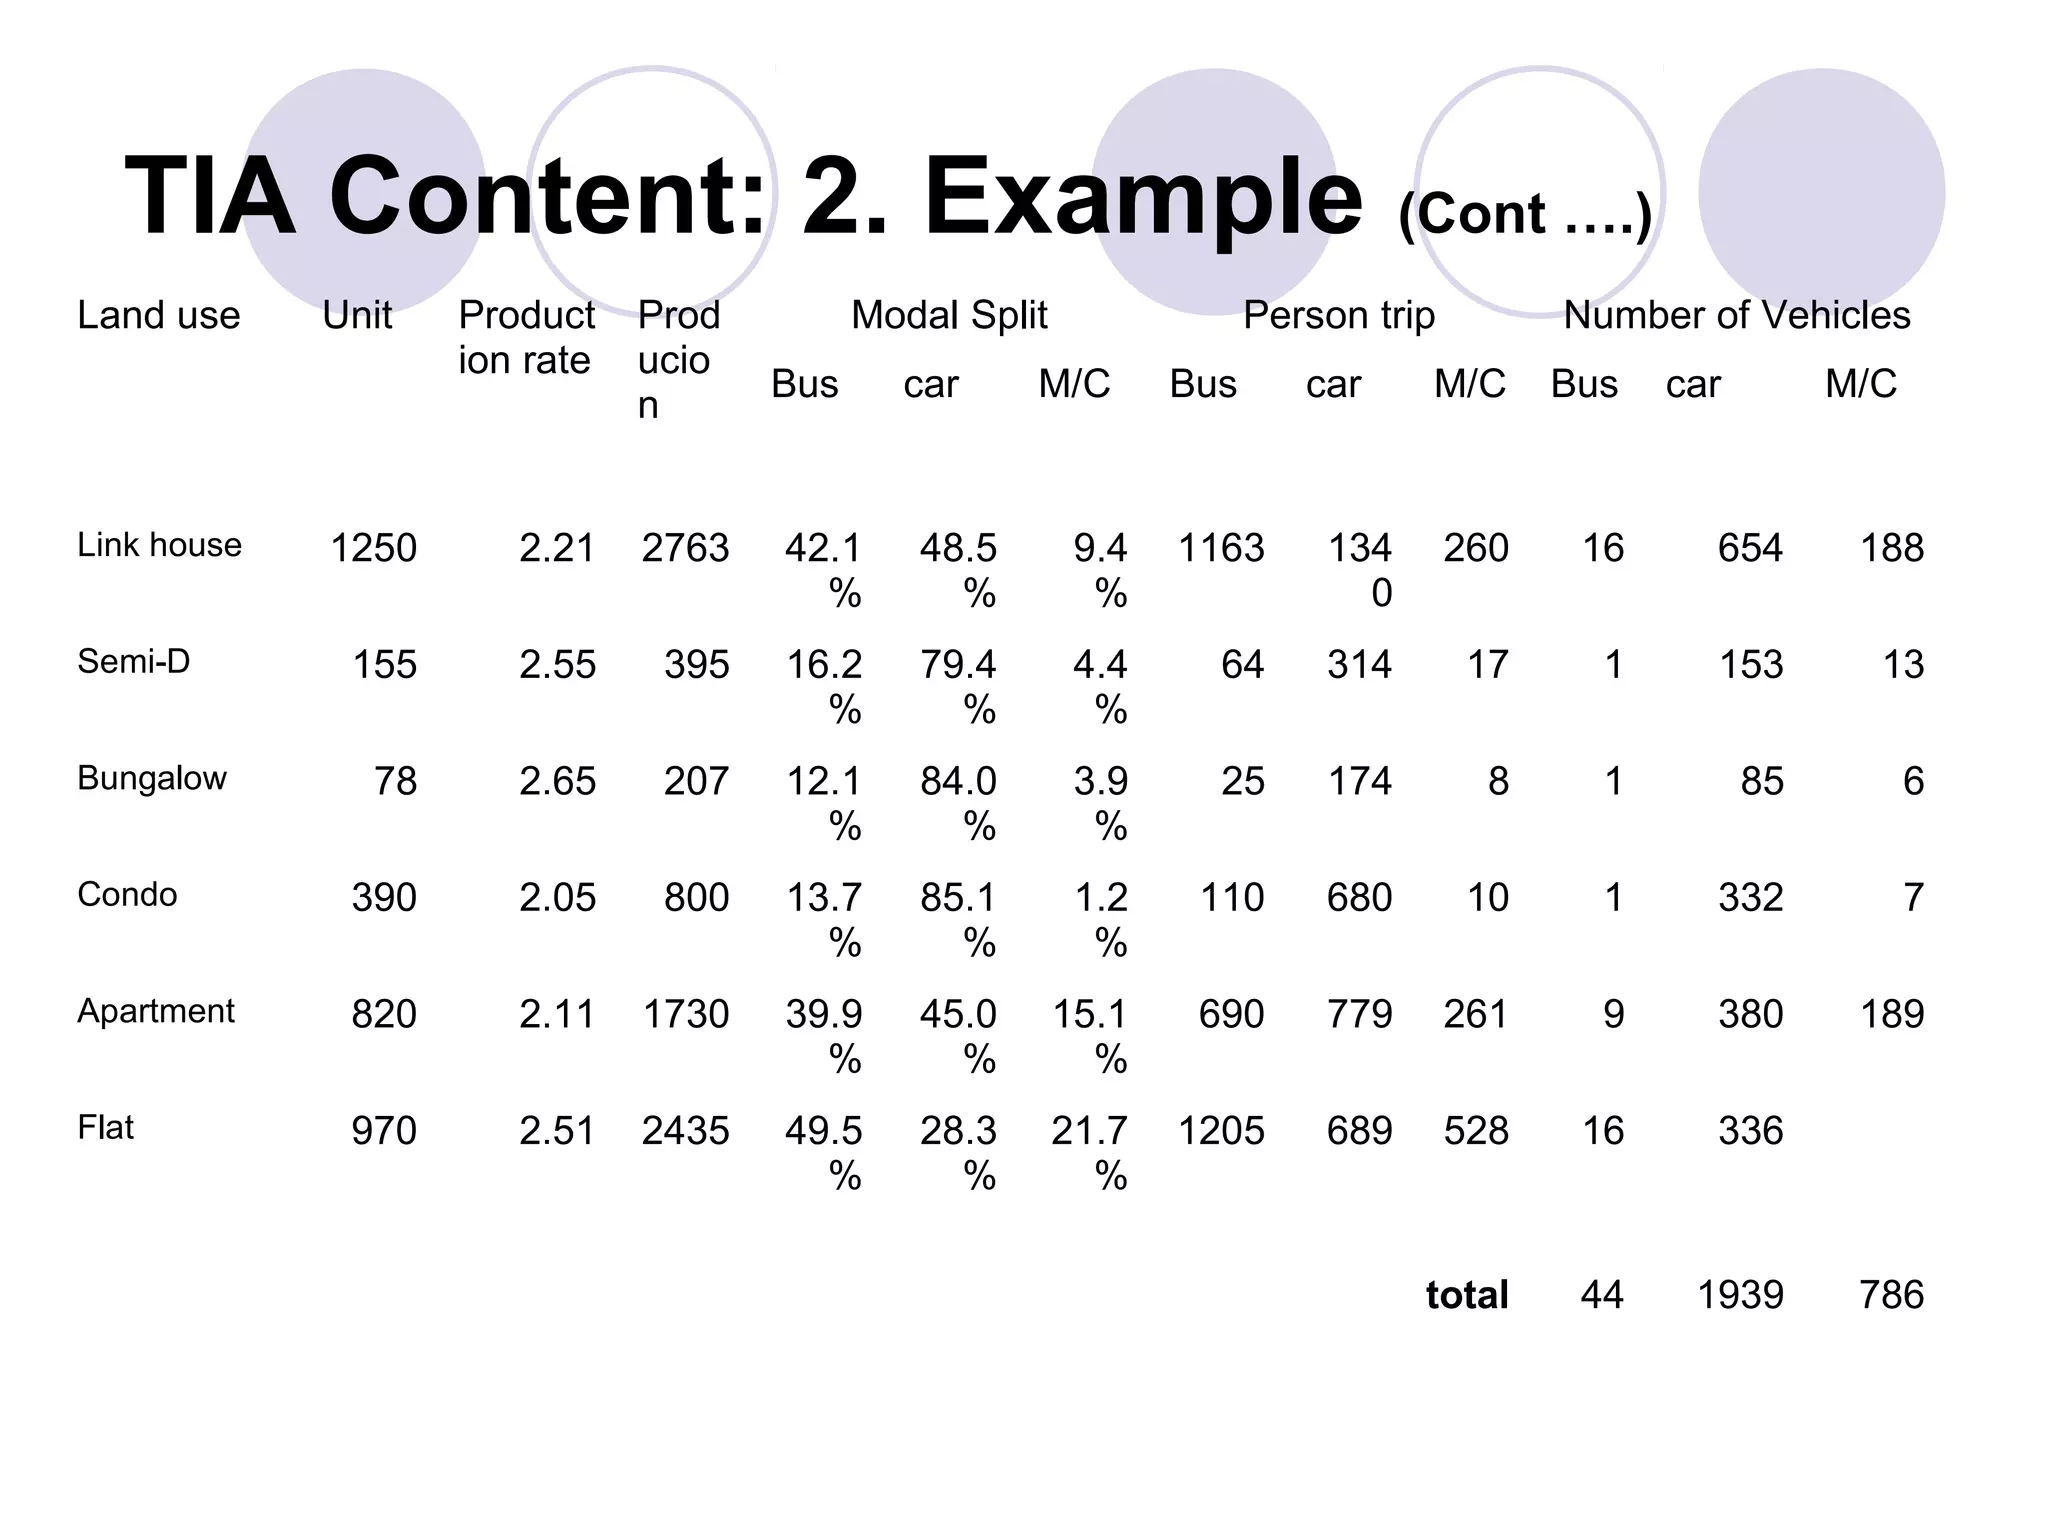
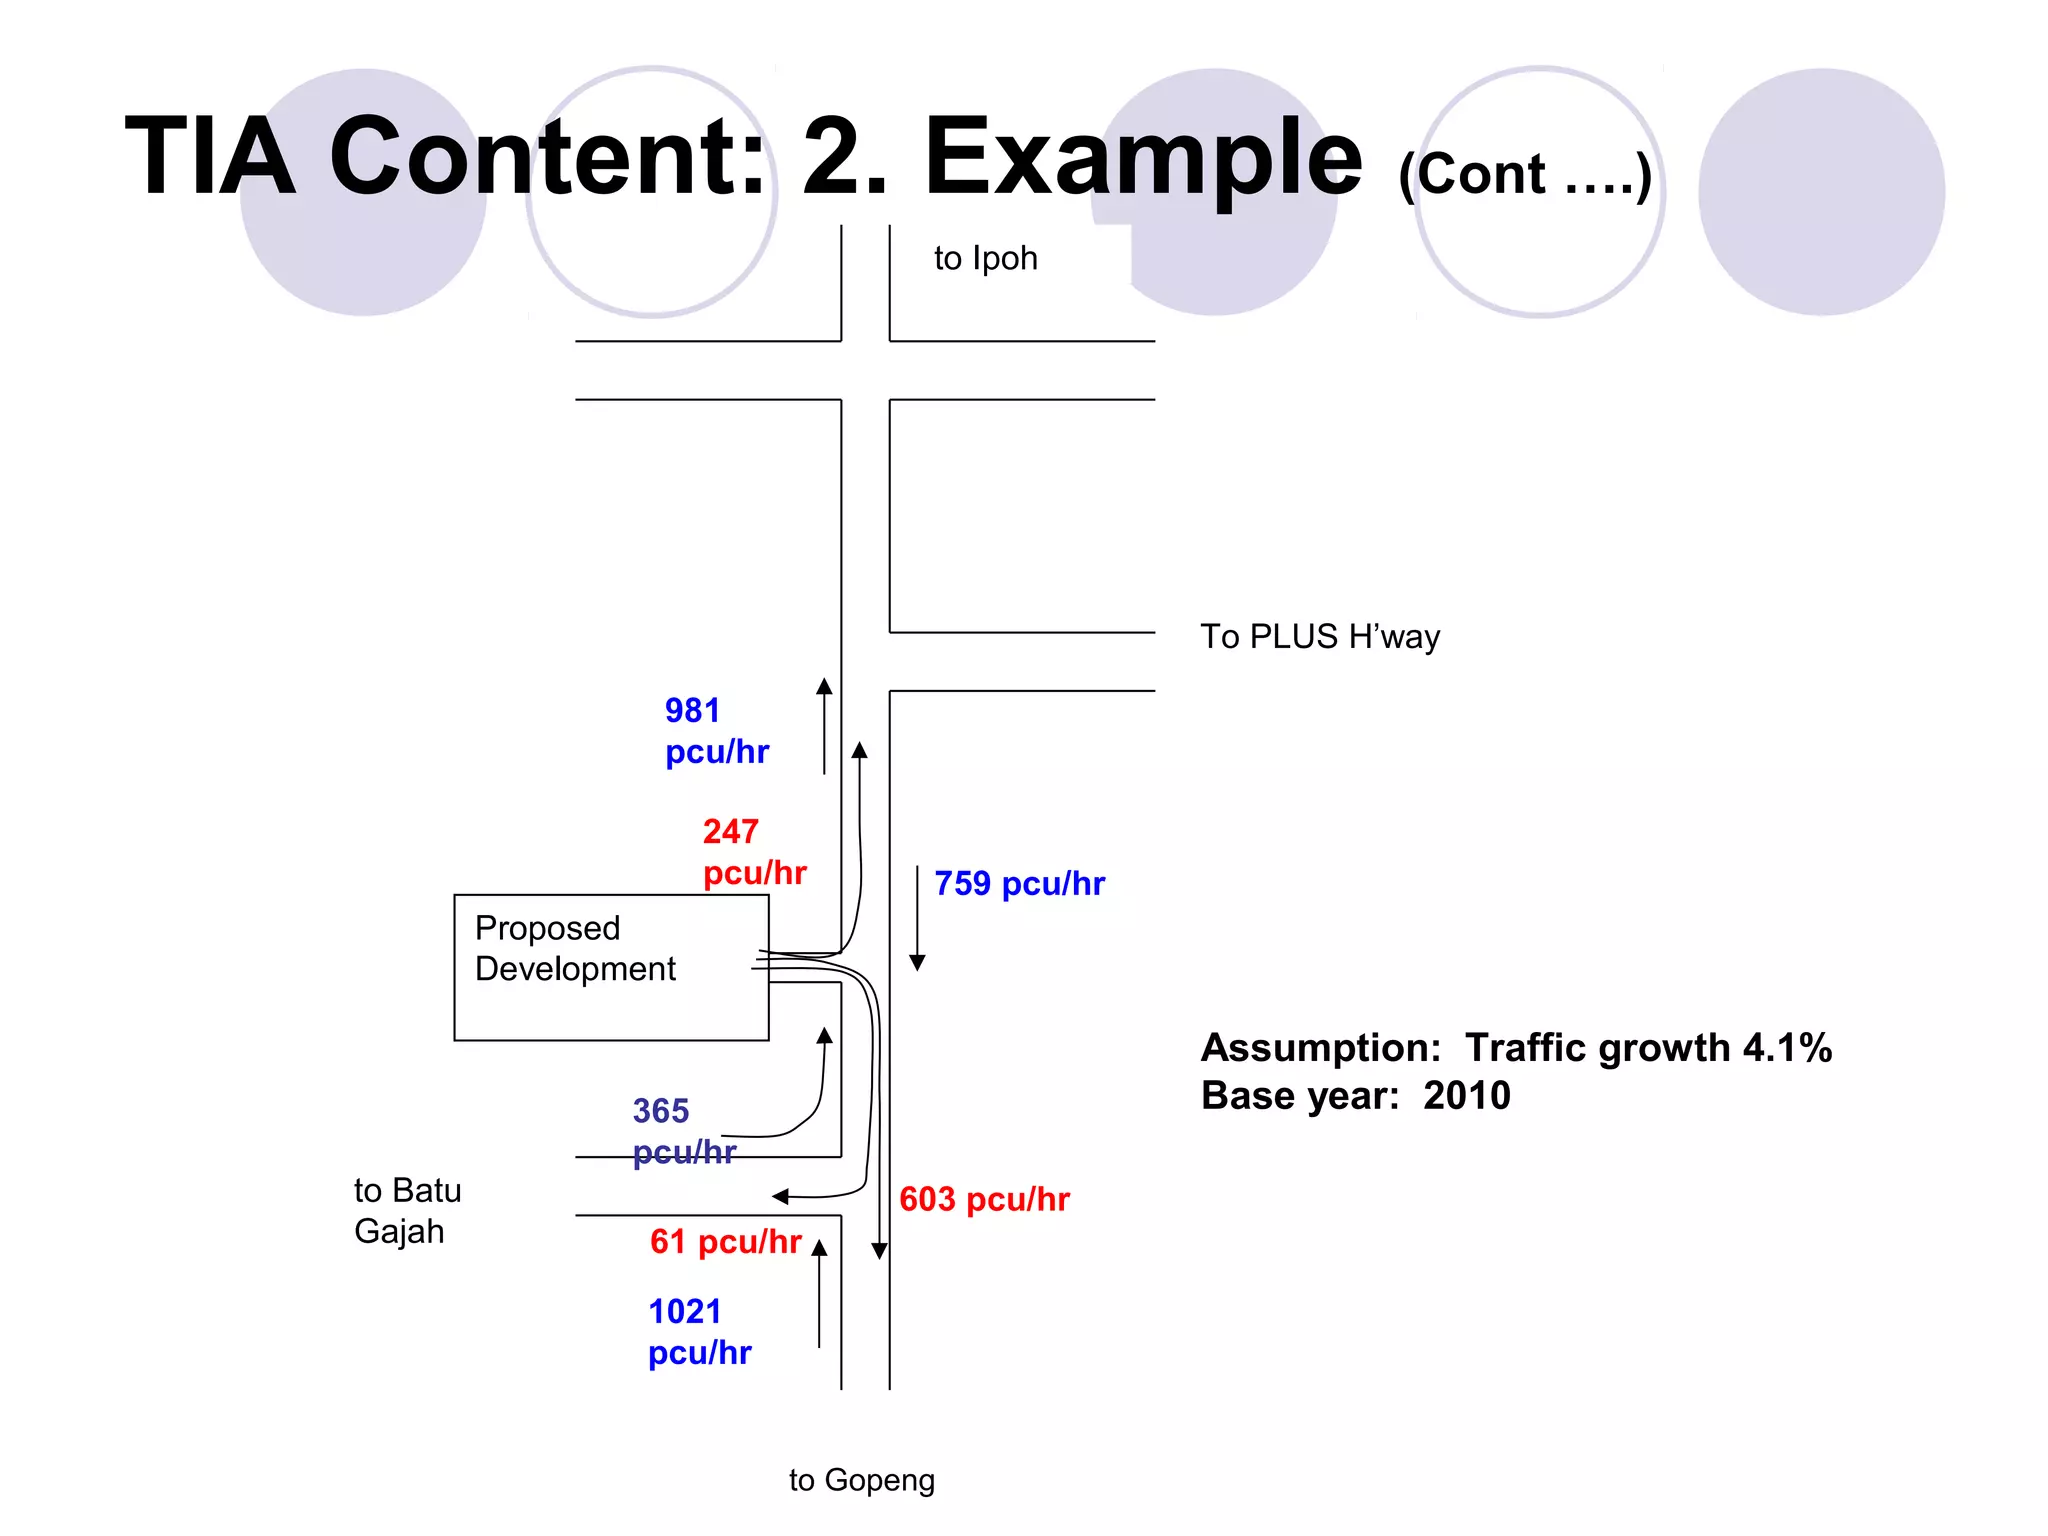
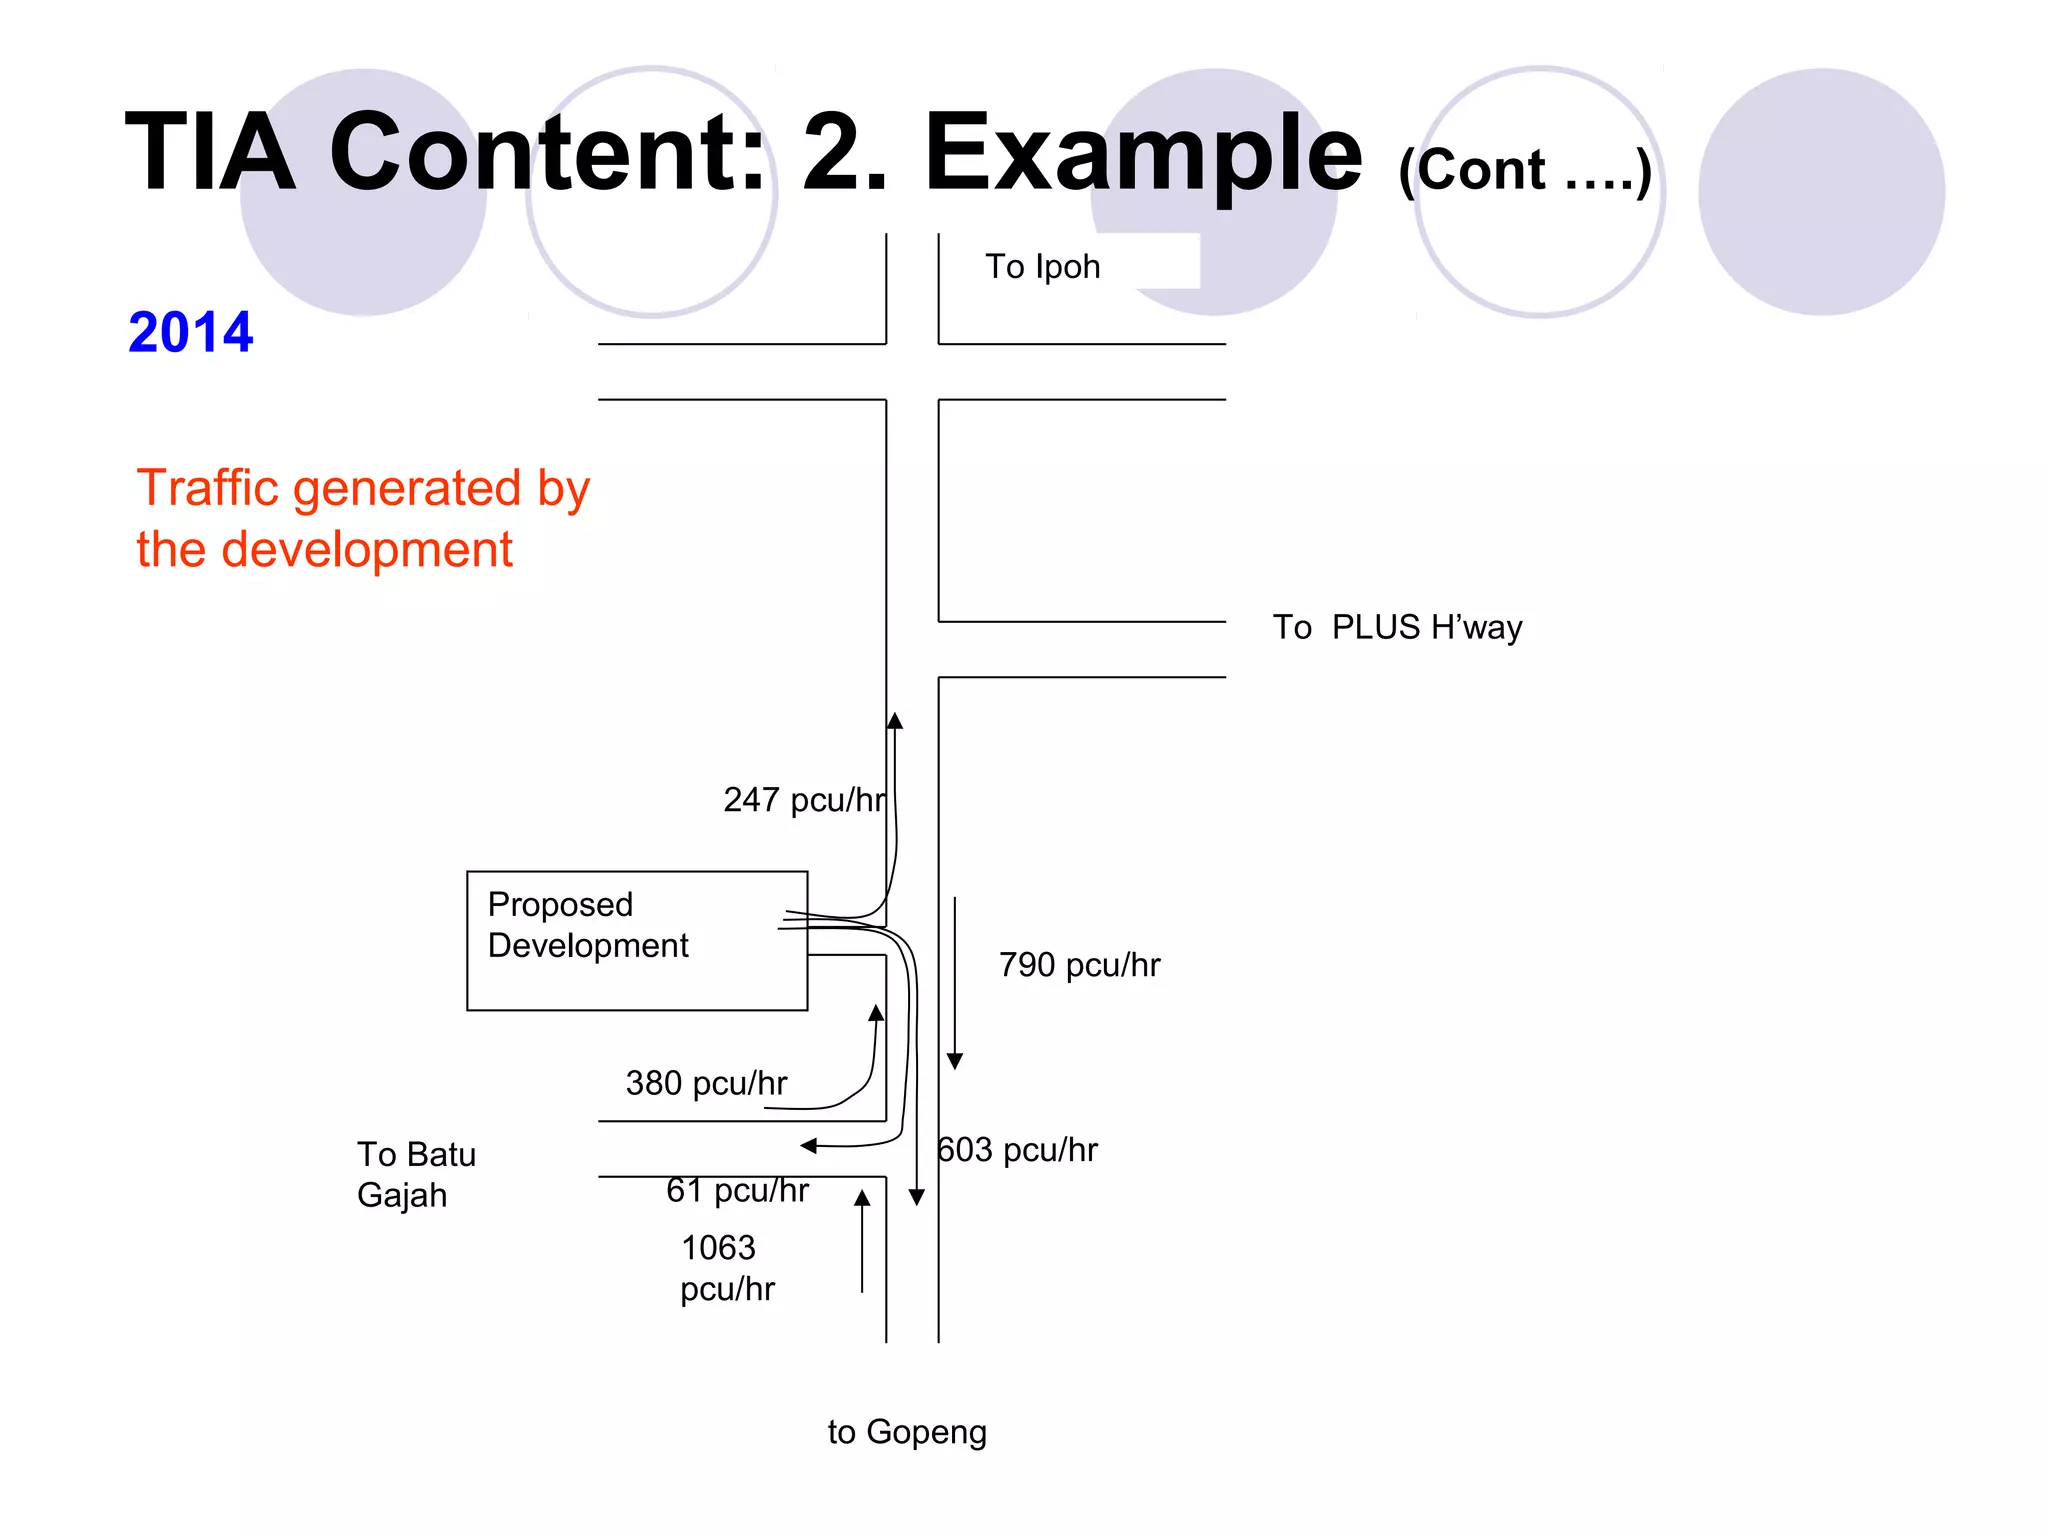


The document discusses the key components and process of conducting a Traffic Impact Assessment (TIA) for a development project. A TIA is needed to analyze the traffic effects of a development on surrounding transport facilities. The summary includes: 1) A TIA involves analyzing existing traffic conditions, trip generation from the development, trip distribution patterns, modal split, and impacts on road network capacity, safety, and public transport facilities. 2) The analysis includes traffic surveys, calculating trip generation based on development size and land use, distributing trips based on gravity models, and assigning trips based on modal split ratios. 3) The TIA report outlines impacts and makes proposals to mitigate problems identified, such as exceeding road network capacity


