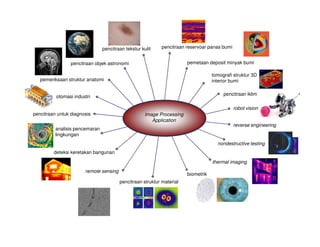
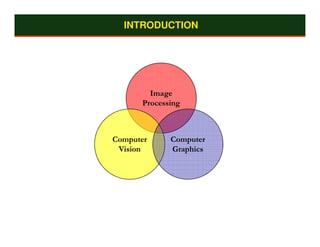
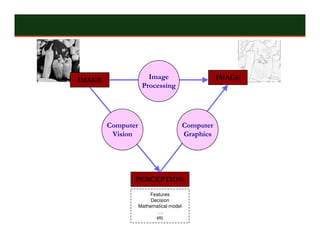
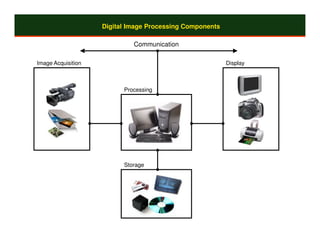
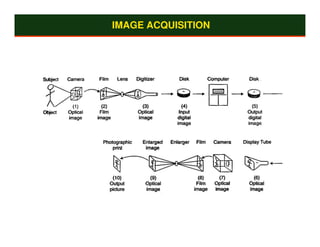
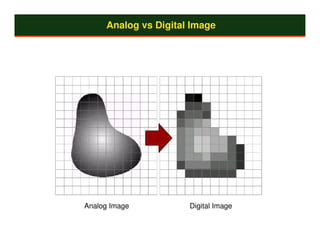
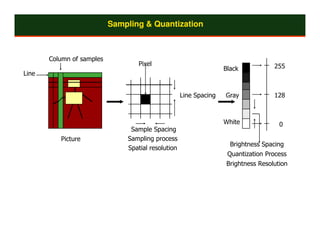
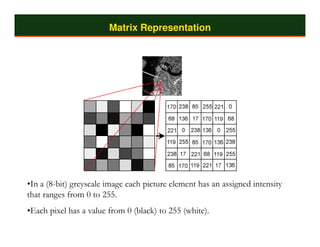
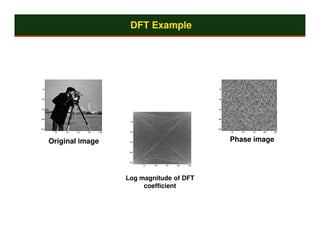
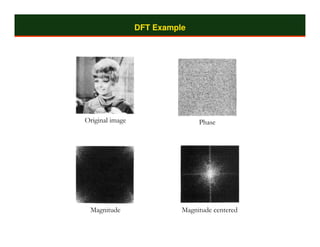
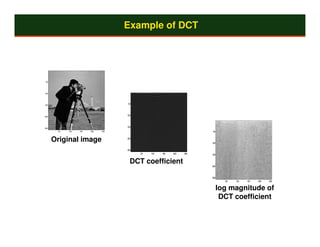
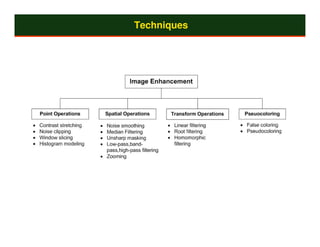
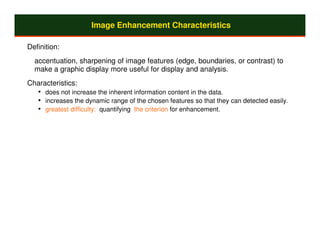
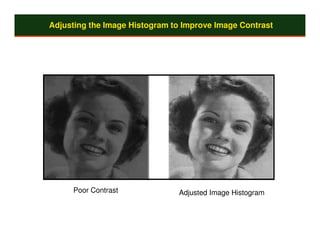
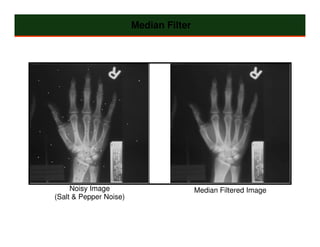
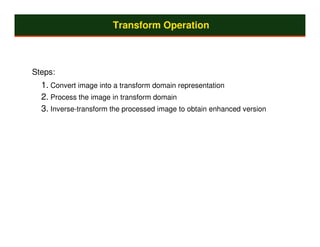
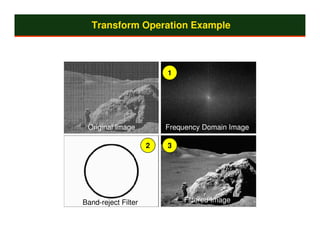
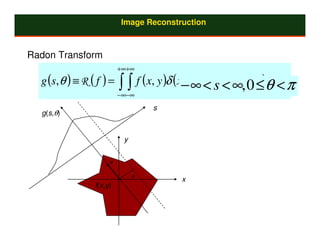
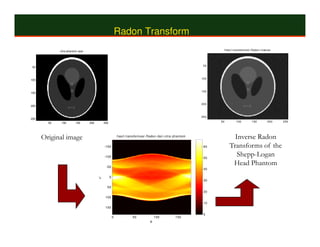
INTRODUCTION TO IMAGE
PROCESSING AND ANALYSIS


Tati R. Mengko
Sinyal dan Informasi


                                                                                  central sulcus
                                 Transmisi sinyal ke otak
                                                                       motor control        touch & pressure
                                                                                                     taste
                                                            speech


                                                               smell
                                                                                                         vision

                                                                       hearing


                                                                                 ACTION

Morphonix LLC, Sausalito, CA
Sistem Visual


                Zrener E, Science, 295, 1022-1025, (2002), AAAS
A picture says more than a thousand words


National Geograhic Traveler Magazine, May/June 2004, Photograph by Justin Guariglia
Citra Cahaya Tampak (Visible Light)

Warna


                  Kandinsky: Almost Abstract   Audrey Flack: A Super Realist Still Life


Tekstur


Persepsi Visual
Citra Cahaya tak Tampak (Non-visible Light)

Citra inframerah


Citra radar


Citra sinar-X
Modalitas Pencitraan

Citra terbentuk ketika sensor menangkap radiasi yang sudah
 berinteraksi dengan obyek fisik.

Informasi tentang obyek dalam pandangan direkam sebagai
  perubahan dalam intensitas dan warna dari radiasi yang
  dideteksi.
pencitraan tekstur kulit    pencitraan reservoar panas bumi


                 pencitraan objek astronomi                            pemetaan deposit minyak bumi

                                                                                   tomografi struktur 3D
   pemeriksaan struktur anatomi                                                    interior bumi

                                                                                        pencitraan iklim
          otomasi industri

                                                                                              robot vision
pencitraan untuk diagnosis                          Image Processing
                                                       Application
                                                                                              reverse engineering
          analisis pencemaran
          lingkungan
                                                                                     nondestructive testing
         deteksi keretakan bangunan

                                                                                   thermal imaging
                       remote sensing
                                                                       biometrik
                                        pencitraan struktur material
Iris Scan


Differentiation of people uses unique patterns in the iris tissue known as the
trabecular meshwork


Attacks and Countermeasures


Usability
the da Vinci System, picture from IntuitiveSurgical.com
IMAGE PROCESSING & ANALYSIS SCHEME


Problem Domain:
                              Intermediate Level Image Processing


                                      Feature Extraction


       Pre -
    processing


                                                                              Recognition &
                                    Knowledge base                            Interpretation      Result


     Image
    Acquisition


 Low Level Image Processing                                         High Level Image Processing
INTRODUCTION


        Image
      Processing


Computer     Computer
 Vision      Graphics
IMAGE                 Image                        IMAGE
                    Processing


        Computer                        Computer
         Vision                         Graphics


               PERCEPTION
                       Features
                        Decision
                   Mathematical model
                          ….
                          etc
Digital Image Processing Components

                             Communication

Image Acquisition                                         Display


                          Processing


                          Storage
Part 2:


Image Acquisition
IMAGE ACQUISITION
IMAGE ACQUISITION
Analog vs Digital Image


Analog Image          Digital Image
Sampling & Quantization


       Column of samples
                                  Pixel                                            255
                                                                   Black
Line


                                                    Line Spacing   Gray            128


                                                                   White             0
                                Sample Spacing
          Picture              Sampling process
                                                                     Brightness Spacing
                               Spatial resolution
                                                                    Quantization Process
                                                                   Brightness Resolution
Matrix Representation


•In a (8-bit) greyscale image each picture element has an assigned intensity
that ranges from 0 to 255.
•Each pixel has a value from 0 (black) to 255 (white).
Part 3
IMAGE PRE-PROCESSING
    Image Transform
Why Do Transforms?

• Fast computation
  • e.g., convolution vs. multiplication
• Conceptual insights for various image processing
  • e.g., spatial frequency info. (smooth, moderate change, fast change,
    etc)

• Obtain transformed data as measurement
  • e.g., medical images
  • Need inverse transform
Image Transforms

Image transforms     a class of unitary matrices used for representing
  images.
  • Simple arithmetic operations on images or complex mathematical operations
    which convert images from one representation to another.

Transform theory has played a key role in image processing for a number
  of years.

2-D transforms are used for image enhancement, restoration, encoding,
  and description.
Image Transforms

Foundations for image transforms
  • Matrices
  • Unitary transform (and orthogonal transfrom)
  • (K-L transform)
Examples of unitary transforms
  • Discrete Fourier Transform (DFT)
  • Discrete Cosine Transform (DCT)
  • Haar transform
  • K-L transform
DFT Example


50                                                                      50


100                                                                     100


150                                                                     150


200                                                                     200
                                     50


250                                                                     250
       50   100   150   200   250    100                                      50   100   150   200   250


      Original image                 150
                                                                              Phase image
                                     200


                                     250
                                           50   100   150   200   250


                                    Log magnitude of DFT
                                         coefficient
DFT Example


Original image                  Phase


 Magnitude                 Magnitude centered
Example of DCT


50


100


150
                                    50


                                    100
200


                                    150
250
       50   100   150   200   250                                      50


      Original image                200
                                                                       100


                                    250
                                          50   100   150   200   250   150


                                      DCT coefficient                  200


                                                                       250
                                                                               50   100   150   200   250


                                                                             log magnitude of
                                                                              DCT coefficient
Part 4
IMAGE PRE-PROCESSING
   Image Enhancement
Techniques
Image Enhancement Characteristics

Definition:
  accentuation, sharpening of image features (edge, boundaries, or contrast) to
  make a graphic display more useful for display and analysis.
Characteristics:
   • does not increase the inherent information content in the data.
   • increases the dynamic range of the chosen features so that they can detected easily.
   • greatest difficulty: quantifying the criterion for enhancement.
Adjusting the Image Histogram to Improve Image Contrast


     Poor Contrast             Adjusted Image Histogram
Median Filter


     Noisy Image                        Median Filtered Image
(Salt & Pepper Noise)
Transform Operation


Steps:
  1. Convert image into a transform domain representation
  2. Process the image in transform domain
  3. Inverse-transform the processed image to obtain enhanced version
Transform Operation Example


                         1


 Original Image          Frequency Domain Image

                     2   3


Band-reject Filter           Filtered Image
Part 5
IMAGE RECONSTRUCTION
Image Reconstruction


Radon Transform
                         +∞+∞
  g (s,θ ) ≡ R ( f ) =   ∫ ∫ f (x, y )δ (x− ∞θ<+sy< ∞, 0 ≤)θ < π
                         −∞−∞
                                          cos     sin θ − s dx dy

                                  s
  g(s,θ)


                          y


                     u

                              θ
                                       x
                f(x,y)
Radon Transform
             citra phantom asal                                                                                          Has il trans form as i Radon invers e


                                                                                                               50
 50


100                                                                                                           100


                                                                                                              150
150


200                                                               Radon Transform                             200


                                                                  of Head Phantom                             250
250
        50    100        150      200        250                      Using 90                                      50            100          150         200   250


                                                                     Projections
      Original image                                       has il trans form as i Radon dari c itra phantom
                                                                                                                               Inverse Radon
                                             -150                                                              60            Transforms of the
                                             -100                                                              50
                                                                                                                                Shepp-Logan
                                              -50
                                                                                                                              Head Phantom
                                                                                                               40

                                                   0
                                        x′


                                                                                                               30

                                               50
                                                                                                               20
                                              100
                                                                                                               10
                                              150

                                                                                                               0
                                                       0             50               100          150
                                                                                  θ
Part 5
FEATURE EXTRACTION
  Image Segmentation
Segmentation Methods

Boundary-based
  •   Edge detection

Region-based
  •   Thresholding


                                     1        2
Edge Detection Example

Example: Roberts Operator


    Original Image
Region-based Approach

Groups pixels based on similarity
  • Intensity similarity
  • Intensity variance similarity
  • etc.
FEATURE EXTRACTION
    Shape Analysis
y

                                                 RECTANGULARITY
       βmax
                      αmax

                  θ              Rectangularity (Bounding
                             x
                                  Rectangle)
αmin
                                  smallest rectangle that fits an
                  βmin            object according to its orientation


α = x cosθ + y sin θ
 β = − x sin θ + y cosθ
LR = α max − α min                  AR = LR .WR
WR = β max − β min
CIRCULARITY
 R

        Circularity
          • The smallest circle that encloses an
            object
          • Center of the circle = center of mass
            of the object
          • Radius = maximum distance between
            center and boundary

   P2
C=
   A
SHAPE DESCRIPTOR

SPHERICITY
• Ratio between smallest and biggest circle radius which
   are centered in the center of mass of the object.
• 0 ≤ spher ≤ 1
• Circle: spher = 1
                                                                Rc
            rinscribing ( Ri )
spher =
          rcircumscribed ( Rc )                        +
                                  Center of Mass           Ri
FEATURE EXTRACTION


Texture Analysis
Texture

Texture:

 A global pattern arising from the repetition, either deterministically or randomly,
 of local sub-patterns.


                                                                  Macrostructure


                                                                  Microstructure
1st Order Features

Based on image histogram characteristics


                                      Statistical Features:
                                      • Mean
                                      • Variance
                                      • Skewness
                                      • Curtosis
                                      • Entropy
Texture Isolation with Gabor Filter


                        Θ = 0o                  Θ = 30o
                                                    30


Frequency=√2/          Θ = 60o
                           60                   Θ = 90o
                                                    90
      23
Part 6
CLASSIFICATION
Problem


         Sumo Wrestler

Weight
                         Runner


                                  Horse-rider


                             Height
Approaches

Statistical Classification
  • Bayesian Classifier
Syntactical Classification
  • Rule-based Classification
Unsupervised Learning Approach
  • Neural Network
Examples

Statistical Classification


                                        ω1 = class-1
                                        ω2 = class-2
                                        x = classification object
Examples

Neural Network Diagram


        Features Input        Classification Output
References


S. Webb Ed., The Physics of Medical Imaging, Medical Science Series
Z-H Cho, JP Jones, & M. Singh, Foundations of Medical Imaging, Wiley
Z-P. Liang and Lauterbur, Principles of Magnetic Resonance Imaging: A
Signal Processing Perspective, IEEE Press, 2000.
AK Jain, Fundamentals of Digital Image Processing, PHI
RC. Gonzalez & RE Woods, Digital Image Processing, Pearson Education
Any sources from the internet.

01 introduction image processing analysis

  • 1.
    INTRODUCTION TO IMAGE PROCESSINGAND ANALYSIS Tati R. Mengko
  • 2.
    Sinyal dan Informasi central sulcus Transmisi sinyal ke otak motor control touch & pressure taste speech smell vision hearing ACTION Morphonix LLC, Sausalito, CA
  • 3.
    Sistem Visual Zrener E, Science, 295, 1022-1025, (2002), AAAS
  • 4.
    A picture saysmore than a thousand words National Geograhic Traveler Magazine, May/June 2004, Photograph by Justin Guariglia
  • 5.
    Citra Cahaya Tampak(Visible Light) Warna Kandinsky: Almost Abstract Audrey Flack: A Super Realist Still Life Tekstur Persepsi Visual
  • 6.
    Citra Cahaya takTampak (Non-visible Light) Citra inframerah Citra radar Citra sinar-X
  • 7.
    Modalitas Pencitraan Citra terbentukketika sensor menangkap radiasi yang sudah berinteraksi dengan obyek fisik. Informasi tentang obyek dalam pandangan direkam sebagai perubahan dalam intensitas dan warna dari radiasi yang dideteksi.
  • 8.
    pencitraan tekstur kulit pencitraan reservoar panas bumi pencitraan objek astronomi pemetaan deposit minyak bumi tomografi struktur 3D pemeriksaan struktur anatomi interior bumi pencitraan iklim otomasi industri robot vision pencitraan untuk diagnosis Image Processing Application reverse engineering analisis pencemaran lingkungan nondestructive testing deteksi keretakan bangunan thermal imaging remote sensing biometrik pencitraan struktur material
  • 9.
    Iris Scan Differentiation ofpeople uses unique patterns in the iris tissue known as the trabecular meshwork Attacks and Countermeasures Usability
  • 10.
    the da VinciSystem, picture from IntuitiveSurgical.com
  • 11.
    IMAGE PROCESSING &ANALYSIS SCHEME Problem Domain: Intermediate Level Image Processing Feature Extraction Pre - processing Recognition & Knowledge base Interpretation Result Image Acquisition Low Level Image Processing High Level Image Processing
  • 12.
    INTRODUCTION Image Processing Computer Computer Vision Graphics
  • 13.
    IMAGE Image IMAGE Processing Computer Computer Vision Graphics PERCEPTION Features Decision Mathematical model …. etc
  • 14.
    Digital Image ProcessingComponents Communication Image Acquisition Display Processing Storage
  • 15.
  • 16.
  • 17.
  • 18.
    Analog vs DigitalImage Analog Image Digital Image
  • 19.
    Sampling & Quantization Column of samples Pixel 255 Black Line Line Spacing Gray 128 White 0 Sample Spacing Picture Sampling process Brightness Spacing Spatial resolution Quantization Process Brightness Resolution
  • 20.
    Matrix Representation •In a(8-bit) greyscale image each picture element has an assigned intensity that ranges from 0 to 255. •Each pixel has a value from 0 (black) to 255 (white).
  • 21.
  • 22.
    IMAGE PRE-PROCESSING Image Transform
  • 23.
    Why Do Transforms? •Fast computation • e.g., convolution vs. multiplication • Conceptual insights for various image processing • e.g., spatial frequency info. (smooth, moderate change, fast change, etc) • Obtain transformed data as measurement • e.g., medical images • Need inverse transform
  • 24.
    Image Transforms Image transforms a class of unitary matrices used for representing images. • Simple arithmetic operations on images or complex mathematical operations which convert images from one representation to another. Transform theory has played a key role in image processing for a number of years. 2-D transforms are used for image enhancement, restoration, encoding, and description.
  • 25.
    Image Transforms Foundations forimage transforms • Matrices • Unitary transform (and orthogonal transfrom) • (K-L transform) Examples of unitary transforms • Discrete Fourier Transform (DFT) • Discrete Cosine Transform (DCT) • Haar transform • K-L transform
  • 26.
    DFT Example 50 50 100 100 150 150 200 200 50 250 250 50 100 150 200 250 100 50 100 150 200 250 Original image 150 Phase image 200 250 50 100 150 200 250 Log magnitude of DFT coefficient
  • 27.
    DFT Example Original image Phase Magnitude Magnitude centered
  • 28.
    Example of DCT 50 100 150 50 100 200 150 250 50 100 150 200 250 50 Original image 200 100 250 50 100 150 200 250 150 DCT coefficient 200 250 50 100 150 200 250 log magnitude of DCT coefficient
  • 29.
  • 30.
    IMAGE PRE-PROCESSING Image Enhancement
  • 31.
  • 32.
    Image Enhancement Characteristics Definition: accentuation, sharpening of image features (edge, boundaries, or contrast) to make a graphic display more useful for display and analysis. Characteristics: • does not increase the inherent information content in the data. • increases the dynamic range of the chosen features so that they can detected easily. • greatest difficulty: quantifying the criterion for enhancement.
  • 33.
    Adjusting the ImageHistogram to Improve Image Contrast Poor Contrast Adjusted Image Histogram
  • 34.
    Median Filter Noisy Image Median Filtered Image (Salt & Pepper Noise)
  • 35.
    Transform Operation Steps: 1. Convert image into a transform domain representation 2. Process the image in transform domain 3. Inverse-transform the processed image to obtain enhanced version
  • 36.
    Transform Operation Example 1 Original Image Frequency Domain Image 2 3 Band-reject Filter Filtered Image
  • 37.
  • 38.
  • 39.
    Image Reconstruction Radon Transform +∞+∞ g (s,θ ) ≡ R ( f ) = ∫ ∫ f (x, y )δ (x− ∞θ<+sy< ∞, 0 ≤)θ < π −∞−∞ cos sin θ − s dx dy s g(s,θ) y u θ x f(x,y)
  • 40.
    Radon Transform citra phantom asal Has il trans form as i Radon invers e 50 50 100 100 150 150 200 Radon Transform 200 of Head Phantom 250 250 50 100 150 200 250 Using 90 50 100 150 200 250 Projections Original image has il trans form as i Radon dari c itra phantom Inverse Radon -150 60 Transforms of the -100 50 Shepp-Logan -50 Head Phantom 40 0 x′ 30 50 20 100 10 150 0 0 50 100 150 θ
  • 41.
  • 42.
    FEATURE EXTRACTION Image Segmentation
  • 43.
    Segmentation Methods Boundary-based • Edge detection Region-based • Thresholding 1 2
  • 44.
    Edge Detection Example Example:Roberts Operator Original Image
  • 45.
    Region-based Approach Groups pixelsbased on similarity • Intensity similarity • Intensity variance similarity • etc.
  • 46.
    FEATURE EXTRACTION Shape Analysis
  • 47.
    y RECTANGULARITY βmax αmax θ Rectangularity (Bounding x Rectangle) αmin smallest rectangle that fits an βmin object according to its orientation α = x cosθ + y sin θ β = − x sin θ + y cosθ LR = α max − α min AR = LR .WR WR = β max − β min
  • 48.
    CIRCULARITY R Circularity • The smallest circle that encloses an object • Center of the circle = center of mass of the object • Radius = maximum distance between center and boundary P2 C= A
  • 49.
    SHAPE DESCRIPTOR SPHERICITY • Ratiobetween smallest and biggest circle radius which are centered in the center of mass of the object. • 0 ≤ spher ≤ 1 • Circle: spher = 1 Rc rinscribing ( Ri ) spher = rcircumscribed ( Rc ) + Center of Mass Ri
  • 50.
  • 51.
    Texture Texture: A globalpattern arising from the repetition, either deterministically or randomly, of local sub-patterns. Macrostructure Microstructure
  • 52.
    1st Order Features Basedon image histogram characteristics Statistical Features: • Mean • Variance • Skewness • Curtosis • Entropy
  • 53.
    Texture Isolation withGabor Filter Θ = 0o Θ = 30o 30 Frequency=√2/ Θ = 60o 60 Θ = 90o 90 23
  • 54.
  • 55.
  • 56.
    Problem Sumo Wrestler Weight Runner Horse-rider Height
  • 57.
    Approaches Statistical Classification • Bayesian Classifier Syntactical Classification • Rule-based Classification Unsupervised Learning Approach • Neural Network
  • 58.
    Examples Statistical Classification ω1 = class-1 ω2 = class-2 x = classification object
  • 59.
    Examples Neural Network Diagram Features Input Classification Output
  • 60.
    References S. Webb Ed.,The Physics of Medical Imaging, Medical Science Series Z-H Cho, JP Jones, & M. Singh, Foundations of Medical Imaging, Wiley Z-P. Liang and Lauterbur, Principles of Magnetic Resonance Imaging: A Signal Processing Perspective, IEEE Press, 2000. AK Jain, Fundamentals of Digital Image Processing, PHI RC. Gonzalez & RE Woods, Digital Image Processing, Pearson Education Any sources from the internet.