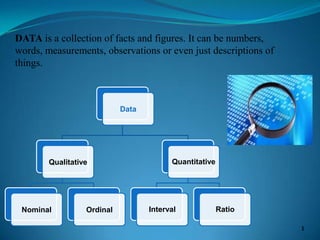
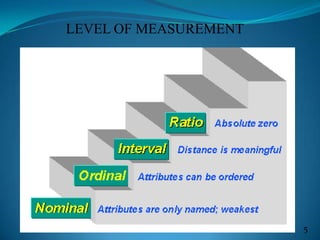
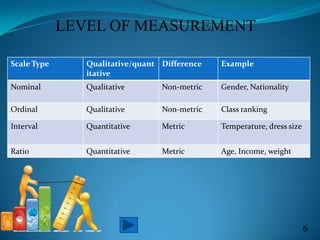
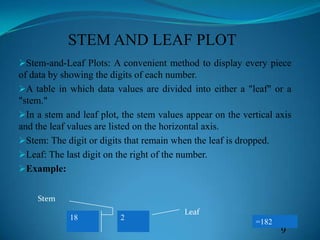
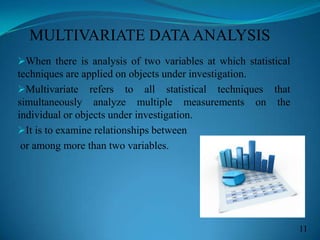
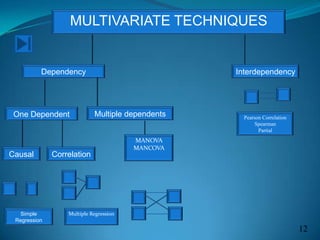
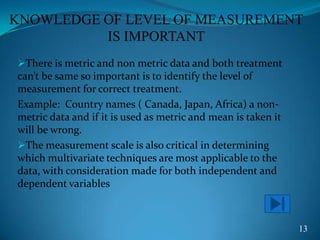
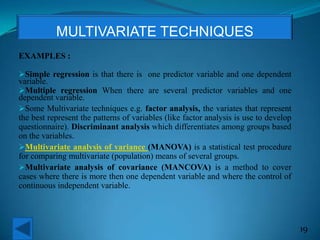
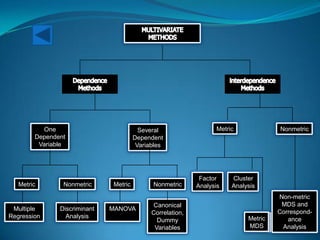
“MULTIVARIATE DATA ANALYSIS”
PRESENTED BY
1- Faiza Batool
2- Faisal Hafeez
2
LIST OF TOPICS
1-Qualitative and Quantitative Data
2- Level of Measurement
3-Frequency Distribution
4- Stem and Leaf Plot
5- SPSS demonstration and interpretation
6- What are Multivariate data analysis and multivariate technique?
7- Why the knowledge of level of measurement is important?
DATA is a collection of facts and figures. It can be numbers,
words, measurements, observations or even just descriptions of
things.
1
Data
Qualitative
Nominal Ordinal
Quantitative
Interval Ratio
QUALITATIVE DATA
Qualitative data can be arranged into categories that are not
numerical. These categories can be physical traits, gender, colours or
anything that does not have a number associated to it.
Example: case studies and interviews. They provide a more in
depth and rich description.
2
QUANTITATIVE DATA
The term quantitative data is used to describe a type of
information that can be counted or expressed numerically. This
type of data is often collected in experiments, manipulated and
statistically analyzed.
Quantitative methods are those which focus on numbers and
frequencies rather than on meaning and experience.
These data may be represented by interval or ratio scales.
Examples of quantitative data are scores on achievement tests,
number of hours of study, or weight of a subject.
3
1
4
LEVEL OF MEASUREMENT
5
LEVEL OF MEASUREMENT
6
Scale Type Qualitative/quant
itative
Difference Example
Nominal Qualitative Non-metric Gender, Nationality
Ordinal Qualitative Non-metric Class ranking
Interval Quantitative Metric Temperature, dress size
Ratio Quantitative Metric Age, Income, weight
FREQUENCY DISTRIBUTION
A method of showing the number of occurrences of observational data
in order from least to greatest.
When a data set with a variable that has numerical values, to make a
frequency distribution or more likely, a histogram of the data from that
variable in order to explore the shape of the data center, skew, gaps,
unusually high or low values, etc.
The frequencies command(SPSS) can be used to determine measures
of central tendency (mean, median, and mode), measures of dispersion
(standard deviation, variance, minimum and maximum), measures of
skewness and kurtosis and create histograms.
7
FREQUENCY DISTRIBUTION
Frequency analysis to answer research question. Frequency analysis
is a descriptive statistical method that shows the number of
occurrences of each response chosen by the respondents.
8
STEM AND LEAF PLOT
Stem-and-Leaf Plots: A convenient method to display every piece
of data by showing the digits of each number.
A table in which data values are divided into either a "leaf" or a
"stem."
In a stem and leaf plot, the stem values appear on the vertical axis
and the leaf values are listed on the horizontal axis.
Stem: The digit or digits that remain when the leaf is dropped.
Leaf: The last digit on the right of the number.
Example:
9
18 2
Stem
Leaf
=182
STEM AND LEAF PLOT
10
SPSS DEMONSTRATION AND INTERPRETATION
1-Execution of frequency distribution
2-Executing stem and leaf plot
13
MULTIVARIATE DATAANALYSIS
When there is analysis of two variables at which statistical
techniques are applied on objects under investigation.
Multivariate refers to all statistical techniques that
simultaneously analyze multiple measurements on the
individual or objects under investigation.
It is to examine relationships between
or among more than two variables.
11
MULTIVARIATE TECHNIQUES
Dependency Interdependency
One Dependent
Causal Correlation
Simple
Regression
Multiple Regression
Multiple dependents
MANOVA
MANCOVA
Pearson Correlation
Spearman
Partial
12
KNOWLEDGE OF LEVEL OF MEASUREMENT
IS IMPORTANT
There is metric and non metric data and both treatment
can’t be same so important is to identify the level of
measurement for correct treatment.
Example: Country names ( Canada, Japan, Africa) a non-
metric data and if it is used as metric and mean is taken it
will be wrong.
The measurement scale is also critical in determining
which multivariate techniques are most applicable to the
data, with consideration made for both independent and
dependent variables
13
17
18
EXAMPLES :
Simple regression is that there is one predictor variable and one dependent
variable.
Multiple regression When there are several predictor variables and one
dependent variable.
Some Multivariate techniques e.g. factor analysis, the variates that represent
the best represent the patterns of variables (like factor analysis is use to develop
questionnaire). Discriminant analysis which differentiates among groups based
on the variables.
Multivariate analysis of variance (MANOVA) is a statistical test procedure
for comparing multivariate (population) means of several groups.
Multivariate analysis of covariance (MANCOVA) is a method to cover
cases where there is more then one dependent variable and where the control of
continuous independent variable.
19
MULTIVARIATE TECHNIQUES
20
Multiple
Regression
Discriminant
Analysis
MANOVA
Canonical
Correlation,
Dummy
Variables
Metric Nonmetric Metric Nonmetric
One
Dependent
Variable
Several
Dependent
Variables
Metric Nonmetric
Factor
Analysis
Cluster
Analysis
Non-metric
MDS and
Correspond-
ance
Analysis
Metric
MDS
Metric
MDS
Multidimensional scaling (MDS) is a set of related statistical techniques
often used in information visualization for exploring similarities or
dissimilarities in data.
Cluster analysis is an exploratory data analysis tool for solving
classification problems. Its object is to sort cases (people, things, events,
etc) into groups, or clusters, so that the degree of association is strong
between members of the same cluster and weak between members of
different clusters.
In non-metric MDS, only the rank order of entries in the data matrix (not
the actual dissimilarities) is assumed to contain the significant information.
Dummy variables is one that takes the value 0 or 1 to indicate the
absence or presence of some categorical effect that may be expected to shift
the outcome.
Canonical correlation analysis is used to identify and measure the
associations among two sets of variables. Canonical correlation is
appropriate in the same situations where multiple regression would be, but
where are there are multiple inter correlated outcome variables.
21
LEVEL OF MEASUREMENT
Nominal Scales - A type of categorical data in which objects
fall into unordered categories.
Ordinal scales -provide no measure of the actual magnitude in
absolute terms ,only the order of values.
Interval scale- provides meaningful difference to value.
Ratio Scales - captures the properties of the other types of
scales, but also contains a true zero
22

Level of Measurement, Frequency Distribution,Stem & Leaf

  • 1.
    “MULTIVARIATE DATA ANALYSIS” PRESENTEDBY 1- Faiza Batool 2- Faisal Hafeez 2
  • 2.
    LIST OF TOPICS 1-Qualitativeand Quantitative Data 2- Level of Measurement 3-Frequency Distribution 4- Stem and Leaf Plot 5- SPSS demonstration and interpretation 6- What are Multivariate data analysis and multivariate technique? 7- Why the knowledge of level of measurement is important?
  • 3.
    DATA is acollection of facts and figures. It can be numbers, words, measurements, observations or even just descriptions of things. 1 Data Qualitative Nominal Ordinal Quantitative Interval Ratio
  • 4.
    QUALITATIVE DATA Qualitative datacan be arranged into categories that are not numerical. These categories can be physical traits, gender, colours or anything that does not have a number associated to it. Example: case studies and interviews. They provide a more in depth and rich description. 2
  • 5.
    QUANTITATIVE DATA The termquantitative data is used to describe a type of information that can be counted or expressed numerically. This type of data is often collected in experiments, manipulated and statistically analyzed. Quantitative methods are those which focus on numbers and frequencies rather than on meaning and experience. These data may be represented by interval or ratio scales. Examples of quantitative data are scores on achievement tests, number of hours of study, or weight of a subject. 3 1
  • 6.
  • 7.
  • 8.
    LEVEL OF MEASUREMENT 6 ScaleType Qualitative/quant itative Difference Example Nominal Qualitative Non-metric Gender, Nationality Ordinal Qualitative Non-metric Class ranking Interval Quantitative Metric Temperature, dress size Ratio Quantitative Metric Age, Income, weight
  • 9.
    FREQUENCY DISTRIBUTION A methodof showing the number of occurrences of observational data in order from least to greatest. When a data set with a variable that has numerical values, to make a frequency distribution or more likely, a histogram of the data from that variable in order to explore the shape of the data center, skew, gaps, unusually high or low values, etc. The frequencies command(SPSS) can be used to determine measures of central tendency (mean, median, and mode), measures of dispersion (standard deviation, variance, minimum and maximum), measures of skewness and kurtosis and create histograms. 7
  • 10.
    FREQUENCY DISTRIBUTION Frequency analysisto answer research question. Frequency analysis is a descriptive statistical method that shows the number of occurrences of each response chosen by the respondents. 8
  • 11.
    STEM AND LEAFPLOT Stem-and-Leaf Plots: A convenient method to display every piece of data by showing the digits of each number. A table in which data values are divided into either a "leaf" or a "stem." In a stem and leaf plot, the stem values appear on the vertical axis and the leaf values are listed on the horizontal axis. Stem: The digit or digits that remain when the leaf is dropped. Leaf: The last digit on the right of the number. Example: 9 18 2 Stem Leaf =182
  • 12.
  • 13.
    SPSS DEMONSTRATION ANDINTERPRETATION 1-Execution of frequency distribution 2-Executing stem and leaf plot 13
  • 14.
    MULTIVARIATE DATAANALYSIS When thereis analysis of two variables at which statistical techniques are applied on objects under investigation. Multivariate refers to all statistical techniques that simultaneously analyze multiple measurements on the individual or objects under investigation. It is to examine relationships between or among more than two variables. 11
  • 15.
    MULTIVARIATE TECHNIQUES Dependency Interdependency OneDependent Causal Correlation Simple Regression Multiple Regression Multiple dependents MANOVA MANCOVA Pearson Correlation Spearman Partial 12
  • 16.
    KNOWLEDGE OF LEVELOF MEASUREMENT IS IMPORTANT There is metric and non metric data and both treatment can’t be same so important is to identify the level of measurement for correct treatment. Example: Country names ( Canada, Japan, Africa) a non- metric data and if it is used as metric and mean is taken it will be wrong. The measurement scale is also critical in determining which multivariate techniques are most applicable to the data, with consideration made for both independent and dependent variables 13
  • 17.
  • 18.
  • 19.
    EXAMPLES : Simple regressionis that there is one predictor variable and one dependent variable. Multiple regression When there are several predictor variables and one dependent variable. Some Multivariate techniques e.g. factor analysis, the variates that represent the best represent the patterns of variables (like factor analysis is use to develop questionnaire). Discriminant analysis which differentiates among groups based on the variables. Multivariate analysis of variance (MANOVA) is a statistical test procedure for comparing multivariate (population) means of several groups. Multivariate analysis of covariance (MANCOVA) is a method to cover cases where there is more then one dependent variable and where the control of continuous independent variable. 19 MULTIVARIATE TECHNIQUES
  • 20.
    20 Multiple Regression Discriminant Analysis MANOVA Canonical Correlation, Dummy Variables Metric Nonmetric MetricNonmetric One Dependent Variable Several Dependent Variables Metric Nonmetric Factor Analysis Cluster Analysis Non-metric MDS and Correspond- ance Analysis Metric MDS Metric MDS
  • 21.
    Multidimensional scaling (MDS)is a set of related statistical techniques often used in information visualization for exploring similarities or dissimilarities in data. Cluster analysis is an exploratory data analysis tool for solving classification problems. Its object is to sort cases (people, things, events, etc) into groups, or clusters, so that the degree of association is strong between members of the same cluster and weak between members of different clusters. In non-metric MDS, only the rank order of entries in the data matrix (not the actual dissimilarities) is assumed to contain the significant information. Dummy variables is one that takes the value 0 or 1 to indicate the absence or presence of some categorical effect that may be expected to shift the outcome. Canonical correlation analysis is used to identify and measure the associations among two sets of variables. Canonical correlation is appropriate in the same situations where multiple regression would be, but where are there are multiple inter correlated outcome variables. 21
  • 22.
    LEVEL OF MEASUREMENT NominalScales - A type of categorical data in which objects fall into unordered categories. Ordinal scales -provide no measure of the actual magnitude in absolute terms ,only the order of values. Interval scale- provides meaningful difference to value. Ratio Scales - captures the properties of the other types of scales, but also contains a true zero 22