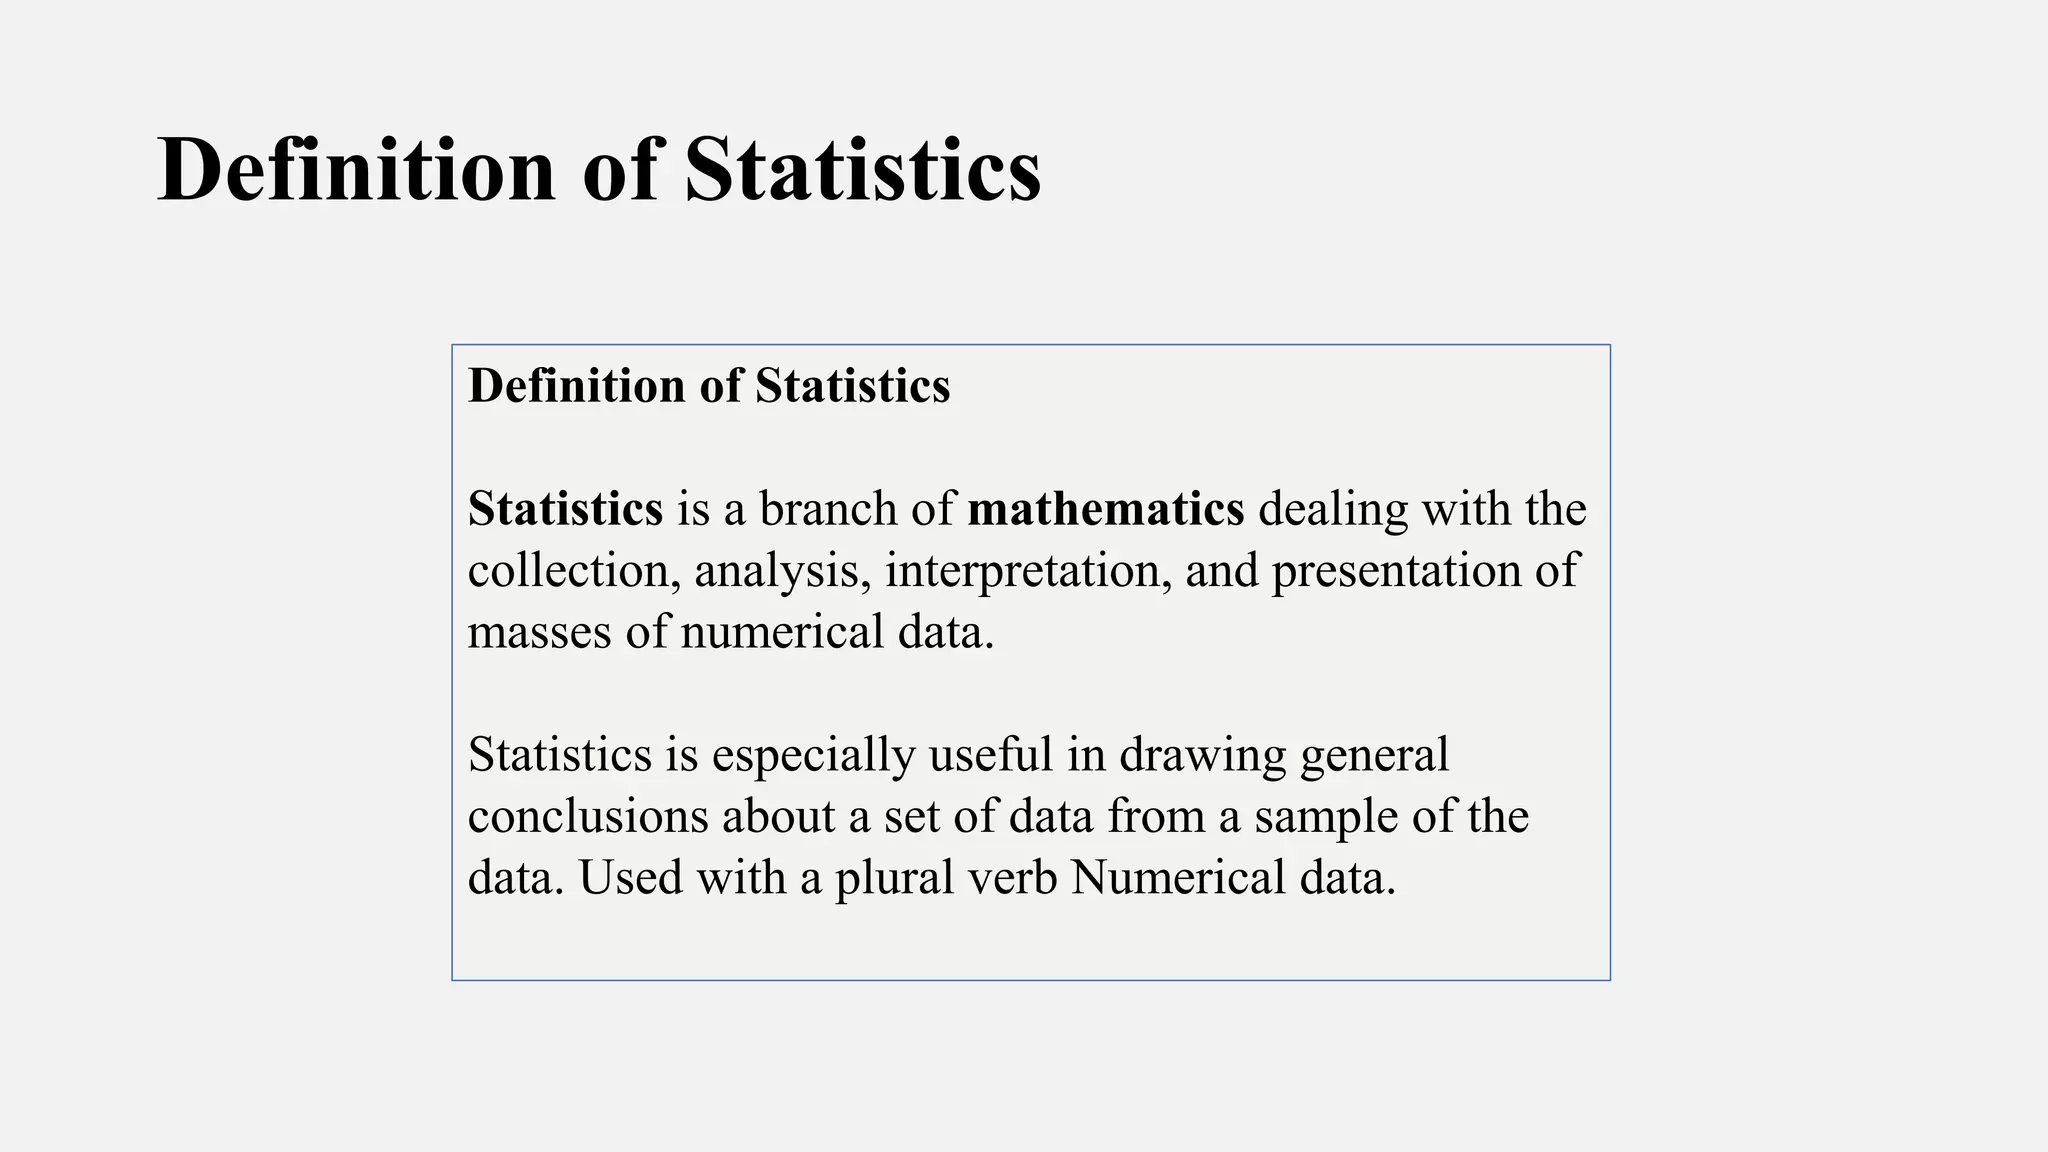
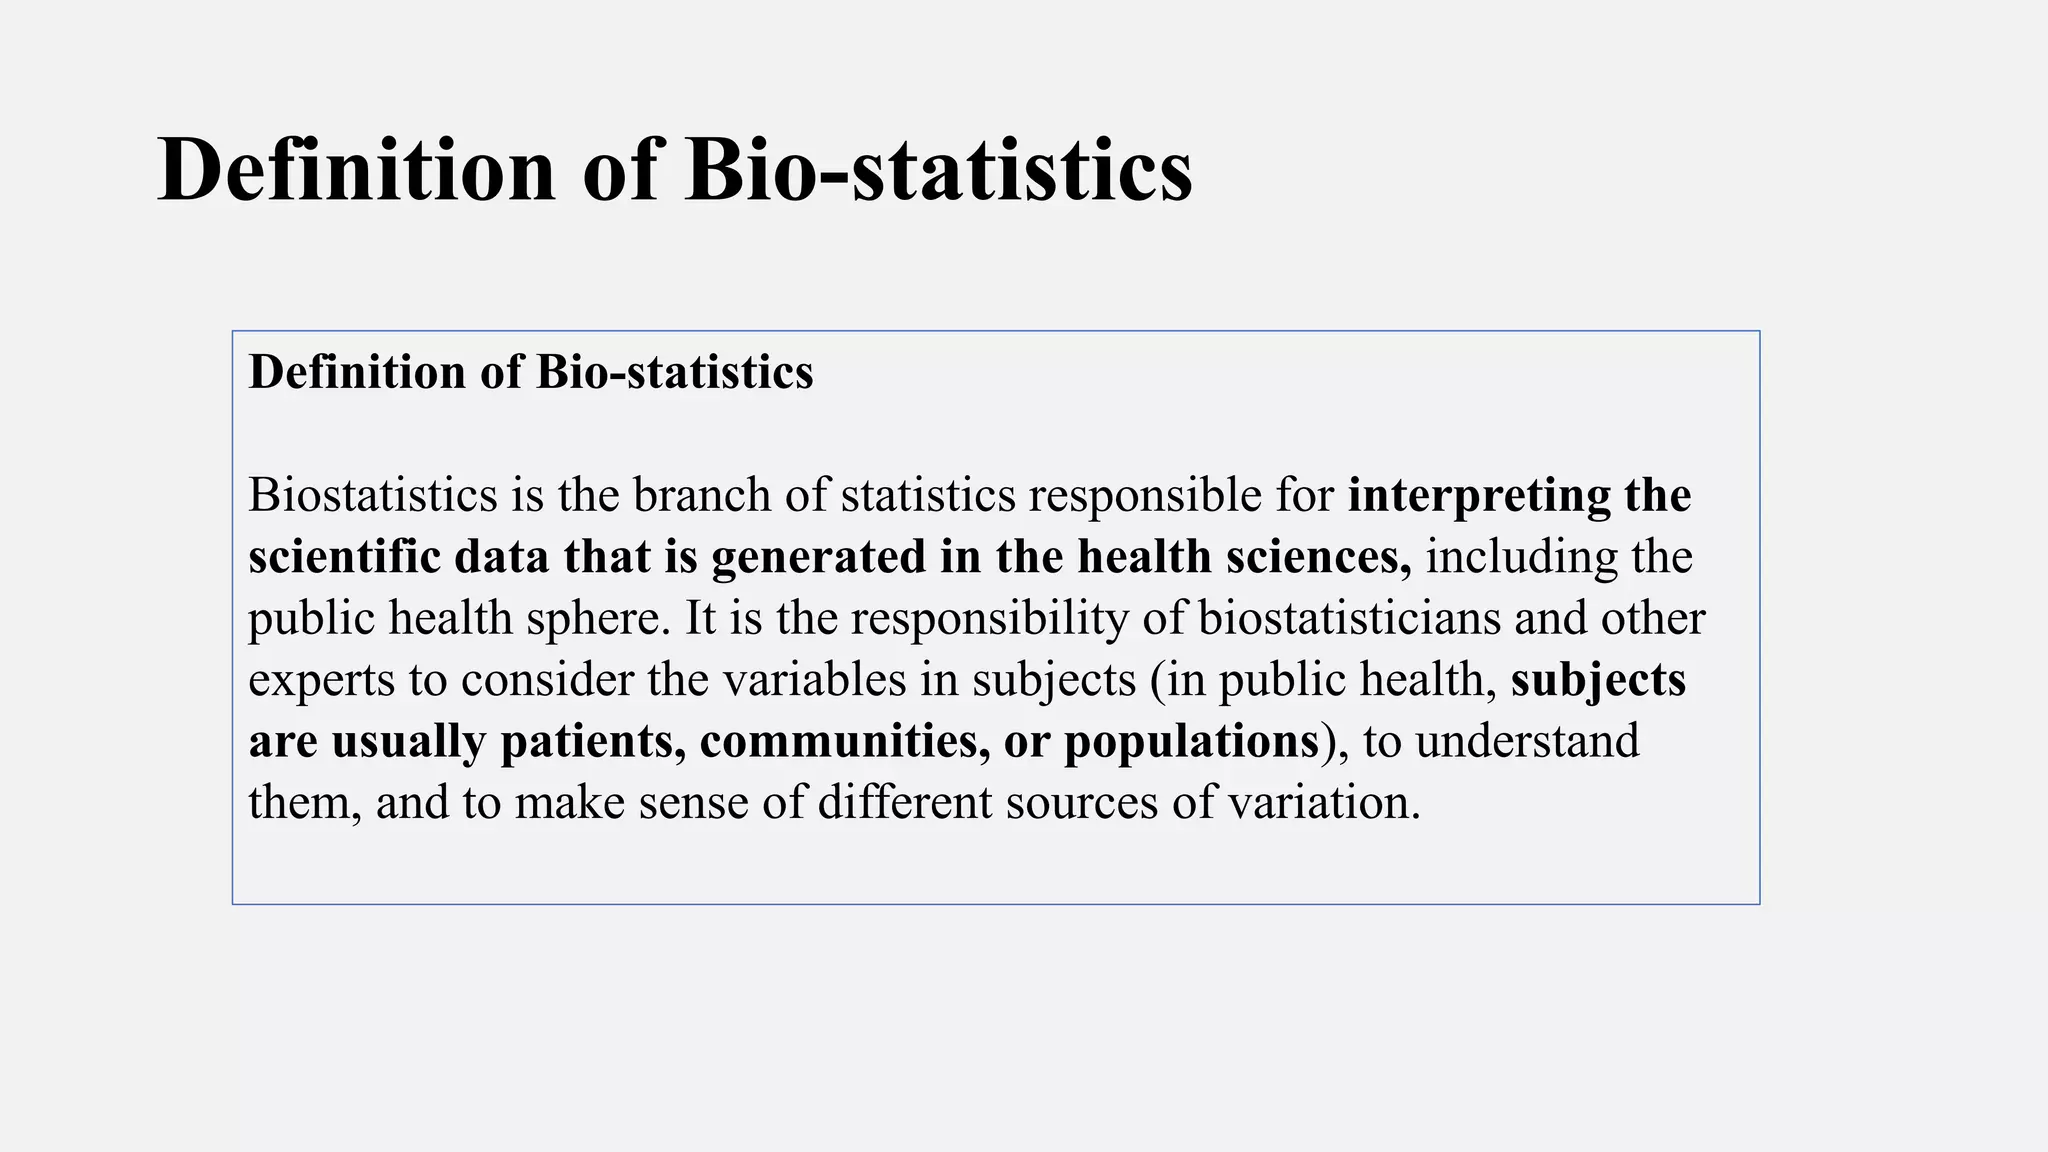
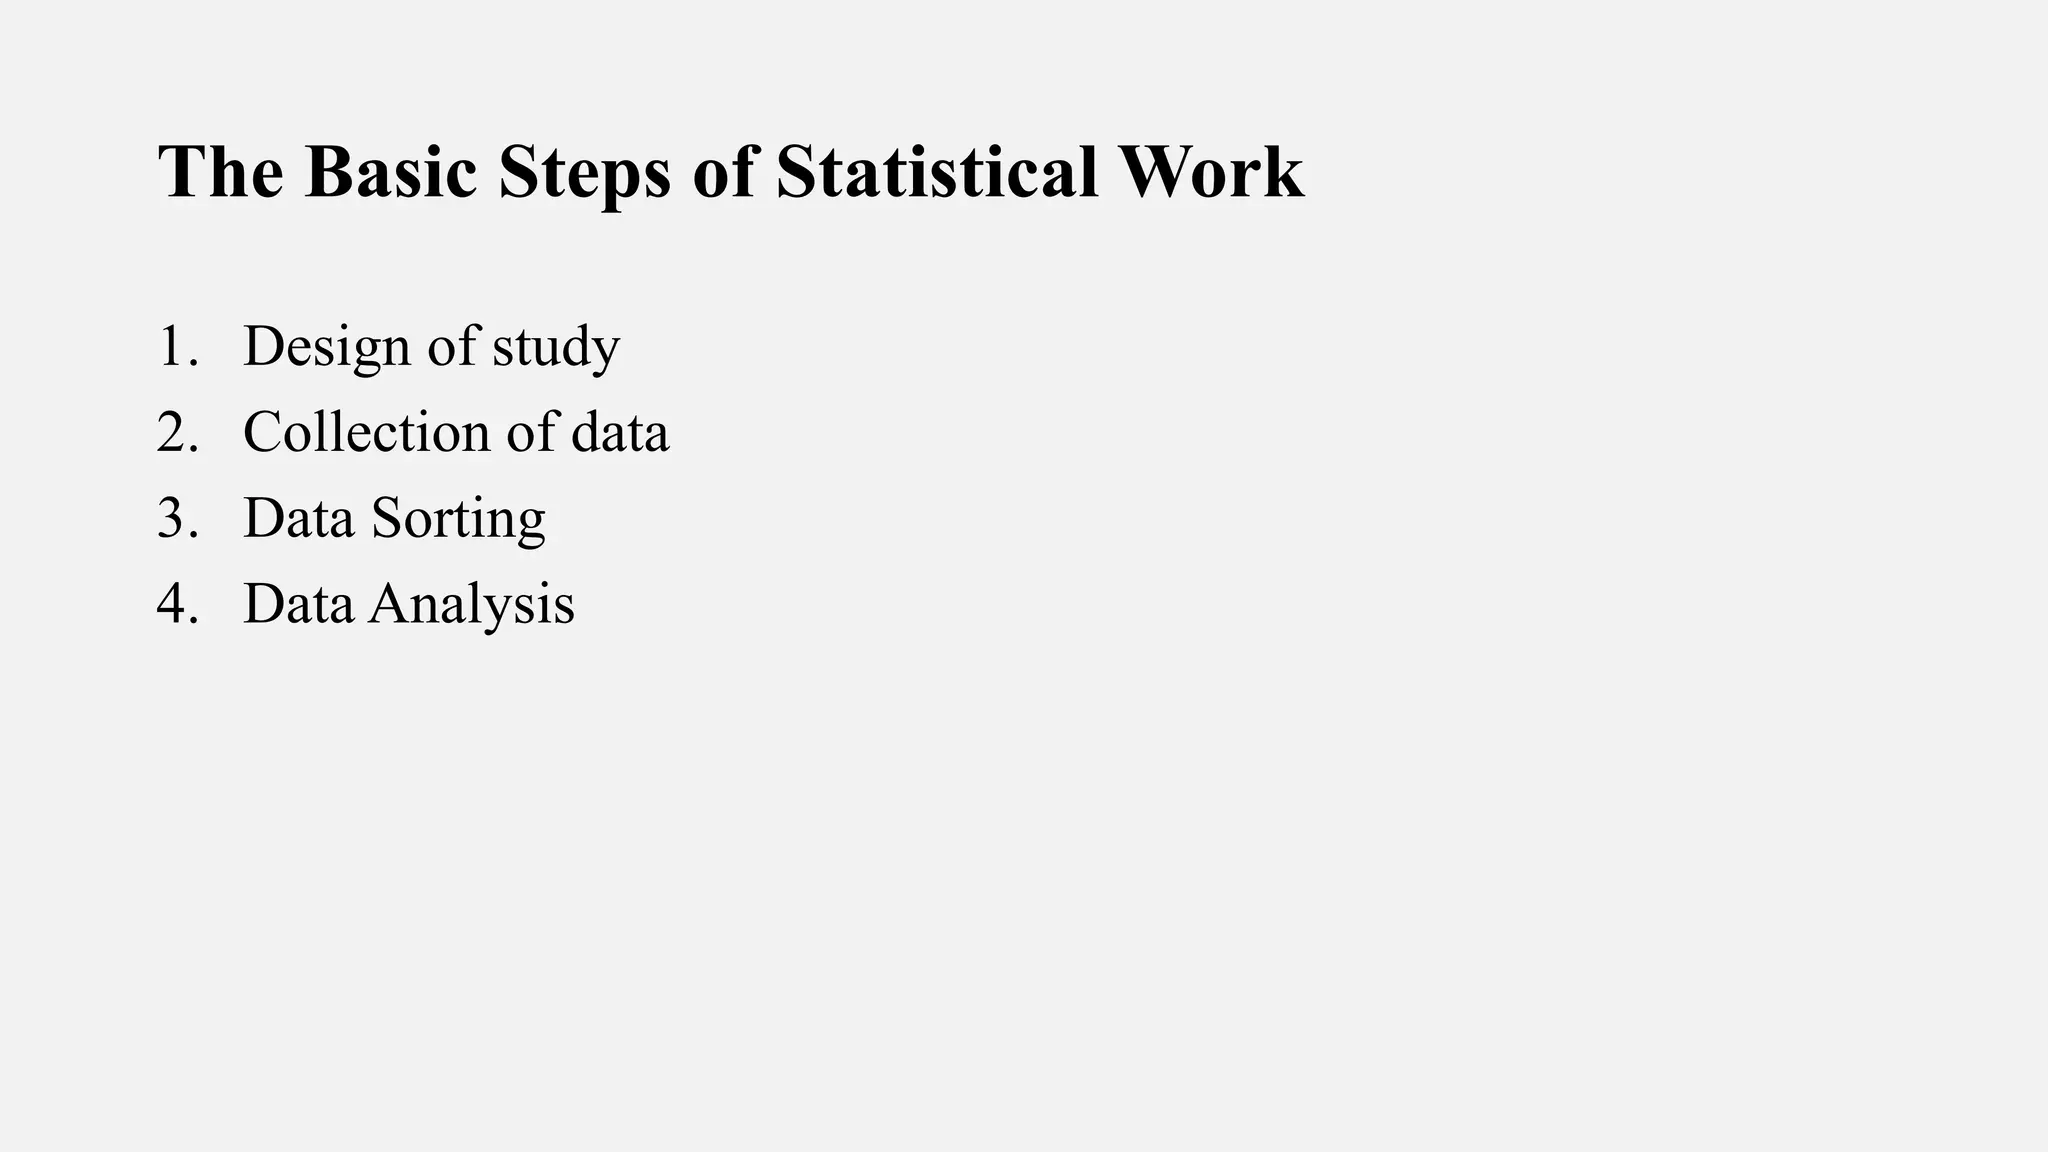
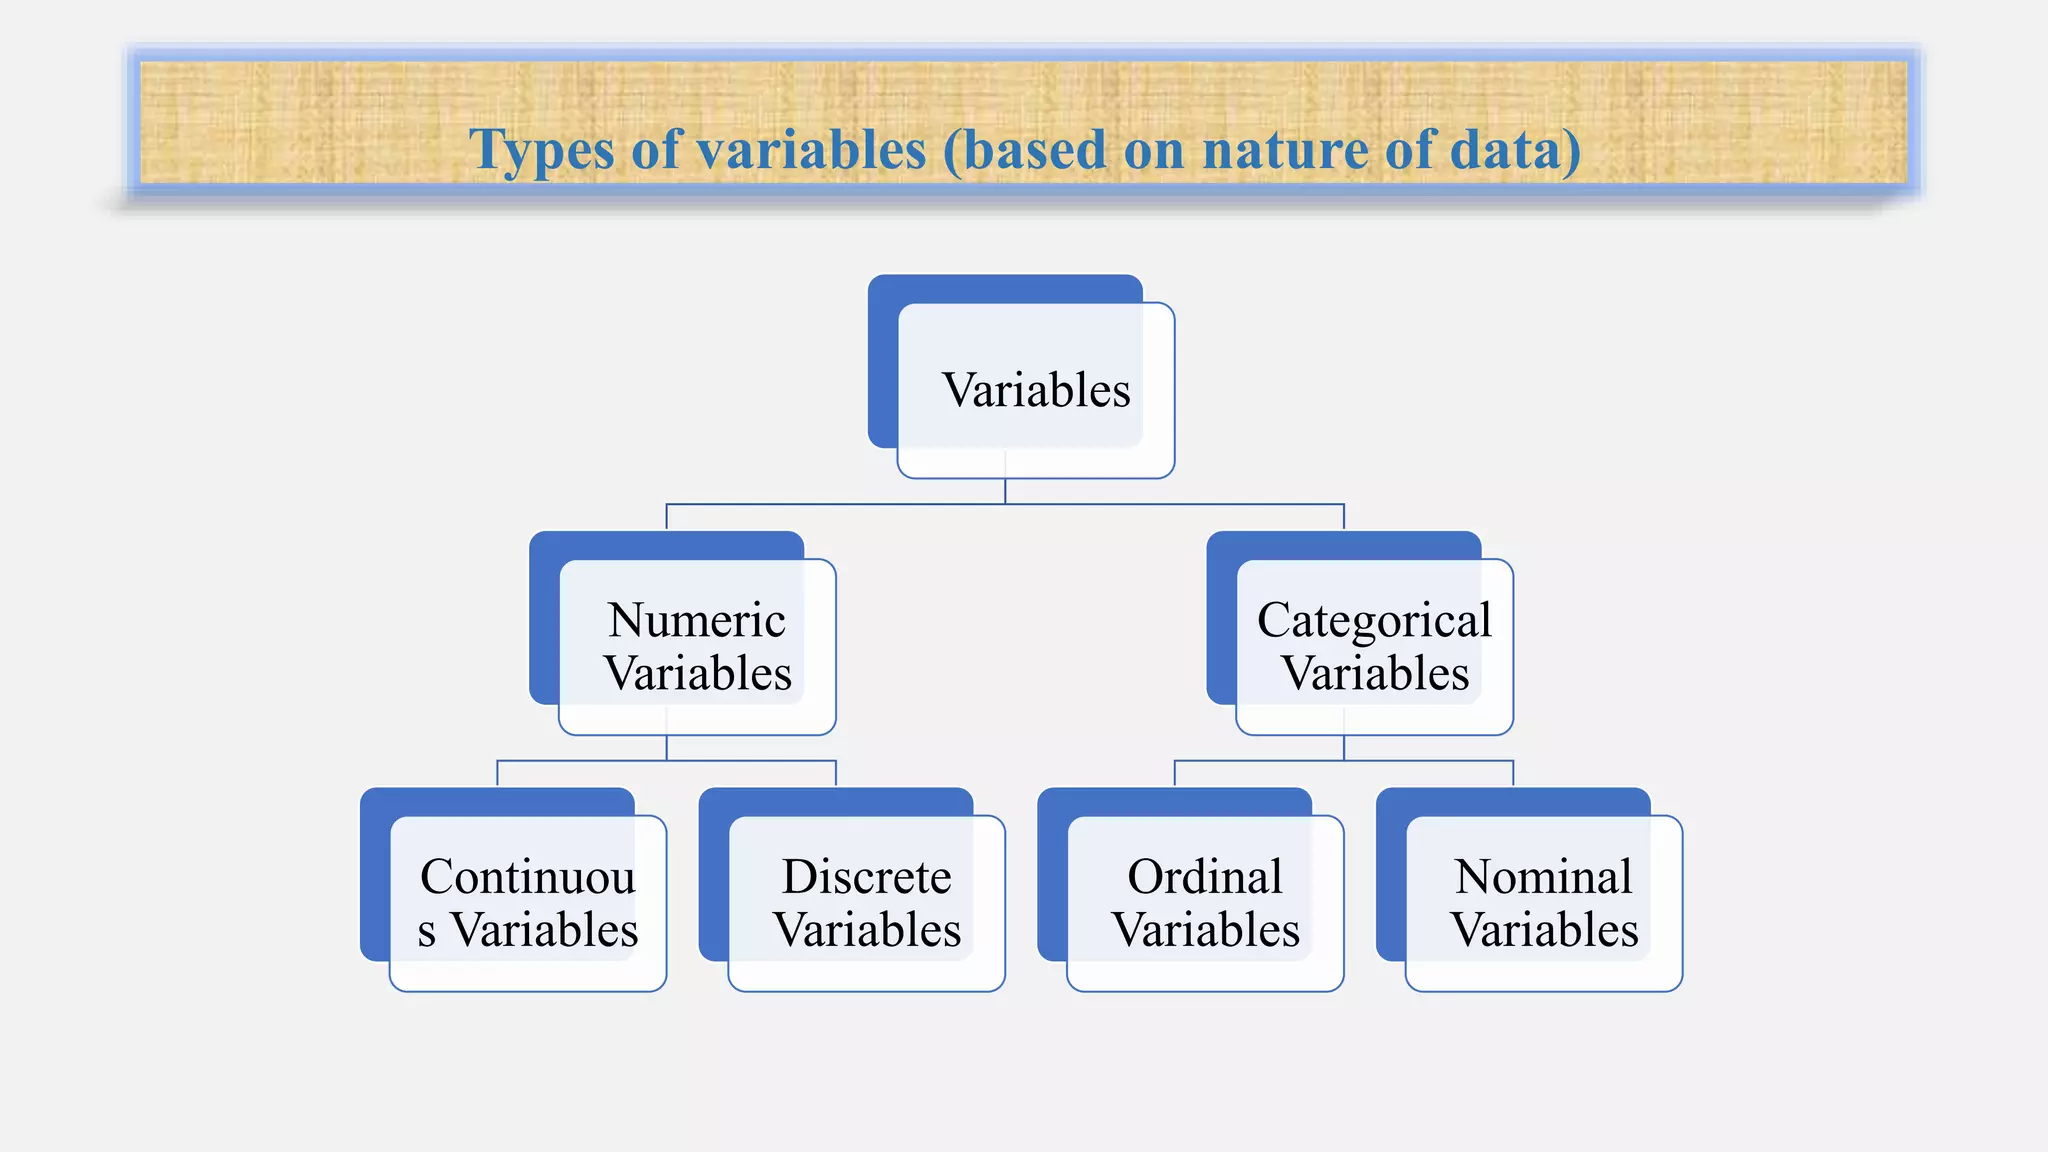
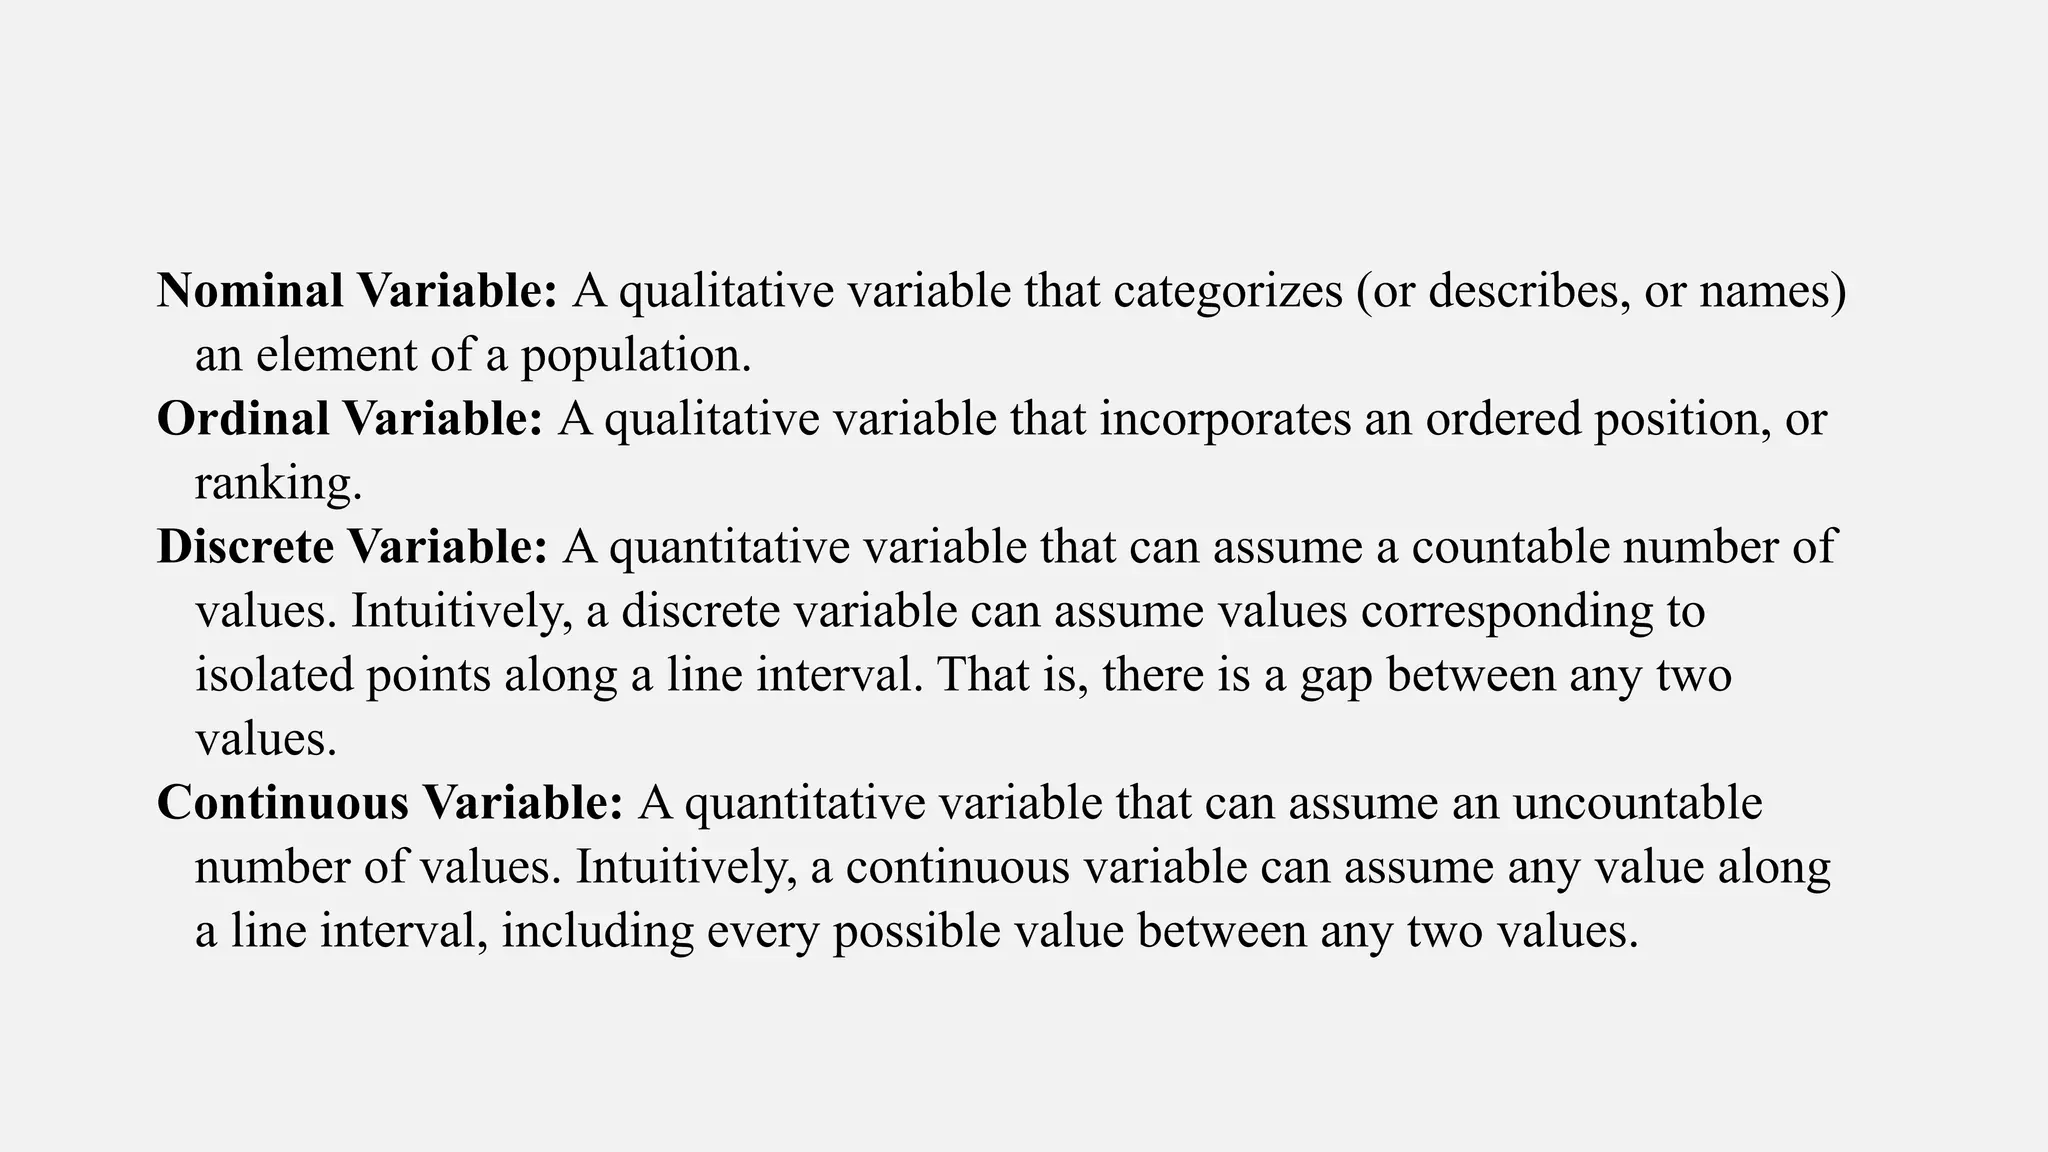
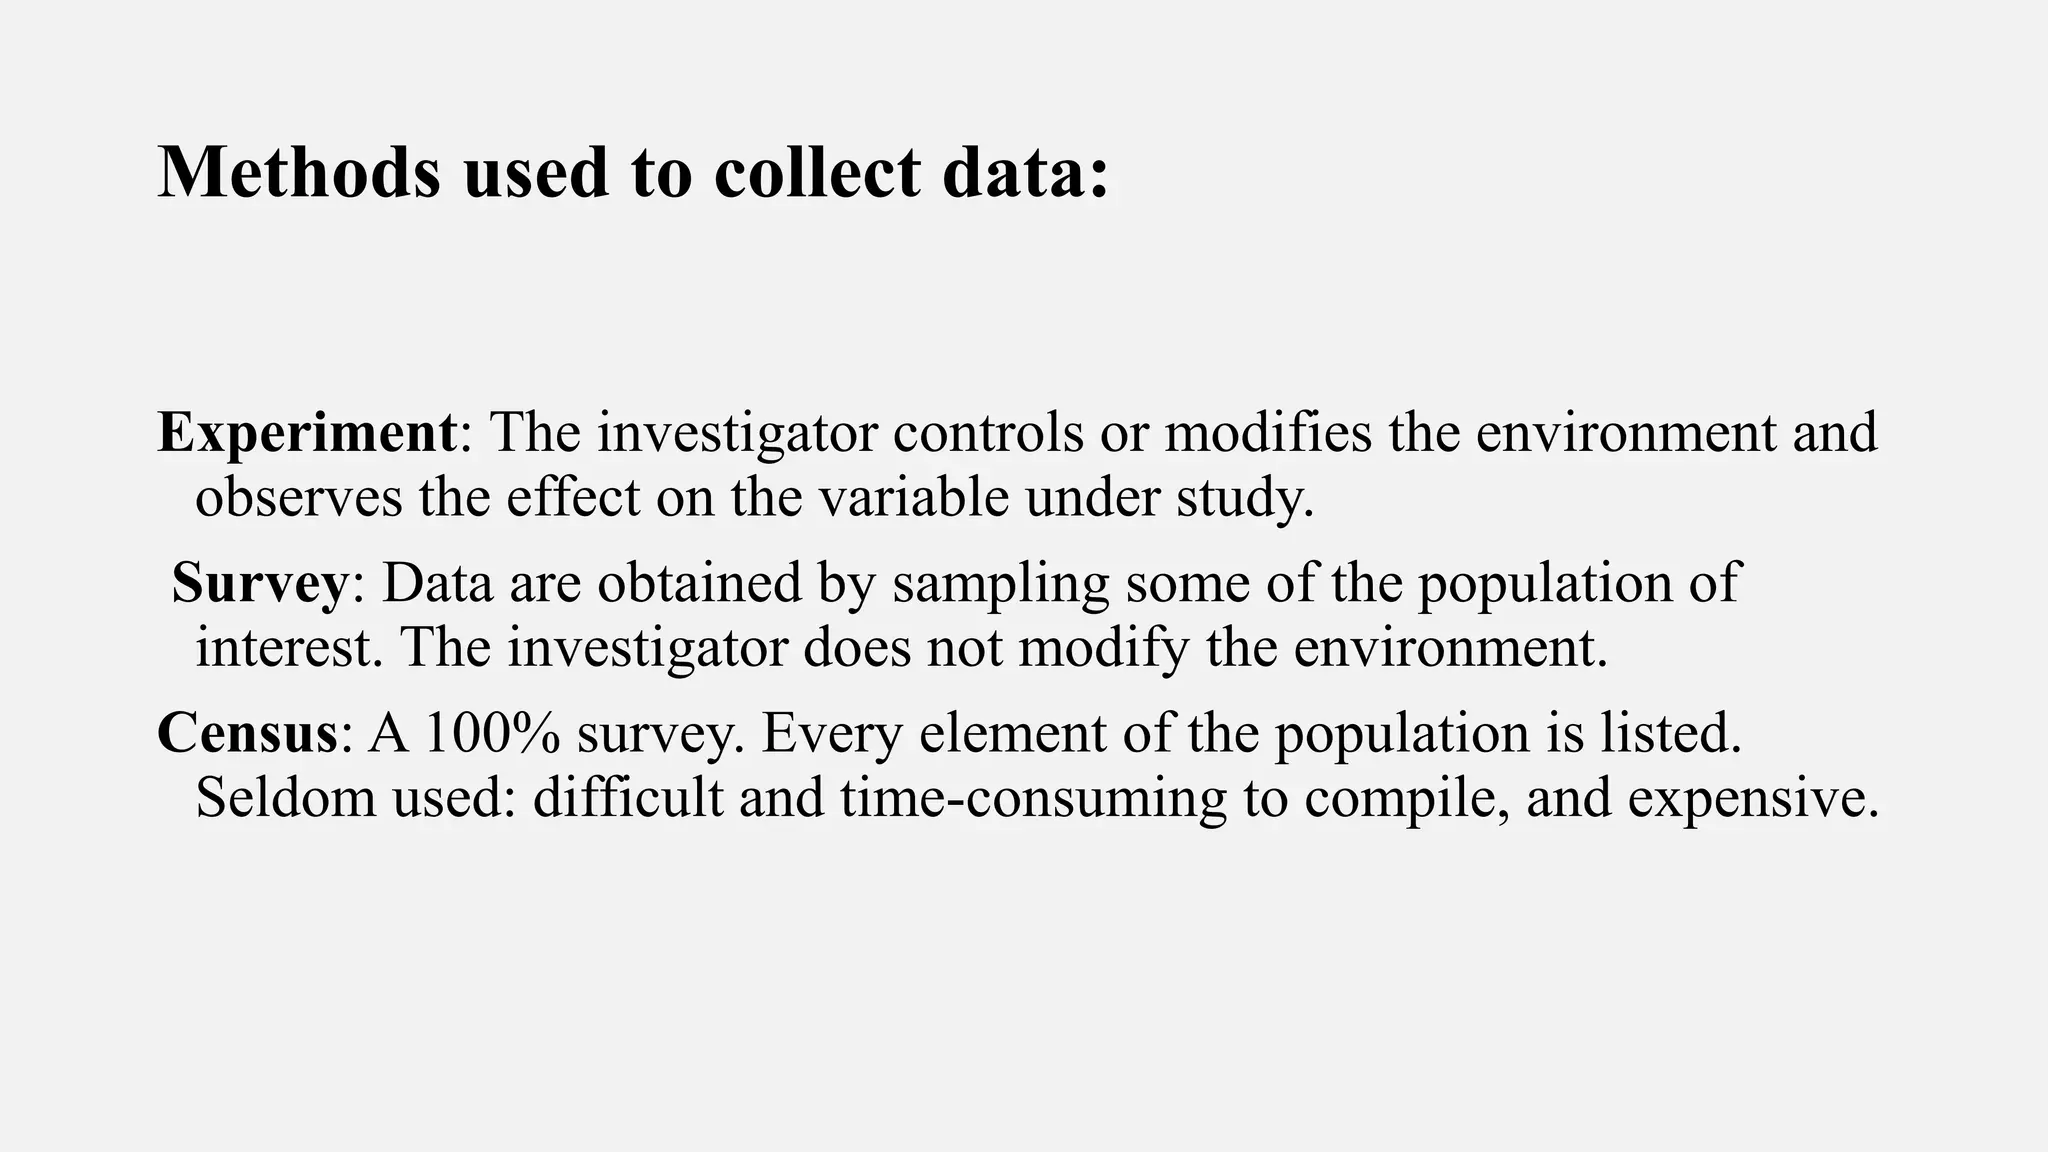
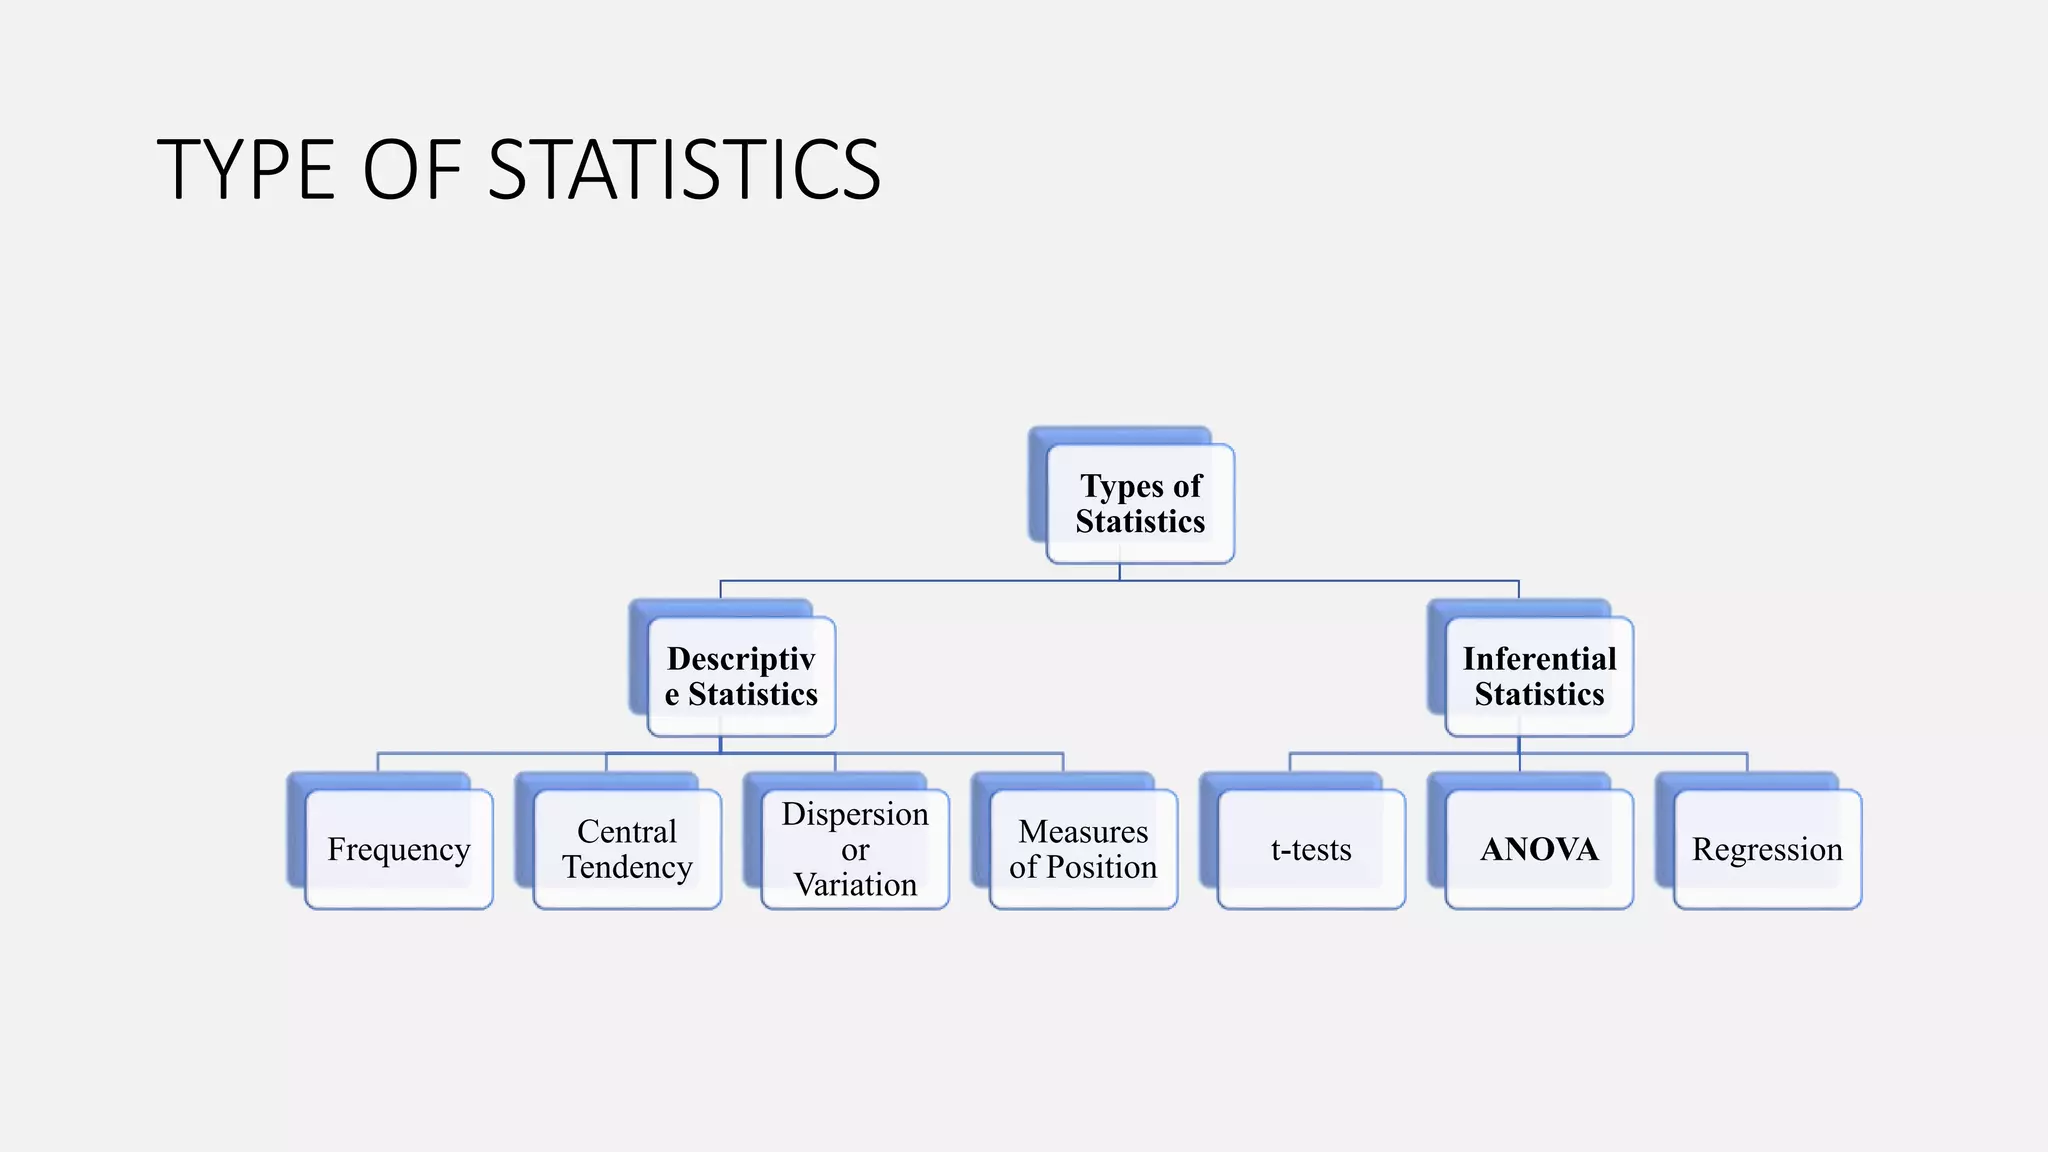
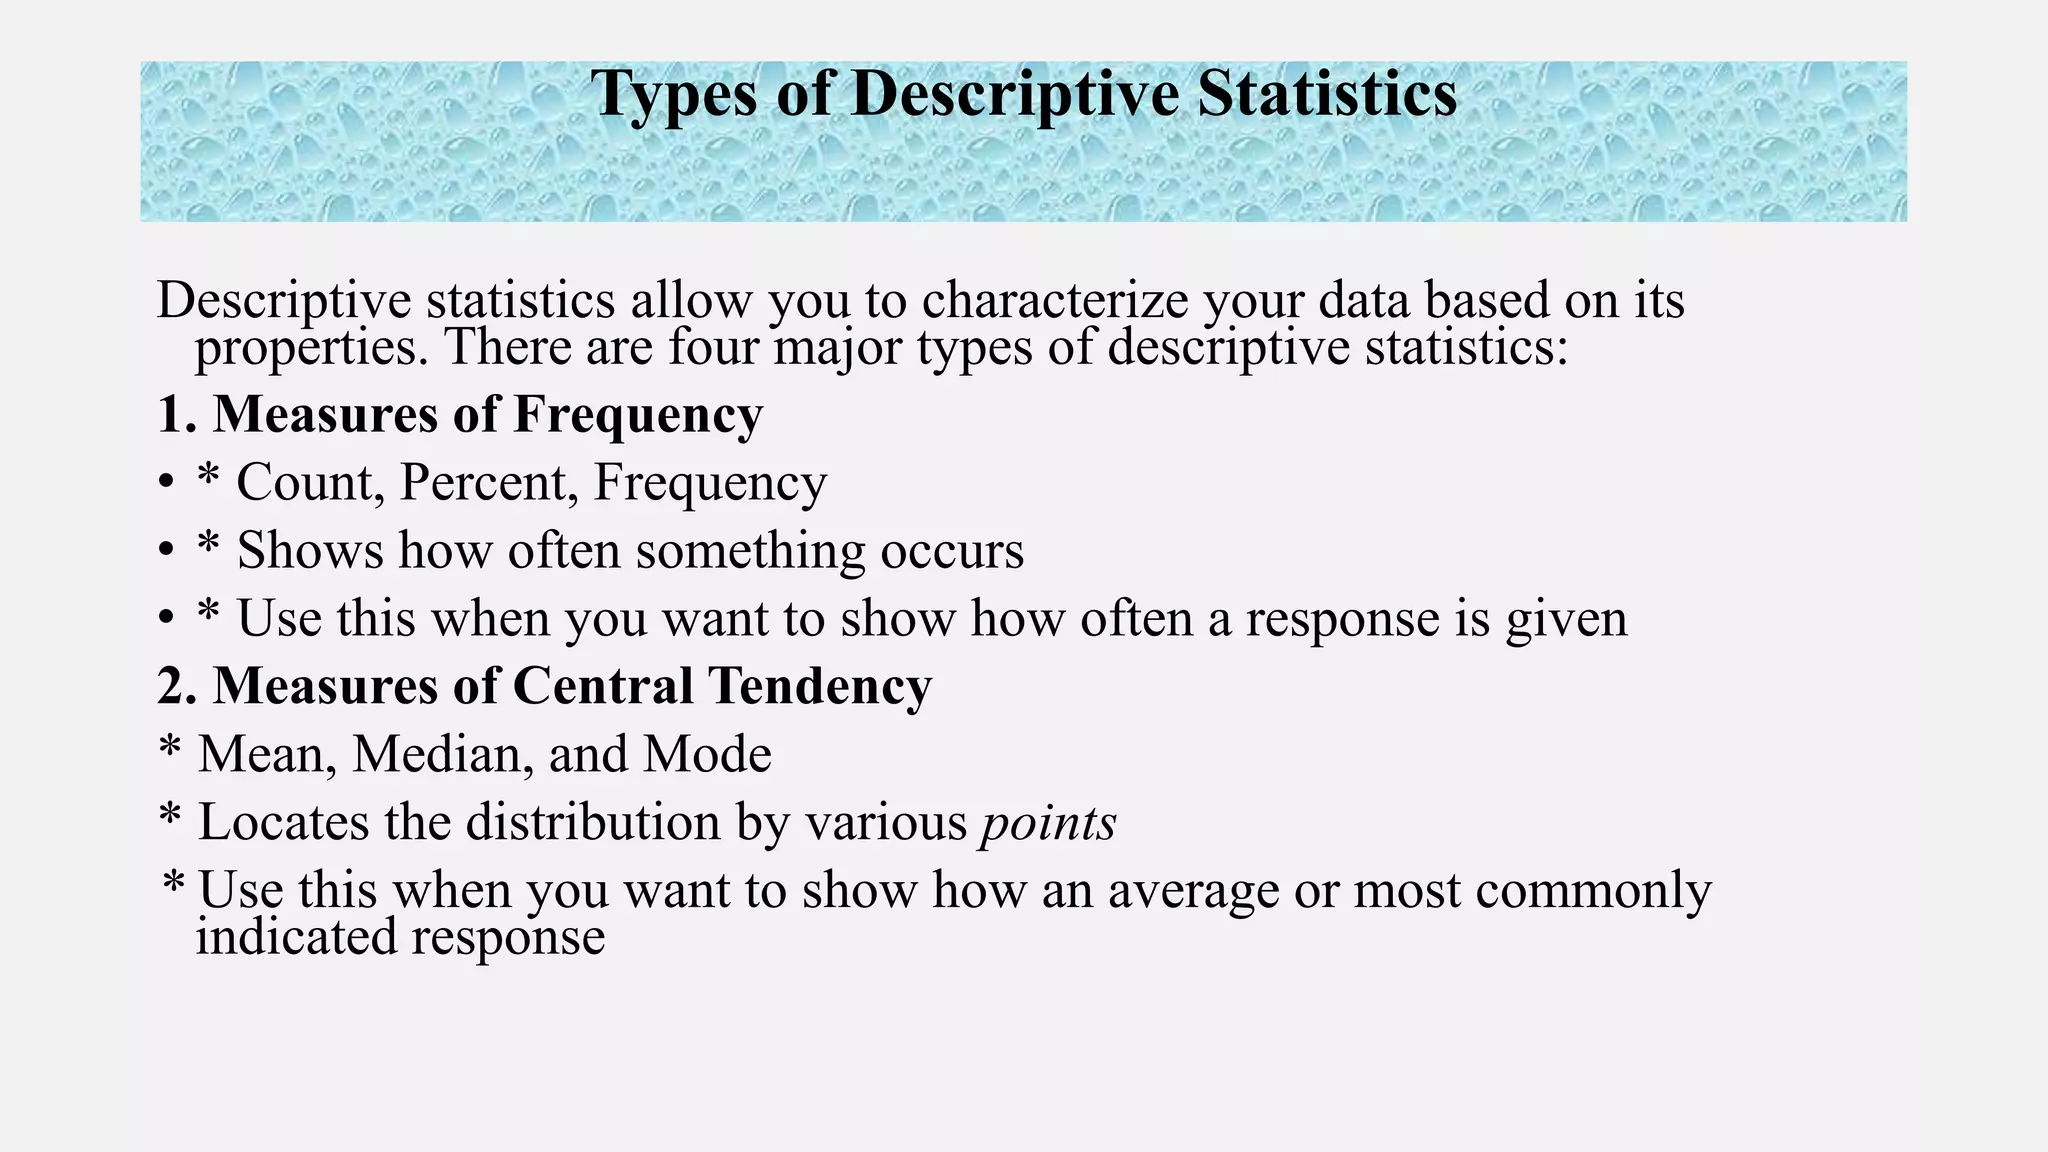
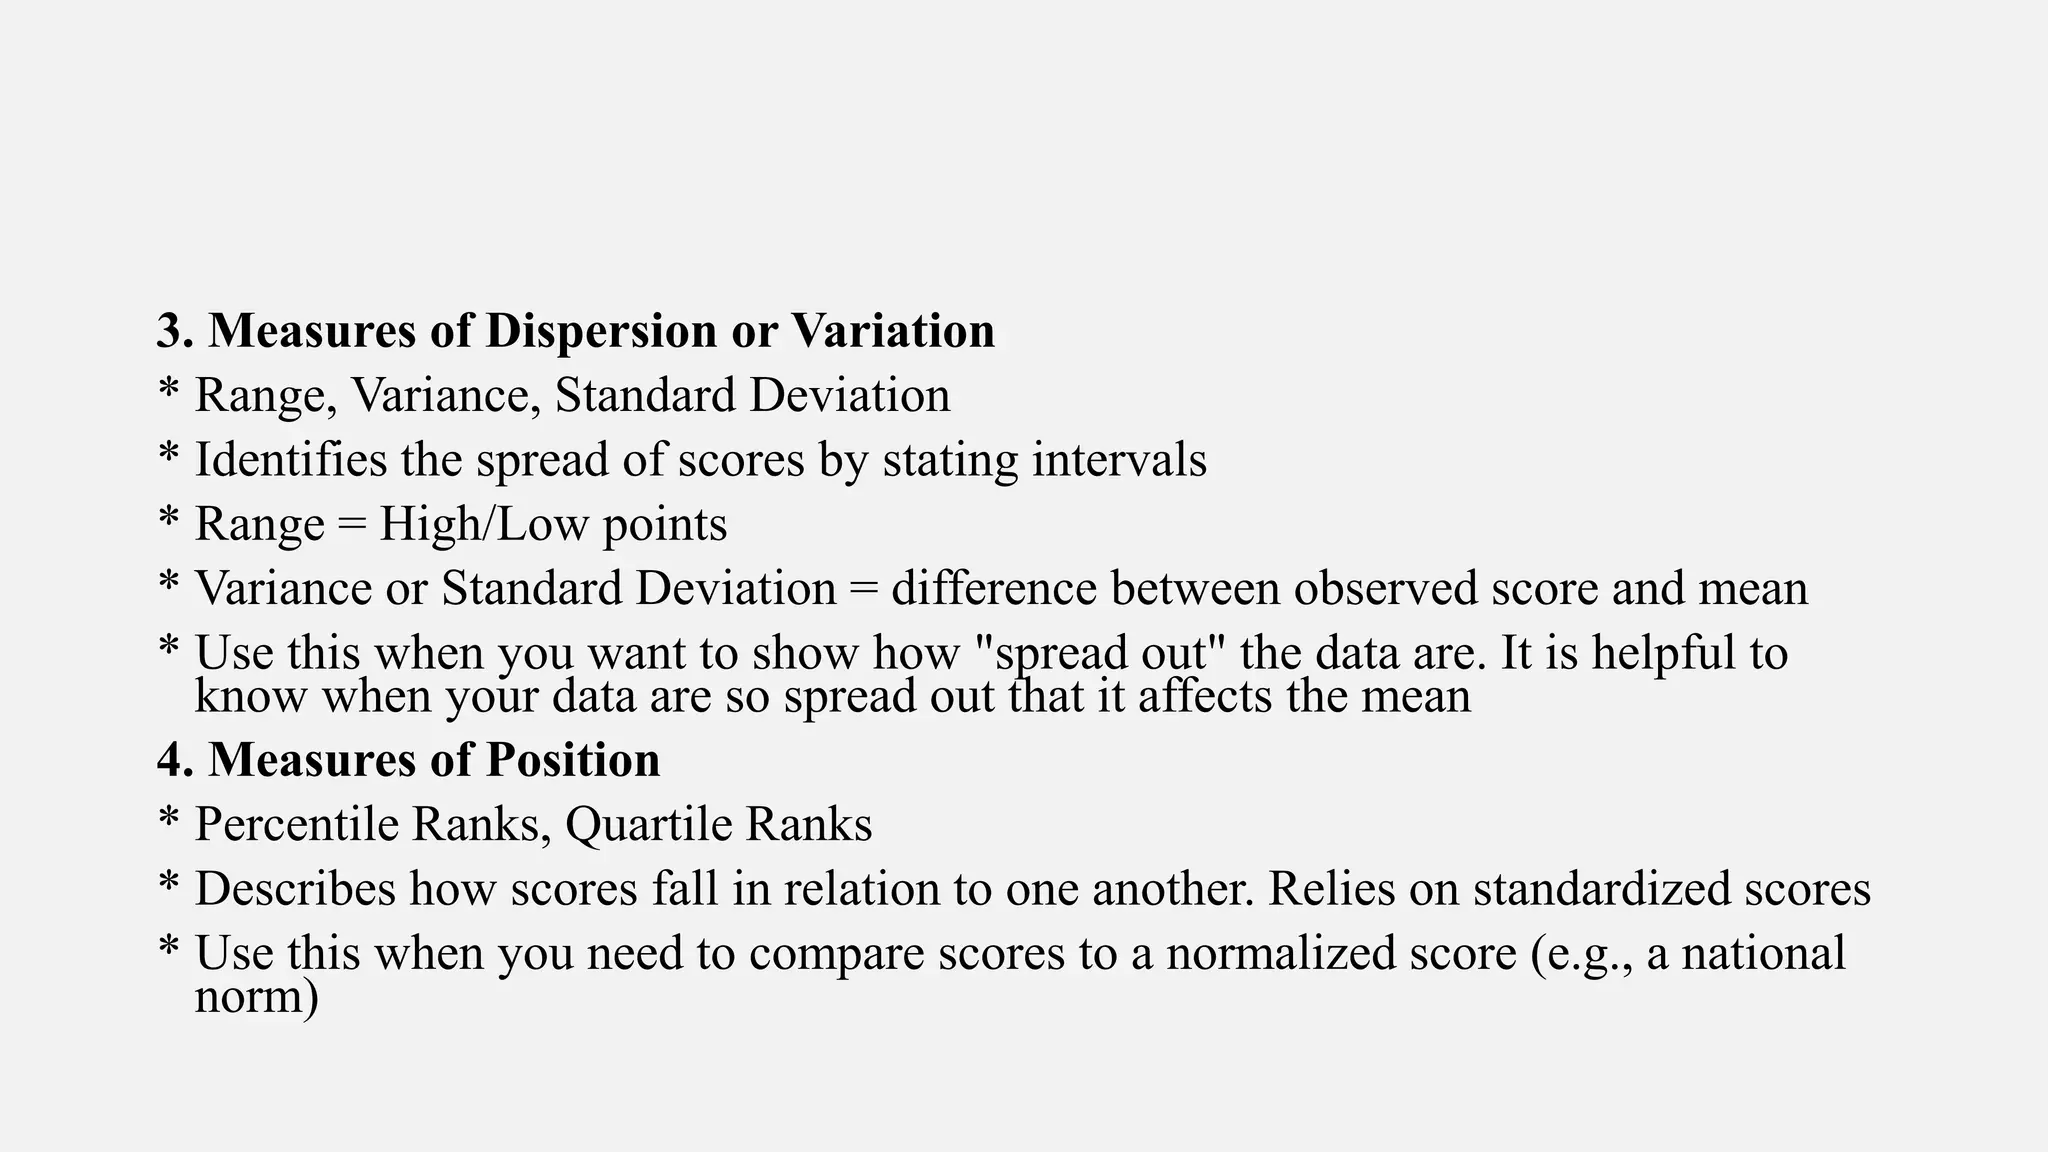
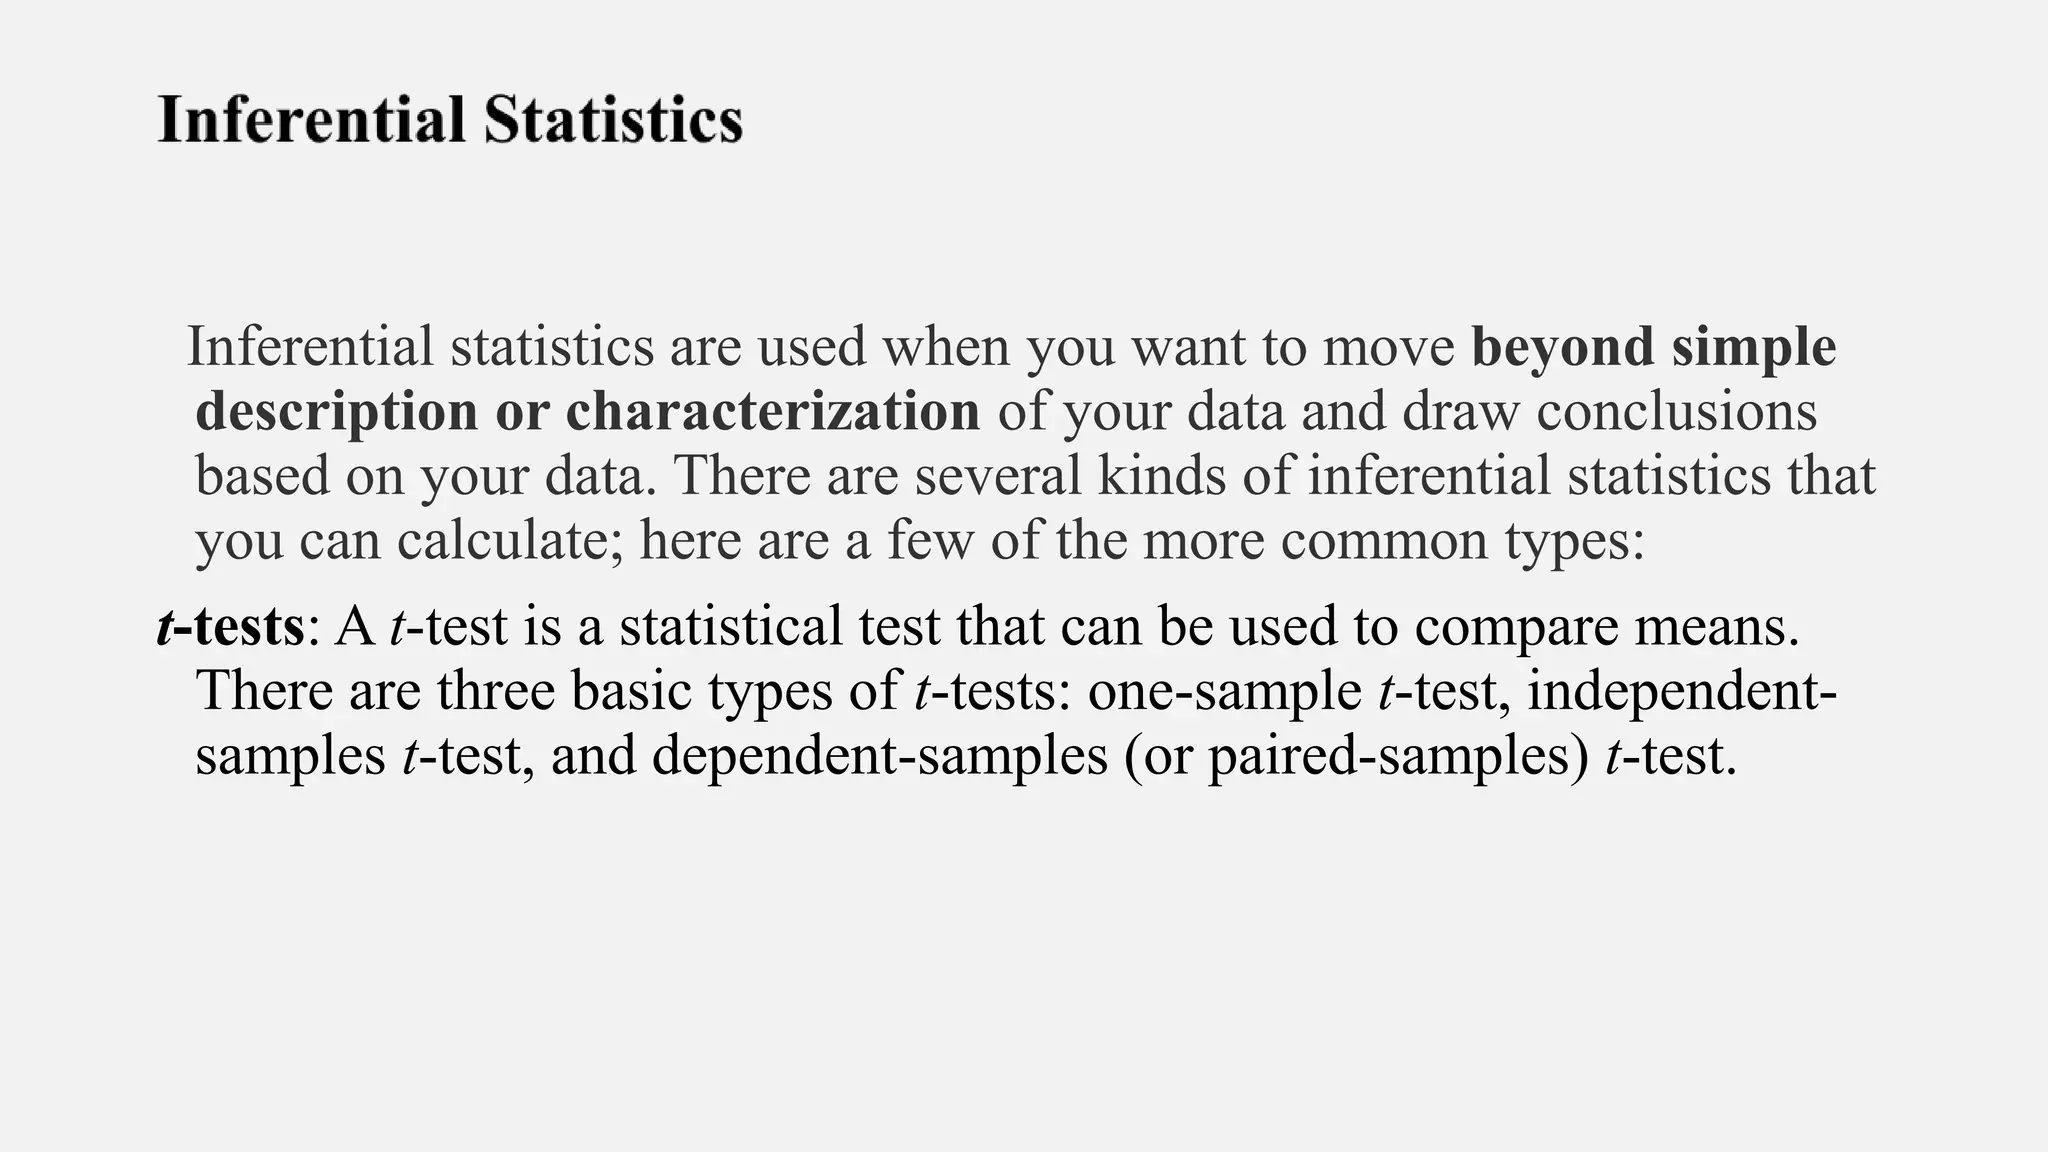
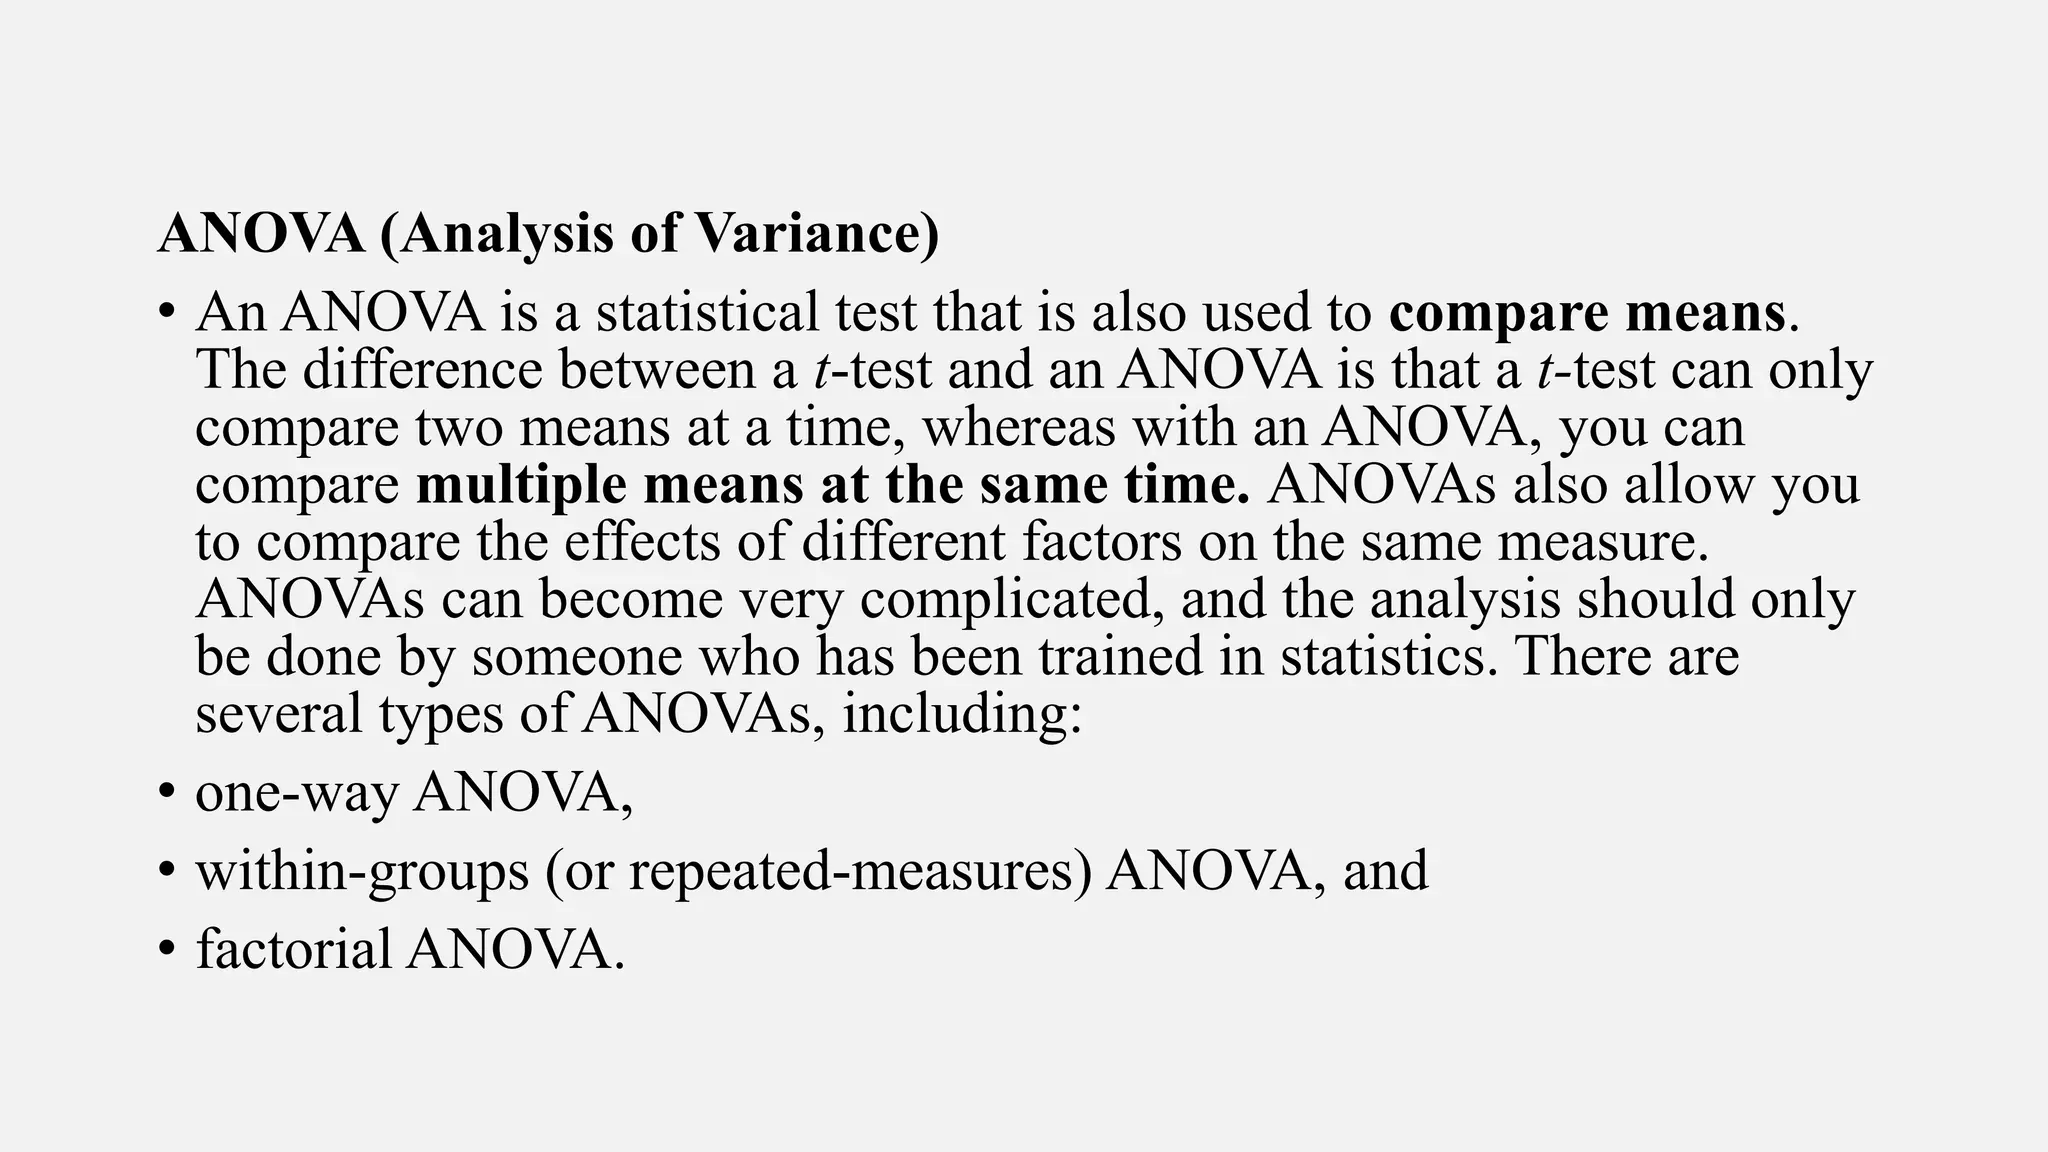
WELCOM
EIntroduction to statistics in
Healthcare.
Dhasarathi Kumar (JRF, SRM SPH, SRM
IST)
OUTLINE: What is
statistics/Bio-
statistics?
What are the broad
types of Statistics?
How is statistics/Bio-
statistics used in
healthcare.
Definition of Statistics
Statistics is a branch of mathematics dealing with the
collection, analysis, interpretation, and presentation of
masses of numerical data.
Statistics is especially useful in drawing general
conclusions about a set of data from a sample of the
data. Used with a plural verb Numerical data.
Definition of Bio-statistics
Biostatistics is the branch of statistics responsible for interpreting the
scientific data that is generated in the health sciences, including the
public health sphere. It is the responsibility of biostatisticians and other
experts to consider the variables in subjects (in public health, subjects
are usually patients, communities, or populations), to understand
them, and to make sense of different sources of variation.
The Basic Steps of Statistical Work
1. Design of study
2. Collection of data
3. Data Sorting
4. Data Analysis
variable
A variable is any characteristics, number, or quantity that can be
measured or counted. A variable may also be called a data item. Age,
sex, business income and expenses, country of birth, capital
expenditure, class grades, eye colour and vehicle type are examples
of variables.
Types of variables (based on nature of data)
Variables
Numeric
Variables
Continuou
s Variables
Discrete
Variables
Categorical
Variables
Ordinal
Variables
Nominal
Variables
Nominal Variable: A qualitative variable that categorizes (or describes, or names)
an element of a population.
Ordinal Variable: A qualitative variable that incorporates an ordered position, or
ranking.
Discrete Variable: A quantitative variable that can assume a countable number of
values. Intuitively, a discrete variable can assume values corresponding to
isolated points along a line interval. That is, there is a gap between any two
values.
Continuous Variable: A quantitative variable that can assume an uncountable
number of values. Intuitively, a continuous variable can assume any value along
a line interval, including every possible value between any two values.
Methods used to collect data:
Experiment: The investigator controls or modifies the environment and
observes the effect on the variable under study.
Survey: Data are obtained by sampling some of the population of
interest. The investigator does not modify the environment.
Census: A 100% survey. Every element of the population is listed.
Seldom used: difficult and time-consuming to compile, and expensive.
• Sampling Frame: A list of the elements belonging to the population
from which the sample will be drawn.
• Note: It is important that the sampling frame be representative of the
population.
• Sample Design: The process of selecting sample elements from the
sampling frame.
• Note: There are many different types of sample designs. Usually they
all fit into two categories: judgment samples and probability
samples.
Judgment Samples:
• Judgment Samples: Samples that are selected on the basis of being
“typical.”
Items are selected that are representative of the population. The
validity of the results from a judgment sample reflects the soundness
of the collector’s judgment.
• Probability Samples: Samples in which the elements to be selected
are drawn on the basis of probability. Each element in a population has
a certain probability of being selected as part of the sample.
• Systematic Sample
• Stratified Random Sample
• Proportional Sample (or Quota Sample)
• Cluster Sample
• Random Samples
TYPE OF STATISTICS
Types of
Statistics
Descriptiv
e Statistics
Frequency
Central
Tendency
Dispersion
or
Variation
Measures
of Position
Inferential
Statistics
t-tests ANOVA Regression
Types of Descriptive Statistics
Descriptive statistics allow you to characterize your data based on its
properties. There are four major types of descriptive statistics:
1. Measures of Frequency
• * Count, Percent, Frequency
• * Shows how often something occurs
• * Use this when you want to show how often a response is given
2. Measures of Central Tendency
* Mean, Median, and Mode
* Locates the distribution by various points
* Use this when you want to show how an average or most commonly
indicated response
3. Measures of Dispersion or Variation
* Range, Variance, Standard Deviation
* Identifies the spread of scores by stating intervals
* Range = High/Low points
* Variance or Standard Deviation = difference between observed score and mean
* Use this when you want to show how "spread out" the data are. It is helpful to
know when your data are so spread out that it affects the mean
4. Measures of Position
* Percentile Ranks, Quartile Ranks
* Describes how scores fall in relation to one another. Relies on standardized scores
* Use this when you need to compare scores to a normalized score (e.g., a national
norm)
Inferential statistics are used when you want to move beyond simple
description or characterization of your data and draw conclusions
based on your data. There are several kinds of inferential statistics that
you can calculate; here are a few of the more common types:
t-tests: A t-test is a statistical test that can be used to compare means.
There are three basic types of t-tests: one-sample t-test, independent-
samples t-test, and dependent-samples (or paired-samples) t-test.
ANOVA (Analysis of Variance)
• An ANOVA is a statistical test that is also used to compare means.
The difference between a t-test and an ANOVA is that a t-test can only
compare two means at a time, whereas with an ANOVA, you can
compare multiple means at the same time. ANOVAs also allow you
to compare the effects of different factors on the same measure.
ANOVAs can become very complicated, and the analysis should only
be done by someone who has been trained in statistics. There are
several types of ANOVAs, including:
• one-way ANOVA,
• within-groups (or repeated-measures) ANOVA, and
• factorial ANOVA.
Regression
Regression
A regression analysis is a statistical procedure that allows you to make a
prediction about an outcome (or criterion) variable based on
knowledge of some predictor variable. To create a regression model,
you first need to collect (a lot of) data on both variables, similar to
what you would do if you were conducting a correlation. Then you
would determine the contribution of the predictor variable to the
outcome variable. Once you have the regression model, you would be
able to input an individual’s score on the predictor variable to get a
prediction of their score on the outcome variable.
Introduction to Plot
A plot (graphs) is a graphical technique for representing a data set.
Graphs are a visual representation of the variables and relationship
between variables.
Plots are very useful for humans who can quickly derive an
understanding which would not come from lists of values.
Bar Chart
Clustered Bar Chart
Pie Chart
Histogram
Box Plot
AREA OF USE
• The assessment of disease burden,
• effectiveness of interventions,
• cost considerations, and
• evaluation frameworks all will require rigorous attention to methods of
data-collection, study design, and analytic technique.
What Is the Importance of Statistics in Medicine?
• According to the U.S. National Library of Medicine, health statistics
provide a clear indicator as to the well-being of a population,
individual or country. Statistics in medicine help assess patients and
provide insight into subgroups within a population.
• Researchers use statistical tests to determine results from
experiments, clinical trials of medicine and symptoms of diseases.
• The use of statistics in medicine provides generalizations for the
public to better understand their risks for certain diseases, such as links
between certain behaviors and heart disease or cancer.
• A wide range of professions within the medical field use statistics,
according to Wikipedia.
• Descriptive statistics show the portion of a population with a disease,
for example.
• Inferential statistics help determine causes to diseases.
• Those in the pharmaceutical, forensic and biological sciences all use
statistics to relay information about health and medicine.
Health Care Uitilization
• Researchers use scientific methods to gather data on samples of human
population.
Resource Allocation
• Statistical information is necessary in determining which resources are
used to produce goods and service ,what combination of goods and
services to produce, and to which populations to serve them. Health
care statistics are critical to production efficiency and allocation.
• Valid statistical information minimizes the risks of health care trade
offs.
Needs Assessment
• Public and private health care administrators, charged with providing
continues care to diverse populations, compare existing services to
community needs.
Quality Improvement
• Health care suppliers struggle to make effective goods and services
efficiently. Statistics are important to health care organisations in
measuring performance success or failure.
Product Development
• Innovative medicine begins and ends with statistical analysis. Data are
collected and reported in clinical trials of new technologies and
treatments to weigh products benefits against their risks. Statistics
indirectly influence pricing of product by describing consumer
demand in measurable units.
Introduction to statistics in health care

Introduction to statistics in health care

  • 1.
    WELCOM EIntroduction to statisticsin Healthcare. Dhasarathi Kumar (JRF, SRM SPH, SRM IST)
  • 2.
    OUTLINE: What is statistics/Bio- statistics? Whatare the broad types of Statistics? How is statistics/Bio- statistics used in healthcare.
  • 3.
    Definition of Statistics Definitionof Statistics Statistics is a branch of mathematics dealing with the collection, analysis, interpretation, and presentation of masses of numerical data. Statistics is especially useful in drawing general conclusions about a set of data from a sample of the data. Used with a plural verb Numerical data.
  • 4.
    Definition of Bio-statistics Definitionof Bio-statistics Biostatistics is the branch of statistics responsible for interpreting the scientific data that is generated in the health sciences, including the public health sphere. It is the responsibility of biostatisticians and other experts to consider the variables in subjects (in public health, subjects are usually patients, communities, or populations), to understand them, and to make sense of different sources of variation.
  • 5.
    The Basic Stepsof Statistical Work 1. Design of study 2. Collection of data 3. Data Sorting 4. Data Analysis
  • 6.
    variable A variable isany characteristics, number, or quantity that can be measured or counted. A variable may also be called a data item. Age, sex, business income and expenses, country of birth, capital expenditure, class grades, eye colour and vehicle type are examples of variables.
  • 7.
    Types of variables(based on nature of data) Variables Numeric Variables Continuou s Variables Discrete Variables Categorical Variables Ordinal Variables Nominal Variables
  • 8.
    Nominal Variable: Aqualitative variable that categorizes (or describes, or names) an element of a population. Ordinal Variable: A qualitative variable that incorporates an ordered position, or ranking. Discrete Variable: A quantitative variable that can assume a countable number of values. Intuitively, a discrete variable can assume values corresponding to isolated points along a line interval. That is, there is a gap between any two values. Continuous Variable: A quantitative variable that can assume an uncountable number of values. Intuitively, a continuous variable can assume any value along a line interval, including every possible value between any two values.
  • 9.
    Methods used tocollect data: Experiment: The investigator controls or modifies the environment and observes the effect on the variable under study. Survey: Data are obtained by sampling some of the population of interest. The investigator does not modify the environment. Census: A 100% survey. Every element of the population is listed. Seldom used: difficult and time-consuming to compile, and expensive.
  • 10.
    • Sampling Frame:A list of the elements belonging to the population from which the sample will be drawn. • Note: It is important that the sampling frame be representative of the population. • Sample Design: The process of selecting sample elements from the sampling frame. • Note: There are many different types of sample designs. Usually they all fit into two categories: judgment samples and probability samples.
  • 11.
    Judgment Samples: • JudgmentSamples: Samples that are selected on the basis of being “typical.” Items are selected that are representative of the population. The validity of the results from a judgment sample reflects the soundness of the collector’s judgment. • Probability Samples: Samples in which the elements to be selected are drawn on the basis of probability. Each element in a population has a certain probability of being selected as part of the sample.
  • 12.
    • Systematic Sample •Stratified Random Sample • Proportional Sample (or Quota Sample) • Cluster Sample • Random Samples
  • 13.
    TYPE OF STATISTICS Typesof Statistics Descriptiv e Statistics Frequency Central Tendency Dispersion or Variation Measures of Position Inferential Statistics t-tests ANOVA Regression
  • 14.
    Types of DescriptiveStatistics Descriptive statistics allow you to characterize your data based on its properties. There are four major types of descriptive statistics: 1. Measures of Frequency • * Count, Percent, Frequency • * Shows how often something occurs • * Use this when you want to show how often a response is given 2. Measures of Central Tendency * Mean, Median, and Mode * Locates the distribution by various points * Use this when you want to show how an average or most commonly indicated response
  • 15.
    3. Measures ofDispersion or Variation * Range, Variance, Standard Deviation * Identifies the spread of scores by stating intervals * Range = High/Low points * Variance or Standard Deviation = difference between observed score and mean * Use this when you want to show how "spread out" the data are. It is helpful to know when your data are so spread out that it affects the mean 4. Measures of Position * Percentile Ranks, Quartile Ranks * Describes how scores fall in relation to one another. Relies on standardized scores * Use this when you need to compare scores to a normalized score (e.g., a national norm)
  • 16.
    Inferential statistics areused when you want to move beyond simple description or characterization of your data and draw conclusions based on your data. There are several kinds of inferential statistics that you can calculate; here are a few of the more common types: t-tests: A t-test is a statistical test that can be used to compare means. There are three basic types of t-tests: one-sample t-test, independent- samples t-test, and dependent-samples (or paired-samples) t-test.
  • 17.
    ANOVA (Analysis ofVariance) • An ANOVA is a statistical test that is also used to compare means. The difference between a t-test and an ANOVA is that a t-test can only compare two means at a time, whereas with an ANOVA, you can compare multiple means at the same time. ANOVAs also allow you to compare the effects of different factors on the same measure. ANOVAs can become very complicated, and the analysis should only be done by someone who has been trained in statistics. There are several types of ANOVAs, including: • one-way ANOVA, • within-groups (or repeated-measures) ANOVA, and • factorial ANOVA.
  • 18.
    Regression Regression A regression analysisis a statistical procedure that allows you to make a prediction about an outcome (or criterion) variable based on knowledge of some predictor variable. To create a regression model, you first need to collect (a lot of) data on both variables, similar to what you would do if you were conducting a correlation. Then you would determine the contribution of the predictor variable to the outcome variable. Once you have the regression model, you would be able to input an individual’s score on the predictor variable to get a prediction of their score on the outcome variable.
  • 19.
    Introduction to Plot Aplot (graphs) is a graphical technique for representing a data set. Graphs are a visual representation of the variables and relationship between variables. Plots are very useful for humans who can quickly derive an understanding which would not come from lists of values.
  • 20.
  • 21.
  • 22.
  • 23.
  • 24.
  • 25.
    AREA OF USE •The assessment of disease burden, • effectiveness of interventions, • cost considerations, and • evaluation frameworks all will require rigorous attention to methods of data-collection, study design, and analytic technique.
  • 26.
    What Is theImportance of Statistics in Medicine? • According to the U.S. National Library of Medicine, health statistics provide a clear indicator as to the well-being of a population, individual or country. Statistics in medicine help assess patients and provide insight into subgroups within a population. • Researchers use statistical tests to determine results from experiments, clinical trials of medicine and symptoms of diseases. • The use of statistics in medicine provides generalizations for the public to better understand their risks for certain diseases, such as links between certain behaviors and heart disease or cancer.
  • 27.
    • A widerange of professions within the medical field use statistics, according to Wikipedia. • Descriptive statistics show the portion of a population with a disease, for example. • Inferential statistics help determine causes to diseases. • Those in the pharmaceutical, forensic and biological sciences all use statistics to relay information about health and medicine.
  • 28.
    Health Care Uitilization •Researchers use scientific methods to gather data on samples of human population. Resource Allocation • Statistical information is necessary in determining which resources are used to produce goods and service ,what combination of goods and services to produce, and to which populations to serve them. Health care statistics are critical to production efficiency and allocation. • Valid statistical information minimizes the risks of health care trade offs. Needs Assessment • Public and private health care administrators, charged with providing continues care to diverse populations, compare existing services to community needs.
  • 29.
    Quality Improvement • Healthcare suppliers struggle to make effective goods and services efficiently. Statistics are important to health care organisations in measuring performance success or failure. Product Development • Innovative medicine begins and ends with statistical analysis. Data are collected and reported in clinical trials of new technologies and treatments to weigh products benefits against their risks. Statistics indirectly influence pricing of product by describing consumer demand in measurable units.