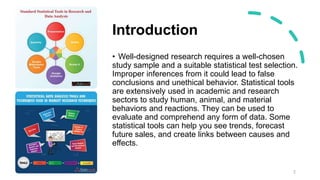
Statistical Tools
Introduction
• Well-designed research requires a well-chosen
study sample and a suitable statistical test selection.
Improper inferences from it could lead to false
conclusions and unethical behavior. Statistical tools
are extensively used in academic and research
sectors to study human, animal, and material
behaviors and reactions. They can be used to
evaluate and comprehend any form of data. Some
statistical tools can help you see trends, forecast
future sales, and create links between causes and
effects.
2
Mean
• The arithmetic mean, more commonly known as the
average, is the sum of a list of numbers divided by the
number of item in the list. The mean is useful in
determining the overall trend of a data set providing a rapid
snapshot of your data.
9/3/20XX 3
Standard Deviation
• is a statistic that measures the dispersion of a dataset
relative to its mean and is calculated as the square root of
the variance. The standard deviation is calculated as the
square root of variance by determining each data point's
deviation relative to the mean.
• If the data points are further from the mean, there is a
higher deviation within the data set; thus, the more spread
out the data, the higher the standard deviation.
4
Regression
• A regression is a statistical technique that relates a
dependent variable to one or more independent
(explanatory) variables.
• A regression model is able to show whether changes
observed in the dependent variable are associated with
changes in one or more of the explanatory variables.
• It does this by essentially fitting a best-fit line and seeing
how the data is dispersed around this line.
5
T - test
• The t -test tells you how significant the differences between
group means are. It lets you know if those differences in
means could have happened by chance. The t test is
usually used when data sets follow a normal distribution,
but you don’t know the population variance.
• The t score is a ratio between the difference between two
groups and the difference within the groups.
Larger t scores = more difference between groups.
Smaller t score = more similarity between groups.
6
T - test
7
Median
• Median, in statistics, is the middle value of the given list of
data, when arranged in an order. The arrangement of data
or observations can be done either in ascending order or
descending order.
Example: The median of 2,3,4 is 3. In Maths, the median is
also a type of average, which is used to find the center value.
8
Chi-square
• A chi-square ( χ2) statistic is a measure of the difference
between the observed and expected frequencies of the
outcomes of a set of events or variables.
• It is used for analyzing differences in categorical variables,
especially those nominal in nature.
• Chi-squared, more properly known as Pearson's chi-square
test, is a means of statistically evaluating data.
• It is used when categorical data from a sampling are being
compared to expected or "true" results.
9
Chi-square
10
ANOVA (Analysis of Variance)
• Analysis of variance (ANOVA) is an analysis tool used in statistics that splits an
observed aggregate variability found inside a data set into two parts: systematic
factors and random factors. The systematic factors have a statistical influence
on the given data set, while the random factors do not. Analysts use the ANOVA
test to determine the influence that independent variables have on the
dependent variable in a regression study.
• The t- and z-test methods developed in the 20th century were used for statistical
analysis until 1918, when Ronald Fisher created the analysis of variance
method.
• ANOVA is also called the Fisher analysis of variance, and it is the extension of
the t- and z-tests. The term became well-known in 1925, after appearing in
Fisher's book, "Statistical Methods for Research Workers.“
• It was employed in experimental psychology and later expanded to subjects
that were more complex.
11
ANOVA (Analysis of Variance)
12
Factorial ANOVA (Analysis of Variance)
• A factorial ANOVA compares means across two or more
independent variables.
• Factorial ANOVA has two or more independent variables that
split the sample in four or more groups. The simplest case of a
factorial ANOVA uses two binary variables as independent
variables, thus creating four groups within the sample.
• For some statisticians, the factorial ANOVA doesn’t only
compare differences but also assumes a cause- effect
relationship; this infers that one or more independent,
controlled variables (the factors) cause the significant
difference of one or more characteristics. The way this works
is that the factors sort the data points into one of the groups,
causing the difference in the mean value of the groups.
13
Factorial ANOVA (Analysis of Variance)
14
Correlation
• Correlation analysis in research is a statistical method
used to measure the strength of the linear relationship
between two variables and compute their association.
Simply put - correlation analysis calculates the level of
change in one variable due to the change in the other.
Example of correlation analysis
• Positive correlation:
• Negative correlation:
• Weak/Zero correlation:
15
Correlation
• Positive correlation:
A positive correlation between two variables means
both the variables move in the same direction. An increase in
one variable leads to an increase in the other variable and
vice versa.
For example, spending more time on a treadmill burns more
calories.
16
Correlation
17
Correlation
• Negative correlation:
A negative correlation between two variables
means that the variables move in opposite directions.
An increase in one variable leads to a decrease in the
other variable and vice versa.
For example, increasing the speed of a vehicle
decreases the time you take to reach your
destination.
18
Correlation
19
Correlation
• Weak/Zero correlation:
No correlation exists when one variable does
not affect the other.
For example, there is no correlation between the
number of years of school a person has attended and
the letters in his/her name.
20
Correlation
21
References
9/3/20XX Presentation Title 22
https://statisticsbyjim.com/basics/mean_average/
https://www.investopedia.com/terms/s/standarddeviation.asp
https://www.investopedia.com/terms/r/regression.asp
https://byjus.com/maths/median/
https://www.statisticshowto.com/probability-and-statistics/t-test/
https://www.scribbr.com/statistics/chi-square-tests/
https://www.investopedia.com/terms/a/anova.asp
https://www.slideshare.net/murathotirajendranathbabu/statistical-tools-in-research-231169355?from_search=1
https://www.statisticssolutions.com/free-resources/directory-of-statistical-analyses/factorial-
anova/#:~:text=A%20factorial%20ANOVA%20compares%20means,in%20four%20or%20more%20groups.
https://www.questionpro.com/features/correlation-
analysis.html#:~:text=What%20is%20correlation%20analysis%3F,the%20change%20in%20the%20other.
Thank you
23

Choosing Appropriate Statistical Tools in research.pptx

  • 1.
  • 2.
    Introduction • Well-designed researchrequires a well-chosen study sample and a suitable statistical test selection. Improper inferences from it could lead to false conclusions and unethical behavior. Statistical tools are extensively used in academic and research sectors to study human, animal, and material behaviors and reactions. They can be used to evaluate and comprehend any form of data. Some statistical tools can help you see trends, forecast future sales, and create links between causes and effects. 2
  • 3.
    Mean • The arithmeticmean, more commonly known as the average, is the sum of a list of numbers divided by the number of item in the list. The mean is useful in determining the overall trend of a data set providing a rapid snapshot of your data. 9/3/20XX 3
  • 4.
    Standard Deviation • isa statistic that measures the dispersion of a dataset relative to its mean and is calculated as the square root of the variance. The standard deviation is calculated as the square root of variance by determining each data point's deviation relative to the mean. • If the data points are further from the mean, there is a higher deviation within the data set; thus, the more spread out the data, the higher the standard deviation. 4
  • 5.
    Regression • A regressionis a statistical technique that relates a dependent variable to one or more independent (explanatory) variables. • A regression model is able to show whether changes observed in the dependent variable are associated with changes in one or more of the explanatory variables. • It does this by essentially fitting a best-fit line and seeing how the data is dispersed around this line. 5
  • 6.
    T - test •The t -test tells you how significant the differences between group means are. It lets you know if those differences in means could have happened by chance. The t test is usually used when data sets follow a normal distribution, but you don’t know the population variance. • The t score is a ratio between the difference between two groups and the difference within the groups. Larger t scores = more difference between groups. Smaller t score = more similarity between groups. 6
  • 7.
  • 8.
    Median • Median, instatistics, is the middle value of the given list of data, when arranged in an order. The arrangement of data or observations can be done either in ascending order or descending order. Example: The median of 2,3,4 is 3. In Maths, the median is also a type of average, which is used to find the center value. 8
  • 9.
    Chi-square • A chi-square( χ2) statistic is a measure of the difference between the observed and expected frequencies of the outcomes of a set of events or variables. • It is used for analyzing differences in categorical variables, especially those nominal in nature. • Chi-squared, more properly known as Pearson's chi-square test, is a means of statistically evaluating data. • It is used when categorical data from a sampling are being compared to expected or "true" results. 9
  • 10.
  • 11.
    ANOVA (Analysis ofVariance) • Analysis of variance (ANOVA) is an analysis tool used in statistics that splits an observed aggregate variability found inside a data set into two parts: systematic factors and random factors. The systematic factors have a statistical influence on the given data set, while the random factors do not. Analysts use the ANOVA test to determine the influence that independent variables have on the dependent variable in a regression study. • The t- and z-test methods developed in the 20th century were used for statistical analysis until 1918, when Ronald Fisher created the analysis of variance method. • ANOVA is also called the Fisher analysis of variance, and it is the extension of the t- and z-tests. The term became well-known in 1925, after appearing in Fisher's book, "Statistical Methods for Research Workers.“ • It was employed in experimental psychology and later expanded to subjects that were more complex. 11
  • 12.
    ANOVA (Analysis ofVariance) 12
  • 13.
    Factorial ANOVA (Analysisof Variance) • A factorial ANOVA compares means across two or more independent variables. • Factorial ANOVA has two or more independent variables that split the sample in four or more groups. The simplest case of a factorial ANOVA uses two binary variables as independent variables, thus creating four groups within the sample. • For some statisticians, the factorial ANOVA doesn’t only compare differences but also assumes a cause- effect relationship; this infers that one or more independent, controlled variables (the factors) cause the significant difference of one or more characteristics. The way this works is that the factors sort the data points into one of the groups, causing the difference in the mean value of the groups. 13
  • 14.
  • 15.
    Correlation • Correlation analysisin research is a statistical method used to measure the strength of the linear relationship between two variables and compute their association. Simply put - correlation analysis calculates the level of change in one variable due to the change in the other. Example of correlation analysis • Positive correlation: • Negative correlation: • Weak/Zero correlation: 15
  • 16.
    Correlation • Positive correlation: Apositive correlation between two variables means both the variables move in the same direction. An increase in one variable leads to an increase in the other variable and vice versa. For example, spending more time on a treadmill burns more calories. 16
  • 17.
  • 18.
    Correlation • Negative correlation: Anegative correlation between two variables means that the variables move in opposite directions. An increase in one variable leads to a decrease in the other variable and vice versa. For example, increasing the speed of a vehicle decreases the time you take to reach your destination. 18
  • 19.
  • 20.
    Correlation • Weak/Zero correlation: Nocorrelation exists when one variable does not affect the other. For example, there is no correlation between the number of years of school a person has attended and the letters in his/her name. 20
  • 21.
  • 22.
    References 9/3/20XX Presentation Title22 https://statisticsbyjim.com/basics/mean_average/ https://www.investopedia.com/terms/s/standarddeviation.asp https://www.investopedia.com/terms/r/regression.asp https://byjus.com/maths/median/ https://www.statisticshowto.com/probability-and-statistics/t-test/ https://www.scribbr.com/statistics/chi-square-tests/ https://www.investopedia.com/terms/a/anova.asp https://www.slideshare.net/murathotirajendranathbabu/statistical-tools-in-research-231169355?from_search=1 https://www.statisticssolutions.com/free-resources/directory-of-statistical-analyses/factorial- anova/#:~:text=A%20factorial%20ANOVA%20compares%20means,in%20four%20or%20more%20groups. https://www.questionpro.com/features/correlation- analysis.html#:~:text=What%20is%20correlation%20analysis%3F,the%20change%20in%20the%20other.
  • 23.