Downloaded 84 times

![3 major tools used in Univariate analysis
Distribution [of frequency]
Central tendency[mean,median and mode]
Dispersion](https://image.slidesharecdn.com/univariateanalysis-140317045113-phpapp02/85/Univariate-analysis-Medical-statistics-Part-IV-8-320.jpg)
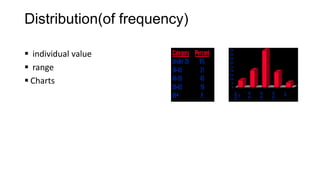
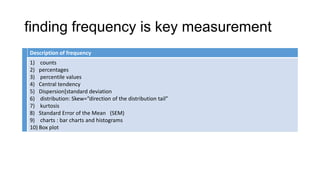
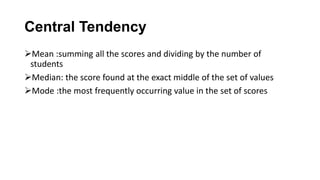
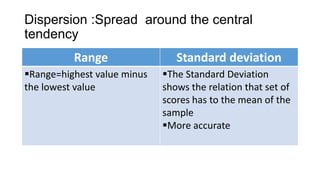
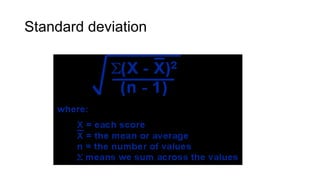


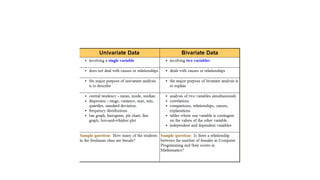
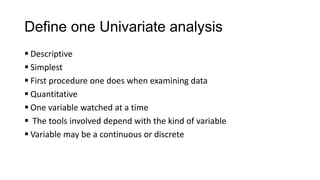
Univariate analysis examines one variable at a time across a sample. There are three main tools used in univariate analysis: distribution of frequency, measures of central tendency (mean, median, mode), and measures of dispersion. Distribution examines individual values, range, and charts. Central tendency measures the average or middle value. Dispersion measures the spread around the central tendency, such as the standard deviation and range. Common univariate analysis procedures include frequencies, descriptives, and explore in SPSS.


