(INDIRA) Call Girl Mumbai Call Now 8250077686 Mumbai Escorts 24x7
Tech Mahindra Management Meet Note 19 03 10
1. Management Meet Update | IT
March 19, 2010
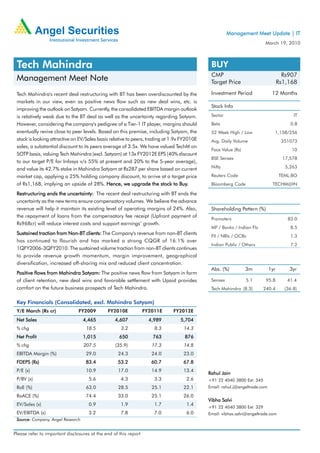
Tech Mahindra BUY
CMP Rs907
Management Meet Note Target Price Rs1,168
Tech Mahindra's recent deal restructuring with BT has been overdiscounted by the Investment Period 12 Months
markets in our view, even as positive news flow such as new deal wins, etc. is
Stock Info
improving the outlook on Satyam. Currently, the consolidated EBITDA margin outlook
is relatively weak due to the BT deal as well as the uncertainty regarding Satyam. Sector IT
However, considering the company's pedigree of a Tier-1 IT player, margins should Beta 0.8
eventually revive close to peer levels. Based on this premise, including Satyam, the 52 Week High / Low 1,158/256
stock is looking attractive on EV/Sales basis relative to peers, trading at 1.9x FY2010E Avg. Daily Volume 351073
sales, a substantial discount to its peers average of 3.5x. We have valued TechM on
Face Value (Rs) 10
SOTP basis, valuing Tech Mahindra (excl. Satyam) at 13x FY2012E EPS (40% discount
BSE Sensex 17,578
to our target P/E for Infosys v/s 55% at present and 20% to the 5-year average),
and value its 42.7% stake in Mahindra Satyam at Rs287 per share based on current Nifty 5,263
market cap, applying a 25% holding company discount, to arrive at a target price Reuters Code TEML.BO
of Rs1,168, implying an upside of 28%. Hence, we upgrade the stock to Buy. Buy. Bloomberg Code TECHM@IN
Restructuring ends the uncertainty: The recent deal restructuring with BT ends the
uncertainty as the new terms ensure compensatory volumes. We believe the advance
revenue will help it maintain its existing level of operating margins of 24%. Also, Shareholding Pattern (%)
the repayment of loans from the compensatory fee receipt (Upfront payment of
Promoters 83.0
Rs968cr) will reduce interest costs and support earnings’ growth.
MF / Banks / Indian FIs 8.5
Sustained traction from Non-BT clients: The Company's revenue from non-BT clients
FII / NRIs / OCBs 1.3
has continued to flourish and has marked a strong CQGR of 16.1% over
Indian Public / Others 7.2
1QFY2006-3QFY2010. The sustained volume traction from non-BT clients continues
to provide revenue growth momentum, margin improvement, geographical
diversification, increased off-shoring mix and reduced client concentration.
Abs. (%) 3m 1yr 3yr
Positive flows from Mahindra Satyam: The positive news flow from Satyam in form
of client retention, new deal wins and favorable settlement with Upaid provides Sensex 5.1 95.8 41.4
comfort on the future business prospects of Tech Mahindra. Tech Mahindra (8.3) 240.4 (36.8)
Key Financials (Consolidated, excl. Mahindra Satyam)
Y/E March (Rs cr) FY2009 FY2010E FY2011E FY2012E
Net Sales 4,465 4,607 4,989 5,704
% chg 18.5 3.2 8.3 14.3
Profit
Net Profit 1,015 650 763 876
% chg 207.5 (35.9) 17.3 14.8
EBITDA Margin (%) 29.0 24.3 24.0 23.0
FDEPS (Rs) 83.4 53.2 60.7 67.8
P/E (x) 10.9 17.0 14.9 13.4
Rahul Jain
P/BV (x) 5.6 4.3 3.3 2.6 +91 22 4040 3800 Ext: 345
RoE (%) 63.0 28.5 25.1 22.1 Email: rahul.j@angeltrade.com
RoACE (%) 74.4 33.0 25.1 26.0
Vibha Salvi
EV/Sales (x) 0.9 1.9 1.7 1.4
+91 22 4040 3800 Ext: 329
EV/EBITDA (x) 3.2 7.8 7.0 6.0 Email: vibhas.salvi@angeltrade.com
Source: Company, Angel Research
Please refer to important disclosures at the end of this report
2. Tech Mahindra| Management Meet Update
Restructuring terms - Mutually Beneficial
Restructuring to guarantee volumes As per the restructuring terms, Tech Mahindra has accepted an upfront compensation
Pricing BTs
compensating lower P ricing in BTs fee of Rs968cr, in lieu of revised lower pricing based on a fixed rate card across
contract projects, for the remaining part of its contract term with BT, and on assurance of
increased volumes from BT. This upfront fee will be amortised and booked as revenues
in Tech Mahindra's P&L at a quarterly run rate of Rs50cr (Rs150cr already booked till
3QFY2010, out of Rs968cr). Thus, the balance Rs818cr stands to be booked in Tech
M's P&L starting from 4QFY2010E, which would be amortised over a period of
~16 quarters. The company has been assured of volume commitment on the Barcelona
and Strada deals, and is also negotiating for the Andes deal (on the volume front). We
believe that the revised pricing would not impact margins materially, as the company
would be able to best utilise its levers in view of volume visibility and negligible S&M
costs. The other positive point of the development is that the company has utilised the
compensation fee to repay its debt amounting to Rs300cr in 3QFY2010, and
furthermore by Rs350cr in January 2010, which would lower the interest cost
substantially.
Although Tech Mahindra's pricing has been restricted, it may still be enhanced with an
improvement in the BT's financial health in the coming period. Also, the pricing in the
newer deals with BT would be at arm's length, as new contracts would be priced
competitively through RFP (Request for proposal), which would result in either a pricing
revision or incremental business.
Exhibit 1: BT-Non BT Quarterly Revenue Trends
770
700
630
560
(Rs cr)
490
420
350
280
Q1FY08
Q2FY08
Q3FY08
Q4FY08
Q1FY09
Q2FY09
Q3FY09
Q4FY09
Q1FY10
Q2FY10
Q3FY10
BT Revenue Non BT Revenue
Source: Company, Angel Research
Sustained traction from Non-BT clients to mitigate
BT-associated risks
Strong revenue growth momentum The Company's revenue from non-BT clients has continued to flourish, despite the
being witnessed from Non-BT clients qoq overall downtick in the demand scenario. The new client wins and ramp-up in the
existing clients has resulted in a strong CQGR of 16.1% over 1QFY2006-3QFY2010.
We believe that the traction in the non-BT segment (4% CQGR over
4QFY2010E-4QFY2012E) will continue in view of a high success ratio, vertical
expertise and high demand in the telecom segment. Also, a higher proportion of
Non-BT business (to reach 59% by FY2012E, as against 50% on an LTM basis) would
contribute to the improvement in overall profitability.
March 19, 2010 2
3. Tech Mahindra| Management Meet Update
Strong traction in Non-BT buisness to Exhibit 2: Non-BT Revenue Quarterly growth trend
improve overall profitabiltiy 700 18%
650 16%
600 14%
550 12%
(Rs cr)
500 10%
450 8%
400 6%
350 4%
300 2%
Q1FY09
Q2FY09
Q3FY09
Q4FY09
Q1FY10
Q2FY10
Q3FY10
Non BT Revenue QoQ growth
Source: Company, Angel Research
The sustained volume traction from non-BT clients continues to provide revenue growth
momentum to the company, covering the decline in the top account. The growth in the
non-BT account has resulted in margin improvement, geographical diversification,
increased offshoring mix and reduced client concentration. The high growth in the
non-BT revenue has been maintained despite adding no new clients (net 110 since
1QFY2010), which suggests a higher wallet share per client, and is a sign of a strong
client relationship.
Sustained qoq hiring Strong Hiring Signals Volume Traction
exhibits improved business prospects
Tech Mahindra added a net 3,897 employees (highest in the last ten quarters) in the
recently concluded quarter (3QFY2010), taking the total headcount to 30,404. The
company made an overall 5,432 net additions in 9MFY2010, an increase of 21.7%
over the previous year, which is a healthy sign. The hiring has been made both in the
BPO as well software segments, which exhibits signs of a strong pipeline across business
segments. The total utilisation has also been improving, and has reached a level of
73% in 9MFY2010, suggesting strong volume traction in the current year, which would
be further enhanced as it has strong business visibility ensured by the terms of the
contract.
Exhibit 3: Quarterly Manpower addition trend
700 18%
650 16%
600 14%
550 12%
(Rs cr)
500 10%
450 8%
400 6%
350 4%
300 2%
Q1FY09
Q2FY09
Q3FY09
Q4FY09
Q1FY10
Q2FY10
Q3FY10
Non BT Revenue QoQ growth
Source: Company, Angel Research
March 19, 2010 3
4. Tech Mahindra| Management Meet Update
New Deal Wins and Dispute Settlement Adding Stability To Satyam
Mahindra Satyam has started seeing The company has recently bagged a four-year offshore contract for application
better business opportunities under the development work with KMD, a Denmark-based IT company, for US $48mn (~Rs218cr,
Tech
guidance of the new managment of Tech in March 2010). The recent wins, along with GE's extension of multi-million dollar
Mahindra contracts in ADM, BI and Engineering Services for the next three years indicates restored
client confidence in the company. Mahindra Satyam agreed for an out-of-the-court
settlement with the UK-based Upaid, for its claim of US $1bn, by paying off US $45mn
upfront and US $25mn in the next one year, thereby settling the entire claim at
US $70mn (~Rs325cr). With this development, Mahindra Satyam is expected to get
world-wide royalty-free license on patents (after the settlement of this claim).
As per recent estimates, we believe that Satyam will clock about US $1-1.2bn on the
top-line front for FY2010E. The new management has been working on cost
rationalisation and manpower optimisation, which would help it cover up the
operational cost pressures of lower pricing and client exodus, to some extent.
Risk Analysis
Further slowdown in the BT Business could hamper the revenue and earnings
estimates.
Integration issues with Satyam may result in lower business synergy.
Industry-wide concerns, such as wage hike, attrition and GBP depreciation are
potential downside risks.
Outlook and Valuation
Tech Mahindra has been consistently winning big deals in the telecom space and has
emerged as a preferred vendor of choice in the telecom vertical. The company has
been constantly expanding its focus on North America and Asia, to cover up for its
stagnant revenue stream from the European market. Its revenue in 3QFY2010 from
America recorded a growth of 27% yoy. The company is expecting big opportunities
from the developing markets, on account of new network rollouts and technological
upgradation.
Currently, the consolidated EBITDA margin outlook is relatively weak due to the BT
deal as well as the uncertainty regarding Satyam. However, considering the company's
pedigree of a Tier-1 IT player, margins should eventually revive close to peer levels.
Based on this premise, including Satyam, the stock is looking attractive on EV/Sales
basis relative to peers, trading at 1.9x FY2010E sales, a substantial discount to its
peers’ average of 3.5x.
Exhibit 4: Peer Analysis - EV/Sales and EBIDTA Margin (LTM)
40% 6.4 7
35% 5.4 6
30%
5
25% 3.9
4
20% 2.9
3.2 3
15% 1.9
1.5 2
10%
5% 1
0% 0
Infosys TCS Wipro HCL * Mphasis TechM # Patni
EV/Sales EBIDTA Margin
Source: Company, Angel Research; * HCL valued adjusting for Axon; # Tech M calculated including
42% share in Satyam revenue
March 19, 2010 4
5. Tech Mahindra| Management Meet Update
We expect Tech Mahindra to record a CAGR of 11.3% in its Top-line over
FY2010E-12E (excluding Mahindra Satyam), while the Bottom-line is expected to grow
at a CAGR of 13% over FY2010E-12E. We believe that the savings in interest costs (on
repayment of the loan) and a favorable revenue-mix (contribution of non-BT
increasing) would support margin resilience in the coming period.
Exhibit 5: SOTP Valuation
Particulars Target Value (Rs)
Value
(A) Tech Mahindra (Excl. Satyam)
Tech
FY2012E EPS 67.8
Target P/E 13
881 881
Mahindra Satyam
Satyam CMP (Rs) 98
No. of shares (cr) 117.58
Total Mcap (Rs cr) 11546
Holding Company Discount 25%
Discounted value of investment (Rs cr) 8660
Tech Mahindra Stake 42.7%
Tech M (no. of shares in cr) 12.9
Per Tech
(B) Per share value for Tech M. 287 287
SOTP Value
Tech Mahindra - SOTP Value (A+B) 1168
Source: Company, Angel Research
The stock is trading at a substantial 55% discount to Infosys on a 1-year forward P/E
v/s a 5-year average discount of 20%, while the company is expected to generate
average PAT margins of 15.3% and EPS CAGR of 13% over FY2010E-12E. We have
valued the stock on an SOTP basis, valuing Tech Mahindra (excluding Satyam) at 13x
FY2012E EPS (40% discount to our target P/E for Infosys) and its 42.7% stake in
Mahindra Satyam at Rs287 per share (based on current market cap and applying a
25% holding company discount) to arrive at a target price of Rs1,168, implying an
Buy.
upside of 28%. Hence, we upgrade the stock to Buy.
Exhibit 6: P/E Band
4,000
3,500
3,000
Share Price (Rs)
2,500
2,000 40x
1,500 30x
1,000 20x
500 10x
0
Nov-06
Feb-07
Nov-07
Feb-08
Nov-08
Feb-09
Nov-09
Feb-10
Aug-06
May-07
Aug-07
May-08
Aug-08
May-09
Aug-09
Source: Company, Angel Research
March 19, 2010 5
10. Tech Mahindra
DISCLAIMER
This document is not for public distribution and has been furnished to you solely for your information and must not be reproduced or
redistributed to any other person. Persons into whose possession this document may come are required to observe these restrictions.
Opinion expressed is our current opinion as of the date appearing on this material only. While we endeavor to update on a reasonable
basis the information discussed in this material, there may be regulatory, compliance, or other reasons that prevent us from doing so.
Prospective investors and others are cautioned that any forward-looking statements are not predictions and may be subject to change
without notice. Our proprietary trading and investment businesses may make investment decisions that are inconsistent with the
recommendations expressed herein.
The information in this document has been printed on the basis of publicly available information, internal data and other reliable sources
believed to be true and are for general guidance only. While every effort is made to ensure the accuracy and completeness of information
contained, the company takes no guarantee and assumes no liability for any errors or omissions of the information. No one can use the
information as the basis for any claim, demand or cause of action.
Recipients of this material should rely on their own investigations and take their own professional advice. Each recipient of this document
should make such investigations as it deems necessary to arrive at an independent evaluation of an investment in the securities of companies
referred to in this document (including the merits and risks involved), and should consult their own advisors to determine the merits and
risks of such an investment. Price and value of the investments referred to in this material may go up or down. Past performance is not a
guide for future performance. Certain transactions - futures, options and other derivatives as well as non-investment grade securities -
involve substantial risks and are not suitable for all investors. Reports based on technical analysis centers on studying charts of a stock's
price movement and trading volume, as opposed to focusing on a company's fundamentals and as such, may not match with a report on
a company's fundamentals.
We do not undertake to advise you as to any change of our views expressed in this document. While we would endeavor to update the
information herein on a reasonable basis, Angel Securities, its subsidiaries and associated companies, their directors and employees are
under no obligation to update or keep the information current. Also there may be regulatory, compliance, or other reasons that may
prevent Angel Securities and affiliates from doing so. Prospective investors and others are cautioned that any forward-looking statements
are not predictions and may be subject to change without notice. Angel Securities Limited and affiliates, including the analyst who has
issued this report, may, on the date of this report, and from time to time, have long or short positions in, and buy or sell the securities of the
companies mentioned herein or engage in any other transaction involving such securities and earn brokerage or compensation or act as
advisor or have other potential conflict of interest with respect to company/ies mentioned herein or inconsistent with any recommendation
and related information and opinions.
Angel Securities Limited and affiliates may seek to provide or have engaged in providing corporate finance, investment banking or other
advisory services in a merger or specific transaction to the companies referred to in this report, as on the date of this report or in the past.
Note: Please refer important `Stock Holding Disclosure' report on Angel web-site (Research Section).
Disclosure of Interest Statement Tech Mahindra
1. Analyst ownership of the stock No
2. Angel and its Group companies ownership of the stock Yes
3. Angel and its Group companies' Directors ownership of the stock No
4. Broking relationship with company covered No
Note: We have not considered any Exposure below Rs 5 lakh for Angel, its Group companies and Directors.
Ratings (Returns) : Buy (> 15%) Accumulate (5% to 15%) Neutral (-5 to 5%)
Reduce (-5% to -15%) Sell (< -15%)
11. Tech Mahindra
Address: Acme Plaza, ‘A’ Wing, 3rd Floor, M.V. Road, Opp. Sangam Cinema, Andheri (E), Mumbai - 400 059.
Tel : (022) 3952 4568 / 4040 3800
Research Team
Fundamental:
Hitesh Agrawal Head - Research hitesh.agrawal@angeltrade.com
Sarabjit Kour Nangra VP-Research, Pharmaceutical sarabjit@angeltrade.com
Vaibhav Agrawal VP-Research, Banking vaibhav.agrawal@angeltrade.com
Vaishali Jajoo Automobile vaishali.jajoo@angeltrade.com
Shailesh Kanani Infrastructure, Real Estate shailesh.kanani@angeltrade.com
Anand Shah FMCG , Media anand.shah@angeltrade.com
Deepak Pareek Oil & Gas deepak.pareek@angeltrade.com
Puneet Bambha Capital Goods, Engineering puneet.bambha@angeltrade.com
Sushant Dalmia Pharmaceutical sushant.dalmia@angeltrade.com
Rupesh Sankhe Cement, Power rupeshd.sankhe@angeltrade.com
Param Desai Real Estate, Logistics, Shipping paramv.desai@angeltrade.com
Sageraj Bariya Fertiliser, Mid-cap sageraj.bariya@angeltrade.com
Viraj Nadkarni Retail, Hotels, Mid-cap virajm.nadkarni@angeltrade.com
Paresh Jain Metals & Mining pareshn.jain@angeltrade.com
Amit Rane Banking amitn.rane@angeltrade.com
Rahul Jain IT rahul.j@angeltrade.com
Jai Sharda Mid-cap jai.sharda@angeltrade.com
Sharan Lillaney Mid-cap sharanb.lillaney@angeltrade.com
Amit Vora Research Associate (Oil & Gas) amit.vora@angeltrade.com
V Srinivasan Research Associate (Cement, Power) v.srinivasan@angeltrade.com
Aniruddha Mate Research Associate (Infra, Real Estate) aniruddha.mate@angeltrade.com
Shreya Gaunekar Research Associate (Automobile) shreyap.gaunekar@angeltrade.com
Mihir Salot Research Associate (Logistics, Shipping) mihirr.salot@angeltrade.com
Chitrangda Kapur Research Associate (FMCG, Media) chitrangdar.kapur@angeltrade.com
Vibha Salvi Research Associate (IT, Telecom) vibhas.salvi@angeltrade.com
Pooja Jain Research Associate (Metals & Mining) pooja.j@angeltrade.com
Technicals:
Shardul Kulkarni Sr. Technical Analyst shardul.kulkarni@angeltrade.com
Mileen Vasudeo Technical Analyst vasudeo.kamalakant@angeltrade.com
Derivatives:
Siddarth Bhamre Head - Derivatives siddarth.bhamre@angeltrade.com
Jaya Agarwal Jr. Derivative Analyst jaya.agarwal@angeltrade.com
Institutional Sales Team:
Mayuresh Joshi VP - Institutional Sales mayuresh.joshi@angeltrade.com
Abhimanyu Sofat AVP - Institutional Sales abhimanyu.sofat@angeltrade.com
Nitesh Jalan Sr. Manager niteshk.jalan@angeltrade.com
Pranav Modi Sr. Manager pranavs.modi@angeltrade.com
Sandeep Jangir Sr. Manager sandeepp.jangir@angeltrade.com
Ganesh Iyer Sr. Manager ganeshb.Iyer@angeltrade.com
Jay Harsora Sr. Dealer jayr.harsora@angeltrade.com
Meenakshi Chavan Dealer meenakshis.chavan@angeltrade.com
Gaurang Tisani Dealer gaurangp.tisani@angeltrade.com
Production Team:
Bharathi Shetty Research Editor bharathi.shetty@angeltrade.com
Dharmil Adhyaru Assistant Research Editor dharmil.adhyaru@angeltrade.com
Bharat Patil Production bharat.patil@angeltrade.com
Dilip Patel Production dilipm.patel@angeltrade.com
Angel Broking Ltd: BSE Sebi Regn No : INB 010996539 / CDSL Regn No: IN - DP - CDSL - 234 - 2004 / PMS Regn Code: PM/INP000001546 Angel Securities Ltd:BSE: INB010994639/INF010994639 NSE: INB230994635/INF230994635 Membership numbers: BSE 028/NSE:09946
Angel Capital & Debt Market Ltd: INB 231279838 / NSE FNO: INF 231279838 / NSE Member code -12798 Angel Commodities Broking (P) Ltd: MCX Member ID: 12685 / FMC Regn No: MCX / TCM / CORP / 0037 NCDEX : Member ID 00220 / FMC Regn No: NCDEX / TCM / CORP / 0302