RE Capital's Visionary Leadership under Newman Leech
Financial Technologies
1. th
6 April, 2009
India
Financial Technologies
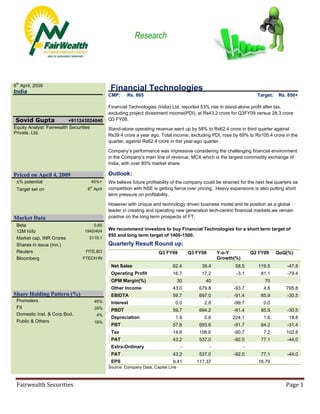
CMP: Rs. 665 Target: Rs. 850+
Financial Technologies (India) Ltd, reported 53% rise in stand-alone profit after tax,
excluding project divestment income(PDI), at Rs43.2 crore for Q3FY09 versus 28.3 crore
Sovid Gupta +911243024840 Q3 FY08.
Equity Analyst: Fairwealth Securities Stand-alone operating revenue went up by 58% to Rs62.4 crore in third quarter against
Private. Ltd.
Rs39.4 crore a year ago. Total income, excluding PDI, rose by 69% to Rs105.4 crore in the
quarter, against Rs62.4 crore in the year-ago quarter.
Company’s performance was impressive considering the challenging financial environment
in the Company’s main line of revenue, MCX which is the largest commodity exchange of
India, with over 80% market share.
Priced on April 4, 2009 Outlook:
±% potential 40%+ We believe future profitability of the company could be strained for the next few quarters as
Target set on
th
6 April competition with NSE is getting fierce over pricing. Heavy expansions is also putting short
term pressure on profitability.
However with unique and technology driven business model and its position as a global
leader in creating and operating new generation tech-centric financial markets,we remain
Market Data positive on the long term prospects of FT.
Beta 0.85
12M hi/lo 1945/404 We recommend investors to buy Financial Technologies for a short term target of
850 and long term target of 1400-1500.
Market cap, INR Crores 3119.1
Shares in issue (mn.) Quarterly Result Round up:
Reuters FITE.BO Q3 FY09 Q3 FY08 Y-o-Y Q2 FY09 QoQ(%)
Bloomberg FTECH:IN Growth(%)
Net Sales 62.4 39.4 58.5 119.5 -47.8
Operating Profit 16.7 17.2 -3.1 81.1 -79.4
OPM Margin(%) 30 40 70
Other Income 43.0 679.8 -93.7 4.8 795.8
Share Holding Pattern (%) EBIDTA 59.7 697.0 -91.4 85.9 -30.5
Promoters 45% Interest 0.0 2.8 -99.7 0.0
FII 35% PBDT 59.7 694.2 -91.4 85.9 -30.5
Domestic Inst. & Corp Bod. 4%
Depreciation 1.9 0.6 224.1 1.6 18.8
Public & Others 16%
PBT 57.8 693.6 -91.7 84.2 -31.4
Tax 14.6 156.6 -90.7 7.2 102.8
PAT 43.2 537.0 -92.0 77.1 -44.0
Extra-Ordinary - - -
PAT 43.2 537.0 -92.0 77.1 -44.0
EPS 9.41 117.37 16.79
Source: Company Data, Capital Line
Fairwealth Securities Page 1
2. Buy-Financial Technologies
Q3 Analysis Highlights:
58.5% Y-o-Y growth in Net sales. FTIL to set up multi-asset bourse in Bahrain-Jan-09
Non PDI income has grown to 105 crores BFX (Bahrain Financial Exchange) has been given approval to list and trade cash and
versus 63 crores in the year ago quarter. derivatives instruments on multiple asset classes such as equities, currencies, commodities,
debt products, Islamic Finance instruments and clearing by its brokers.
Operating PAT on standalone basis stood at
43.2 crores versus 28 crores in Q3 FY08.
Company’s Operating Profit margins
have witnessed sharp drop as Expenses FTIL to acquire acquires 60% equity in Bourse Africa-Dec’08
have risen at faster pace.
Botswana-based Bourse Africa Limited has been licensed by government of Botswana, to
Expenditure set-up Spot and Derivative Multi-Asset exchange for trading in commodities, currencies,
bonds and diamonds
Q3FY0 Q3F % Change
9 Y08 Y-o-Y
MCX-India’s leading commodity exchange launched currency derivatives -October
Mat. Cost 5.5 1.9 193.3 2008.
% of Sales 8.8 4.8
Emp.
21.5 11.7 83.4
Company Description:
Expenses
The Financial Technologies group is among the global leaders in offering technology IP
% of Sales 34.4 29.8
(Intellectual Property) and domain expertise to create and trade on next-generation financial
S&A Exp. 6.8 1.1 539.4 markets.
% of Sales 10.9 2.7 The Financial Technologies group operates one of the world’s largest network of 10
exchanges connecting fast-growing economies of Africa, Middle East, India and South East
Other Exp. 12.0 7.4 61.2
Asia. The group also has six ecosystem ventures to address upstream and downstream
% of Sales 19.2 18.9 opportunities around exchanges, including clearing, depository, information vending, and
Source: Capital Line payment gateway among others.
Rising Expenses are putting pressures Company is the only corporate house to have set up 5 international exchange namely :
on the bottom line and EBITDA margins.
Dubai: Dubai Gold and Commodity Exchange(DGCX)
Increased Employee and Sales
Expenses is also seen as preperation for Singapore(Sinfapore Mercentile Exchange(SMX)
Future Growth. Bahrain: Bahrain Commodity Exchnage
Mauritius: GBOT (Global Board f Trade)
Botswana: South Africa Bourse
Company has 3 focussed line of business.
Exchange business
Ecosystem Businesss
Technology Business
While Exchange business is the company’s focussed line of business, Ecosystem and
Technology are the supporting businesses which form upstream and downstream
opportunities and support.
Fairwealth Securities Page 2
3. Buy-Financial Technologies
Group Companies:
MULTI COMMODITIES EXCHANGE OF INDIA:
Largest Commodity exchange in India with:
89% market share in Q3 as against 82% in the corresponding quarter.
Average daily turnover of 13,900 crore for April-Dec 2008.
Latest tradeable product to be launched was Electricity in Jan 2009
Financial Technologies is the main promoters of Financial Technologies with 37% share
holding. Other main promoters of MCX are SBI, Fidlity and Citigroup (Source: Draft Red
Herring Prospectus). At the time deal valued MCX-SX at around USD 1 billion.
MCX-SX
Started currency futures trading in October 2008. Within 2 months of Operation acquires over
50% market share.
DGCX(Dubai Gold and Commodity Exchange)
DGCX commenced trading in November 2005 as the regions first commodity derivatives
exchange and has become today, Middle East's largest and most diverse commodities and
derivatives exchange. DGCX is an initiative of the Dubai Multi Commodities Centre (DMCC),
Financial Technologies (India) Limited and the Multi Commodity Exchange of India Limited
(MCX)
Total of 2.6 million + contracts traded with a value of USD 107 billion+ since inception.
FT group holds 39% shareholding while MCX holds 5% shareholding in the company.
IEX:
India’s No.1 power exchange with a market share of 96%, 55 members and a turnover of
1337 crores.
NSEL
National Spot exchange Limited, established in October’08 with an aim to reach a daily
turnover of 15000 crores by 2011. Currently traded commodities are Bullion and Agri
Commodities
NHBC:
National Bulk handling Corporation is highly ambitious project of FTIL with a purpose to
establish Warehouses (418 ware houses with 1.64 mn.MT of storage Capacity and 9.2 mn.
Sq. Ft. of storage area.)
Company also provide Collateral Management Services to over 3500 storage facilities and
handles over 6mn MT of Commodities and perform Quality Assurance and Pest
Management.
Fairwealth Securities Page 3
4. Buy-Financial Technologies
Atom
Atom is the product from the technology arm providing Mobile payments servces 5 fold
growth in payment processing from 30 crores in March’08 Quarter to over 160 crores in
Dec’08 Quarter.
Tickerplant
Ticker plant is in the business of information retailing by providing data, news, analytics for
Capital Markets. It provides feeds, entire data, Fundamental and Technical Charting for
Forex, Equities and Commodities markets from vatious Exchanges.
Competition:
NSE is leading exchange in India, since its inception in 1994. It is the largest Equities and
FNO exchange in the country with BSE a distant second. Exchange also has its presence in
Commodities, Foreign Exchange and Power Trading.
MCX which is late entrant has with its strong technical and support infrastructure has lately
started giving tough competition to NSE.
NSE, which enjoyed a virtual monopoly in the stock market, had a taste of real competition
when FT launched MCX-SX, a stock exchange, and started currency derivatives trading in
October last year. It’s been a see-saw fight ever since, with daily trading volume data for
February showing MCX-SX’s market share at 50.23 per cent to NSE’s 49.77 per cent.
MCX –SX hasn’t started operations in Cash and Futures segment of Equities as it is awaiting
regulatory approvals.
NSE has started a price war by offering its software NOW free of cost for three years. 80% of
the brokers are already using FT’s ODIN. What many analysts believe is predatory pricing,
NSE has clarified that it does this is inline with its policy.
FT received biggest hit when NSE decided to put FT’s ODIN on watch list on software
defeciency ssues and rejected FT’s application to issue new licenses. FT took NSE to court
for taking such step and now both parties are presenting their case in the court.
There is another majore issue in the currency futures market, NSE has kept zero transaction
fee a practise which has been criticised by MCX-SX as well as industry experts.
NSE can afford to keep zero transaction fees as it earns most of its revenue in the cash and
futures segment of Equities.
Industry experts have called fr a level playing field asking regulators to allow more brokerage
houses in the Equities and Derivatives segment.
Fairwealth Securities Page 4
5. Buy-Financial Technologies
THE BATTLEFIELD
Who operates what
NSE FT/MCX
Technology Now, NSEIT, OM NSESYS ODIN
Stock exchange Equity, F&O and currency Currency
Commodity futures NCDEX MCX
Power trading PXI IEX
Overseas exchange 5 exchanges
Source: Business Standard
While there is much more to the battle between two large exchange in India, Industry has
clearly suggested its need for more transparent and competitive exchanges, moreover
considering demand and need to develop Indian Financial markets Indian markets can clearly
accommodate more exchanges.
Valuations:
We initaiate a buy call on Financial Technologies after analysing and accounting for major
upsides and downsides for the stock. Company is poised to give astounding results in years
to come and we expect them to deliver 40% CAGR in its topline over next 4 years.
Profitability can get get strained in FY 10E if the they enter into a price war with NSE.
Company’s amazing track record and its technical and operational capabilities and unlimited
opportunities in Financial Markets industry in the developong and under developed countries.
We remain positive in the long term and advise investors to invest for longer periods to of
time.
At its current price of 635 stock is fairly valued for high growth company. Company’s total
Income has increased to 484 crores for 9M FY’09 while Net Profits have risen to Rs. 290
crores giving EPS of 63.21 for 9M FY’09. At annualised EPS of around 84 for stock is trading
at 7.5 x times its expected FY’09 earnings. Company has app. 1200 crores of cash and liquid
securities on its balance sheet. Copany has been registering growth of over 100%over last 5
year.
We expert stock to touch 850 – 900 in 4-6 months and to go even higher to touch its lifetime
highs for investors who can hold the stock for a period of two years.
Fairwealth Securities Page 5
6. Buy-Financial Technologies
Buy
Key Risks:
1. With current price war between NSE- MCX-SX and NSE- -MCX, FT might be forced to
lower the fees for its product which can have a huge negative impact on its profitability.
2. Financial Technologies can face major downside if it receives unfavorable response
over its ongoing litigation with NSE, which stops it to issue further licences to brokers for
,
its ODIN product.
3. Any major policy changes which stops FT’s exhanges to expand in Indian markets.
4. Policy changes in spot and futures of major Commodities can also have negative impact
pot
on Financial Technologies.
5. General slowdown in Bullion, Forex and Commodity markets can also lead to lower than
expected growth.
Besides first point we do not see any major risk and other risk mentioned are unlikely to
materialize.
However price war between MCX and NSE is likely which could lead to lower profitability in the
coming quarters.
Financial Technology stock has witnessed more
than 70% drop in share value from Feb’08 to
Feb’09 while Nifty fell by only 40%.
Last 1 month of continuous buying has led to a
huge spurt in Financial Technology share prise
which has risen by more than 50%.
We believe that a lot of steam is left in the stock
and with latest announcements of Bourse Africa
and Bahrain Stock exchange FT stock price will
see further triggers in the share price.
ther
Source: Capital Line
Fairwealth Securities Page 6
7. Buy-Financial Technologies
Investment Rational
Dominance in commodities(85% market share), Power(90% market share ) and Forex
markets with MCX and MCX –SX, FT has huge growth potential as India’s Financial
markets are only in nascent stage
With over 10 exchanges and supplementary businesses like Ecosystem and IT
services FT has established expertise in developin and operating exchanges.
With major presence in India and Dubai, FT is exapanding its presence fast other
emerging economies like Bahrain and Africa(Bourse Africa). We see tremendous
growth in financial markets of these economies and FT is well poised to take
advantage of the boom.
MCX-SX, which already has more than 50% market share in Currency Futures market
has applied to launch cash and futures for Equity markets. When it gets permission for
the same. Given FT’s track record MCX-SX is likely to give huge competition to NSE
and BSE in their biggest revenue contributor.
As a final word, FT’s current cash flow and growth figures do not justify its huge
valuation, but key to FT’s valuation is
Its strong technical capabilities and proven operational track record
Strong growth being wiitnessed and huge growth potential of Indian Financial markets
Need for other Financial markets to develop and establish Exchange traded products
and supporting infrastructure to develop spot market in tandem.
TECHNICAL OUTLOOK FINANTECH
FINANTECH has given a break out above 540 levels and had a good rally above that to post a high of 702.A look at the RSI shows that
the stock is trading in a highly overbought zone .So one can buy the stocks on dips at around 550-600 levels for an upside Target of 850
in 2-3 months.
Fairwealth Securities Page 7
8. Buy-Financial Technologies
Annexure:
1. Income Statement:
Income Statement Fund Flow Statement:
200803 200703 200603
2008(12) 2007(12) 2006 (12) SOURCES OF FUNDS :
Share Capital 9.18 8.82 8.8
INCOME
Reserves Total 1492.05 304.49 299.88
Net Sales 266.9 264.5 182.0
Total Shareholders Funds 1501.23 313.31 308.68
Other Income 1177.5 62.2 19.3 Minority Interest 11.79 108.92 110.9
Total Income 1444.5 326.7 201.2 Secured Loans 24.83 0 0
EXPENDITURE : Unsecured Loans 399.45 434.42 0
Raw Materials 3.0 7.9 0.0 Total Debt 424.28 434.42 0
Employee Cost 94.5 58.8 22.2 Total Liabilities 1937.3 856.65 419.58
Selling and Admin. APPLICATION OF FUNDS :
Expenses 29.3 62.9 38.6 Net Block 50.38 98.85 34.2
Other Expenses 115.8 27.3 16.0 Capital Work in Progress 170.88 88.35 2.02
Total Expenditure 242.6 161.7 79.0 Investments 1184.16 438.66 630.99
Operating Profit 1201.9 165.0 122.2 Current Assets, Loans &
Advances
Interest 12.3 0.9 0.1
Inventories 59.15 1.76 0
Gross Profit 1189.6 164.1 122.1
Sundry Debtors 39.03 26.93 16.13
Depreciation 9.8 8.9 5.6
Cash and Bank 554.34 656.3 105.24
Profit Before Tax 1179.8 155.3 116.5
Loans and Advances 68.32 35.89 25.89
Tax 294.0 50.2 31.6
Total Current Assets 720.84 720.88 147.26
Net Profit 885.8 103.6 83.9
Less : Current Liabilities
EO Items & Min.
and Provisions
Interest 16.3 37.2 31.5
Adj Net profit Current Liabilities 123.13 456.9 361.16
869.5 66.3 52.4
Provisions 69.77 30.55 31.4
EPS after Min. Int 185.57 13.04 14.86
Total Current Liabilities 192.9 487.45 392.56
Book Value 327.07 71.05 70.15
Source: Company Report, Capital Line Net Current Assets 527.94 233.43 -245.3
Net Deferred Tax 3.94 -2.64 -2.33
Total Assets 1937.3 856.65 419.58
Contingent Liabilities 8.57 4.38 2.7
Source: Company Report, Capital Line
2. Cash Flow Statement:
200803 200703 200603 .
Cash Flow Summary
Cash and Cash Equivalents at
Beginning of the year 534.63 73.42 16.36
Net Cash from Operating Activities -296.21 125.89 312.22
Net Cash Used in Investing Activities -230.53 -23.2 -470.21
Net Cash Used in Financing Activities 346.5 358.52 215.05
Net Inc/(Dec) in Cash and Cash
Equivalent -180.24 461.21 57.06
Cash and Cash Equivalents at End of
the year 354.39 534.63 73.42
Source: Company Report, Capital Line
Fairwealth Securities Page 8
9. Buy-Financial Technologies
Coverage:
Our Stock coverage and Returns.
Stock Target Price as on Call date Price on % return absolute % return
2nd Relative
April (Outperfe
romance)
Set Date Price Stock Sensex Stock Stock Sensex
Educomp 22-Jan-09 2750 1715 8814 2398 39.8% 19.5% 20.3%
Havells 30-Jan-09 280 115 8325 153.1 33.1% 26.5% 6.6%
Jaiprakash 12-Feb-09 110 73 9466 97.55 33.6% 11.3% 22.3%
Associates
Lupin 3-Feb-09 780 630 8607 640 1.6% 22.4% -20.8%
Tata Steel 6-Mar-09 250 152 8325 235.65 55.0% 26.5% 28.5%
M&M 12-Mar-09 430 345 8344 459.7 33.2% 26.2% 7.0%
Unitech 25-Mar-09 51 34 9667 36.75 8.1% 9.0% -0.9%
Punj Lloyd 30-Mar-09 120/145 85 9549 106.7 25.5% 10.3% 15.2%
Note: Based on 6th April Sensex closing of 10535
Note: All calls are initial/ first time calls
Note: All reports can be accesed
Fundamental and Technical reports are independently given and investors are advised to take their decision based on their investment
profile and holding periods
Disclaimer
This publication has been prepared solely for information purpose and does not constitute a solicitation to any person to buy or sell a security. While
the information contained therein has been obtained from sources believed to be reliable; investors are advised to satisfy themselves before making
any investments. Fairwealth Securities Pvt Ltd does not bear any responsibility for the authentication of the information contained in
the reports and consequently, is not liable for any decisions taken based on the same. Further, Fairwealth Research Reports only provide information
updates and analysis. All opinion for buying and selling are available to investors when they are registered clients of Fairwealth Investment Advisory
Services. As a matter of practice, Fairwealth refrains from publishing any individual names with its reports. As per SEBI requirements it is stated that,
Fairwealth Sec Pvt Ltd., and/or individuals thereof may have positions in securities referred herein and may make purchases or sale while this report is
in circulation.
Fairwealth Securities Page 9