3QSY2010 Result Update | Sugar Mills Reports Lower Profits
1. 3QSY2010 Result Update | Sugar
July 28, 2010
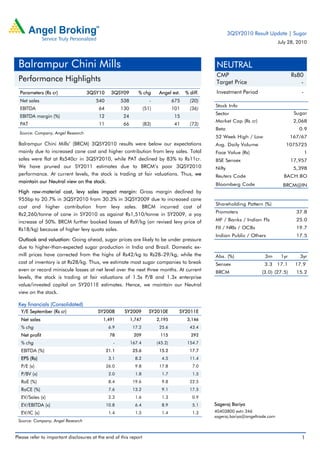
Balrampur Chini Mills NEUTRAL
CMP Rs80
Performance Highlights Target Price -
Parameters (Rs cr) 3QSY10 3QSY09 % chg Angel est. % diff. Investment Period -
Net sales 540 538 - 675 (20)
Stock Info
EBITDA 64 130 (51) 101 (36)
Sector Sugar
EBITDA margin (%) 12 24 15
Market Cap (Rs cr) 2,068
PAT 11 66 (83) 41 (73)
Beta 0.9
Source: Company, Angel Research
52 Week High / Low 167/67
Balrampur Chini Mills’ (BRCM) 3QSY2010 results were below our expectations Avg. Daily Volume 1075725
mainly due to increased cane cost and higher contribution from levy sales. Total Face Value (Rs) 1
sales were flat at Rs540cr in 3QSY2010, while PAT declined by 83% to Rs11cr. BSE Sensex 17,957
We have pruned our SY2011 estimates due to BRCM’s poor 3QSY2010 Nifty 5,398
performance. At current levels, the stock is trading at fair valuations. Thus, we Reuters Code BACH.BO
maintain our Neutral view on the stock.
Bloomberg Code BRCM@IN
High raw-material cost, levy sales impact margin: Gross margin declined by
955bp to 20.7% in 3QSY2010 from 30.3% in 3QSY2009 due to increased cane
Shareholding Pattern (%)
cost and higher contribution from levy sales. BRCM incurred cost of
Promoters 37.8
Rs2,260/tonne of cane in SY2010 as against Rs1,510/tonne in SY2009, a yoy
increase of 50%. BRCM further booked losses of Rs9/kg (on revised levy price of MF / Banks / Indian Fls 25.0
Rs18/kg) because of higher levy quota sales. FII / NRIs / OCBs 19.7
Indian Public / Others 17.5
Outlook and valuation: Going ahead, sugar prices are likely to be under pressure
due to higher-than-expected sugar production in India and Brazil. Domestic ex-
mill prices have corrected from the highs of Rs42/kg to Rs28–29/kg, while the Abs. (%) 3m 1yr 3yr
cost of inventory is at Rs28/kg. Thus, we estimate most sugar companies to break Sensex 3.3 17.1 17.9
even or record miniscule losses at net level over the next three months. At current BRCM (3.0) (27.5) 15.2
levels, the stock is trading at fair valuations of 1.5x P/B and 1.3x enterprise
value/invested capital on SY2011E estimates. Hence, we maintain our Neutral
view on the stock.
Key financials (Consolidated)
Y/E September (Rs cr) SY2008 SY2009 SY2010E SY2011E
Net sales 1,491 1,747 2,195 3,146
% chg 6.9 17.2 25.6 43.4
Net profit 78 209 115 292
% chg - 167.4 (45.2) 154.7
EBITDA (%) 21.1 25.6 15.2 17.7
EPS (Rs) 3.1 8.2 4.5 11.4
P/E (x) 26.0 9.8 17.8 7.0
P/BV (x) 2.0 1.8 1.7 1.5
RoE (%) 8.4 19.6 9.8 22.5
RoCE (%) 7.6 13.2 9.1 17.5
EV/Sales (x) 2.3 1.6 1.3 0.9
EV/EBITDA (x) 10.8 6.4 8.9 5.1 Sageraj Bariya
EV/IC (x) 1.4 1.5 1.4 1.3 40403800 extn 346
sageraj.bariya@angeltrade.com
Source: Company, Angel Research
Please refer to important disclosures at the end of this report 1
2. Balrampur Chini Mills | 3QSY2010 Result Update
Exhibit 1: Quarterly performance
Y/E September (Rs cr) 3QSY2010 3QSY2009 % chg 9MSY10 9MSY09 % chg
Net sales 540 538 0.4 1474 1325 11.3
Consumption of RM 428 375 1004 771
(% of sales) 79 70 68 58
Gross profit 112 163 (31.2) 470 554 (15.2)
Gross margin (%) 20.7 30.3 (955)bp 31.9 41.8
Staff costs 21 23 77 67
(% of sales) 3.9 4.2 5.2 5.1
Other expenses 27 10 119 110
(% of sales) 5.0 1.9 8.0 8.3
Total expenditure 476 408 1199 948
(% of sales) 88.1 75.8 81.4 71.5
EBITDA 64 130 (50.7) 274 377 (27.2)
EBITDA % 11.9 24.2 18.6 28.5
Depreciation 28 27 5.0 84 81 3.5
EBIT 36 103 191 296
EBIT % 6.7 19.2 12.9 22.3
Other income 0 0 41.2 3 1 214.0
Interest 25 24 5.0 67 78 (14.0)
PBT (excl. extr. items) 12 80 (85.5) 126 218 (42.3)
Extr. income/(expense) 0 0 0 0
PBT (incl. extr. items) 12 80 126 218
Provision for taxation 0 14 20 35
(% of PBT) 3.7 17.0 15.5 15.9
Reported PAT 11 66 (83.2) 106 184 (42.1)
NPM (%) 2.1 12.3 7.2 13.9
Minority & others 0.0 0.0 0.0 0.0
Adj PAT 11.1 66.3 (83.2) 106.5 183.8 (42.1)
Adj NPM (%) 2.1 12.3 7.2 13.9
Equity capital 26 26 26 26
EPS 0.4 2.6 (83.5) 4.1 7.2 (42.9)
Adj EPS 0.4 2.6 (83.5) 4.1 7.2 (42.9)
Source: Company, Angel Research
Lower volume, declining key product prices lead to flat top line
BRCM posted net sales of Rs540cr in 3QSY2010 as against Rs538cr in
3QSY2009. The flat top line was on account of lower sugar volumes and a
decline in the distillery division’s realisations. Sugar volume for the quarter fell
by 18.6% to 0.17mn tonnes, while realisations for the distillery division
witnessed a decline of 15.3% to Rs21.9.
July 28, 2010 2
3. Balrampur Chini Mills | 3QSY2010 Result Update
Exhibit 2: Sugar volume trend Exhibit 3: Sugar realisation trend
0.25 35
32 32
0.20
0.20 30
(mn tonnes)
28
(Rs/kg)
0.17
26
0.15 0.14 25
0.13 23
0.11
0.10 20
3QSY09 4QSY09 1QSY10 2QSY10 3QSY10 3QSY09 4QSY09 1QSY10 2QSY10 3QSY10
Source: Company, Angel Research Source: Company, Angel Research
Distillery realisations witnessed a 15% decline during the quarter to Rs22/litre from
Rs26/litre. The higher inventory build-up and subsequent liquidation led to a
decline in realisations. Management expects the same to revert to the previous
level once the ethanol project is implemented successfully.
Exhibit 4: Distillery volume trend Exhibit 5: Distillery realisation trend
18 30
28
14 13 27
28
12
12 26 26
(Rs/litre)
9 26
(mn litres)
24
6
4 22
22
0 20
3QSY09
4QSY09
1QSY10
2QSY10
3QSY10
3QSY09
4QSY09
1QSY10
2QSY10
Source: Company, Angel Research Source: Company, Angel Research 3QSY10
High raw-material costs and contribution of levy sales impact margin: BRCM’s
gross margin fell by a substantial 955bp to 20.7% in 3QSY2010 from 30.3%
in 2QSY2009. Margin was hit due to increased cane costs and higher
contribution of levy sales. The company incurred Rs2,260/tonne of cane in
SY2010 as against Rs1,510/tonne in SY2009, an increase of 50% yoy. Cane
prices were driven by high demand from mill operators, as sugar prices kept
increasing, while the area under cane cultivation declined during the season.
Levy quota (sale to PDS) increased to 20% in SY2010 from 10% in SY2009
because of the shortage in sugar production. During the quarter, levy sugar
was sold at a fixed price of Rs18/kg (revised price), which led to a loss of
Rs9/kg to the company.
July 28, 2010 3
5. Balrampur Chini Mills | 3QSY2010 Result Update
Key Takeaways from the conference call
• Management expects the government to restore customs duty on imported
white sugar, which could support any further decline in sugar prices from
here on.
• Brazil’s current production is down from its peak production level and
Thailand is undergoing a drought situation. Hence, sugar demand is likely
to see a revival, thereby strengthening prices.
• The industry has not received any fresh sugar import contract, instead it
has witnessed a few cancellations.
• Management expects the closing stock for SY2010 season to be in excess
of five million tonnes.
July 28, 2010 5
6. Balrampur Chini Mills | 3QSY2010 Result Update
Investment Arguments
Domestic sugar supply easing
India's sugar production is estimated to have increased by 27% to
18.5mn–19mn tonnes in SY2010E as against 14.6mn tonnes in SY2009. This was
on account of higher drawal rate of 65% against 53% witnessed last year, as mills
offered higher compensation to farmers compared to the unorganised sector.
Cane realisations for farmers in the current rally have increased by 73% to
Rs2,600/tonne, while they moved up 18% in SY2004, 7% in SY2005 and 10% in
SY2006. In anticipation of this positive trend extending, an increasing number of
farmers are expected to switch over to cane cultivation, thus resulting in the area
under cane cultivation to once again hit the SY2007 peak level of 5.2mn hectares
(mn ha) in SY2011E.
Exhibit 8: Sugar cane and sugar production estimate
Sugar cane production SY2004 SY2005 SY2006 SY2007 SY2008 SY2009 SY2010E SY2011E
Area under cane (mn ha) 3.9 3.7 4.2 5.2 5.0 4.4 4.3 5.2
% yoy (12.9) (7.0) 14.7 22.6 (2.9) (12.1) (3.3) 22.4
Cane production (mn tonnes) 233.9 237.1 281.2 355.5 341.0 272.5 293.3 338.0
Yield per hectare (tonnes) 59.4 64.8 66.9 69.0 68.2 62.0 69.0 65.0
Drawal (%) 57% 53% 67% 78% 73% 53% 65% 78%
Total cane crushed (mn tonnes) 132.5 124.8 188.7 278.9 250.0 145.0 191.0 263.6
Sugar prod. (mn tonnes) 13.5 12.7 19.3 28.3 26.3 14.6 18.5 26.7
Avg. recovery (%) 10.2 10.2 10.2 10.2 10.5 10.1 9.7 10.1
Sugar production
mn tonnes
Opening stock 12.4 8.2 4.5 3.4 9.8 8.1 4.4 4.4
Production 13.5 12.7 19.3 28.3 26.3 14.6 18.5 26.7
Domestic consumption 17.9 18.5 19.3 20.2 22.5 22.5 23.1 23.6
% yoy 3.4 4.3 4.7 11.4 0.0 2.5 2.5
Exports 0.2 0.0 1.1 1.7 4.8 0.0 0.0 0.0
Imports 0.4 2.1 0.0 0.0 0.0 4.2 4.6 0.0
Closing stock 8.2 4.5 3.4 9.8 8.8 4.4 4.4 7.5
Closing stock (months) 5.5 2.9 2.1 5.8 4.7 2.3 2.3 3.8
Stock-to-use ratio 46% 24% 18% 49% 39% 20% 19% 32%
Source: Industry, Company, Angel Research
Given the increasing number of farmers switching to cane cultivation, sugarcane
supply is further likely to ease in SY2011E. This would result in cane realisations
turning unattractive from the unorganised sector and will force famers to shift over
to mills for better realisations. Hence, we expect the drawal rate to once again hit
the SY2007 peak level of 78% in SY2011E, resulting in total sugar production of
26.7mn tonnes. Moreover, with consumption likely to be 24mn tonnes in
SY2011E, India would end the year with an overall inventory of 7.5mn tonnes,
equivalent to 3.8 months of consumption and an improvement over SY2010.
July 28, 2010 6
7. Balrampur Chini Mills | 3QSY2010 Result Update
Power to cushion profit decline during the down cycle
BRCM’s diversified revenue stream is led by external co-generation power sales.
The company entered the power segment in 2003, much ahead of competitors
such as BJH, which entered the segment in SY2008. While BRCM has total
installed capacity of 180MW, with saleable surplus of 126MW (70% of total
installed capacity), BJH has installed capacity of 428MW with saleable surplus of
105MW (25% of total installed capacity). Operational performance of the division
is also set to improve on the back of the estimated spike in volumes by 101% in
SY2011E. Thus, the division’s contribution to the company’s overall revenue is
expected to increase from 12% in SY2010E to 14% in SY2011E.
SY2011 to be better than SY2010
In SY2010, the sugar industry witnessed extreme sugar prices, both at the high and
low ends. Thus, we believe SY2011 to be a recovery phase for the industry. Mill
operators are likely to be more rational while deciding on cane prices. Cane prices
are likely to be in the current SAP range of Rs1600–1700/tonne, leading to sugar
prices dropping to Rs24/kg from the current level of Rs28/kg.
Going forward, we expect integrated players such as BRCM to benefit as (1) higher
cane availability and lower cane prices would lead to higher utilisation levels (95%)
and (2) power revenue would receive a huge leg up due to higher cane crushing.
We expect BRCM’s financials to improve strongly in SY2011, with RoE improving to
22.5% from 9.8% in SY2010.
Outlook and Valuation
BRCM’s 3QSY2010 performance was below our expectation. Going ahead, sugar
prices are likely to be under pressure because of higher-than-estimated sugar
production in India and Brazil. Hence, sugar demand-supply would achieve a
balance in SY2011E, resulting in further softening of prices. Domestic ex-mill
prices have corrected from the high of Rs42/kg to Rs28–29/kg, while inventory is
in the range of Rs26–27/kg. Thus, we estimate most sugar companies to break
even or record miniscule losses at the net level over the next six months.
We have marginally revised our SY2011E estimates because of the likely
improvement in the company’s balance sheet at the end of SY2010. At the current
level of Rs79, the stock is trading at 1.5x P/BV and 1.3x enterprise value/invested
capital on SY2011E estimates, near its fair valuations. Hence, we maintain our
Neutral view on the stock.
Exhibit 9: Change in estimates
Old New % change
Parameters (Rs cr) SY2010 SY2011 SY2010 SY2011 SY2010 SY2011
Sales 2477 3121 2195 3146 (11) 1
EBITDA 458 565 333 558 (27) (1)
EBITDA margin (%) 18.5 18.1 15.2 17.7
PAT 201 282 115 292 (43) 4
Source: Company, Angel Research
July 28, 2010 7
13. Balrampur Chini Mills | 3QSY2010 Result Update
Research Team Tel: 022 - 4040 3800 E-mail: research@angeltrade.com Website: www.angeltrade.com
DISCLAIMER
This document is solely for the personal information of the recipient, and must not be singularly used as the basis of any investment
decision. Nothing in this document should be construed as investment or financial advice. Each recipient of this document should make
such investigations as they deem necessary to arrive at an independent evaluation of an investment in the securities of the companies
referred to in this document (including the merits and risks involved), and should consult their own advisors to determine the merits and
risks of such an investment.
Angel Broking Limited, its affiliates, directors, its proprietary trading and investment businesses may, from time to time, make
investment decisions that are inconsistent with or contradictory to the recommendations expressed herein. The views contained in this
document are those of the analyst, and the company may or may not subscribe to all the views expressed within.
Reports based on technical and derivative analysis center on studying charts of a stock's price movement, outstanding positions and
trading volume, as opposed to focusing on a company's fundamentals and, as such, may not match with a report on a company's
fundamentals.
The information in this document has been printed on the basis of publicly available information, internal data and other reliable
sources believed to be true, but we do not represent that it is accurate or complete and it should not be relied on as such, as this
document is for general guidance only. Angel Broking Limited or any of its affiliates/ group companies shall not be in any way
responsible for any loss or damage that may arise to any person from any inadvertent error in the information contained in this report.
Angel Broking Limited has not independently verified all the information contained within this document. Accordingly, we cannot testify,
nor make any representation or warranty, express or implied, to the accuracy, contents or data contained within this document. While
Angel Broking Limited endeavours to update on a reasonable basis the information discussed in this material, there may be regulatory,
compliance, or other reasons that prevent us from doing so.
This document is being supplied to you solely for your information, and its contents, information or data may not be reproduced,
redistributed or passed on, directly or indirectly.
Angel Broking Limited and its affiliates may seek to provide or have engaged in providing corporate finance, investment banking or
other advisory services in a merger or specific transaction to the companies referred to in this report, as on the date of this report or in
the past.
Neither Angel Broking Limited, nor its directors, employees or affiliates shall be liable for any loss or damage that may arise from or in
connection with the use of this information.
Note: Please refer to the important `Stock Holding Disclosure' report on the Angel website (Research Section). Also, please
refer to the latest update on respective stocks for the disclosure status in respect of those stocks. Angel Broking Limited and
its affiliates may have investment positions in the stocks recommended in this report.
Disclosure of Interest Statement Balrampur Chini Mills
1. Analyst ownership of the stock No
2. Angel and its Group companies ownership of the stock Yes
3. Angel and its Group companies' Directors ownership of the stock No
4. Broking relationship with company covered No
Note: We have not considered any Exposure below Rs 1 lakh for Angel, its Group companies and Directors.
Ratings (Returns) : Buy (> 15%) Accumulate (5% to 15%) Neutral (-5 to 5%)
Reduce (-5% to 15%) Sell (< -15%)
July 28, 2010 13