1. MARKET UPDATE
India | Financials | 26-November-2012
Accounting & corporate governance AMBER
Franchise Strength AMBER
Manappuram Finance Earnings Momentum AMBER
Worst is priced in BUY 25% upside
Fair Value Rs44.54
Manappuram is a story which went badly wrong, from a high growth
sector with >25% ROE and enterprising management, to a declining Bloomberg ticker MGFL IN
loan book, falling ROE, a more hostile regulatory environment and Share Price Rs35.65
Market Capitalisation Rs29,985.33m
concerns raised around governance. But with the stock trading at a Free Float 55%
discount to book and our expectation of the loan book growing
from hereon, we think the stock merits another look. Our industry INR m Y/E 31-Mar 2011A 2012A 2013E 2014E
NII 8,335 15,264 14,166 15,353
sources suggest regulatory clarity will be received this calendar Total Income 8,496 15,667 14,610 15,819
year, after which we expect the stock to start to re-rate. We Staff Cost 1,605 3,090 3,466 3,468
upgrade our stand to BUY and increase our fair value from Rs39 to Other operating costs 2,439 3,322 3,482 3,879
Total operating costs 4,044 6,413 6,948 7,347
Rs45, 25% upside.
PBT 4,239 8,772 7,179 7,989
PAT 2,827 5,915 4,810 5,353
EPS 3.4 7.0 5.7 6.4
Regular source of disappointment
Y/E 31-Mar 2011A 2012A 2013E 2014E
Manappuram has been a regular source of disappointment for the market over P/E (x) 10.5 5.1 6.2 5.6
P/BV (x) 1.5 1.3 1.1 0.9
the past 12+ months, with the company in news for all the wrong reasons
ROA (%) 6% 6% 4% 4%
(from regulatory to governance). The recent disappointment on NIMs ROE (%) 22% 27% 19% 18%
(declined 250bps QoQ) was yet another blow to the stock, leading to it falling Dividend Yield (%) 2% 4% 2% 4%
>10% in the last month. All this has led to it trading at a 50% discount to its
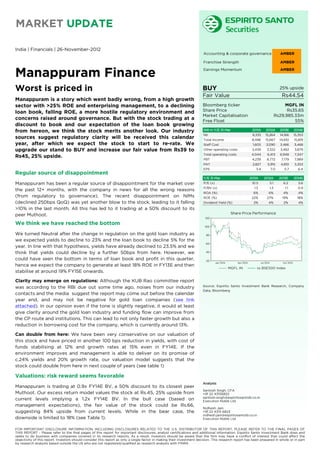
Share Price Performance
peer Muthoot.
120
We think we have reached the bottom 100
We turned Neutral after the change in regulation on the gold loan industry as 80
we expected yields to decline to 23% and the loan book to decline 5% for the
60
year. In line with that hypothesis, yields have already declined to 23.5% and we
think that yields could decline by a further 50bps from here. However, we 40
could have seen the bottom in terms of loan book and profit in this quarter, 20
Jan 2012 Apr 2012 Jul 2012 Oct 2012
hence we expect the company to generate at least 18% ROE in FY13E and then
MGFL IN vs BSE500 Index
stabilise at around 19% FY15E onwards.
Clarity may emerge on regulations: Although the KUB Rao committee report
Source: Espirito Santo Investment Bank Research, Company
was according to the RBI due out some time ago, noises from our industry
Data, Bloomberg
contacts and the media suggest the report may come out before the calendar
year end, and may not be negative for gold loan companies (see link
attached). In our opinion even if the tone is slightly negative, it would at least
give clarity around the gold loan industry and funding flow can improve from
the CP route and institutions. This can lead to not only faster growth but also a
reduction in borrowing cost for the company, which is currently around 13%.
Can double from here: We have been very conservative on our valuation of
this stock and have priced in another 100 bps reduction in yields, with cost of
funds stabilising at 12% and growth rates at 15% even in FY14E. If the
environment improves and management is able to deliver on its promise of
c.24% yields and 20% growth rate, our valuation model suggests that the
stock could double from here in next couple of years (see table 1)
Valuations: risk reward seems favorable
Analysts
Manappuram is trading at 0.9x FY14E BV, a 50% discount to its closest peer
Santosh Singh, CFA
Muthoot. Our excess return model values the stock at Rs.45, 25% upside from +91 22 43156822
santosh.singh@espiritosantoib.co.in
current levels implying a 1.2x FY14E BV. In the bull case (based on Execution Noble Ltd
management expectations), the fair value of the stock could be Rs.66,
Nidhesh Jain
suggesting 84% upside from current levels. While in the bear case, the +91 22 4315 6823
nidhesh.jain@espiritosantoib.co.in
downside is limited to 18% (see Table 1). Execution Noble Ltd
FOR IMPORTANT DISCLOSURE INFORMATION, INCLUDING DISCLOSURES RELATED TO THE U.S. DISTRIBUTOR OF THIS REPORT, PLEASE REFER TO THE FINAL PAGES OF
THIS REPORT - Please refer to the final pages of this report for important disclosures, analyst certifications and additional information. Espirito Santo Investment Bank does and
seeks to do business with companies covered in its research reports. As a result, investors should be aware that the firm may have a conflict of interest that could affect the
objectivity of this report. Investors should consider this report as only a single factor in making their investment decision. This research report has been prepared in whole or in part
by research analysts based outside the US who are not registered/qualified as research analysts with FINRA (v1.0.5.2)
2. Table 1 Scenario analysis
Bull Case
Base Case (Management
Bear Case (Our expectations) expectations)
23.5% for FY13,
23% for FY13, 23% for FY14,
23.5% for FY13,
Yields 22% FY14 onwards 22.5% FY15 onwards
23% FY14 onwards
12.3% in FY13,
12.50% in FY13, 12.3% in FY13 and 12% 12% FY14
Cost of funds 12,25% FY14 onwards FY14 onwards 11.75% FY15 onwards
3% in FY13, 4% in FY13,
0% in FY13, 15% in FY14 & FY14, 20% in FY14 & FY14,
Loan book growth 10% in FY14 onwards 12.5% FY14 onwards 15% FY14 onwards
Fair Value 27 45 66
FY14E P/B 0.81 1.25 1.83
Upside/Downside -23% 25% 84%
Source: Espirito Santo Investment Bank Research, Company Data
Figure 1 Old vs New
Old New % Change
Rs mn FY13 FY14 FY13 FY14 FY13 FY14 Comments
AUM declined due to no assignments
AUM 119,310 137,206 119,488 137,411 0% 0% going forward
YoY Growth -15% 15% 3% 15%
Loan Book 108,464 124,733 119,488 137,411 10% 10%
YoY Growth -11% 15% 23% 15%
Interest income has declined due to
Interest Income 27,284 26,351 26,700 29,543 -2% 12% reduction in yields
We have reduced our Yield
expectation for H2 to 23%.
Yield 24.0% 23.0% 23.5% 23.0% Management has guided 24%.
We have increased the cost of
borrowings and growth expectations
Financial costs 12,462 11,179 12,533 14,190 1% 27% for FY14
We have increased our FY12 cost of
Cost of borrowings 12.0% 11.0% 12.3% 12.0% borrowing by 200bps
NII 15,000 15,358 14,610 15,819 -3% 3%
Marginally lower yield together with
higher borrowing costs meant that our
NIM 13.0% 12.5% 12.4% 12.3% FY14 NIM decreased by 30bps
Operating profit 7,572 7,663 7,677 8,561 1% 12%
Operating margin 51% 51% 54% 56%
Operating Cost/AUM 2.9% 3.0% 2.9% 3.0%
We expect the personnel cost to
reduce due to higher loan book growth
Personnel Cost/AUM 2.8% 3.0% 2.9% 2.7% expectations.
Net Profit 4,964 4,896 4,810 5,353 -3% 9%
EPS 6.0 5.9 5.7 6.4
Source: Espirito Santo Investment Bank Research, Company Data
Page 2 of 8
3. Valuation Methodology
We have used excess return on equity method to calculate the fair value of Manappuram Finance, using a cost of equity of 16%. Our
model is a two stage model with a time horizon of twenty years, first ten years of explicit forecast and next ten years of declining RoEs
to CoEs on a straight line basis.
Figure 2 Valuation methodology disclosures for Manappuram Finance
Manappuram Finance excess return on equity calculation
Cost of Equity 16.0%
Shares in Issue 841
Rs. Mn Rs./share
Free cash flow to equity NPV 37,461 45
Rs. Mn Mar-13 Mar-14 Mar-15 Mar-16 Mar-17 Mar-18 Mar-19 Mar-20 Mar-21 Mar-22 Mar-23 Mar-24 Mar-25 Mar-26 Mar-27 Mar-28 Mar-29 Mar-30 Mar-31 Mar-32
Beginning book Value 23,810 27,783 31,584 35,373 39,799 44,970 50,995 58,008 66,137 75,441 86,159 99,864 115,316 132,658 152,033 173,577 197,420 223,682 252,466 283,858
Net Profit 4,810 5,353 5,812 6,789 7,931 9,241 10,755 12,468 14,270 16,437 18,274 20,603 23,123 25,833 28,725 31,791 35,016 38,379 41,856 45,417
Cost of Equity 3,810 4,445 5,053 5,660 6,368 7,195 8,159 9,281 10,582 12,071 13,785 15,978 18,451 21,225 24,325 27,772 31,587 35,789 40,395 45,417
ROAE 20% 19% 18% 19% 20% 21% 21% 21% 22% 22% 21% 21% 20% 19% 19% 18% 18% 17% 17% 16%
Excess Return 1,000 907 758 1,129 1,563 2,045 2,596 3,187 3,689 4,367 4,489 4,624 4,673 4,607 4,400 4,019 3,428 2,590 1,461 -
Discount Factor 1.0 0.8 0.7 0.6 0.5 0.5 0.4 0.3 0.3 0.2 0.2 0.2 0.2 0.1 0.1 0.1 0.1 0.1 0.1 0.1
Present Value 950 743 536 688 821 926 1,013 1,072 1,069 1,091 967 859 748 636 524 412 303 197 96 -
Source: Espirito Santo Investment Bank Research, Company Data
Figure 3 Relative Valuation NBFCs
CMP Mar. Cap Mar. Cap RoA RoE P/E P/B
HFCs Rating Fair Value (Rs) (Rs) (Rs bn) ($mn) FY13E FY14E FY13E FY14E FY13E FY14E FY13E FY14E
HDFC NEUTRAL 838 778 1,089 21,781 2.5% 2.5% 23% 23% 25 21 5.2 4.5
LICHF BUY 308 245 113 2,252 1.4% 1.5% 18% 20% 11 9 1.9 1.6
DHFL BUY 287 190 20 404 1.4% 1.4% 19% 20% 5 5 1.0 0.8
1.8% 1.8% 20% 21% 14 11 2.7 2.3
CMP Mar. Cap Mar. Cap RoA RoE P/E P/B
NBFCs Rating Fair Value (Rs) (Rs) (Rs bn) ($mn) FY13E FY14E FY13E FY14E FY13E FY14E FY13E FY14E
MMFS NOT RATED 994 94 1,879 3.4% 3.3% 24% 23% 13 11 2.8 2.3
SUF NOT RATED 977 49 986 3.0% 3.1% 20% 20% 13 11 2.4 2.1
MGFL BUY 45 36 27 545 3.9% 3.8% 19% 18% 6.3 5.7 1.1 1.0
Muthoot NOT RATED 205 69 1,388 3.5% 3.2% 29% 25% 8 7 2.0 1.6
SHTF BUY 681 630 130 2,594 3.4% 3.3% 21% 21% 10 9 2.0 1.7
LTFH BUY 64 75 117 2,337 1.9% 2.0% 13% 15% 20 15 2.4 2.1
3.2% 3.1% 21% 20% 12 10 2.1 1.8
Source: Espirito Santo Investment Bank Research, Company Data
Page 3 of 8
4. Risks to Fair Value
The KUB Rao committee’s recommendations are still awaited and could
present a significant risk to our fair value on either side. Secondly, we assume
constant gold prices in our model and if gold prices decline from current
levels, then loan book growth could be lower than our expectations.
Table 9 Traffic Lights: criteria for judgement
Parameter Traffic signal Reasons
Accounting & We did not find any red flag in the accounting practices used by the company. However, we are assigning
governance AMBER Manappuram an AMBER rating due to a combination of a) poor communication with the market by the
management in the past; and b) acceptance of deposits from promoter entity through MGFL’s branch.
Franchise The company has a strong branch network with more than 2600 branches in India. It has a very strong
strength AMBER presence in South and West India. However, with recent regulations, the operating environment has
deteriorated significantly leading to a decline in franchise strength.
Earnings We see room for consensus downgrades due to recent disappointment in NIMs.
momentum AMBER
Source: Espirito Santo Investment Bank Research for estimates
Page 4 of 8
6. Manappuram MGFL IN
Buy Trading Buy Neutral Trading Sell Sell Restricted Dropped Coverage
S
90
80
70
B
60 B
B
50
40
N
30
20
Nov-09 Feb-10 May-10 Aug-10 Nov-10 Feb-11 May-11 Aug-11 Nov-11 Feb-12 May-12 Aug-12 Nov-12
Report date Recommendation Fair value Share price
2012 April 19 Neutral Rs39.00 Rs31.00
2011 November 8 Buy Rs80.00 Rs61.00
September 26 Buy Rs70.00 Rs54.00
February 17 Buy Rs140.00 Rs62.20
2010 November 24 Sell Rs160.00 Rs178.00
Source: Bloomberg, Espirito Santo Investment Bank Research
Please visit our website at www.EspiritoSantoIB.co.uk for up to date recommendation charts.
Page 6 of 8
7. IMPORTANT DISCLOSURES
101112
This report was prepared by Espírito Santo Investment Bank Research, a global brand name for the equity research teams of Banco Espírito Santo de Investimento, S.A., with headquarter
in Lisbon, Portugal, of its Branches in Spain and Poland and of its affiliates BES Securities do Brasil, S.A – Corretora de Câmbio e Valores Mobiliários, in Brazil, and Execution Noble
Limited, in the United Kingdom, all authorized to engage in securities activities according to each domestic legislation. All of these entities are included within the perimeter of the
Financial Group controlled by Espírito Santo Financial Group S.A. (“Banco Espírito Santo Group”).
Analyst Certification
Each research analyst primarily responsible for the content of this research report, in whole or in part, certifies that with respect to each security or issuer that the analyst covered in this
report: (1) all of the views expressed accurately reflect his or her personal views about those securities or issuers; the issuers were not previously informed about the content of the
recommendation included in this research report and the assumptions were not validated by the issuers; (2) no part of his or her compensation is directly or indirectly related to: (a) the
specific recommendations or views expressed by that research analyst in the research report; and/or (b) any services provided or to be provided by Banco Espírito Santo de
Investimento, S.A. and/or by any of its affiliates to the issuer of the securities under recommendation. Moreover, each of the analysts hereby certifies that he or she has no economic or
financial interest whatsoever in the companies subject to his or her opinion and does not own or trade any securities issued by the latter.
Ratings Distribution
Espirito Santo Investment Bank Research hereby provides the distribution of the equity research ratings in relation to the total Issuers covered and to the investment banking
clients as of end of September 2012.
Explanation of Rating System Ratings Distribution
12-MONTH RATING DEFINITION Total Investment Banking Clients
As at end September 2012 Total ESIB Research
(IBC)
BUY Analyst expects at least 10% upside potential to fair
value, which should be realized in the next 12 months Recommendation Count % of Total Count % of IBC % of Total
12 Month Rating:
NEUTRAL Analyst expects upside/downside potential of between
Buy 227 47.5% 22 62.9% 4.6%
+10% and -10% to fair value, which should be realized in
the next 12 months
Neutral 170 35.6% 11 31.4% 2.3%
SELL Analyst expects at least 10% downside potential to fair Sell 81 16.9% 2 5.7% 0.4%
value, which should be realized in the next 12 months
Restricted 0 0.0% 0 0.0% 0.0%
Under Review 0 0.0% 0 0.0% 0.0%
TRADING RATING DEFINITION Trading Rating:
TRADING BUY Analyst expects a positive short-term movement in the Trading Buy 0 0.0% 0 0.0% 0.0%
share price (max duration 2 months from the time Trading
Buy is announced) and may move out of line with the fair Trading Sell 0 0.0% 0 0.0% 0.0%
value estimate during that period
TRADING SELL Analyst expects a negative short-term movement in the
share price (max duration 2 months from time Trading Total recommendations 478 100% 35 100% 7.3%
Sell is announced) and may move out of line with the fair
value estimate during that period
For further information on Rating System please see “Definitions and distribution of ratings” on: http://www.espiritosantoib-research.com.
Share Prices
Share prices are as at the close of business on the day preceding publication, unless otherwise specified.
Coverage Policy
Espírito Santo Investment Bank Research reserves the right to choose the securities it expresses opinions on. The main criteria to choose such securities are: 1) markets in which they
trade 2) market capitalisation 3) liquidity, 4) sector suitability. Espírito Santo Investment Bank Research has no specific policy regarding the frequency in which opinions and investment
recommendations are released.
Representation to Investors
Espírito Santo Investment Bank Research has issued this report for information purposes only. This material constitutes "investment research" for the purposes of the Markets in Financial
Instruments Directive and as such contains an objective or independent explanation of the matters contained in the material.
Any recommendations contained in this document must not be relied upon as investment advice based on the recipient's personal circumstances. This report is not, and should not be
construed as an offer or a solicitation to buy or sell any securities or related financial instruments. The investment discussed or recommended in this report may be unsuitable for
investors depending on their specific investment objectives and financial position. The material in this research report is general information intended for recipients who understand the
risks associated with investment. It does not take account of whether an investment, course of action, or associated risks are suitable for the recipient. This research report does not
purport to be comprehensive or to contain all the information on which a prospective investor may need in order to make an investment decision and the recipient of this report must
make its own independent assessment and decisions regarding any securities or financial instruments mentioned herein. In the event that further clarification is required on the words or
phrases used in this material, the recipient is strongly recommended to seek independent legal or financial advice. Where an investment is denominated in a currency other than the
investor’s currency, changes in rates of exchange may have an adverse effect on the value, price of, or income derived from the investment. Past performance is not necessarily a guide to
future performance. Income from investments may fluctuate. The price or value of the investments to which this report relates, either directly or indirectly, may fall or rise against the
interest of investors. Any recommendation and opinion contained in this report may become outdated as a consequence of changes in the environment in which the issuer of the
securities under analysis operates, in addition to changes in the estimates and forecasts, assumptions and valuation methodology used herein. The securities mentioned in this publication
may not be eligible for sale in some states or countries.
All the information contained herein is based upon information available to the public and has been obtained from sources believed to be reliable. However, Espírito Santo Investment
Bank Research does not guarantee the accuracy or completeness of the information contained in this report. The opinions expressed herein are Espírito Santo Investment Bank Research
present opinions only, and are subject to change without prior notice. Espírito Santo Investment Bank Research is not under any obligation to update or keep current the information and
the opinions expressed herein nor to provide the recipient with access to any additional information.
Espírito Santo Investment Bank Research has not entered into any agreement with the issuer relating to production of this report. Espírito Santo Investment Bank Research does not
accept any form of liability for losses or damages which may arise from the use of this report or its contents.
Ownership and Material Conflicts of Interest
Banco Espírito Santo de Investimento, S.A. and/or its Affiliates (including all entities within Espírito Santo Investment Bank Research) and/or their directors, officers and employees, may
have, or have had, interests or qualified holdings on issuers mentioned in this report. Banco Espírito Santo de Investimento, S.A. and/or its Affiliates may have, or have had, business
relationships with the companies mentioned in this report. However, the research analysts may not purchase or sell securities or have any interest whatsoever in companies subject to
their opinion.
Banco Espírito Santo Group has a qualified shareholding (1% or more) in EDP, Portugal Telecom and ZON Multimédia. Portugal Telecom has either a direct or indirect qualified
shareholding (2% or more) in Banco Espírito Santo, S.A. and Lloyds Banking Group has a shareholding of 3.3% in Espírito Santo Investment Holdings Limited. Bradesco has an indirect
qualified shareholding (4.8%) in Banco Espírito Santo, S.A. and has a direct qualified shareholding (20%) in BES Investimento do Brasil, S.A., the parent company of BES Securities do
Brasil S.A. CCVM.
BES Securities do Brasil S.A. CCVM does not hold a direct or indirect stake in the capital of the company (companies) that are subject of analysis(es)/recommendation(s) in this report,
but the Banco Espírito Santo Group within which it is inserted, holds, directly and in some cases indirectly, 1% or more of the equity securities of Bradesco. With the exception of the
company mentioned before, BES Securities do Brasil S.A. CCVM does not hold direct or indirect stakes in the capital of the other companies that are subject of
analysis(es)/recommendations in this report, and it was not involved in the acquisition, alienation and intermediation of securities issued by these companies in the market. Pursuant to
Polish Ministry of Finance regulations, we inform that Banco Espírito Santo Group companies and/or Banco Espírito Santo de Investimento, S.A. Branch in Poland do not have a qualified
shareholding in the Polish Securities Issuers mentioned in this report higher than 5% of its total share capital.
Mr. Ricardo Espírito Santo Silva Salgado, the CEO of Banco Espírito Santo, S.A. and Chairman of Banco Espírito Santo de Investimento, S.A., is a board member of Bradesco since June
2003. The Chief Executive Officer of Banco Espírito Santo de Investimento, S.A., Mr. José Maria Ricciardi, is a member of EDP’s General and Supervisory Board. Mr. Rafael Valverde, a
member of the board of Banco Espírito Santo de Investimento, S.A., is a non-executive board member of EDP Renováveis. Mr. Ricardo Abecassis Espírito Santo Silva, a member of the
board of Banco Espírito Santo de Investimento, S.A., is a board member of Brazil Hospitality Group.
Banco Espírito Santo de Investimento, S.A and/or its subsidiaries are liquidity providers for Altri.
Banco Espírito Santo de Investimento, S.A. and/or its subsidiaries participate or have participated as a syndicate member in share offerings of ACM Shipping Plc, Banco do Brasil, BR
Malls, Brazil Hospitality Group, Burford Capital, EDP Energias do Brasil, Fibria Celulose, Gerdau, HRT, IQE plc, Julio Simões, Metal Gerdau, PDG Realty, Petrobras, Santander, Sonae, Sonae
Sierra, Suzano Papel e Celulose and Tecnisa in the last 12 months.
Page 7 of 8
8. Banco Espírito Santo de Investimento, S.A. and/or its subsidiaries participate or have participated as a syndicate member in the bond issues of the following companies: Abengoa,
Bradesco, Cemig, EDP, Julio Simões, Kredyt Inkaso, Oi, Portugal Telecom, Semapa and ZON Multimédia in the last 12 months.
Banco Espírito Santo de Investimento, S.A. and/or its subsidiaries provided investment banking services to the following companies: Abertis, Acciona, ACM Shipping, ACS, AGA
Rangemaster Group, Altri, Ambev, Banco do Brasil, BBVA, BR Malls, Bradesco, Brazil Hospitality Group, Burford Capital, Cemig, Copel, Dinamia, EDP, EDP Energias do Brasil, EDP
Renováveis, Endesa, Ferrovial, Fibria Celulose, Flybe Group Plc, Gerdau, Grupa Lotos, HRT, Ibersol, ImmuPharma, Impax Asset Management Group, Inditex, IQE, Jerónimo Martins, Kredyt
Inkaso, Metal Gerdau, Mota-Engil, Novae Group Plc, OHL, Oi, PDG Realty, Petrobras, PKO, Portugal Telecom, REN, Rovi, Sacyr Vallehermoso, Santander, Semapa, Shaftesbury Plc, Sonae,
Sonaecom, Suzano Papel e Celulose, SVG Capital, Tecnisa, Ted Baker, The Local Shopping REIT Plc, Tim, Workspace Group Plc and ZON Multimédia in the last 12 months.
Banco Espírito Santo Group has been a partner to Mota-Engil in the infrastructure business in Portugal and other countries. Mota-Engil and Banco Espírito Santo Group, through ES
Concessões, S.G.P.S., S.A., have created a joint holding company – Ascendi – for all stakes in transportation infrastructure concessions, in Portugal and abroad. Banco Espírito Santo de
Investimento, S.A. provided, or continues to provide, investment banking services to Ascendi.
Banco Espírito Santo de Investimento, S.A. and/or its subsidiaries do and seek to provide investment banking or other services to the companies referred to in this research report. As a
result, investors should be aware that a conflict of interest may exist.
Market Making UK
Execution Noble Limited is a Market Maker in companies covered and may sell to or buy from customers as principal in certain financial instruments listed or admitted to listing on the
London Stock Exchange. For information on Companies to which Execution Noble Limited is a Market Maker please see “UK Market Making” on http://www.espiritosantoib-research.com.
Confidentiality
This report cannot be reproduced, in whole or in part, in any form or by any means, without Espírito Santo Investment Bank Research’s specific written authorization. This report is
confidential and is intended solely for the designated addressee. Therefore any disclosure, replication, distribution or any action taken in reliance on it, is prohibited and unlawful. Receipt
and/or review of this research report constitutes your agreement not to redistribute, retransmit, or disclose to others the contents, opinions, conclusion, or information contained in this
report (including any investment recommendations, estimates or price targets without first obtaining express permission from an authorized officer of Banco Espírito Santo de
Investimento, S.A.
Regulatory Authorities
For information on the identity of the Regulatory Authorities that supervise the entities included within Espírito Santo Investment Bank Research please see
http://www.espiritosantoib-research.com.
IMPORTANT DISCLOSURES FOR U.S. PERSONS
This report was prepared by Espírito Santo Investment Bank Research, a global brand name for the equity research teams of Banco Espírito Santo de Investimento, S.A., with headquarter
in Lisbon, Portugal, of its Branches in Spain and Poland and of its affiliates BES Securities do Brasil, S.A – Corretora de Câmbio e Valores Mobiliários, in Brazil, and Execution Noble
Limited, in the United Kingdom, all authorized to engage in securities activities according to each domestic legislation. Neither Banco Espírito Santo de Investimento, S.A. nor these
affiliates are registered as a broker-dealer in the United States and therefore, is not subject to U.S. rules regarding the preparation of research reports and the independence of research
analysts. This report is provided for distribution to U.S. institutional investors in reliance upon the exemption from registration provided by Rule 15a-6 of the U.S. Securities Exchange Act
of 1934, as amended.
This report is confidential and not intended for distribution to, or use by, persons other than the addressee and its employees, agents and advisors.
E.S. Financial Services, Inc. is the U.S. distributor of this report. E.S. Financial Services, Inc. accepts responsibility for the contents of this report, subject to the terms set out below, to the
extent that it is delivered to a U.S. person other than a major U.S. institutional investor. Any U.S. person receiving this report and wishing to effect securities transactions in any security
discussed in the report should do so only through E.S. Financial Services, Inc.
Contact Information
Garreth Hodgson Senior Managing Director /Head of Sales (212) 351-6054 ghodgson@espiritosantoib.com
Eva Gendell Vice President (212) 351-6058 egendell@espiritosantoib.com
James Kaloudis Executive Director (212) 351-6065 jkaloudis@espiritosantoib.com
Joy Bejasa Vice President (212) 351-6055 jbejasa@espiritosantoib.com
Lisa Gottardo Executive Director (212) 351-6060 lgottardo@espiritosantoib.com
Mike Williams Vice President (212) 351-6052 mwilliams@espiritosantoib.com
Pedro Marques Vice President (212) 351-6051 pmarques@espiritosantoib.com
Poorva Upadhyaya Assistant Vice President (212) 351-6056 pupadhyaya@espiritosantoib.com
E.S. Financial Services, Inc.
New York Branch
340 Madison Avenue, 12th Floor
New York, N.Y. 10173
Each analyst whose name appears in this report certifies the following, with respect to each security or issuer that the analyst covers in this report: (1) that all of the views expressed in
this report accurately reflect the personal views of the analyst about those securities and issuers; and (2) that no part of the compensation of the analyst was, is, or will be, directly or
indirectly, related to the specific recommendations or views expressed by the analyst in this report.
The analysts whose names appear in this report are not registered or qualified as research analysts with the Financial Industry Regulatory Authority ("FINRA") and may not be associated
persons of E.S. Financial Services, Inc. and therefore may not be subject to the applicable restrictions under FINRA Rules on communications with a subject company, public appearances
and trading securities held by a research analyst account.
Ownership and Material Conflicts of Interest
Banco Espírito Santo de Investimento, S.A. and/or its Affiliates and/or their directors, officers and employees, may have, or have had, interests or qualified holdings on issuers mentioned
in this report. Banco Espírito Santo de Investimento, S.A. and/or its Affiliates may have, or have had, business relationships with the companies mentioned in this report.
For a complete list of the covered Issuers in which Banco Espírito Santo de Investimento, S.A. or its Affiliates hold stakes in excess of 1% and for information on possible material conflicts
of interest arising from investment banking activities please see “Important disclosures for US persons” on http://www.espiritosantoib-research.com.
Receipt of Compensation
For information on Receipt of Compensation from subject Issuers please see “Important disclosures for US persons” on http://www.espiritosantoib-research.com.
Representation to Investors
Espírito Santo Investment Bank Research has issued this report for information purposes only. All the information contained therein is based upon information available to the public and
has been obtained from sources believed to be reliable. However, Espírito Santo Investment Bank Research does not guarantee the accuracy or completeness of the information
contained in this report. The opinions expressed herein are our present opinions only, and are subject to change without prior notice. Espírito Santo Investment Bank Research is not
under any obligation to update or keep current the information and the opinions expressed herein. This report is not, and should not be construed as an offer or a solicitation to buy or sell
any securities or related financial instruments. The investment discussed or recommended in this report may be unsuitable for investors depending on their specific investment objectives
and financial position. Where an investment is denominated in a currency other than the investor’s currency, changes in rates of exchange may have an adverse effect on the value, price
of, or income derived from the investment. Past performance is not necessarily a guide to future performance. Income from investments may fluctuate. The price or value of the
investments to which this report relates, either directly or indirectly, may fall or rise against the interest of investors. Any recommendation and opinion contained in this report may
become outdated as a consequence of changes in the environment in which the issuer of the securities under analysis operates, in addition to changes in the estimates and forecasts,
assumptions and valuation methodology used herein. The securities mentioned in this publication may not be eligible for sale in some states or countries. Espírito Santo Investment Bank
Research does not accept any form of liability for losses or damages which may arise from the use of this report. Please note that investing in any non-U.S. securities or related financial
instruments discussed in this research report may present certain risks. The securities of non-U.S. issuers may not be registered with the U.S. Securities and Exchange Commission or
subject to regulation in the United States. Information on such non-U.S. securities or related financial instruments may be limited. Foreign companies may not be subject to audit and
reporting standards and regulatory requirements comparable to those in the United States.
Page 8 of 8