Pooja 9892124323 : Call Girl in Juhu Escorts Service Free Home Delivery
Arbl ru2 qfy2011-251010
1. Please refer to important disclosures at the end of this report 1
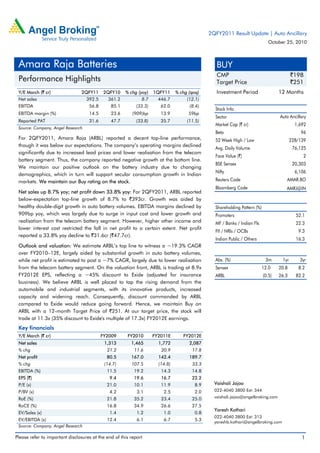
Y/E March (` cr) 2QFY11 2QFY10 % chg (yoy) 1QFY11 % chg (qoq)
Net sales 392.5 361.2 8.7 446.7 (12.1)
EBITDA 56.8 85.1 (33.3) 62.0 (8.4)
EBITDA margin (%) 14.5 23.6 (909)bp 13.9 59bp
Reported PAT 31.6 47.7 (33.8) 35.7 (11.5)
Source: Company, Angel Research
For 2QFY2011, Amara Raja (ARBL) reported a decent top-line performance,
though it was below our expectations. The company’s operating margins declined
significantly due to increased lead prices and lower realisation from the telecom
battery segment. Thus, the company reported negative growth at the bottom line.
We maintain our positive outlook on the battery industry due to changing
demographics, which in turn will support secular consumption growth in Indian
markets. We maintain our Buy rating on the stock.
Net sales up 8.7% yoy; net profit down 33.8% yoy: For 2QFY2011, ARBL reported
below-expectation top-line growth of 8.7% to `393cr. Growth was aided by
healthy double-digit growth in auto battery volumes. EBITDA margins declined by
909bp yoy, which was largely due to surge in input cost and lower growth and
realisation from the telecom battery segment. However, higher other income and
lower interest cost restricted the fall in net profit to a certain extent. Net profit
reported a 33.8% yoy decline to `31.6cr (`47.7cr).
Outlook and valuation: We estimate ARBL’s top line to witness a ~19.3% CAGR
over FY2010–12E, largely aided by substantial growth in auto battery volumes,
while net profit is estimated to post a ~7% CAGR, largely due to lower realisation
from the telecom battery segment. On the valuation front, ARBL is trading at 8.9x
FY2012E EPS, reflecting a ~45% discount to Exide (adjusted for insurance
business). We believe ARBL is well placed to tap the rising demand from the
automobile and industrial segments, with its innovative products, increased
capacity and widening reach. Consequently, discount commanded by ARBL
compared to Exide would reduce going forward. Hence, we maintain Buy on
ARBL with a 12-month Target Price of `251. At our target price, the stock will
trade at 11.3x (35% discount to Exide's multiple of 17.3x) FY2012E earnings.
Key financials
Y/E March (` cr) FY2009 FY2010 FY2011E FY2012E
Net sales 1,313 1,465 1,772 2,087
% chg 21.2 11.6 20.9 17.8
Net profit 80.5 167.0 142.4 189.7
% chg (14.7) 107.5 (14.8) 33.3
EBITDA (%) 11.5 19.2 14.3 14.8
EPS (`) 9.4 19.6 16.7 22.2
P/E (x) 21.0 10.1 11.9 8.9
P/BV (x) 4.2 3.1 2.5 2.0
RoE (%) 21.8 35.2 23.4 25.0
RoCE (%) 16.8 34.9 26.6 27.5
EV/Sales (x) 1.4 1.2 1.0 0.8
EV/EBITDA (x) 12.4 6.1 6.7 5.3
Source: Company, Angel Research
BUY
CMP `198
Target Price `251
Investment Period 12 Months
Stock Info
Sector
Bloomberg Code
Shareholding Pattern (%)
Promoters 52.1
MF / Banks / Indian Fls 22.3
FII / NRIs / OCBs 9.3
Indian Public / Others 16.3
Abs. (%) 3m 1yr 3yr
Sensex 12.0 20.8 8.2
ARBL (0.5) 26.3 82.2
2
20,303
6,106
AMAR.BO
AMRJ@IN
1,692
96
228/139
76,125
Auto Ancillary
Avg. Daily Volume
Market Cap (` cr)
Beta
52 Week High / Low
Face Value (`)
BSE Sensex
Nifty
Reuters Code
Vaishali Jajoo
022-4040 3800 Ext: 344
vaishali.jajoo@angelbroking.com
Yaresh Kothari
022-4040 3800 Ext: 313
yareshb.kothari@angelbroking.com
Amara Raja Batteries
Performance Highlights
2QFY2011 Result Update | Auto Ancillary
October 25, 2010
2. Amara Raja Batteries | 2QFY2011 Result Update
October 25, 2010 2
Exhibit 1: 2QFY2011 performance
Y/E March (` cr) 2QFY11 2QFY10 % chg 1HFY11 1HFY10 % chg
Net sales 392.5 361.2 8.7 839.2 676.8 24.0
Consumption of RM 249.9 201.9 23.8 545.9 422.1 29.3
(% of sales) 63.7 55.9 65.0 62.4
Staff costs 20.2 15.4 31.4 39.9 27.6 44.9
(% of sales) 5.2 4.3 4.8 4.1
Purchases of goods 0.7 0.5 47.8 2.5 1.7 46.7
(% of sales) 0.2 0.1 0.3 0.2
Other expenses 64.8 58.3 11.2 132.1 95.1 38.9
(% of sales) 16.5 16.1 15.7 14.1
Total expenditure 335.7 276.0 21.6 720.4 546.5 31.8
Operating profit 56.8 85.1 (33.3) 118.9 130.4 (8.8)
OPM 14.5 23.6 14.2 19.3
Interest 0.4 2.6 (83.3) 0.9 6.5 (86.7)
Depreciation 10.5 10.7 (1.4) 20.8 17.8 16.7
Other income 1.6 1.2 28.7 2.5 1.6 59.5
PBT (excl. extr. items) 47.5 73.1 (35.1) 99.7 107.6 (7.4)
Extr. income/(expense) 0.3 0.2 - (0.9) (7.4) -
PBT (incl. extr. items) 47.2 73.0 (35.3) 100.5 115.0 (12.6)
(% of sales) 12.0 20.2 12.0 17.0
Provision for taxation 15.6 25.2 (38.1) 33.2 33.2 -
(% of PBT) 33.1 34.6 33.0 28.9
Reported PAT 31.6 47.7 (33.8) 67.3 81.8 (17.7)
PATM 8.1 13.2 8.0 12.1
Equity capital (cr) 17.1 17.1 17.1 17.1
EPS (`) 3.7 5.6 (33.8) 7.9 9.6 (17.7)
Source: Company, Angel Research
Net sales up 8.7%, lower than expectations: For 2QFY2011, ARBL reported 8.7%
yoy growth in net sales to `393cr (`361cr), which was below our expectation.
Growth was aided by healthy double-digit volume growth from the auto battery
segment. In the industrial battery segment, while the UPS segment recorded
significant growth, demand for telecom batteries remain subdued, impacting the
company’s overall volume and realisation growth.
However, management is sanguine on the telecom side of its business, as a large
number of towers in the mobile telecom network has been established in the last
three-four years; and going ahead, batteries used in these towers would be due for
replacement. Emerging opportunities in the solar segment and increasing market
share in the UPS segment would help the division to further optimise its revenue
stream.
3. Amara Raja Batteries | 2QFY2011 Result Update
October 25, 2010 3
Exhibit 2: Sales growth impacted by subdued telecom battery demand
Source: Company, Angel Research
EBITDA margins at 14.5%, down 909bp: During 2QFY2011, ARBL witnessed a
909bp yoy decline in EBITDA margins, owing to a substantial 777bp yoy increase
in raw-material costs, which accounted for around 63.7% of sales (55.9% in
2QFY2010). Raw-material costs were impacted, to a certain extent, by the increase
in average lead prices, which were up 6.1% yoy to US $2039/tonne. Margins were
also down due to lower realisation from the telecom battery segment. Thus,
subdued realisation from the segment affected operating margins, as industrial
batteries command higher margins for the company.
However, management believes current prices in the telecom battery segment are
unsustainable and expects to witness an increase in the next few quarters, though
the recent surge in lead price will impact margins to a certain extent in the short
term.
Exhibit 3: Average lead prices up 6.1% yoy
Source: Company, Bloomberg, Angel Research
Exhibit 4: EBITDA margin down substantially by 909bp
Source: Company, Angel Research
Net profit down 33.8% yoy: ARBL reported a 33.8% yoy decline in net profit to
`31.6cr (`47.7cr) during the quarter. The decline was because of lower realisation
and subdued growth from the telecom battery segment. However, lower interest
cost and higher other income restricted the fall at the bottom line to a certain
extent during the quarter.
(2.9)
6.4
10.3
30.9
45.7
8.7
(10)
0
10
20
30
40
50
0
50
100
150
200
250
300
350
400
450
500
1QFY10 2QFY10 3QFY10 4QFY10 1QFY11 2QFY11
(%)(` cr) Net sales (LHS) yoy growth (RHS)
0
50,000
100,000
150,000
200,000
250,000
0
500
1,000
1,500
2,000
2,500
3,000
3,500
4,000
4,500
Sep-
01
Sep-
02
Sep-
03
Sep-
04
Sep-
05
Sep-
06
Sep-
07
Sep-
08
Sep-
09
Sep-
10
(tonne)(US $/tonne) Lead inventory (RHS) Lead prices (LHS)
14.4
23.6
18.9
14.7 13.9 14.5
56.4 56.1
60.4
66.2 66.7
64.1
0
10
20
30
40
50
60
70
80
1QFY10 2QFY10 3QFY10 4QFY10 1QFY11 2QFY11
(%) EBITDA margin Raw material cost/sales
4. Amara Raja Batteries | 2QFY2011 Result Update
October 25, 2010 4
Exhibit 5: Net profit down 33.8% yoy
Source: Company, Angel Research
Investment arguments
ARBL is India’s second-largest manufacturer of lead batteries with a market
share of ~27%. US-based Johnson Controls is a joint venture partner of ARBL
and holds a 26% equity stake in the company. Automotive and industrial
batteries contribute 50% each to the total revenue of ARBL.
We expect the automotive battery market to post a ~21% CAGR in sales over
FY2010–12E, led by healthy growth in replacement demand, ~12% CAGR in
new vehicle sales and shrinking market share of unorganised players. Thus,
during FY2010–12E, we expect ARBL to post a 21.2% volume CAGR in the
automotive battery segment, leading to overall 19.3% revenue CAGR. Also,
with a strong focus on strengthening its distribution network, we expect ARBL to
increase its market share to ~29% by FY2013E.
ARBL pioneered the use of maintenance-free batteries with presence in the
railway signaling, telecom power and supply solutions segments. Going
forward, we expect the power backup (UPS/inverter) segment to drive demand
for industrial batteries, leading to an 11.1% CAGR in industrial revenue over
FY2010E–12E.
Supported by strong demand for automotive batteries, ARBL plans to increase
its two-wheeler and four-wheeler battery capacity by 100% and 21%,
respectively, by FY2011, incurring a capex of `85cr (`150cr overall capex).
12.8 13.2
10.2
8.0 8.0 8.1
0
2
4
6
8
10
12
14
0
10
20
30
40
50
60
1QFY10 2QFY10 3QFY10 4QFY10 1QFY11 2QFY11
(%)(`cr) Net profit (LHS) Net profit margin (RHS)
5. Amara Raja Batteries | 2QFY2011 Result Update
October 25, 2010 5
Outlook and valuation
We estimate ARBL to post a ~19.3% CAGR in its top line over FY2010–12E,
largely aided by substantial growth in auto battery volumes. However, net profit for
the period is estimated to grow lower at ~7% CAGR, largely due to lower
realisation from the telecom battery segment, impacting overall performance at the
operating front.
On the valuation front, ARBL is trading at 11.9x and 8.9x FY2011E and FY2012E
EPS, respectively. At present, ARBL is trading at ~45% discount to Exide (adjusted
for the insurance business). Although ARBL has always traded at a discount to
Exide (due to Exide’s leadership position, scale of operations, superior margins
and return ratios), ARBL is well placed to tap the rising demand from the
automobile and industrial segments with its innovative products, increased capacity
and widening reach. The discount commanded by ARBL compared to Exide would
reduce with a) increasing scale of operations, b) sustainable revenue and earnings
visibility and c) improving return ratios. We maintain Buy on ARBL with a
12-month Target Price of `251, representing a ~27% potential upside. At our
target price, the stock will trade at 11.3x (35% discount to Exide's multiple of
17.3x) FY2012E EPS of `22.2.
Exhibit 6: Key assumptions
Y/E March FY2010P FY2011E FY2012E
Volumes (‘000 units)
Automotive battery
Four-wheeler 3,318 3,774 4,386
Motorcycle/small VRLA 1,776 2,556 3,096
Industrial battery
Large VRLA (mn Ah) 622 630 675
Medium VRLA 1,221 1,548 1,848
Utilisation (%)
Automotive 81 83 86
Industrial 72 79 82
Revenue (` cr)
Automotive battery 846 1,137 1,382
Industrial battery 846 924 1,044
Large VRLA 507 504 540
Medium VRLA 338 420 504
Gross revenue 1,691 2,061 2,427
Source: Company, Angel Research
10. Amara Raja Batteries | 2QFY2011 Result Update
October 25, 2010 10
Research Team Tel: 022 - 4040 3800 E-mail: research@angeltrade.com Website: www.angeltrade.com
DISCLAIMER
This document is solely for the personal information of the recipient, and must not be singularly used as the basis of any investment
decision. Nothing in this document should be construed as investment or financial advice. Each recipient of this document should make
such investigations as they deem necessary to arrive at an independent evaluation of an investment in the securities of the companies
referred to in this document (including the merits and risks involved), and should consult their own advisors to determine the merits and
risks of such an investment.
Angel Broking Limited, its affiliates, directors, its proprietary trading and investment businesses may, from time to time, make
investment decisions that are inconsistent with or contradictory to the recommendations expressed herein. The views contained in this
document are those of the analyst, and the company may or may not subscribe to all the views expressed within.
Reports based on technical and derivative analysis center on studying charts of a stock's price movement, outstanding positions and
trading volume, as opposed to focusing on a company's fundamentals and, as such, may not match with a report on a company's
fundamentals.
The information in this document has been printed on the basis of publicly available information, internal data and other reliable
sources believed to be true, but we do not represent that it is accurate or complete and it should not be relied on as such, as this
document is for general guidance only. Angel Broking Limited or any of its affiliates/ group companies shall not be in any way
responsible for any loss or damage that may arise to any person from any inadvertent error in the information contained in this report.
Angel Broking Limited has not independently verified all the information contained within this document. Accordingly, we cannot testify,
nor make any representation or warranty, express or implied, to the accuracy, contents or data contained within this document. While
Angel Broking Limited endeavours to update on a reasonable basis the information discussed in this material, there may be regulatory,
compliance, or other reasons that prevent us from doing so.
This document is being supplied to you solely for your information, and its contents, information or data may not be reproduced,
redistributed or passed on, directly or indirectly.
Angel Broking Limited and its affiliates may seek to provide or have engaged in providing corporate finance, investment banking or
other advisory services in a merger or specific transaction to the companies referred to in this report, as on the date of this report or in
the past.
Neither Angel Broking Limited, nor its directors, employees or affiliates shall be liable for any loss or damage that may arise from or in
connection with the use of this information.
Note: Please refer to the important `Stock Holding Disclosure' report on the Angel website (Research Section). Also, please
refer to the latest update on respective stocks for the disclosure status in respect of those stocks. Angel Broking Limited and
its affiliates may have investment positions in the stocks recommended in this report.
Disclosure of Interest Statement Amara Raja Batteries
1. Analyst ownership of the stock No
2. Angel and its Group companies ownership of the stock No
3. Angel and its Group companies' Directors ownership of the stock No
4. Broking relationship with company covered No
Ratings (Returns): Buy (> 15%) Accumulate (5% to 15%) Neutral (-5 to 5%)
Reduce (-5% to 15%) Sell (< -15%)
Note: We have not considered any Exposure below ` 1 lakh for Angel, its Group companies and Directors