Market Outlook - July 13, 2010
•
0 likes•50 views

The Indian stock market opened higher tracking gains in Asian markets but pared some gains later in the day. The key indices - Sensex and Nifty - closed with gains of 0.6% each. IT and realty stocks led the gains early on while industrial production data weighed on the markets later. Mid-cap and small-cap indices also ended higher. Container traffic growth and results from Sintex Industries were in line with expectations. Exide Industries and Infosys are scheduled to report quarterly results today. The markets are expected to trade in a range with support and resistance levels provided.

Recommended
More Related Content
What's hot
What's hot (17)
Viewers also liked
Viewers also liked (16)
Similar to Market Outlook - July 13, 2010
Similar to Market Outlook - July 13, 2010 (19)
More from Angel Broking
More from Angel Broking (20)
Recently uploaded
Recently uploaded (20)
Market Outlook - July 13, 2010
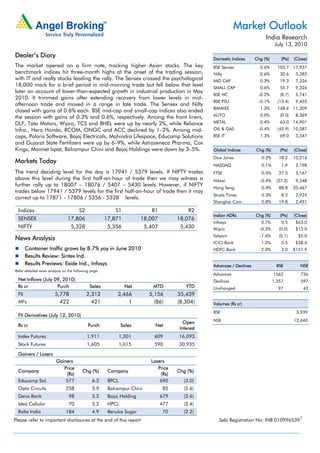
- 1. Market Outlook India Research July 13, 2010 Dealer’s Diary Domestic Indices Chg (%) (Pts) (Close) The market opened on a firm note, tracking higher Asian stocks. The key BSE Sensex 0.6% 103.7 17,937 benchmark indices hit three-month highs at the onset of the trading session, Nifty 0.6% 30.6 5,383 with IT and realty stocks leading the rally. The Sensex crossed the psychological MID CAP 0.3% 19.3 7,336 18,000 mark for a brief period in mid-morning trade but fell below that level SMALL CAP 0.6% 55.7 9,326 later on account of lower-than-expected growth in industrial production in May BSE HC -0.2% (8.7) 5,741 2010. It trimmed gains after extending recovery from lower levels in mid- BSE PSU -0.1% (13.4) 9,455 afternoon trade and moved in a range in late trade. The Sensex and Nifty BANKEX 1.3% 148.4 11,209 closed with gains of 0.6% each. BSE mid-cap and small-cap indices also ended AUTO 0.0% (0.0) 8,369 the session with gains of 0.3% and 0.6%, respectively. Among the front liners, DLF, Tata Motors, Wipro, TCS and BHEL were up by nearly 2%, while Reliance METAL 0.4% 63.0 14,901 Infra., Hero Honda, RCOM, ONGC and ACC declined by 1–2%. Among mid- OIL & GAS -0.4% (45.9) 10,587 caps, Polaris Software, Bajaj Electricals, Mahindra Lifespace, Educomp Solutions BSE IT 1.3% 69.0 5,547 and Gujarat State Fertilizers were up by 6–9%, while Astrazeneca Pharma, Cox Kings, Monnet Ispat, Balrampur Chini and Bajaj Holdings were down by 3–5%. Global Indices Chg (%) (Pts) (Close) Dow Jones 0.2% 18.2 10,216 Markets Today NASDAQ 0.1% 1.9 2,198 The trend deciding level for the day is 17941 / 5379 levels. If NIFTY trades FTSE 0.5% 27.5 5,167 above this level during the first half-an-hour of trade then we may witness a Nikkei -0.4% (37.2) 9,548 further rally up to 18007 – 18076 / 5407 – 5430 levels. However, if NIFTY Hang Seng 0.4% 88.8 20,467 trades below 17941 / 5379 levels for the first half-an-hour of trade then it may Straits Times 0.3% 8.2 2,925 correct up to 17871 - 17806 / 5356 - 5328 levels. Shanghai Com 0.8% 19.8 2,491 Indices S2 S1 R1 R2 Indian ADRs Chg (%) (Pts) (Close) SENSEX 17,806 17,871 18,007 18,076 Infosys 0.7% 0.5 $63.0 NIFTY 5,328 5,356 5,407 5,430 Wipro -0.3% (0.0) $13.0 Satyam -1.6% (0.1) $5.0 News Analysis ICICI Bank 1.2% 0.5 $38.3 Container traffic grows by 8.7% yoy in June 2010 HDFC Bank 2.0% 3.0 $151.9 Results Review: Sintex Ind. Results Previews: Exide Ind., Infosys Advances / Declines BSE NSE Refer detailed news analysis on the following page. Advances 1562 736 Net Inflows (July 09, 2010) Declines 1,357 597 Rs cr Purch Sales Net MTD YTD Unchanged 97 43 FII 5,778 2,312 3,466 5,156 35,439 MFs 422 421 1 (86) (8,304) Volumes (Rs cr) BSE 3,939 FII Derivatives (July 12, 2010) NSE 12,640 Open Rs cr Purch Sales Net Interest Index Futures 1,911 1,301 609 16,093 Stock Futures 1,605 1,015 590 30,935 Gainers / Losers Gainers Losers Price Price Company Chg (%) Company Chg (%) (Rs) (Rs) Educomp Sol. 577 6.2 BPCL 690 (3.0) Opto Circuits 258 5.9 Balrampur Chini 85 (2.6) Dena Bank 98 5.2 Bajaj Holding 679 (2.6) Idea Cellular 70 5.2 HPCL 477 (2.4) Rolta India 184 4.9 Renuka Sugar 70 (2.2) Please refer to important disclosures at the end of this report Sebi Registration No: INB 0109965391
- 2. Market Outlook | India Research Container traffic grows by 8.7% yoy in June 2010 As per data released by the Indian Port Association (IPA), container volumes rose by 8.7% yoy in June 2010 and 16.9% yoy in 1QFY2011. Among major ports, the JNPT port, which handles around 61% of the country’s container volumes, witnessed marginal volume growth of 3.7% yoy in June 2010, growing by 12.2% yoy in 1QFY2011. Further, volumes at the Chennai port, which handles around 16% of the country’s container traffic, were up by 29.5% yoy in June 2010 and 36.8% yoy in 1QFY2011. The strong growth rate in container volumes is mainly on account of revival in Exim trade and low-base effect. Going ahead, we expect volumes to sustain at current levels for FY2011. Company-wise, we estimate Concor to post around 10.0% yoy growth in Exim volumes and GDL to register 15.0% yoy growth in CFS volumes for 1QFY2011E. Result Review Sintex Industries Sintex Industries’ (Sintex) 1QFY2011 results were marginally above our expectations. The company’s revenue increased by robust 37.5% yoy to Rs911cr, against our expectation of Rs854cr. Growth was largely driven by the domestic plastic segment. The pre-fab segment grew by 52.0% yoy to Rs 382cr, largely driven by the monolithic and standalone pre-fab segments, which grew by 89.2% yoy and 57.4% yoy, respectively. The domestic custom moulding segment reported good set of numbers on account of increasing outsourcing opportunities from India at a much better cost. Standalone BT Shelter and Zeppelin continued to drag performance. Nief and Wausaukee reported moderate revenue growth on account of higher rupee appreciation; however, it reported strong numbers in dollar and euro terms on account of low base. Bright Autoplast’s revenue continued to report good set of numbers, growing 46.0% yoy, driven by increasing capacity utilisation of its new Chennai plant and addition of new customers. The textile segment reported strong revenue growth of 30% yoy to Rs99cr on account of low base and pick up in demand in high-end fabrics. Operating margins came in at 15.1%, up 189bp yoy, on the back of higher contribution from the high-margin monolithic segment. Other income fell by 43.6% yoy to Rs20cr, as the company booked ~Rs14cr of MTM loss on its FCCB. Consequently, PAT came in at Rs78.8cr, up 30% yoy, which was in line with our expectation. At the CMP, the stock is trading at 9.3x on FY2012EPS, which is below its historical one-year average forward P/E (13x). We maintain a Buy rating on the stock with a target price of Rs385. We will release the detailed note post the conference call today. Result Previews Exide Industries Exide Industries is slated to announce its 1QFY2011 results today. We expect the company’s top line to grow by 17% yoy to Rs1,059cr on account of increased offtake in volumes and a marginal increase in realisations. On the operating front, the EBITDA margin is expected to decline by 210bp yoy to 21.1% due to higher yoy average lead prices for the quarter. However, the bottom line is expected to grow by 11.2% yoy to Rs136.1cr. The stock is under review. Infosys For 1QFY2011, we expect Infosys to witness 3.1% qoq growth in revenue with volumes at Rs6,129cr, ahead of its guidance of Rs5,963cr. The company’s EBITDA margin is expected to contract by 57bp on account of strong manpower intake and higher SG&A spends with improved business environment. Net profit is expected to be down by 4.1% qoq to Rs1,550cr. We maintain an Accumulate view on the stock. July 13, 2010 2
- 3. Market Outlook | India Research Economic and Political News Industry grows by 11.5% in May 2010 Government plans Rs10k-cr VC fund to promote R&D in Pharma RBI likely to announce sunset clause for base rate migration Steel Ministry for banning iron ore exports Corporate News NTPC dumps Uttar Pradesh, to set up 4,000MW power plant in Madhya Pradesh Nalco close to buyouts in Chile, Namibia, Indonesia StanChart signs pact to acquire GE Commercial Financing P&G to get Ambi Pur rights in India from Godrej Source: Economic Times, Business Standard, Business Line, Financial Express, Mint Events for the day Exide Ind. Quarterly Results Hotel Leela Quarterly Results Infosys Quarterly Results July 13, 2010 3
- 4. Market Outlook | India Research Research Team Tel: 022-4040 3800 E-mail: research@angeltrade.com Website: www.angeltrade.com DISCLAIMER This document is solely for the personal information of the recipient, and must not be singularly used as the basis of any investment decision. Nothing in this document should be construed as investment or financial advice. Each recipient of this document should make such investigations as they deem necessary to arrive at an independent evaluation of an investment in the securities of the companies referred to in this document (including the merits and risks involved), and should consult their own advisors to determine the merits and risks of such an investment. Angel Broking Limited, its affiliates, directors, its proprietary trading and investment businesses may, from time to time, make investment decisions that are inconsistent with or contradictory to the recommendations expressed herein. The views contained in this document are those of the analyst, and the company may or may not subscribe to all the views expressed within. Reports based on technical and derivative analysis center on studying charts of a stock's price movement, outstanding positions and trading volume, as opposed to focusing on a company's fundamentals and, as such, may not match with a report on a company's fundamentals. The information in this document has been printed on the basis of publicly available information, internal data and other reliable sources believed to be true, but we do not represent that it is accurate or complete and it should not be relied on as such, as this document is for general guidance only. Angel Broking or any of its affiliates/ group companies shall not be in any way responsible for any loss or damage that may arise to any person from any inadvertent error in the information contained in this report. Angel Broking Limited has not independently verified all the information contained within this document. Accordingly, we cannot testify, nor make any representation or warranty, express or implied, to the accuracy, contents or data contained within this document. While Angel Broking Limited endeavours to update on a reasonable basis the information discussed in this material, there may be regulatory, compliance, or other reasons that prevent us from doing so. This document is being supplied to you solely for your information, and its contents, information or data may not be reproduced, redistributed or passed on, directly or indirectly. Angel Broking Limited and its affiliates may seek to provide or have engaged in providing corporate finance, investment banking or other advisory services in a merger or specific transaction to the companies referred to in this report, as on the date of this report or in the past. Neither Angel Broking Limited, nor its directors, employees or affiliates shall be liable for any loss or damage that may arise from or in connection with the use of this information. Note: Please refer to the important `Stock Holding Disclosure' report on the Angel website (Research Section). Address: Acme Plaza, ‘A’ Wing, 3rd Floor, M.V. Road, Opp. Sangam Cinema, Andheri (E), Mumbai - 400 059. Tel : (022) 3952 4568 / 4040 3800 Angel Broking Ltd: BSE Sebi Regn No : INB 010996539 / CDSL Regn No: IN - DP - CDSL - 234 - 2004 / PMS Regn Code: PM/INP000001546 Angel Capital & Debt Market Ltd: INB 231279838 / NSE FNO: INF 231279838 / NSE Member code -12798 Angel Commodities Broking (P) Ltd: MCX Member ID: 12685 / FMC Regn No: MCX / TCM / CORP / 0037 NCDEX : Member ID 00220 / FMC Regn No: NCDEX / TCM / CORP / 0302 July 13, 2010 4