Bank of India 1QFY2011 Earnings Beat Estimates on Provisions Drop
•
0 likes•62 views

Bank of India reported a 24.1% year-over-year increase in net profit to Rs725 crore for the first quarter of fiscal year 2011, with robust loan growth, improved net interest margins, and lower provisions driving results. Advances grew 19.6% year-over-year while deposits increased 19.8% year-over-year. Net interest margins improved to 2.89% from 2.42% in the prior year quarter. Asset quality also improved with gross and net NPA ratios declining.

Recommended
More Related Content
What's hot
What's hot (16)
Viewers also liked
Viewers also liked (20)
Similar to Bank of India 1QFY2011 Earnings Beat Estimates on Provisions Drop
Similar to Bank of India 1QFY2011 Earnings Beat Estimates on Provisions Drop (20)
More from Angel Broking
More from Angel Broking (20)
Recently uploaded
Recently uploaded (20)
Bank of India 1QFY2011 Earnings Beat Estimates on Provisions Drop
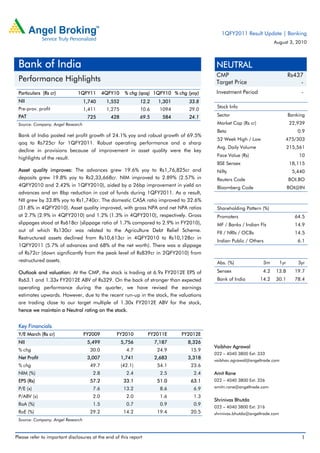
- 1. 1QFY2011 Result Update | Banking August 3, 2010 Bank of India NEUTRAL CMP Rs437 Performance Highlights Target Price - Particulars (Rs cr) 1QFY11 4QFY10 % chg (qoq) 1QFY10 % chg (yoy) Investment Period - NII 1,740 1,552 12.2 1,301 33.8 Pre-prov. profit Stock Info 1,411 1,275 10.6 1094 29.0 PAT 725 428 69.5 584 24.1 Sector Banking Source: Company, Angel Research Market Cap (Rs cr) 22,939 Beta 0.9 Bank of India posted net profit growth of 24.1% yoy and robust growth of 69.5% 52 Week High / Low 475/303 qoq to Rs725cr for 1QFY2011. Robust operating performance and a sharp Avg. Daily Volume 215,561 decline in provisions because of improvement in asset quality were the key Face Value (Rs) 10 highlights of the result. BSE Sensex 18,115 Asset quality improves: The advances grew 19.6% yoy to Rs1,76,825cr and Nifty 5,440 deposits grew 19.8% yoy to Rs2,33,668cr. NIM improved to 2.89% (2.57% in Reuters Code BOI.BO 4QFY2010 and 2.42% in 1QFY2010), aided by a 26bp improvement in yield on Bloomberg Code BOI@IN advances and an 8bp reduction in cost of funds during 1QFY2011. As a result, NII grew by 33.8% yoy to Rs1,740cr. The domestic CASA ratio improved to 32.6% (31.8% in 4QFY2010). Asset quality improved, with gross NPA and net NPA ratios Shareholding Pattern (%) at 2.7% (2.9% in 4QFY2010) and 1.2% (1.3% in 4QFY2010), respectively. Gross Promoters 64.5 slippages stood at Rs618cr (slippage ratio of 1.7% compared to 2.9% in FY2010), MF / Banks / Indian Fls 14.9 out of which Rs130cr was related to the Agriculture Debt Relief Scheme. FII / NRIs / OCBs 14.5 Restructured assets declined from Rs10,613cr in 4QFY2010 to Rs10,128cr in Indian Public / Others 6.1 1QFY2011 (5.7% of advances and 68% of the net worth). There was a slippage of Rs72cr (down significantly from the peak level of Rs839cr in 2QFY2010) from restructured assets. Abs. (%) 3m 1yr 3yr Outlook and valuation: At the CMP, the stock is trading at 6.9x FY2012E EPS of Sensex 4.2 13.8 19.7 Rs63.1 and 1.33x FY2012E ABV of Rs329. On the back of stronger than expected Bank of India 14.2 30.1 78.4 operating performance during the quarter, we have revised the earnings estimates upwards. However, due to the recent run-up in the stock, the valuations are trading close to our target multiple of 1.30x FY2012E ABV for the stock, hence we maintain a Neutral rating on the stock. Key Financials Y/E March (Rs cr) FY2009 FY2010 FY2011E FY2012E NII 5,499 5,756 7,187 8,326 Vaibhav Agrawal % chg 30.0 4.7 24.9 15.9 022 – 4040 3800 Ext: 333 Net Profit 3,007 1,741 2,683 3,318 vaibhav.agrawal@angeltrade.com % chg 49.7 (42.1) 54.1 23.6 NIM (%) 2.8 2.4 2.5 2.4 Amit Rane EPS (Rs) 57.2 33.1 51.0 63.1 022 – 4040 3800 Ext: 326 P/E (x) 7.6 13.2 8.6 6.9 amitn.rane@angeltrade.com P/ABV (x) 2.0 2.0 1.6 1.3 Shrinivas Bhutda RoA (%) 1.5 0.7 0.9 0.9 022 – 4040 3800 Ext: 316 RoE (%) 29.2 14.2 19.4 20.5 shrinivas.bhutda@angeltrade.com Source: Company, Angel Research Please refer to important disclosures at the end of this report 1
- 2. Bank of India | 1QFY2011 Result Update Exhibit 1: 1QFY2011 performance % chg % chg Particulars (Rs cr) 1QFY2011 4QFY2010 1QFY2010 (qoq) (yoy) Interest earned 4,822 4,525 6.6 4,378 10.1 Interest expenses 3,081 2,973 3.6 3,077 0.1 NII 1,740 1,552 12.2 1,301 33.8 Non-interest income 586 723 (19.0) 646 (9.3) Total income 2,326 2,275 2.3 1,946 19.5 Operating expenses 916 999 (8.4) 853 7.4 Pre-prov. profit 1,411 1,275 10.6 1,094 29.0 Provisions & cont. 386 809 (52.3) 223 72.7 PBT 1,025 466 119.7 870 17.7 Prov. for taxes 300 39 678.0 286 4.8 PAT 725 428 69.5 584 24.1 EPS (Rs) 13.8 8.1 69.5 11.1 24.1 Cost-to-income ratio (%) 39.4 43.9 43.8 Effective tax rate (%) 29.2 8.3 32.9 Net NPA (%) 1.18 1.3 0.8 Source: Company, Angel Research Exhibit 2: 1QFY2011 Actual v/s Angel estimates Particulars (Rs cr) Actual Estimates Var. (%) NII 1,740 1,440 20.9 Non-interest income 586 648 (9.6) Total income 2,326 2,088 11.4 Operating expenses 916 955 (4.1) Pre-prov. profit 1,411 1,133 24.5 Provisions & cont. 386 398 (3.0) PBT 1,025 735 39.4 Prov. for taxes 300 244 22.8 PAT 725 491 47.7 Source: Company, Angel Research August 3, 2010 2
- 3. Bank of India | 1QFY2011 Result Update Advances and deposits growth improve At the end of 1QFY2011, advances grew 19.6% yoy to Rs1,76,825cr and deposits grew 19.8% yoy to Rs2,33,668cr. The domestic loan book grew by 19.6% yoy to Rs1,39,359cr and the overseas loan book registered growth of 19.7% yoy to Rs37,466cr. Domestic loans were driven by corporate loans and the SME segment, which grew by 30.3% and 21.3% yoy, respectively. We have factored in yoy growth of 20.0% in advances for the bank in FY2011E, based on the ongoing pick-up in credit demand and expectations of large, unutilised limits getting increasingly drawn down, going forward, as working capital requirements increase. Exhibit 3: Trend in advances and deposits Advances Deposits Credit-Deposit ratio (RHS) (Rs cr) (%) 250,000 81 200,000 78 150,000 75 100,000 72 50,000 - 69 1QFY09 2QFY09 3QFY09 4QFY09 1QFY10 2QFY10 3QFY10 4QFY10 1QFY11 Source: Company, Angel Research Exhibit 4: 1QFY2011 – Domestic advances break-up Corporates Business Auto 54% Education Mortgage 1% 1% 1% Others 2% Retail 11% Agri SME 13% Housing 22% 6% Source: Company, Angel Research August 3, 2010 3
- 4. Bank of India | 1QFY2011 Result Update NIMs improve sequentially Bank of India’s NIM improved to 2.89% in 1QFY2011 (2.57% in 4QFY2010 and 2.42% in 1QFY2010), aided by a 26bp improvement in yield on advances and an 8bp reduction in cost of funds during the quarter. As a result, NII grew by 33.8% yoy to Rs1,740cr. The bank’s domestic CASA ratio improved to 32.6% (31.8% in 4QFY2010). CASA deposits increased by 26.4% yoy, driven by yoy growth of 19.6% and 28.5% in current and savings deposits, respectively. Exhibit 5: Trend in spreads Particulars (%) 1QFY10 2QFY10 3QFY10 4QFY10 1QFY11 Cost of deposits 5.81 5.59 5.26 4.79 4.79 Yield on advances 9.27 8.97 8.41 8.12 8.38 Yield on investments 7.06 7.14 7.36 6.98 6.90 Yield on funds 7.69 7.66 7.35 6.90 6.96 Cost of funds 5.40 5.26 4.90 4.53 4.45 Reported NIM 2.42 2.57 2.60 2.57 2.89 Source: Company, Angel Research Exhibit 6: Trend in reported NIM (%) Reported NIM 3.20 2.89 2.80 2.57 2.60 2.57 2.42 2.40 2.00 1QFY10 2QFY10 3QFY10 4QFY10 1QFY11 Source: Company, Angel Research Non-interest income declines Total non-interest income declined by 9.3% yoy to Rs586cr due to lower treasury gains (down 16.4% yoy). However, non-interest income excluding treasury grew by 19.7% yoy. We expect total non-interest income to decline by 6.4% in FY2011E. Exhibit 7: Break-up of non-interest income Particulars (Rs cr) 1QFY11 4QFY10 % chg (qoq) 1QFY10 % chg (yoy) CEB 250 334 (25.2) 263 (5.0) Treasury 231 194 18.7 276 (16.4) Recoveries 37 94 (60.5) 33 11.8 Others 68 102 (32.6) 74 (7.6) Total 586 723 (19.0) 646 (9.3) Source: Company, Angel Research August 3, 2010 4
- 5. Bank of India | 1QFY2011 Result Update Exhibit 8: Trend in non-interest income mix (Rs cr) CEB Treasury Recoveries Others 1,200 900 600 672 342 194 276 283 212 231 300 181 120 230 264 287 311 263 248 252 334 250 - 1QFY09 2QFY09 3QFY09 4QFY09 1QFY10 2QFY10 3QFY10 4QFY10 1QFY11 Source: Company, Angel Research Improving asset quality Gross NPAs of the bank decreased by 1.8% sequentially and by 6.6% yoy to Rs4,795cr in 1QFY2011. Gross NPA and net NPA ratios stood at 2.7% (2.9% in 4QFY2010) and 1.2% (1.3% in 4QFY2010), respectively. Gross slippages stood at Rs618cr (slippage ratio of 1.7%), out of which Rs130cr was related to the Agriculture Debt Relief Scheme. The NPA provision coverage ratio including technical write-offs improved from 65.5% in 4QFY2010 to 68.3% at the end of 1QFY2011. Restructured assets declined from Rs10,613cr in 4QFY2010 to Rs10,128cr in 1QFY2011 (5.7% of advances and 68.0% of net worth). There was a slippage of Rs72cr (down significantly from the peak level of Rs839cr in 2QFY2010) from restructured assets. Exhibit 9: Trend in asset quality Gross NPAs Net NPAs Coverage ratio (RHS) (Rs cr) (%) 6,000 80 4,500 65 3,000 50 1,500 - 35 1QFY09 2QFY09 3QFY09 4QFY09 1QFY10 2QFY10 3QFY10 4QFY10 1QFY11 Source: Company, Angel Research, Note: NPA coverage excluding technical write-offs till 4QFY2009 Operating costs under control Total operating expenses increased by 7.4% yoy and declined by 8.4% sequentially to Rs916cr. The cost-to-income ratio stood at 39.4%, lower than its eight-quarter average of 40.2%. Till date, the bank has made excess provisions of Rs190cr in employee costs, which are expected to provide a cushion against future liabilities. August 3, 2010 5
- 6. Bank of India | 1QFY2011 Result Update Exhibit 10: Trend in productivity (%) Cost-to-Income ratio 60.0 43.8 45.3 43.9 39.6 42.2 45.0 38.6 39.4 36.5 31.5 30.0 15.0 - 1QFY09 2QFY09 3QFY09 4QFY09 1QFY10 2QFY10 3QFY10 4QFY10 1QFY11 Source: Company, Angel Research Sufficient capital adequacy The bank is well capitalised with a CAR of 13.3% and Tier-I capital of 8.5% (forming 64% of the total CAR). The bank has adequate headroom to raise additional Tier-II capital. Exhibit 11: Comfortable capital adequacy (%) Tier-I CAR Tier-II CAR 15.0 12.0 4.4 4.3 4.1 4.1 4.5 4.8 9.0 6.0 8.9 9.2 9.2 9.4 8.5 8.5 3.0 0.0 4QFY09 1QFY10 2QFY10 3QFY10 4QFY10 1QFY11 Source: Company, Angel Research August 3, 2010 6
- 7. Bank of India | 1QFY2011 Result Update Investment Arguments Lower provisions to drive RoE During the crisis, Bank of India faced severe asset quality pressure with slippages rate of 2.9% in FY2010 (from 1.8% in FY2009.) As a result, the NPA provision/assets increased to 0.7% in FY2010 from 0.3% in FY2009, thereby pressurising the bank’s RoE. However, as observed in 1QFY2011 results, the bank has overcome the worst of the asset quality pressures. Further, with an improvement in the operating environment, we expect the NPA provision/assets to decline sharply to 0.4% by FY2012E, leading to RoE of 20.5% by FY2012E from 14.2% in FY2010. Strong fee-income potential with moderate funding mix Bank of India’s international operations contribute a substantial 21.2% to advances. The bank’s international operations enable a wider spectrum of fee- based services to domestic corporate and retail customers, foreign currency fund- based services to Indian corporates and savings products to PIO clients abroad. The bank also has significant forex operations (one of the largest amongst domestic banks in FY2010). The bank’s moderate funding mix (CASA ratio at 32.6% of domestic deposits) and traction in core fee income are expected to support a relatively high 19% CAGR in pre-provisions profits compared to peers over FY2010–12E. Efficient capital management aiding RoE outlook Bank of India’s CAR is comfortable at 13.3%, with an 8.5% Tier-1 component reinforced by strong internal generation that leaves comfortable headroom on Tier-II sources. Leverage is amongst the highest within peers, aided by relatively higher use of Tier-1 bonds and revaluation reserves. With government holding at 64%, the bank is not facing pronounced near-term constraints on the equity front. Outlook and valuation At the CMP, the stock is trading at 6.9x FY2012E EPS of Rs63.1 and 1.33x FY2012E ABV of Rs329. On the back of stronger than expected operating performance during the quarter, we have revised the earnings estimates upwards. However, due to the recent run-up in the stock, the valuations are trading close to our target multiple of 1.30x FY2012E ABV for the stock, hence we maintain a Neutral rating on the stock. August 3, 2010 7
- 8. Bank of India | 1QFY2011 Result Update Exhibit 12: Key assumptions Earlier estimates Revised estimates Particulars (%) FY2011E FY2012E FY2011E FY2012E Credit growth 18.0 18.0 20.0 18.0 Deposit growth 18.0 17.0 18.0 17.0 CASA ratio 27.6 27.3 27.6 27.3 NIM 2.3 2.2 2.5 2.4 Other income growth (4.7) 17.0 (6.4) 16.9 Growth in staff expenses 12.0 14.0 8.0 14.0 Growth in other expenses 12.0 14.0 8.0 14.0 Slippages 2.4 2.1 2.3 2.0 Coverage ratio 71.3 73.3 70.2 70.1 Treasury gain/(loss) (% of investments) 0.2 0.1 0.2 0.1 Source: Company, Angel Research Exhibit 13: Change in estimates FY2011E FY2012E Particulars (Rs cr) Earlier Revised Earlier Revised % chg % chg estimates estimates estimates estimates NII 6,622 7,187 8.5 7,651 8,326 8.8 Non-interest income 2,493 2,450 (1.7) 2,918 2,865 (1.8) Total income 9,115 9,637 5.7 10,569 11,191 5.9 Operating expenses 4,108 3,961 (3.6) 4,683 4,516 (3.6) Pre-prov. profit 5,007 5,676 13.4 5,885 6,676 13.4 Provisions & cont. 1,829 1,659 (9.3) 1,810 1,648 (8.9) PBT 3,178 4,016 26.4 4,076 5,027 23.3 Prov. for taxes 1,055 1,333 26.4 1,386 1,709 23.3 PAT 2,124 2,683 26.4 2,690 3,318 23.3 Source: Company, Angel Research Exhibit 14: P/ABV band Price 0.4x 0.8x 1.2x 1.6x 2x (Rs) 700 600 500 400 300 200 100 0 Aug-05 Jun-06 Jan-00 Jul-03 May-04 Jan-06 Jul-08 May-09 Dec-03 Dec-08 Apr-07 Apr-10 Oct-04 Feb-03 Mar-05 Feb-08 Feb-11 Sep-02 Sep-07 Sep-10 Nov-06 Nov-09 Source: Company, Angel Research August 3, 2010 8
- 9. Bank of India | 1QFY2011 Result Update Exhibit 15: Recommendation summary CMP Tgt. price Upside FY2012E FY2012E FY2012E FY10-12E FY2012E FY2012E Company Reco (Rs) (Rs) (%) P/ABV (x) Tgt. P/ABV (x) P/E (x) CAGR in EPS (%) RoA (%) RoE (%) AXISBK Buy 1,359 1,688 24.2 2.6 3.2 13.5 27.4 1.6 20.5 FedBk Accumulate 342 375 9.6 1.0 1.1 7.4 30.7 1.4 14.4 HDFCBK Buy 2,124 2,514 18.4 3.4 4.0 17.7 36.5 1.7 20.6 ICICIBK Buy 962 1,163 20.9 1.9 2.2 15.5 31.0 1.4 15.5 SIB Neutral 191 - - 1.1 - 6.7 17.1 1.0 17.8 YesBk Neutral 309 - - 2.5 - 15.6 18.7 1.3 17.1 BOI Neutral 437 - - 1.3 - 6.9 38.0 0.9 20.5 CorpBk Accumulate 574 607 5.8 1.0 1.1 5.5 13.4 1.0 20.5 DenaBk Accumulate 103 114 11.0 0.9 1.0 4.6 12.1 0.9 18.9 IndBk Neutral 229 - - 1.1 - 5.6 7.6 1.3 21.0 IOB Accumulate 119 133 11.4 0.9 1.0 5.9 25.1 0.7 14.9 OBC Neutral 405 - - 1.0 - 6.1 21.6 0.9 18.3 PNB Reduce 1,115 948 (15.0) 1.5 1.3 7.5 9.5 1.2 22.0 SBI Accumulate 2,603 2,821 8.4 1.4 1.8 11.4 25.7 1.0 19.5 UcoBk Buy 97 115 18.6 0.8 1.0 4.2 12.0 0.8 23.8 UnionBk Neutral 323 - - 1.3 - 5.7 17.1 1.1 24.1 Source: Company, Angel Research August 3, 2010 9
- 10. Bank of India | 1QFY2011 Result Update Income statement Y/E March (Rs cr) FY06 FY07 FY08 FY09 FY10 FY11E FY12E Net Interest Income 2,632 3,440 4,229 5,499 5,756 7,187 8,326 - YoY Growth (%) 17.7 30.7 22.9 30.0 4.7 24.9 15.9 Other Income 1,184 1,563 2,117 3,052 2,617 2,450 2,865 - YoY Growth (%) 2.5 32.0 35.4 44.2 (14.3) (6.4) 16.9 Operating Income 3,816 5,003 6,346 8,551 8,373 9,637 11,191 - YoY Growth (%) 12.5 31.1 26.8 34.7 (2.1) 15.1 16.1 Operating Expenses 2,115 2,608 2,645 3,094 3,668 3,961 4,516 - YoY Growth (%) 9.5 23.3 1.4 17.0 18.5 8.0 14.0 Pre - Provision Profit 1,701 2,395 3,701 5,457 4,705 5,676 6,676 - YoY Growth (%) 16.5 40.8 54.5 47.4 (13.8) 20.6 17.6 Prov. & Cont. 786 862 1,017 1,292 2,211 1,659 1,648 - YoY Growth (%) (21.4) 9.7 17.9 27.1 71.1 (24.9) (0.7) Profit Before Tax 916 1,533 2,685 4,164 2,494 4,016 5,027 - YoY Growth (%) 98.6 67.4 75.1 55.1 (40.1) 61.0 25.2 Prov. for Taxation 214 410 675 1,157 753 1,333 1,709 - as a % of PBT 23.4 26.7 25.2 27.8 30.2 33.2 34.0 PAT 701 1,123 2,009 3,007 1,741 2,683 3,318 - YoY Growth (%) 106.3 60.1 78.9 49.7 (42.1) 54.1 23.6 Balance sheet Y/E March (Rs cr) FY06 FY07 FY08 FY09 FY10 FY11E FY12E Share Capital 488 488 526 526 526 526 526 Reserves & Surplus 4,496 5,407 10,063 12,969 13,704 15,806 18,420 Deposits 93,932 119,882 150,012 189,708 229,762 271,119 317,209 - Growth (%) 19.2 27.6 25.1 26.5 21.1 18.0 17.0 Borrowings 5,894 6,621 7,172 9,487 14,079 16,614 19,438 Tier 2 Capital 3,297 4,759 4,946 6,186 8,320 9,984 11,782 Other Liab & Prov. 4,168 4,480 6,110 6,315 8,000 9,734 11,451 Total Liabilities 112,274 141,637 178,830 225,192 274,392 323,783 378,826 Cash balances 5,588 7,197 11,742 8,915 15,603 18,978 23,791 Bank balances 5,858 10,209 5,976 12,846 15,628 18,440 21,575 Investments 31,782 35,493 41,803 52,607 67,080 75,301 84,588 Advances 65,174 84,936 113,476 142,909 168,491 202,189 238,583 - Growth (%) 16.4 30.3 33.6 25.9 17.9 20.0 18.0 Fixed Assets 810 789 2,426 2,532 2,352 2,692 3,055 Other Assets 3,063 3,014 3,407 5,382 5,239 6,182 7,233 Total Assets 112,274 141,637 178,830 225,192 274,392 323,783 378,826 - Growth (%) 18.2 26.2 26.3 25.9 21.8 18.0 17.0 August 3, 2010 10
- 11. Bank of India | 1QFY2011 Result Update Ratio analysis Y/E March FY06 FY07 FY08 FY09 FY10 FY11E FY12E Profitability ratios (%) NIMs 2.6 2.8 2.7 2.8 2.4 2.5 2.4 Cost to Income Ratio 55.4 52.1 41.7 36.2 43.8 41.1 40.4 RoA 0.7 0.9 1.3 1.5 0.7 0.9 0.9 RoE 15.4 21.2 27.6 29.2 14.2 19.4 20.5 B/S ratios (%) CASA Ratio 35.0 32.2 30.6 26.8 27.8 27.6 27.3 Credit/Deposit Ratio 69.4 70.8 75.6 75.3 73.3 74.6 75.2 CAR 10.8 11.6 13.0 12.1 12.0 11.1 11.3 - Tier I 6.8 6.5 8.2 8.3 7.8 7.1 7.1 Asset Quality (%) Gross NPAs 3.7 2.4 1.7 1.7 2.9 2.4 2.1 Net NPAs 1.5 1.0 0.5 0.4 1.3 0.7 0.6 Slippages 1.2 1.4 1.6 1.8 2.9 2.3 2.0 Loan Loss Prov./Avg. Assets 0.5 0.4 0.4 0.3 0.7 0.5 0.4 Provision Coverage 53.7 64.5 75.6 56.1 45.0 70.2 70.1 Per Share Data (Rs) EPS 14.4 23.0 38.2 57.2 33.1 51.0 63.1 ABVPS 88.1 113.2 167.8 215.2 215.6 278.9 328.5 DPS 3.0 3.5 4.0 8.0 7.0 9.5 11.5 Valuation Ratios PER (x) 30.4 19.0 11.4 7.6 13.2 8.6 6.9 P/ABVPS (x) 5.0 3.9 2.6 2.0 2.0 1.6 1.3 Dividend Yield 0.7 0.8 0.9 1.8 1.6 2.2 2.6 DuPont Analysis (%) NII 2.5 2.7 2.6 2.7 2.3 2.4 2.4 (-) Prov. Exp. 0.8 0.7 0.6 0.6 0.9 0.6 0.5 Adj. NII 1.8 2.0 2.0 2.1 1.4 1.8 1.9 Treasury 0.1 0.2 0.2 0.4 0.2 0.0 0.0 Int. Sens. Inc. 1.9 2.2 2.2 2.5 1.7 1.9 1.9 Other Inc. 1.0 1.1 1.1 1.1 0.8 0.8 0.8 Op. Inc. 2.9 3.3 3.3 3.6 2.5 2.7 2.7 Opex 2.0 2.1 1.7 1.5 1.5 1.3 1.3 PBT 0.9 1.2 1.7 2.1 1.0 1.3 1.4 Taxes 0.2 0.3 0.4 0.6 0.3 0.4 0.5 RoA 0.7 0.9 1.3 1.5 0.7 0.9 0.9 Leverage (x) 22.7 24.0 22.0 19.6 20.3 21.6 21.7 RoE 15.4 21.2 27.6 29.2 14.2 19.4 20.5 August 3, 2010 11
- 12. Bank of India | 1QFY2011 Result Update Research Team Tel: 022 - 4040 3800 E-mail: research@angeltrade.com Website: www.angeltrade.com DISCLAIMER This document is solely for the personal information of the recipient, and must not be singularly used as the basis of any investment decision. Nothing in this document should be construed as investment or financial advice. Each recipient of this document should make such investigations as they deem necessary to arrive at an independent evaluation of an investment in the securities of the companies referred to in this document (including the merits and risks involved), and should consult their own advisors to determine the merits and risks of such an investment. Angel Broking Limited, its affiliates, directors, its proprietary trading and investment businesses may, from time to time, make investment decisions that are inconsistent with or contradictory to the recommendations expressed herein. The views contained in this document are those of the analyst, and the company may or may not subscribe to all the views expressed within. Reports based on technical and derivative analysis center on studying charts of a stock's price movement, outstanding positions and trading volume, as opposed to focusing on a company's fundamentals and, as such, may not match with a report on a company's fundamentals. The information in this document has been printed on the basis of publicly available information, internal data and other reliable sources believed to be true, but we do not represent that it is accurate or complete and it should not be relied on as such, as this document is for general guidance only. Angel Broking Limited or any of its affiliates/ group companies shall not be in any way responsible for any loss or damage that may arise to any person from any inadvertent error in the information contained in this report. Angel Broking Limited has not independently verified all the information contained within this document. Accordingly, we cannot testify, nor make any representation or warranty, express or implied, to the accuracy, contents or data contained within this document. While Angel Broking Limited endeavours to update on a reasonable basis the information discussed in this material, there may be regulatory, compliance, or other reasons that prevent us from doing so. This document is being supplied to you solely for your information, and its contents, information or data may not be reproduced, redistributed or passed on, directly or indirectly. Angel Broking Limited and its affiliates may seek to provide or have engaged in providing corporate finance, investment banking or other advisory services in a merger or specific transaction to the companies referred to in this report, as on the date of this report or in the past. Neither Angel Broking Limited, nor its directors, employees or affiliates shall be liable for any loss or damage that may arise from or in connection with the use of this information. Note: Please refer to the important `Stock Holding Disclosure' report on the Angel website (Research Section). Also, please refer to the latest update on respective stocks for the disclosure status in respect of those stocks. Angel Broking Limited and its affiliates may have investment positions in the stocks recommended in this report. Disclosure of Interest Statement Bank of India 1. Analyst ownership of the stock No 2. Angel and its Group companies ownership of the stock No 3. Angel and its Group companies' Directors ownership of the stock No 4. Broking relationship with company covered No Note: We have not considered any Exposure below Rs 1 lakh for Angel, its Group companies and Directors. Ratings (Returns): Buy (> 15%) Accumulate (5% to 15%) Neutral (-5 to 5%) Reduce (-5% to 15%) Sell (< -15%) August 3, 2010 12