Download to read offline

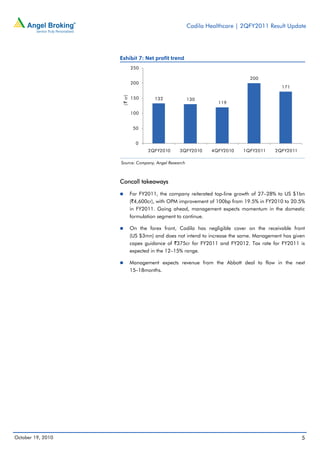
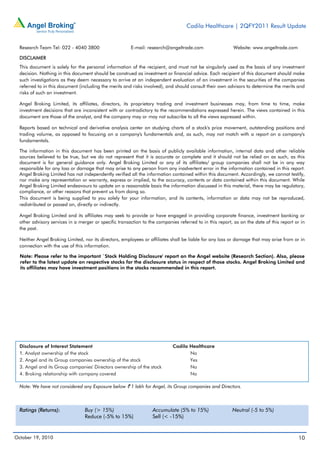

Cadila Healthcare reported strong results for the second quarter of fiscal year 2011. Net sales increased 21.2% year-over-year to 1,106 crore, ahead of analyst estimates, driven by growth in the domestic formulation, US, and Brazil businesses. Operating profit margin expanded to 21.2% compared to 18.9% in the prior year quarter, due to a favorable product mix and lower selling, general, and administrative expenses. Net profit grew 29.5% to 171 crore. For fiscal year 2011, the company reiterated its guidance of 27-28% revenue growth to 4,300-4,600 crore and a 100 basis point improvement in operating profit margin.


