1. Derivative Report
India Research
Oct 08, 2010
Comments
Nifty Vs OI
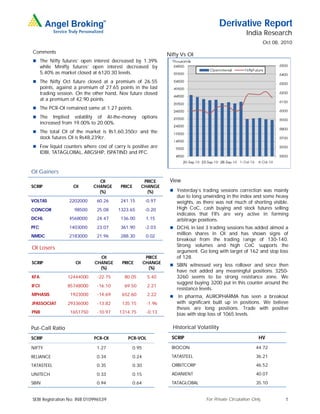
The Nifty futures’ open interest decreased by 1.39%
while Minifty futures’ open interest decreased by
5.40% as market closed at 6120.30 levels.
The Nifty Oct future closed at a premium of 26.55
points, against a premium of 27.65 points in the last
trading session. On the other hand, Nov future closed
at a premium of 42.90 points.
The PCR-OI remained same at 1.27 points.
The Implied volatility of At-the-money options
increased from 19.00% to 20.00%.
The total OI of the market is Rs1,60,350cr and the
stock futures OI is Rs48,239cr.
Few liquid counters where cost of carry is positive are
IDBI, TATAGLOBAL, ABGSHIP, ISPATIND and PFC.
OI Gainers
OI PRICE View
SCRIP OI CHANGE PRICE CHANGE
(%) (%) Yesterday’s trading sessions correction was mainly
due to long unwinding in the index and some heavy
VOLTAS 2202000 60.26 241.15 -0.97 weights, as there was not much of shorting visible.
CONCOR 98500 25.08 1323.65 -0.20 High CoC, cash buying and stock futures selling
indicates that FII's are very active in forming
DCHL 4568000 24.47 136.00 1.15 arbitrage positions.
PFC 1403000 23.07 361.90 -2.03 DCHL in last 3 trading sessions has added almost a
NMDC 2183000 21.96 288.30 0.02
million shares in OI and has shown signs of
breakout from the trading range of 130-140.
Strong volumes and high CoC supports the
OI Losers
argument. Go long with target of 162 and stop loss
OI PRICE of 128.
SCRIP OI CHANGE PRICE CHANGE
SBIN witnessed very less rollover and since then
(%) (%)
have not added any meaningful positions. 3250-
KFA 12444000 -22.75 80.05 5.40 3260 seems to be strong resistance zone. We
suggest buying 3200 put in this counter around the
IFCI 85748000 -16.10 69.50 2.21
resistance levels.
MPHASIS 1923000 -14.69 652.60 2.22 In pharma, AUROPHARMA has seen a breakout
JPASSOCIAT 29336000 -13.82 135.15 -1.96 with significant built up in positions. We believe
theses are long positions. Trade with positive
PNB 1651750 -10.97 1314.75 -0.13 bias with stop loss of 1065 levels.
Put-Call Ratio Historical Volatility
SCRIP PCR-OI PCR-VOL SCRIP HV
NIFTY 1.27 0.95 BIOCON 44.72
RELIANCE 0.34 0.24 TATASTEEL 36.21
TATASTEEL 0.35 0.30 ORBITCORP 46.52
UNITECH 0.33 0.15 ADANIENT 40.07
SBIN 0.94 0.64 TATAGLOBAL 35.10
SEBI Registration No: INB 010996539 For Private Circulation Only 1
2. Derivative Report | India Research
FII Statistics for 07-Oct-2010 Turnover on 07-Oct-2010
Open Interest
No. of Turnover Change
Detail Buy Sell Net Instrument
Contracts (Rs. in cr.) (%)
Contracts Value Change
(Rs. in cr.) (%)
INDEX Index Futures 544619 15972.05 27.46
1781.52 1845.13 (63.60) 501043 15412.02 -0.71
FUTURES
INDEX Stock Futures 877961 29246.55 7.24
4366.77 3730.15 636.62 1930424 59074.65 1.29
OPTIONS
STOCK Index Options 1666685 51761.05 9.90
1728.65 2532.86 (804.21) 1390197 42591.44 0.70
FUTURES
STOCK Stock Options 159592 5413.04 5.48
591.87 628.45 (36.58) 24590 797.48 7.26
OPTIONS
TOTAL 8468.82 8736.59 (267.78) 3846254 117875.59 0.85 Total 3248857 102392.69 11.25
Nifty Spot = 6120.30 Lot Size = 50
Bull-Call Spreads Bear-Put Spreads
Action Strike Price Risk Reward BEP Action Strike Price Risk Reward BEP
Buy 6200 86.85 Buy 6100 95.55
39.20 60.80 6239.20 30.65 69.35 6069.35
Sell 6300 47.65 Sell 6000 64.90
Buy 6200 86.85 Buy 6100 95.55
62.35 137.65 6262.35 52.65 147.35 6047.35
Sell 6400 24.50 Sell 5900 42.90
Buy 6300 47.65 Buy 6000 64.90
23.15 76.85 6323.15 22.00 78.00 5978.00
Sell 6400 24.50 Sell 5900 42.90
Note: Above mentioned Bullish or Bearish Spreads in Nifty (October Series) are given as an information and not as a recommendation
Nifty Put-Call Analysis
For Private Circulation Only SEBI Registration No: INB 010996539 2
3. Derivative Report | India Research
Strategy Date Scrip Strategy Status
04-Oct-10 JPASSOCIAT Bull Call Spread Continue
DISCLAIMER
This document is solely for the personal information of the recipient, and must not be singularly used as the basis of any investment
decision. Nothing in this document should be construed as investment or financial advice. Each recipient of this document should
make such investigations as they deem necessary to arrive at an independent evaluation of an investment in the securities of the
companies referred to in this document (including the merits and risks involved), and should consult their own advisors to determine
the merits and risks of such an investment.
Angel Broking Limited, its affiliates, directors, its proprietary trading and investment businesses may, from time to time, make
investment decisions that are inconsistent with or contradictory to the recommendations expressed herein. The views contained in this
document are those of the analyst, and the company may or may not subscribe to all the views expressed within.
Reports based on technical and derivative analysis center on studying charts of a stock's price movement, outstanding positions and
trading volume, as opposed to focusing on a company's fundamentals and, as such, may not match with a report on a company's
fundamentals.
The information in this document has been printed on the basis of publicly available information, internal data and other reliable
sources believed to be true, but we do not represent that it is accurate or complete and it should not be relied on as such, as this
document is for general guidance only. Angel Broking or any of its affiliates/ group companies shall not be in any way responsible
for any loss or damage that may arise to any person from any inadvertent error in the information contained in this report. Angel
Broking Limited has not independently verified all the information contained within this document. Accordingly, we cannot testify, nor
make any representation or warranty, express or implied, to the accuracy, contents or data contained within this document. While
Angel Broking Limited endeavours to update on a reasonable basis the information discussed in this material, there may be
regulatory, compliance, or other reasons that prevent us from doing so.
This document is being supplied to you solely for your information, and its contents, information or data may not be reproduced,
redistributed or passed on, directly or indirectly.
Angel Broking Limited and its affiliates may seek to provide or have engaged in providing corporate finance, investment banking or
other advisory services in a merger or specific transaction to the companies referred to in this report, as on the date of this report or
in the past.
Neither Angel Broking Limited, nor its directors, employees or affiliates shall be liable for any loss or damage that may arise from or
in connection with the use of this information.
Note: Please refer to the important `Stock Holding Disclosure' report on the Angel website (Research Section).
Derivative Research Team derivatives.desk@angeltrade.com
For Private Circulation Only SEBI Registration No: INB 010996539 3