Log your LOA pain with Pension Lab's brilliant campaign
Lmw ru2 qfy2011-261010
1. Please refer to important disclosures at the end of this report 1
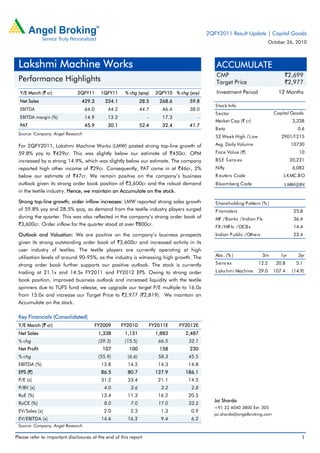
Y/E March (` cr) 2QFY11 1QFY11 % chg (qoq) 2QFY10 % chg (yoy)
Net Sales 429.3 334.1 28.5 268.6 59.8
EBITDA 64.0 44.2 44.7 46.4 38.0
EBITDA margin (%) 14.9 13.2 - 17.3 -
PAT 45.9 30.1 52.4 32.4 41.7
Source: Company, Angel Research
For 2QFY2011, Lakshmi Machine Works (LMW) posted strong top-line growth of
59.8% yoy to `429cr. This was slightly below our estimate of `450cr. OPM
increased by a strong 14.9%, which was slightly below our estimate. The company
reported high other income of `29cr. Consequently, PAT came in at `46cr, 2%
below our estimate of `47cr. We remain positive on the company’s business
outlook given its strong order book position of `3,600cr and the robust demand
in the textile industry. Hence, we maintain an Accumulate on the stock.
Strong top-line growth; order inflow increases: LMW reported strong sales growth
of 59.8% yoy and 28.5% qoq, as demand from the textile industry players surged
during the quarter. This was also reflected in the company’s strong order book of
`3,600cr. Order inflow for the quarter stood at over `800cr.
Outlook and Valuation: We are positive on the company’s business prospects
given its strong outstanding order book of `3,600cr and increased activity in its
user industry of textiles. The textile players are currently operating at high
utilisation levels of around 90-95%, as the industry is witnessing high growth. The
strong order book further supports our positive outlook. The stock is currently
trading at 21.1x and 14.5x FY2011 and FY2012 EPS. Owing to strong order
book position, improved business outlook and increased liquidity with the textile
spinners due to TUFS fund release, we upgrade our target P/E multiple to 16.0x
from 15.0x and increase our Target Price to `2,977 (`2,819). We maintain an
Accumulate on the stock.
Key Financials (Consolidated)
Y/E March (` cr) FY2009 FY2010 FY2011E FY2012E
Net Sales 1,338 1,131 1,883 2,487
% chg (39.3) (15.5) 66.5 32.1
Net Profit 107 100 158 230
% chg (55.9) (6.6) 58.3 45.5
EBITDA (%) 13.8 14.2 14.3 14.8
EPS (`) 86.5 80.7 127.9 186.1
P/E (x) 31.2 33.4 21.1 14.5
P/BV (x) 4.0 3.6 3.2 2.8
RoE (%) 13.4 11.3 16.2 20.5
RoCE (%) 8.0 7.0 17.0 23.2
EV/Sales (x) 2.0 2.3 1.3 0.9
EV/EBITDA (x) 14.6 16.2 9.4 6.2
Source: Company, Angel Research
ACCUMULATE
CMP `2,699
Target Price `2,977
Investment Period 12 Months
S tock Info
S ector
Bloomberg Code LMW@IN
S hareholding P attern (% )
P romoters 25.8
MF /Banks /Indian Fls 36.4
FII /NR Is /OCBs 14.4
Indian P ublic /Others 23.4
Abs . (% ) 3m 1yr 3yr
S ens ex 12.2 20.8 5.1
Laks hmi Machine 29.0 107.4 (14.9)
10
20,221
6,082
LKMC.BO
3,338
0.6
2901/1215
10730
Capital Goods
Avg. Daily Volume
Market Cap (` cr)
Beta
52 Week High /Low
Face Value (`)
BS E S ens ex
Nifty
R euters Code
Jai Sharda
+91 22 4040 3800 Ext: 305
jai.sharda@angelbroking.com
Lakshmi Machine Works
Performance Highlights
2QFY2011 Result Update | Capital Goods
October 26, 2010
2. Lakshmi Machine Works| 2QFY2011 Result Update
October 26, 2010 2
Exhibit 1: 2QFY2011 Performance
Y/E March (` cr) 2QFY2011 1QFY2011 % chg (qoq) 2QFY2010 % chg (yoy) FY2010 FY2009 % chg
Net Sales 429.3 334.1 28.5 268.6 59.8 1,136.9 1,338.0 (15.0)
Consumption of RM 249.7 198.4 25.8 151.4 64.9 662.0 781.6 (15.3)
(% of Sales) 58.2 59.4 56.4 58.2 58.4
Staff Costs 38.1 36.8 3.7 29.8 27.9 116.8 119.8 (2.5)
(% of Sales) 8.9 11.0 11.1 10.3 9.0
Other Expenses 77.5 54.6 41.9 41.0 88.8 193.9 255.5 (24.1)
(% of Sales) 18.0 16.3 15.3 17.1 19.1
Total Expenditure 365.3 289.8 26.0 222.2 64.4 972.7 1,156.8 (15.9)
Operating Profit 64.0 44.2 44.7 46.4 38.0 164.2 181.2 (9.3)
OPM (%) 14.9 13.2 17.3 14.4 13.5
Interest - - - - -
Depreciation 25.1 24.3 3.6 21.8 15.1 95.8 117.6 (18.5)
Other Income 28.9 25.2 14.4 24.1 19.7 82.1 90.6 (9.4)
PBT (excl. Extr. Items) 67.7 45.2 49.8 48.7 39.2 150.6 154.2 (2.3)
Extr. Income/(Expense) - - - - -
PBT (incl. Extr. Items) 67.7 45.2 49.8 48.7 39.2 150.6 154.2 -
(% of Sales) 15.8 13.5 18.1 13.2 11.5
Provision for Taxation 21.9 15.1 44.7 16.3 34.2 45.9 47.2 (2.8)
(% of PBT) 32.3 33.4 33.5 30.5 30.6
Reported PAT 45.9 30.1 52.4 32.4 41.7 104.7 107.0 -
PATM (%) 10.7 9.0 12.1 9.2 8.0
Equity shares (cr) 1.2 1.2 1.2 1.2 1.2
EPS (Rs) 37.1 24.3 52.4 26.2 41.7 84.6 86.5 -
Adjusted PAT 45.9 30.1 52.4 32.4 41.7 104.7 107.0 (2.1)
Source: Company, Angel Research
Segment-wise performance
The company’s textile machinery division sales grew 61.4% yoy during the quarter
to `385cr (`238cr). The division reported EBIT margin of 13.5% during the quarter
compared to 15.3% in 2QFY2010. The other divisions recorded sales growth of
45.4% yoy to `60cr (`41cr). EBIT of the other divisions stood at `3.1cr.
Exhibit 2: Segment-wise performance
Y/E March (` cr) 2QFY2011 1QFY2011 2QFY2010 % chg (qoq) % chg (yoy)
Total Revenue
A) Textile Machinery 385 303 238 27.0 61.4
B) Others 60 45 41 33.5 45.4
Total 444 348 279 27.8 59.1
Less: Inter-Segmental Rev. 1 1 1 76.5 27.5
Net Sales 443 347 278 27.7 59.2
EBIT Margin (%)
A) Textile Machinery 13.5 10.3 15.3 318bp (180bp)
B) Others 5.2 6.3 2.3 (107bp) 295bp
Source: Company, Angel Research
3. Lakshmi Machine Works| 2QFY2011 Result Update
October 26, 2010 3
Top-line continues increasing trend
For 2QFY2011, LMW continued its increasing trend in top-line growth, after
having taken a hit during the economic crisis. Quarterly sales increased from
`181cr in 4QFY2009 to `429cr in 2QFY2011, as the company has been
witnessing a steady improvement in its business. We expect this trend to continue
going ahead as well, as demand from the textile players continues to remain
strong.
Exhibit 3: Sales trend
Source: Company, Angel Research
Margins remain strong at 14.9%
The company reported strong OPM of 14.9% for the quarter, 167bp above
1QFY2011. The company has been reporting robust margins over recent quarters
owing to improvement in business.
Exhibit 4: OPM trend
Source: Company, Angel Research
(80.0)
(60.0)
(40.0)
(20.0)
0.0
20.0
40.0
60.0
80.0
100.0
120.0
0
50
100
150
200
250
300
350
400
450
500
3QFY09
4QFY09
1QFY10
2QFY10
3QFY10
4QFY10
1QFY11
2QFY11
(%)
(`cr) Sales (LHS) yoy Growth (RHS)
(5.0)
0.0
5.0
10.0
15.0
20.0
(10)
0
10
20
30
40
50
60
70
3QFY09
4QFY09
1QFY10
2QFY10
3QFY10
4QFY10
1QFY11
2QFY11
(%)
(`cr)
EBITDA (LHS) OPM (RHS)
4. Lakshmi Machine Works| 2QFY2011 Result Update
October 26, 2010 4
PAT increases to Rs46cr
PAT increased 41.7% yoy in the quarter to `46cr after remaining steady at nearly
`30cr in earlier few quarters. Going ahead, we expect profit to further increase, as
the underlying business scenario continues to improve.
Exhibit 5: Profit trend
Source: Company, Angel Research
Management call – Key takeaways
Order book at the end of the quarter rose to `3,600cr from `3,200cr at the
end of 1QFY2011.
1HFY2011 witnessed order inflow of `1,240cr.
The company is currently quoting a delivery period of 10-12 months,
indicating consistent and strong growth in demand.
Management expects to maintain current margin levels.
The liquidity situation in the textile industry is good owing to funds released
under the TUFS scheme. This would translate into higher off-take of LMW’s
products. This is further backed by bumper profit being booked by the textile
manufacturers.
The progress in the Chinese subsidiary is steady. There is no dearth of orders,
but it will take time for execution to improve.
0
5
10
15
20
25
30
35
40
45
50
3QFY09
4QFY09
1QFY10
2QFY10
3QFY10
4QFY10
1QFY11
2QFY11
(`cr)
5. Lakshmi Machine Works| 2QFY2011 Result Update
October 26, 2010 5
Investment Arguments
Ability to defend market share: LMW is one of the largest players in the world and
one of only three players globally that manufacture the entire range of spinning
machinery. In India, it has high market share of around 70% in yarn spinning and
preparatory machines. It has been able to sustain this market share on the back of
strong after-sales service coupled with providing world’s best technology to
customers at the cheapest rates. LMW has service centres at all the textile hubs
across the country, which gives it a strong advantage over its European peers, who
at the most have service centres in only 3-4 cities. LMW also enjoys an edge over
competition as it caters to a huge 1,300 domestic textile players out of the total
universe of around 1,600. The company has been innovating on technology for
the past 15 years. In terms of prices, LMW’s products are at least 10% cheaper
than its European peers who have manufacturing base in India.
Strong order book to translate into robust sales growth: LMW has a strong order
book of `3,600cr. The upturn in the spinning industry has lent a boost to the
company’s order inflow. The yarn prices have increased at 15.0% CAGR over the
last two years and most listed yarn manufacturers surveyed by us are operating at
utilisation rates of around 95%. This indicates that there is low probability of order
deferments and the company’s robust order book is expected to result in strong
growth.
Outlook and Valuation
We are positive on the company’s business prospects given the strong demand
from the user industry of textiles. A number of textile players are operating at high
utilisation levels of 90-95% and to increase production further would have to
increase capacity. This augurs well for LMW, as it is the largest textile machinery
player in India. Our view is backed by the company’s large order book to
`3,600cr. Thus, on the back of positive business outlook and strong order book
position, we expect sales to increase at a CAGR of 48.3% over FY2010-12 to
`2,487cr. We expect PAT to clock CAGR of 51.8% to `230cr over the period.
The stock is currently trading at 21.1x and 14.5x FY2011E and FY2012E EPS.
Owing to strong order book, robust business outlook and increased liquidity with
the textile spinning players, we have upgraded our target P/E multiple of the
company from 15.0x to 16.0x. We maintain an Accumulate on the stock, with a
revised Target Price of `2,977 (`2,819).
Exhibit 6: Result: Actual vs Estimated
Actual Estimated Difference (%)
Sales (` cr) 429 451 (4.8)
EBITDA (` cr) 64.0 72.1 (11.2)
OPM (%) 14.9% 16.0% (110 bps)
PAT (` cr) 45.9 47.5 (3.4)
Source: Company, Angel Research
6. Lakshmi Machine Works| 2QFY2011 Result Update
October 26, 2010 6
Exhibit 7: Key assumptions
FY2011E FY2012E Remarks
Sales in Chinese subsidiary (` cr) 80.0 120.0 Sales to increase as company gains foothold in China
Sales growth rate (%) 66.5 32.1 High growth due to improvement in business outlook
OPM (%) 14.3 14.8 OPM to increase on operating leverage
Tax Rate (%) 20.0 22.0 Higher production in Pune plant to result in higher tax
Source: Angel Research
Exhibit 8: Peer valuation
Company Mcap CMP EPS (`) P/E (x) P/BV (x) RoE (%)
(` cr) (`) FY11E FY12E FY11E FY12E FY11E FY12E FY11E FY12E
LMW 3,338 2,699 21.1 14.5 127.9 186.1 3.2 2.8 16.2 20.5
Kirloskar Brothers 1,859 234 19.1 22.1 12.3 10.6 2.0 1.8 18.3 16.5
Cummins 14,836 749 30.1 37.5 24.9 20.0 7.9 6.6 33.1 32.9
Source: Company, Bloomberg, Angel Research
Exhibit 9: One year forward P/E
Source: Company, Bloomberg, Angel Research
0
500
1000
1500
2000
2500
3000
3500
4000
4500
Mar-00
Oct-00
Apr-01
Oct-01
Apr-02
Oct-02
Apr-03
Oct-03
Apr-04
Oct-04
Apr-05
Oct-05
Apr-06
Oct-06
Apr-07
Oct-07
Apr-08
Oct-08
Apr-09
Oct-09
Apr-10
Oct-10
SharePrice(`)
Price 8x 10x 13x 16x 20x
10. Lakshmi Machine Works| 2QFY2011 Result Update
October 26, 2010 10
Research Team Tel: 022 - 4040 3800 E-mail: research@angeltrade.com Website: www.angeltrade.com
DISCLAIMER
This document is solely for the personal information of the recipient, and must not be singularly used as the basis of any investment
decision. Nothing in this document should be construed as investment or financial advice. Each recipient of this document should make
such investigations as they deem necessary to arrive at an independent evaluation of an investment in the securities of the companies
referred to in this document (including the merits and risks involved), and should consult their own advisors to determine the merits and
risks of such an investment.
Angel Broking Limited, its affiliates, directors, its proprietary trading and investment businesses may, from time to time, make
investment decisions that are inconsistent with or contradictory to the recommendations expressed herein. The views contained in this
document are those of the analyst, and the company may or may not subscribe to all the views expressed within.
Reports based on technical and derivative analysis center on studying charts of a stock's price movement, outstanding positions and
trading volume, as opposed to focusing on a company's fundamentals and, as such, may not match with a report on a company's
fundamentals.
The information in this document has been printed on the basis of publicly available information, internal data and other reliable
sources believed to be true, but we do not represent that it is accurate or complete and it should not be relied on as such, as this
document is for general guidance only. Angel Broking Limited or any of its affiliates/ group companies shall not be in any way
responsible for any loss or damage that may arise to any person from any inadvertent error in the information contained in this report.
Angel Broking Limited has not independently verified all the information contained within this document. Accordingly, we cannot testify,
nor make any representation or warranty, express or implied, to the accuracy, contents or data contained within this document. While
Angel Broking Limited endeavours to update on a reasonable basis the information discussed in this material, there may be regulatory,
compliance, or other reasons that prevent us from doing so.
This document is being supplied to you solely for your information, and its contents, information or data may not be reproduced,
redistributed or passed on, directly or indirectly.
Angel Broking Limited and its affiliates may seek to provide or have engaged in providing corporate finance, investment banking or
other advisory services in a merger or specific transaction to the companies referred to in this report, as on the date of this report or in
the past.
Neither Angel Broking Limited, nor its directors, employees or affiliates shall be liable for any loss or damage that may arise from or in
connection with the use of this information.
Note: Please refer to the important `Stock Holding Disclosure' report on the Angel website (Research Section). Also, please
refer to the latest update on respective stocks for the disclosure status in respect of those stocks. Angel Broking Limited and
its affiliates may have investment positions in the stocks recommended in this report.
Disclosure of Interest Statement Lakshmi Machine Works
1. Analyst ownership of the stock No
2. Angel and its Group companies ownership of the stock No
3. Angel and its Group companies' Directors ownership of the stock No
4. Broking relationship with company covered No
Note: We have not considered any Exposure below ` 1 lakh for Angel, its Group companies and Directors.
Ratings (Returns): Buy (> 15%) Accumulate (5% to 15%) Neutral (-5 to 5%)
Reduce (-5% to 15%) Sell (< -15%)