Call Girls Miyapur 7001305949 all area service COD available Any Time
Derivatives report 23 june-2010
1. Derivative Report
India Research
June 23, 2010
Comments
Nifty Vs OI
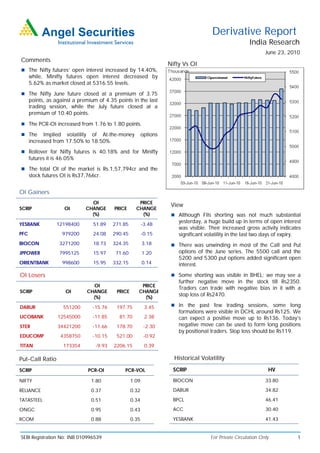
The Nifty futures’ open interest increased by 14.40%,
while, Minifty futures open interest decreased by
5.62% as market closed at 5316.55 levels.
The Nifty June future closed at a premium of 3.75
points, as against a premium of 4.35 points in the last
trading session, while the July future closed at a
premium of 10.40 points.
The PCR-OI increased from 1.76 to 1.80 points.
The Implied volatility of At-the-money options
increased from 17.50% to 18.50%.
Rollover for Nifty futures is 40.18% and for Minifty
futures it is 46.05%
The total OI of the market is Rs.1,57,794cr and the
stock futures OI is Rs37,766cr.
OI Gainers
OI PRICE
View
SCRIP OI CHANGE PRICE CHANGE
(%) (%) Although FIIs shorting was not much substantial
YESBANK 12198400 51.89 271.85 -3.48
yesterday, a huge build up in terms of open interest
was visible. Their increased gross activity indicates
PFC 979200 24.08 290.45 -0.15 significant volatility in the last two days of expiry.
BIOCON 3271200 18.73 324.35 3.18 There was unwinding in most of the Call and Put
JPPOWER 7995125 15.97 71.60 1.20 options of the June series. The 5500 call and the
5200 and 5300 put options added significant open
ORIENTBANK 998600 15.95 332.15 0.14 interest.
OI Losers Some shorting was visible in BHEL; we may see a
further negative move in the stock till Rs2350.
OI PRICE
Traders can trade with negative bias in it with a
SCRIP OI CHANGE PRICE CHANGE
(%) (%)
stop loss of Rs2470.
DABUR 551200 -15.76 197.75 3.45 In the past few trading sessions, some long
formations were visible in DCHL around Rs125. We
UCOBANK 12545000 -11.85 81.70 2.38 can expect a positive move up to Rs136. Today’s
STER 34421200 -11.66 178.70 -2.30 negative move can be used to form long positions
by positional traders. Stop loss should be Rs119.
EDUCOMP 4358750 -10.15 521.00 -0.92
TITAN 173354 -9.93 2206.15 0.39
Put-Call Ratio Historical Volatility
SCRIP PCR-OI PCR-VOL SCRIP HV
NIFTY 1.80 1.09 BIOCON 33.80
RELIANCE 0.37 0.32 DABUR 34.82
TATASTEEL 0.51 0.34 BPCL 46.41
ONGC 0.95 0.43 ACC 30.40
RCOM 0.88 0.35 YESBANK 41.43
SEBI Registration No: INB 010996539 For Private Circulation Only 1
2. Derivative Report | India Research
FII Statistics for 22-June-2010 Turnover on 22-June-2010
Open Interest
No. of Turnover Change
Detail Buy Sell Net Instrument
Contracts (Rs. in cr.) (%)
Contracts Value Change
(Rs. in cr.) (%)
INDEX Index Futures 912553 23180.11 27.74
8096.09 8310.99 (214.90) 803520 21285.14 35.58
FUTURES
INDEX Stock Futures 946822 27909.38 8.00
6506.80 4889.35 1,617.45 2279793 60566.80 3.34
OPTIONS
STOCK Index Options 2342613 62083.76 -13.82
6027.00 6773.29 (746.29) 1096444 30449.47 1.06
FUTURES
STOCK Stock Options 97995 3206.26 -14.25
194.62 251.96 (57.33) 48343 1581.81 1.35
OPTIONS
TOTAL 20824.52 20225.59 598.93 4228100 113883.23 7.54 Total 4299983 116379.52 -2.83
Nifty Spot = 5316.55 Lot Size = 50
Bull-Call Spreads Bear-Put Spreads
Action Strike Price Risk Reward BEP Action Strike Price Risk Reward BEP
Buy 5400 6.35 Buy 5300 22.40
5.10 94.90 5405.10 18.05 81.95 5281.95
Sell 5500 1.25 Sell 5200 4.35
Buy 5400 6.35 Buy 5300 22.40
5.45 194.55 5405.45 20.75 179.25 5279.25
Sell 5600 0.90 Sell 5100 1.65
Buy 5500 1.25 Buy 5200 4.35
0.35 99.65 5500.35 2.70 97.30 5197.30
Sell 5600 0.90 Sell 5100 1.65
Note: Above mentioned Bullish or Bearish Spreads in Nifty (June Series) are given as an information and not as a recommendation
Nifty Put-Call Analysis
For Private Circulation Only SEBI Registration No: INB 010996539 2
3. Derivative Report | India Research
Strategy Date Scrip Strategy Status
31-May-2010 Nifty Long Put Ladder Continue
07-Jun-2010 HINDUNILVR Ratio Put Spread Continue
07-Jun-2010 RCOM Ratio Put Spread Continue
14-Jun-2010 HINDALCO Ratio Call Spread Continue
14-Jun-2010 LT Short Straddle Loss Booked on 17-Jun-2010
21-Jun-2010 ICICIBANK Long Put Did not trigger
21-Jun-2010 ASHOKLEY Long Call Continue
DISCLAIMER:
This document is not for public distribution and has been furnished to you solely for your information and must not be reproduced or redistributed to any other person.
Persons into whose possession this document may come are required to observe these restrictions.
Opinion expressed is our current opinion as of the date appearing on this material only. While we endeavor to update on a reasonable basis the information discussed in
this material, there may be regulatory, compliance, or other reasons that prevent us from doing so. Prospective investors and others are cautioned that any forward-
looking statements are not predictions and may be subject to change without notice. Our proprietary trading and investment businesses may make investment decisions
that are inconsistent with the recommendations expressed herein.
The information in this document has been printed on the basis of publicly available information, internal data and other reliable sources believed to be true and are for
general guidance only. While every effort is made to ensure the accuracy and completeness of information contained, the company takes no guarantee and assumes no
liability for any errors or omissions of the information. No one can use the information as the basis for any claim, demand or cause of action.
Recipients of this material should rely on their own investigations and take their own professional advice. Each recipient of this document should make such investigations
as it deems necessary to arrive at an independent evaluation of an investment in the securities of companies referred to in this document (including the merits and risks
involved), and should consult their own advisors to determine the merits and risks of such an investment. Price and value of the investments referred to in this material may
go up or down. Past performance is not a guide for future performance.
Certain transactions - futures, options and other derivatives as well as non-investment grade securities - involve substantial risks and are not suitable for all investors.
Reports based on technical analysis centers on studying charts of a stock's price movement and trading volume, as opposed to focusing on a company's fundamentals and
as such, may not match with a report on a company's fundamentals.
We do not undertake to advise you as to any change of our views expressed in this document. While we would endeavor to update the information herein on a reasonable
basis, Angel Broking, its subsidiaries and associated companies, their directors and employees are under no obligation to update or keep the information current. Also
there may be regulatory, compliance, or other reasons that may prevent Angel Broking and affiliates from doing so. Prospective investors and others are cautioned that
any forward-looking statements are not predictions and may be subject to change without notice.
Angel Broking Limited and affiliates, including the analyst who has issued this report, may, on the date of this report, and from time to time, have long or short positions
in, and buy or sell the securities of the companies mentioned herein or engage in any other transaction involving such securities and earn brokerage or compensation or
act as advisor or have other potential conflict of interest with respect to company/ies mentioned herein or inconsistent with any recommendation and related information
and opinions.
Angel Broking Limited and affiliates may seek to provide or have engaged in providing corporate finance, investment banking or other advisory services in a merger or
specific transaction to the companies referred to in this report, as on the date of this report or in the past.
Sebi Registration No.: INB 010996539
Derivative Research Team derivatives.desk@angeltrade.com
For Private Circulation Only SEBI Registration No: INB 010996539 3