1. Derivative Report
India Research
Sep 07, 2010
Comments
Nifty Vs OI
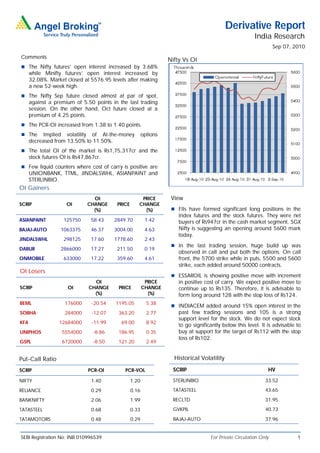
The Nifty futures’ open interest increased by 3.68%
while Minifty futures’ open interest increased by
32.08%. Market closed at 5576.95 levels after making
a new 52-week high.
The Nifty Sep future closed almost at par of spot,
against a premium of 5.50 points in the last trading
session. On the other hand, Oct future closed at a
premium of 4.25 points.
The PCR-OI increased from 1.38 to 1.40 points.
The Implied volatility of At-the-money options
decreased from 13.50% to 11.50%.
The total OI of the market is Rs1,75,317cr and the
stock futures OI is Rs47,867cr.
Few liquid counters where cost of carry is positive are
UNIONBANK, TTML, JINDALSWHL, ASIANPAINT and
STERLINBIO.
OI Gainers
OI PRICE View
SCRIP OI CHANGE PRICE CHANGE
(%) (%) FIIs have formed significant long positions in the
Index futures and the stock futures. They were net
ASIANPAINT 125750 58.43 2849.70 1.42 buyers of Rs947cr in the cash market segment. SGX
BAJAJ-AUTO 1063375 46.37 3004.00 4.63 Nifty is suggesting an opening around 5600 mark
today.
JINDALSWHL 298125 17.60 1778.60 2.43
In the last trading session, huge build up was
DABUR 2866000 17.27 211.50 0.19
observed in call and put both the options. On call
ONMOBILE 633000 17.22 359.60 4.61 front, the 5700 strike while in puts, 5500 and 5600
strike, each added around 50000 contracts.
OI Losers
ESSAROIL is showing positive move with increment
OI PRICE in positive cost of carry. We expect positive move to
SCRIP OI CHANGE PRICE CHANGE continue up to Rs135. Therefore, it is advisable to
(%) (%) form long around 128 with the stop loss of Rs124.
BEML 176000 -20.54 1195.05 5.38
INDIACEM added around 15% open interest in the
SOBHA 284000 -12.07 363.20 2.77 past few trading sessions and 105 is a strong
support level for the stock. We do not expect stock
KFA 12684000 -11.99 69.00 8.92
to go significantly below this level. It is advisable to
UNIPHOS 5554000 -8.86 186.95 0.35 buy at support for the target of Rs112 with the stop
loss of Rs102.
GSPL 6720000 -8.50 121.20 2.49
Put-Call Ratio Historical Volatility
SCRIP PCR-OI PCR-VOL SCRIP HV
NIFTY 1.40 1.20 STERLINBIO 33.52
RELIANCE 0.29 0.16 TATASTEEL 43.65
BANKNIFTY 2.06 1.99 RECLTD 31.95
TATASTEEL 0.68 0.33 GVKPIL 40.73
TATAMOTORS 0.48 0.29 BAJAJ-AUTO 37.96
SEBI Registration No: INB 010996539 For Private Circulation Only 1
2. Derivative Report | India Research
FII Statistics for 06-Sep-2010 Turnover on 06-Sep-2010
Open Interest
No. of Turnover Change
Detail Buy Sell Net Instrument
Contracts (Rs. in cr.) (%)
Contracts Value Change
(Rs. in cr.) (%)
INDEX Index Futures 559069 14493.82 78.44
2581.48 1761.02 820.46 609698 16937.89 3.89
FUTURES
INDEX Stock Futures 636113 19192.26 27.47
6000.77 3604.52 2,396.25 2465223 68744.25 2.24
OPTIONS
STOCK Index Options 2759406 75906.79 94.01
1616.97 969.45 647.52 1301141 36790.37 1.11
FUTURES
STOCK Stock Options 157308 4805.83 62.85
459.10 463.37 (4.28) 29226 845.64 6.06
OPTIONS
TOTAL 10658.31 6798.37 3,859.94 4405288 123318.15 2.15 Total 4111896 114398.7 75.31
Nifty Spot = 5576.95 Lot Size = 50
Bull-Call Spreads Bear-Put Spreads
Action Strike Price Risk Reward BEP Action Strike Price Risk Reward BEP
Buy 5600 53.60 Buy 5500 42.40
35.70 64.30 5635.70 17.65 82.35 5482.35
Sell 5700 17.90 Sell 5400 24.75
Buy 5600 53.60 Buy 5500 42.40
47.80 152.20 5647.80 28.35 171.65 5471.65
Sell 5800 5.80 Sell 5300 14.05
Buy 5700 17.90 Buy 5400 24.75
12.10 87.90 5712.10 10.70 89.30 5389.30
Sell 5800 5.80 Sell 5300 14.05
Note: Above mentioned Bullish or Bearish Spreads in Nifty (September Series) are given as an information and not as a recommendation
Nifty Put-Call Analysis
For Private Circulation Only SEBI Registration No: INB 010996539 2
3. Derivative Report | India Research
Strategy Date Scrip Strategy Status
30-Aug-10 RELINFRA Long Call Ladder Continue
06-Sep-10 BHARTIARTL Ratio Put Spread Continue
DISCLAIMER
This document is solely for the personal information of the recipient, and must not be singularly used as the basis of any investment
decision. Nothing in this document should be construed as investment or financial advice. Each recipient of this document should
make such investigations as they deem necessary to arrive at an independent evaluation of an investment in the securities of the
companies referred to in this document (including the merits and risks involved), and should consult their own advisors to determine
the merits and risks of such an investment.
Angel Broking Limited, its affiliates, directors, its proprietary trading and investment businesses may, from time to time, make
investment decisions that are inconsistent with or contradictory to the recommendations expressed herein. The views contained in this
document are those of the analyst, and the company may or may not subscribe to all the views expressed within.
Reports based on technical and derivative analysis center on studying charts of a stock's price movement, outstanding positions and
trading volume, as opposed to focusing on a company's fundamentals and, as such, may not match with a report on a company's
fundamentals.
The information in this document has been printed on the basis of publicly available information, internal data and other reliable
sources believed to be true, but we do not represent that it is accurate or complete and it should not be relied on as such, as this
document is for general guidance only. Angel Broking or any of its affiliates/ group companies shall not be in any way responsible
for any loss or damage that may arise to any person from any inadvertent error in the information contained in this report. Angel
Broking Limited has not independently verified all the information contained within this document. Accordingly, we cannot testify, nor
make any representation or warranty, express or implied, to the accuracy, contents or data contained within this document. While
Angel Broking Limited endeavours to update on a reasonable basis the information discussed in this material, there may be
regulatory, compliance, or other reasons that prevent us from doing so.
This document is being supplied to you solely for your information, and its contents, information or data may not be reproduced,
redistributed or passed on, directly or indirectly.
Angel Broking Limited and its affiliates may seek to provide or have engaged in providing corporate finance, investment banking or
other advisory services in a merger or specific transaction to the companies referred to in this report, as on the date of this report or
in the past.
Neither Angel Broking Limited, nor its directors, employees or affiliates shall be liable for any loss or damage that may arise from or
in connection with the use of this information.
Note: Please refer to the important `Stock Holding Disclosure' report on the Angel website (Research Section).
Derivative Research Team
For Private Circulation Only SEBI Registration No: INB 010996539 derivatives.desk@angeltrade.com3