Downloaded 790 times
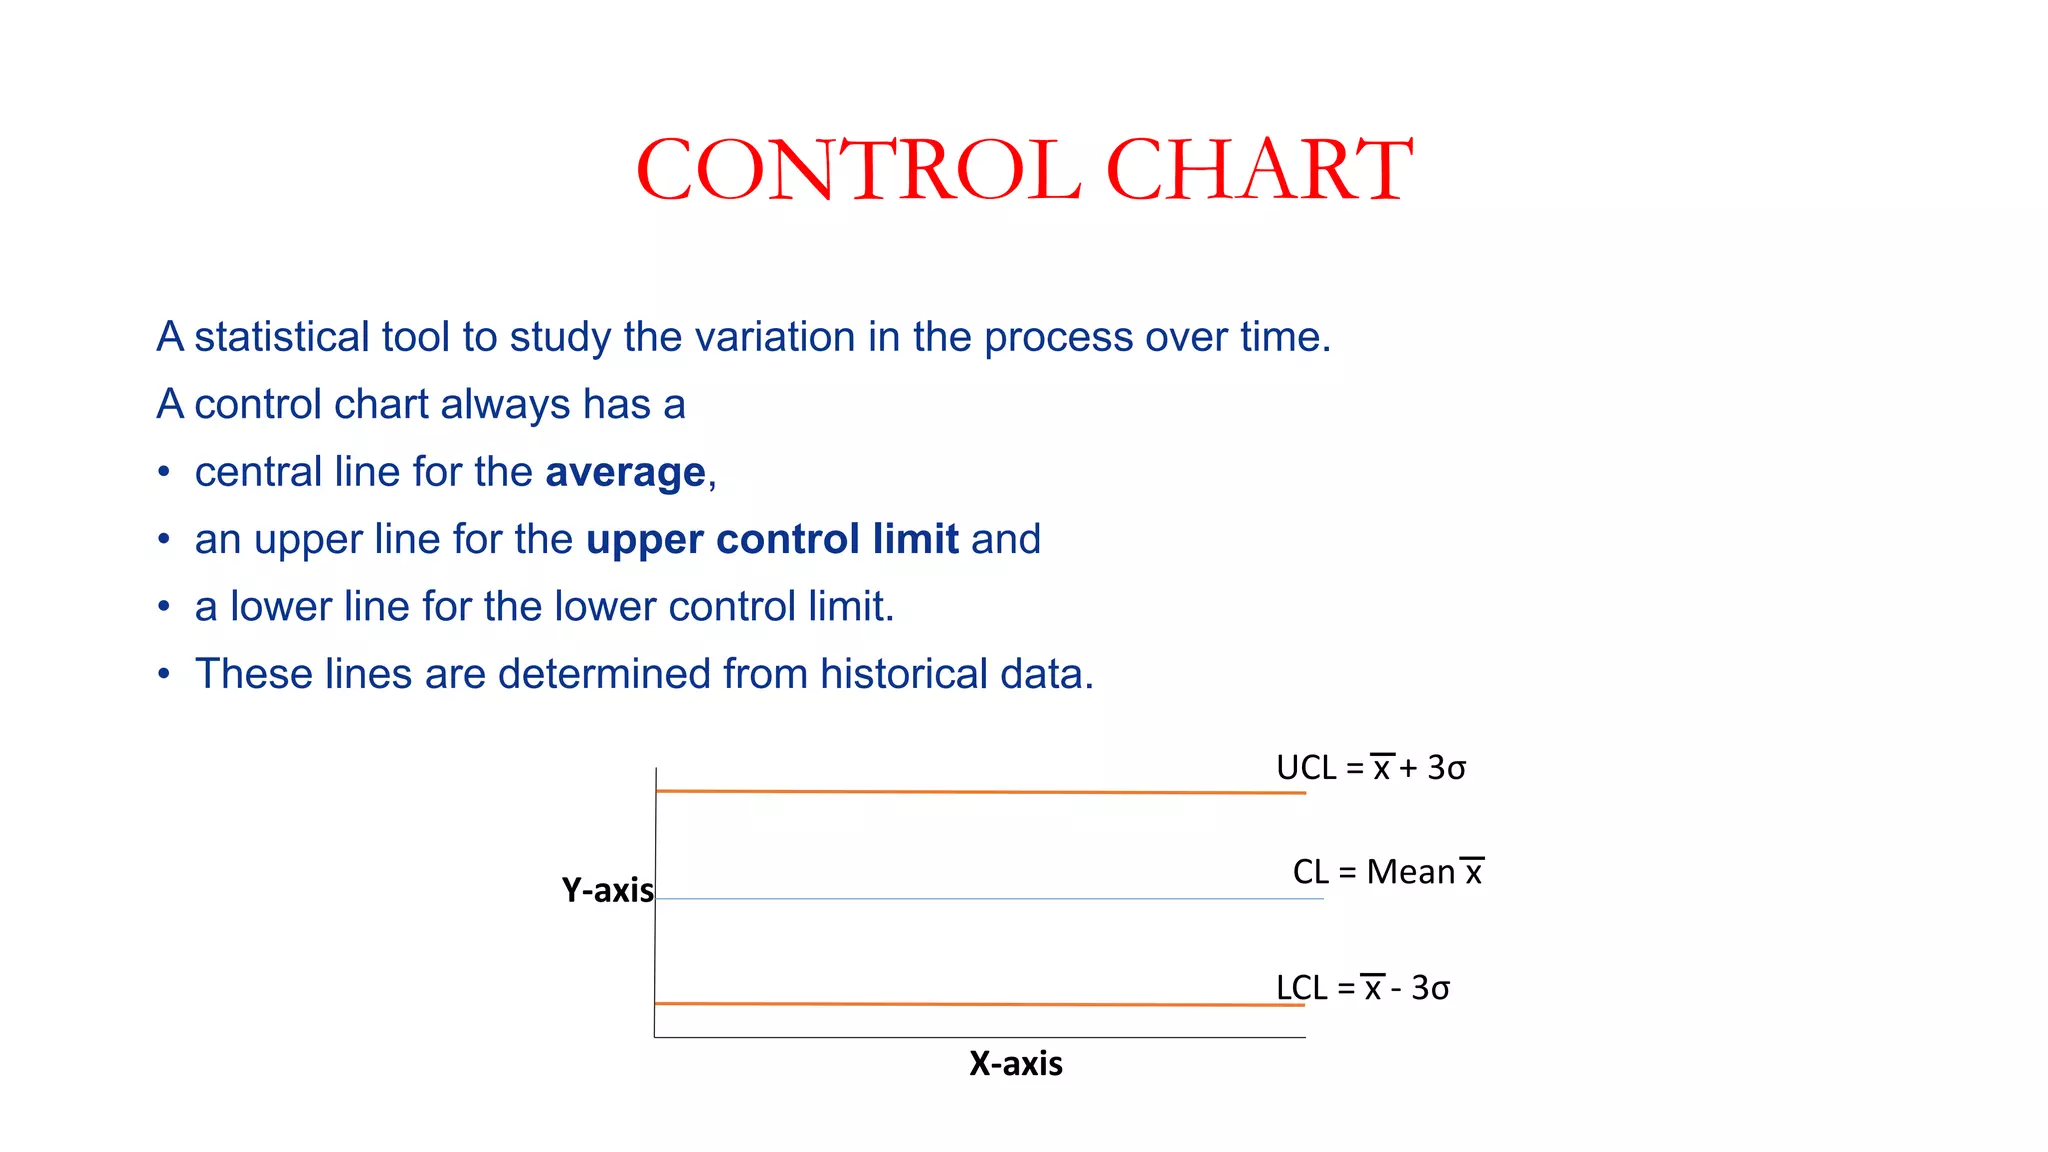

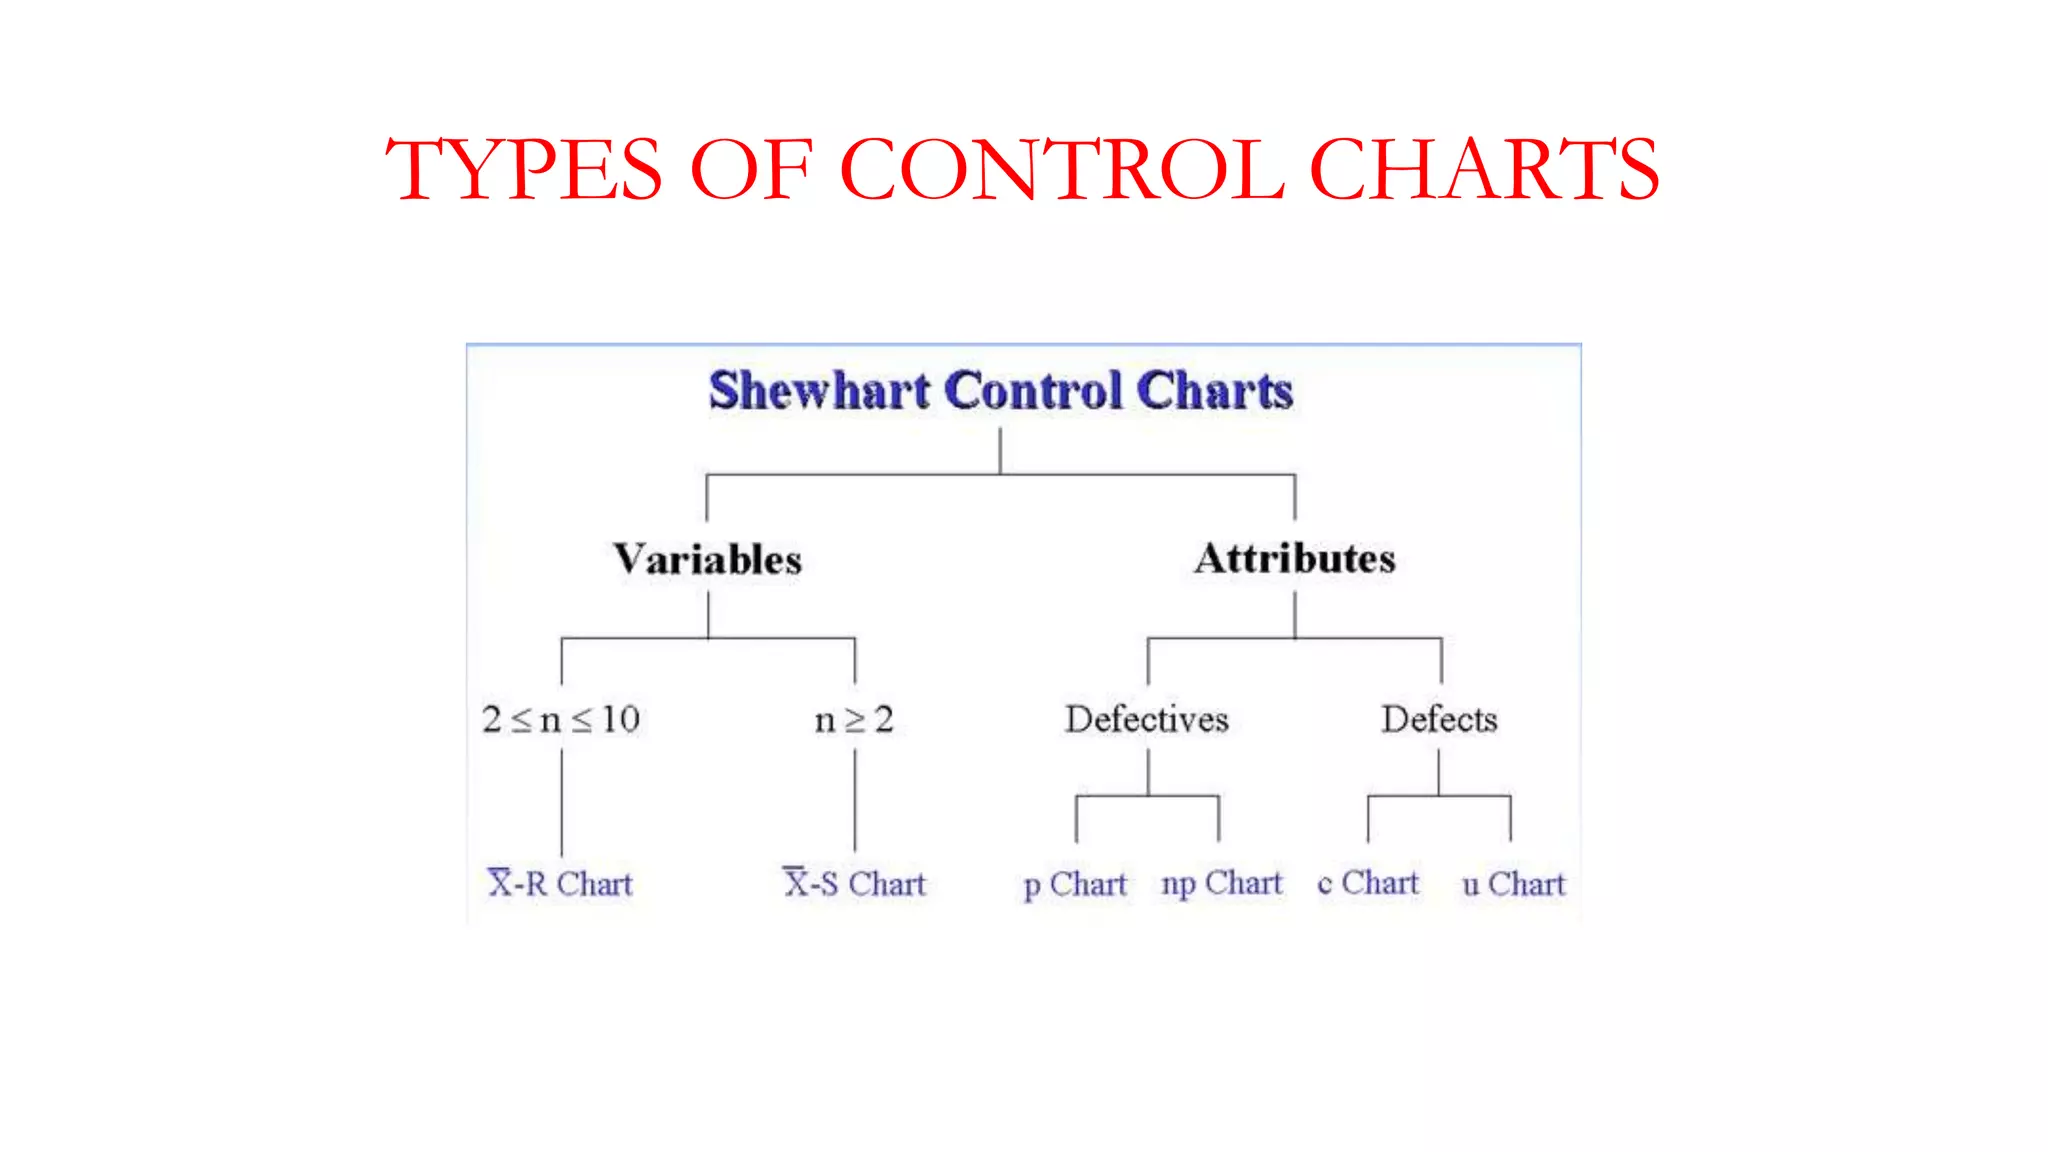
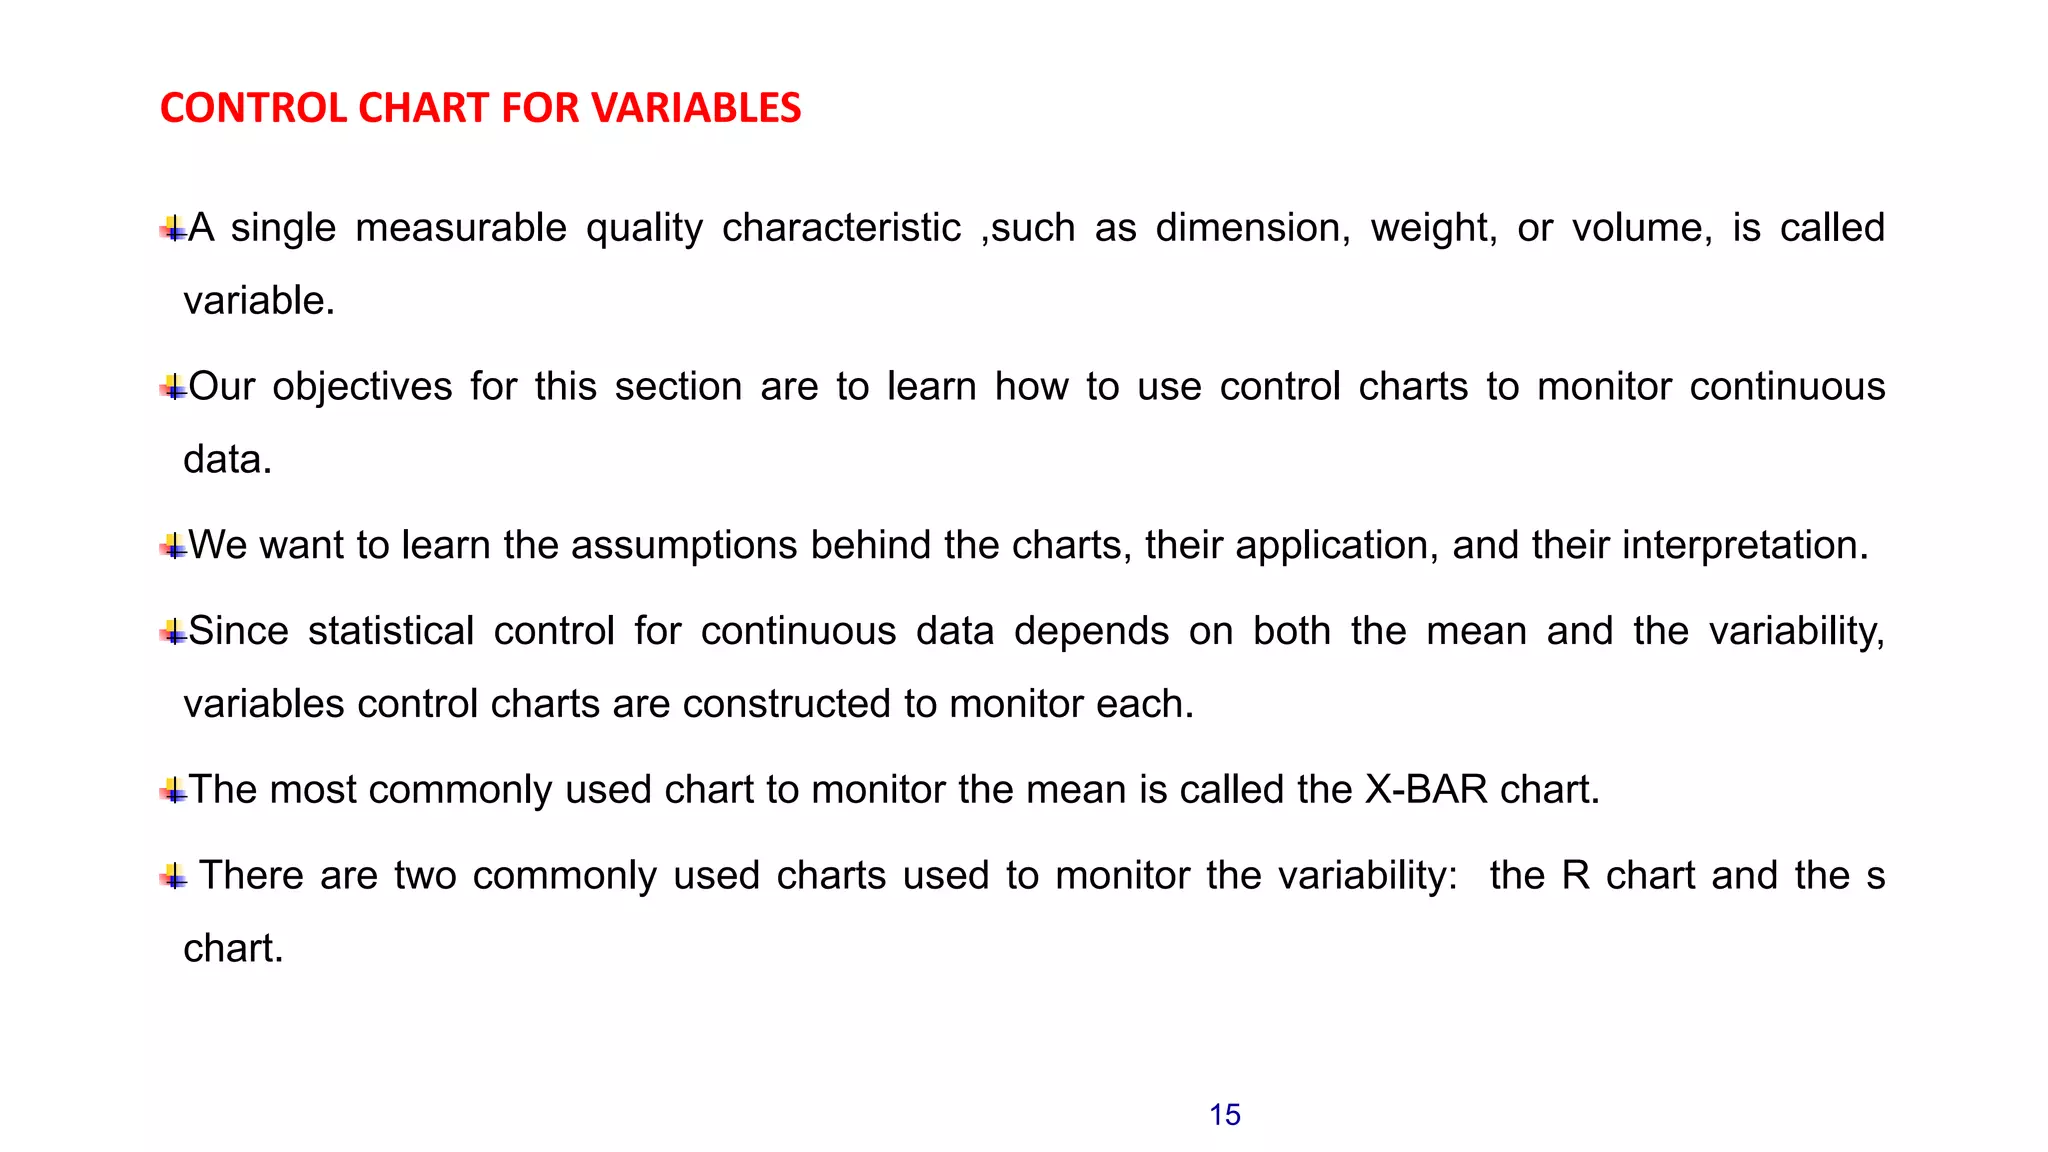
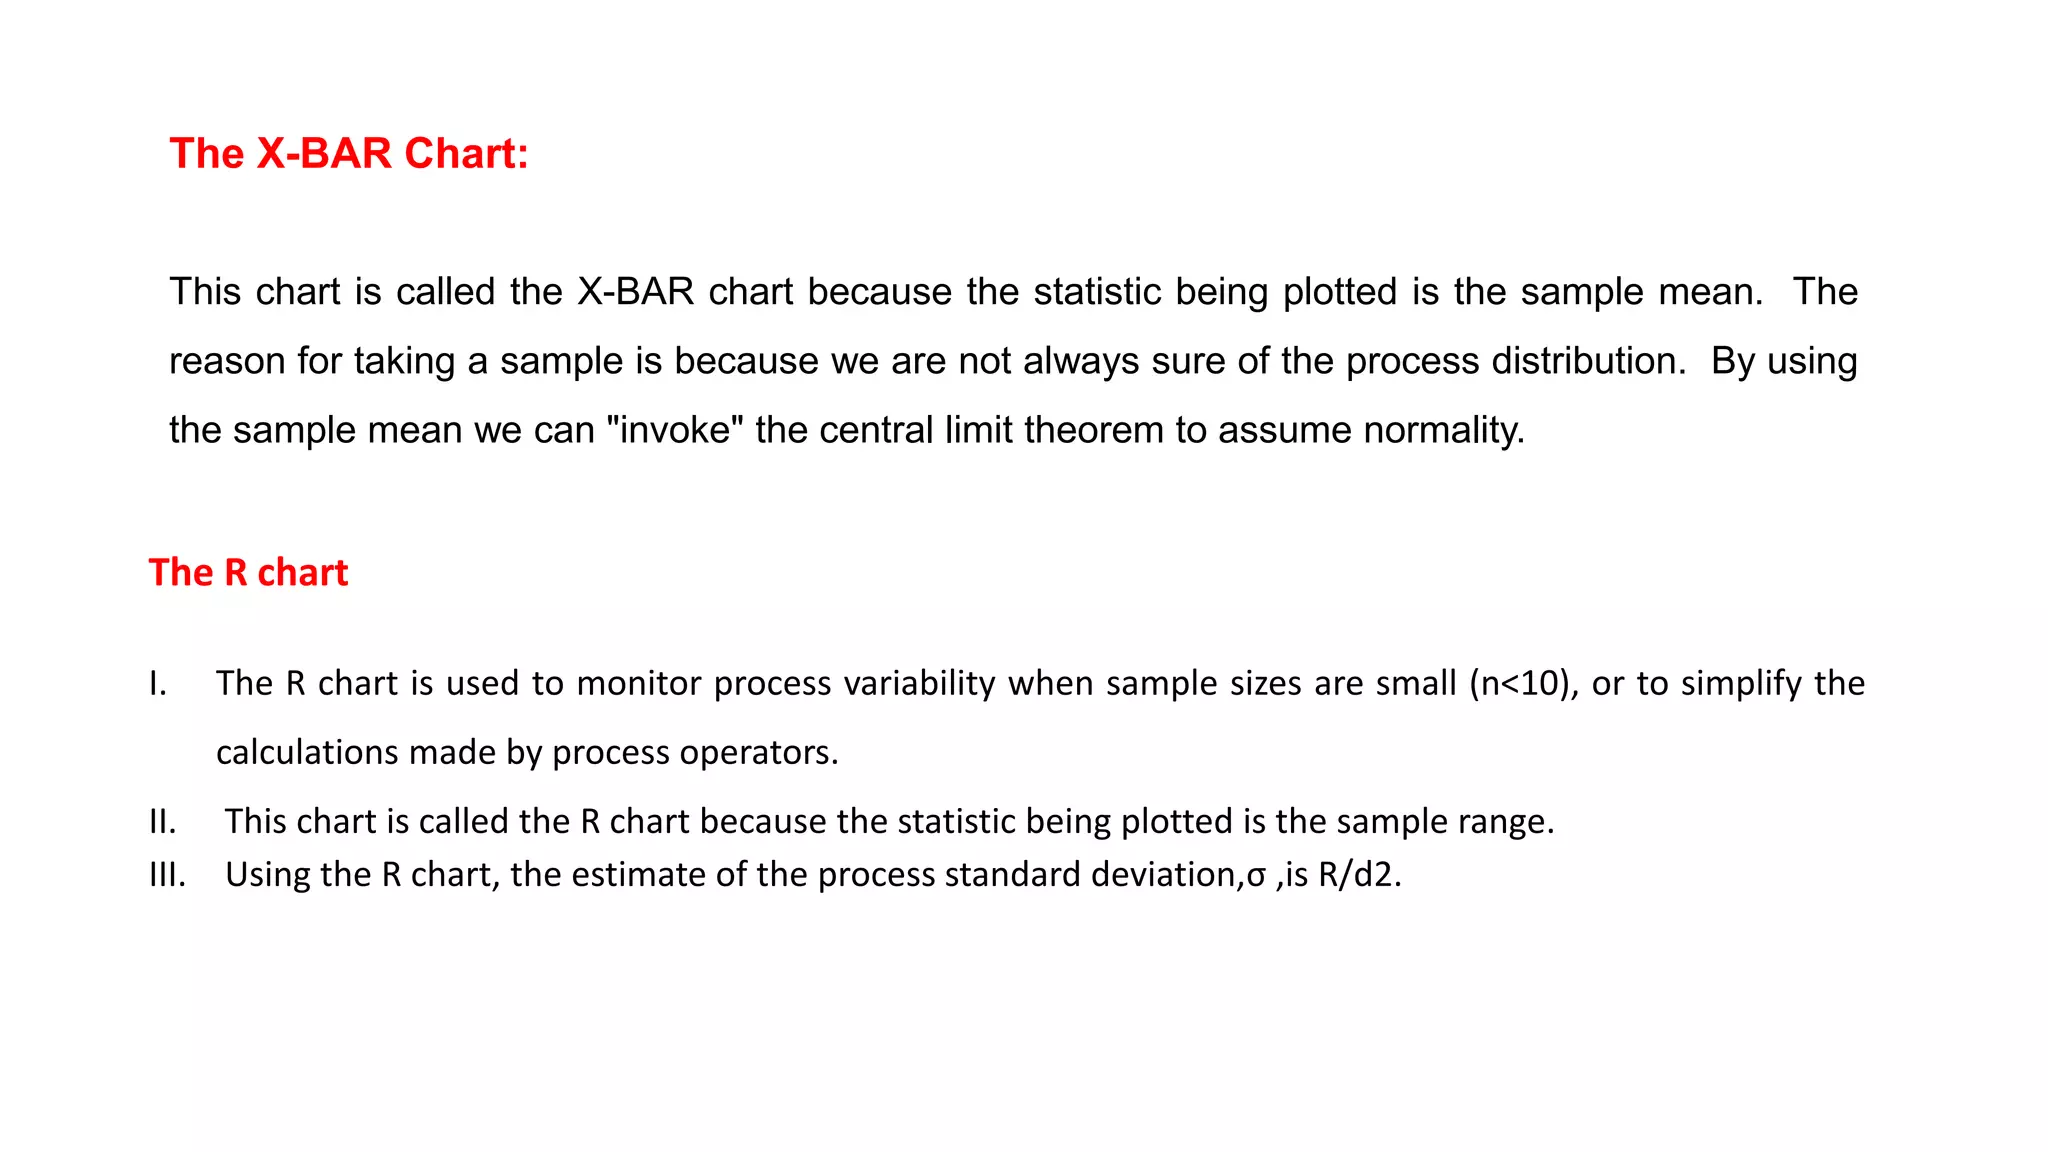
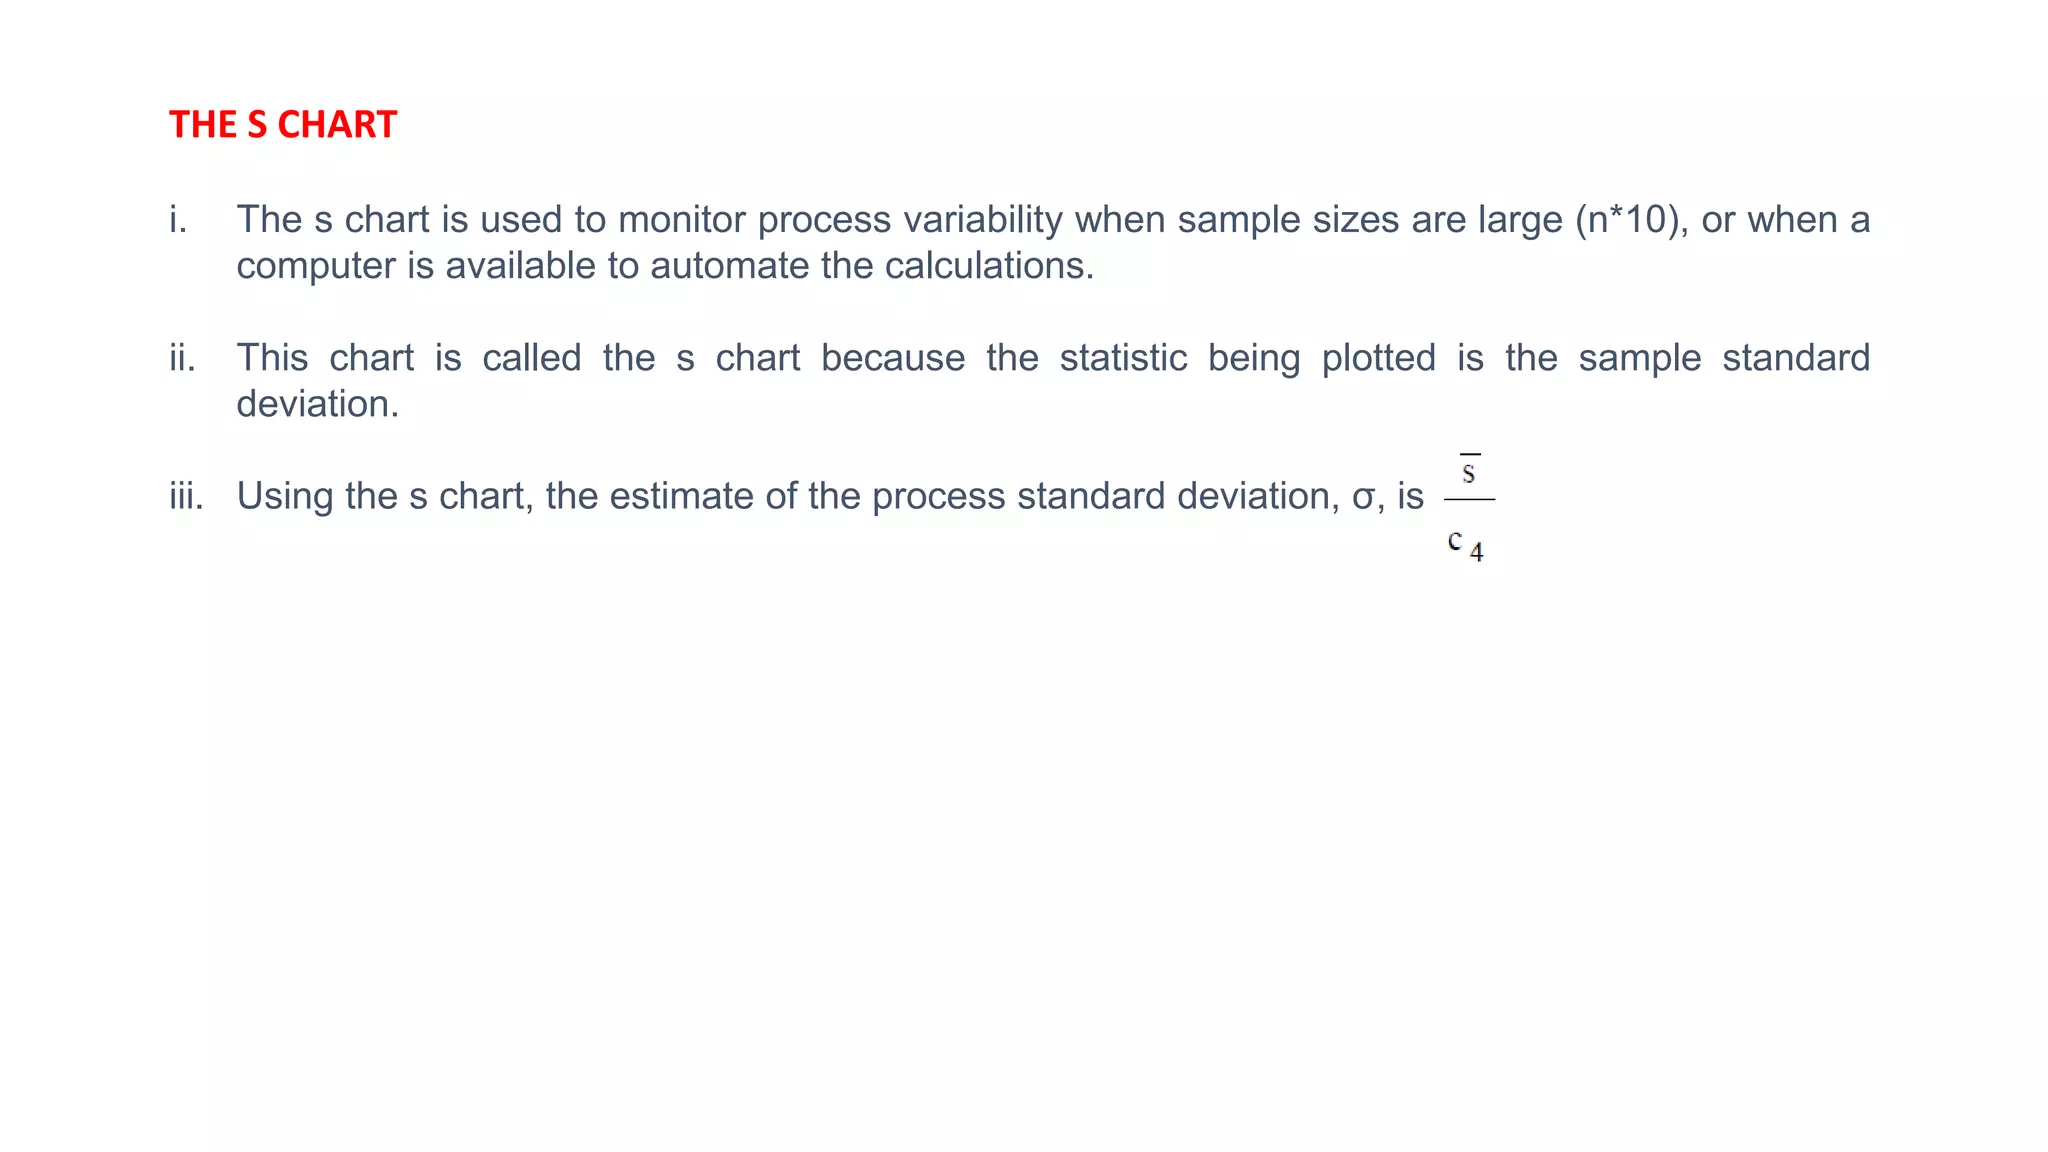
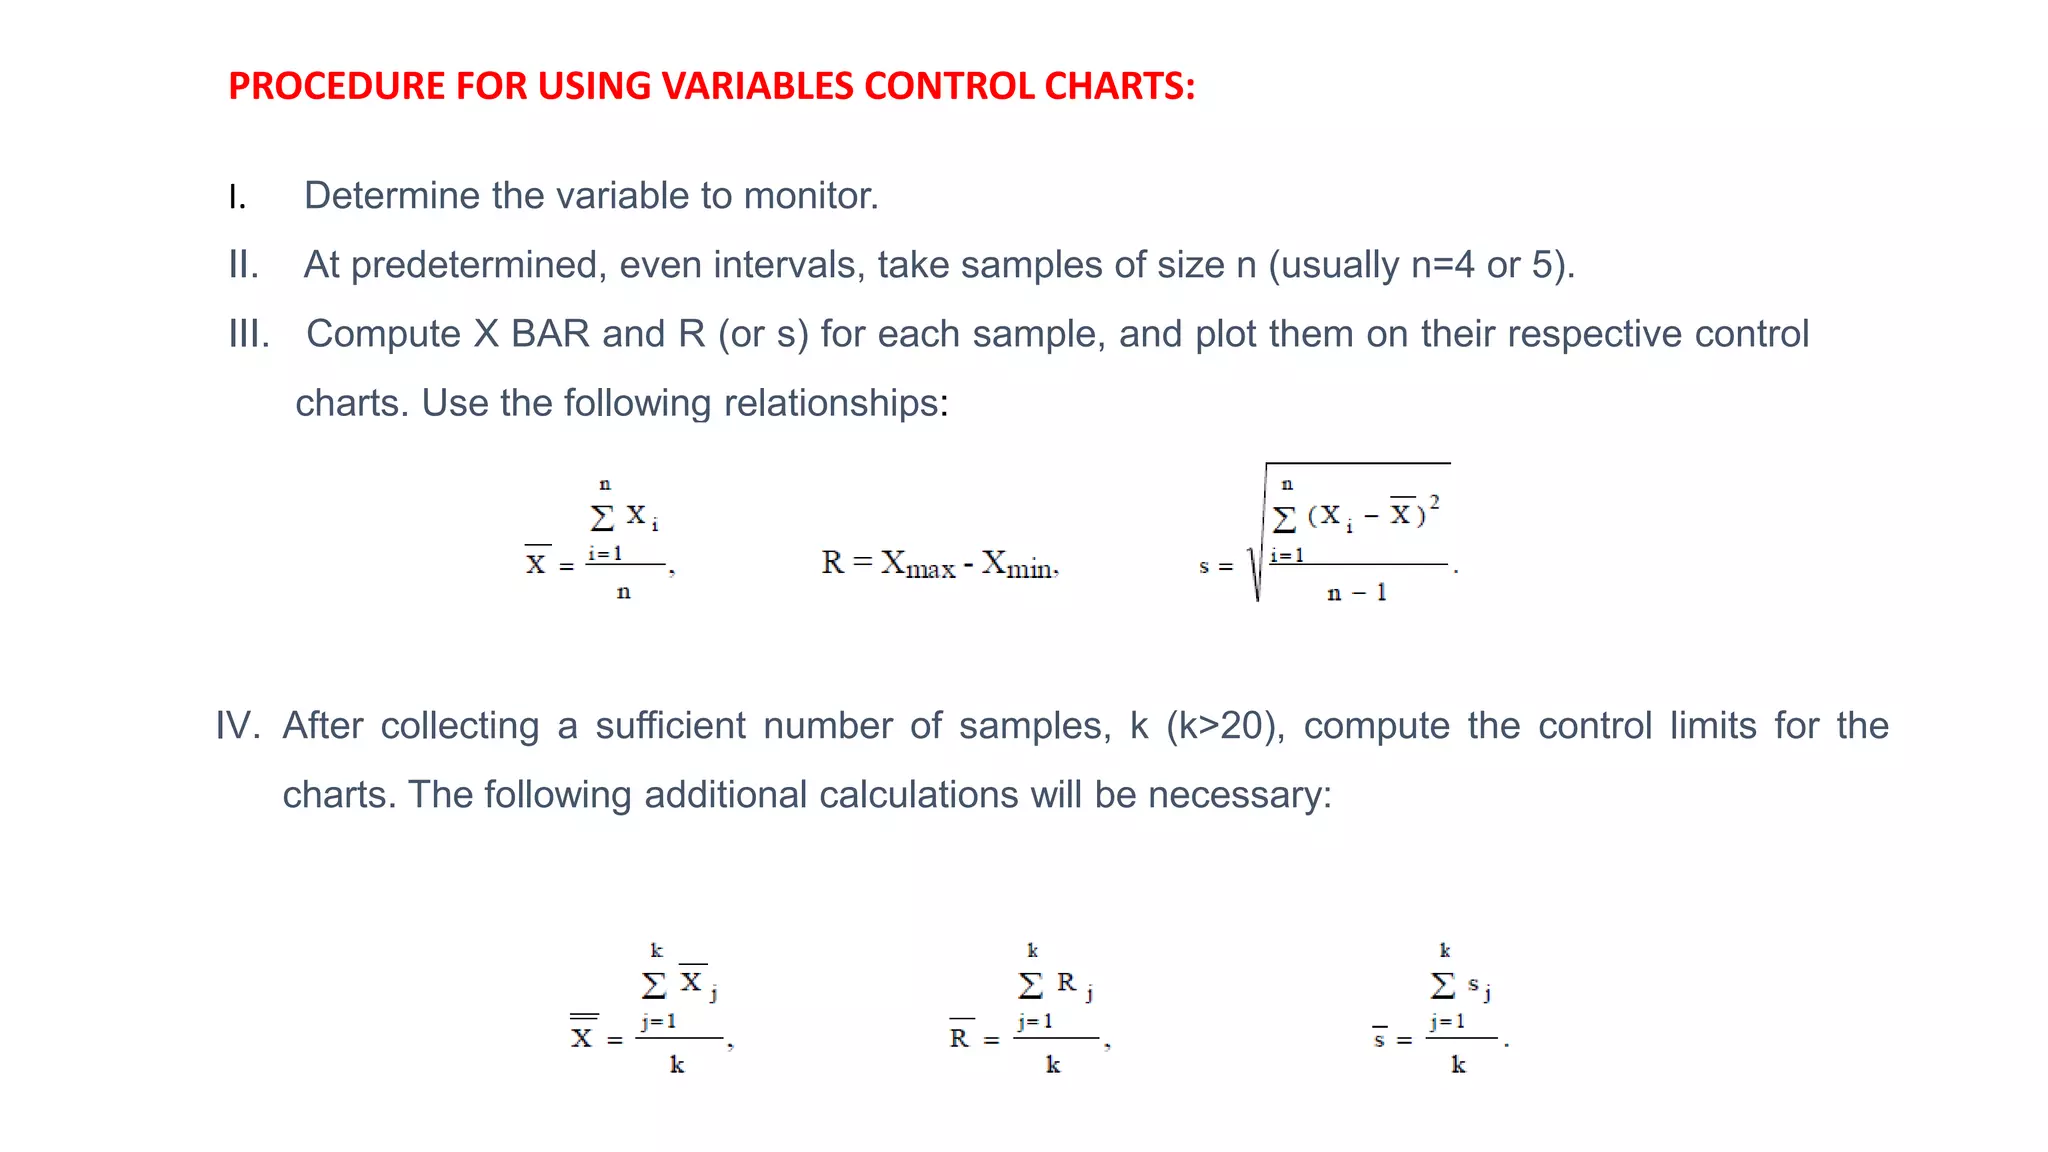
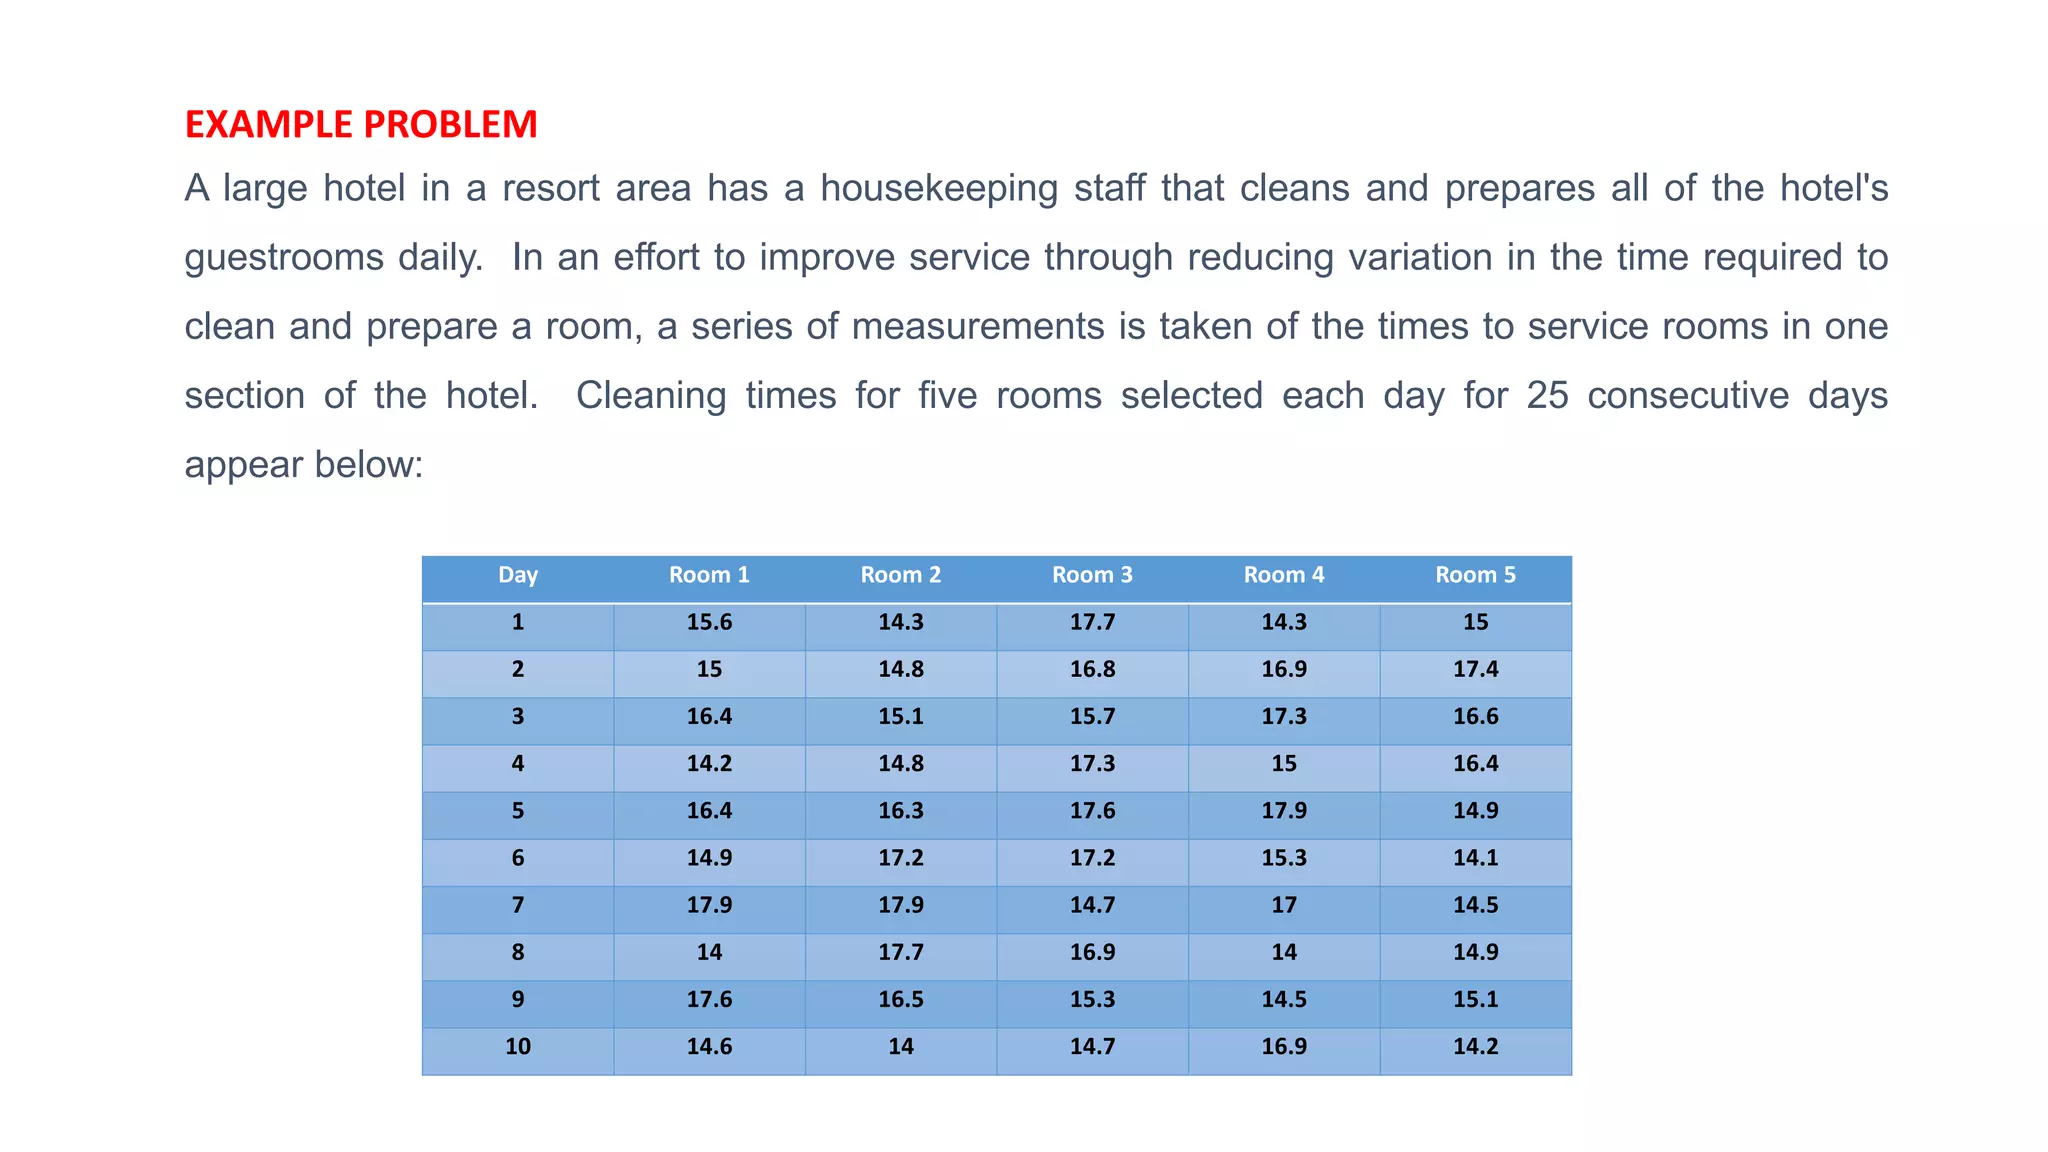
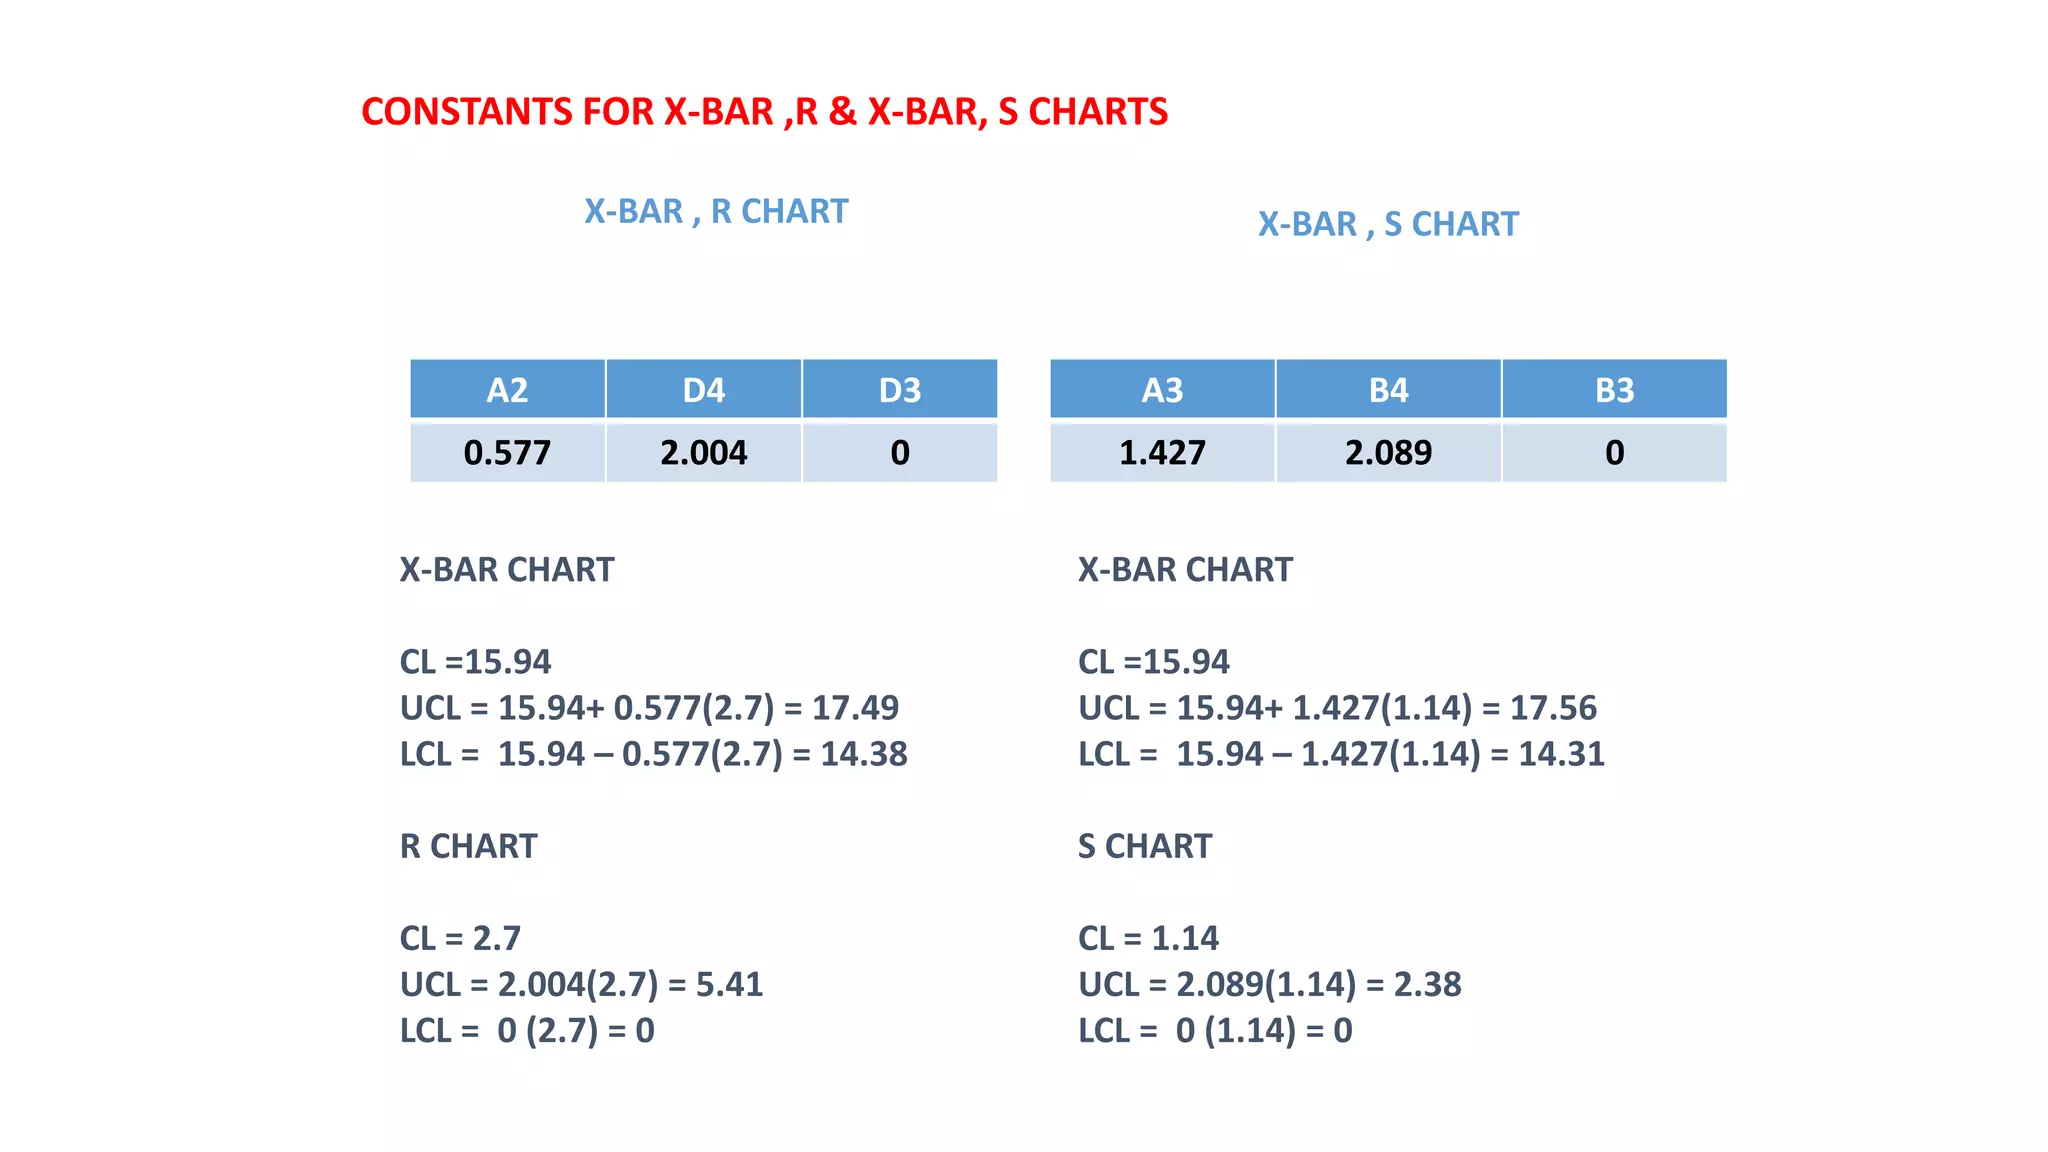
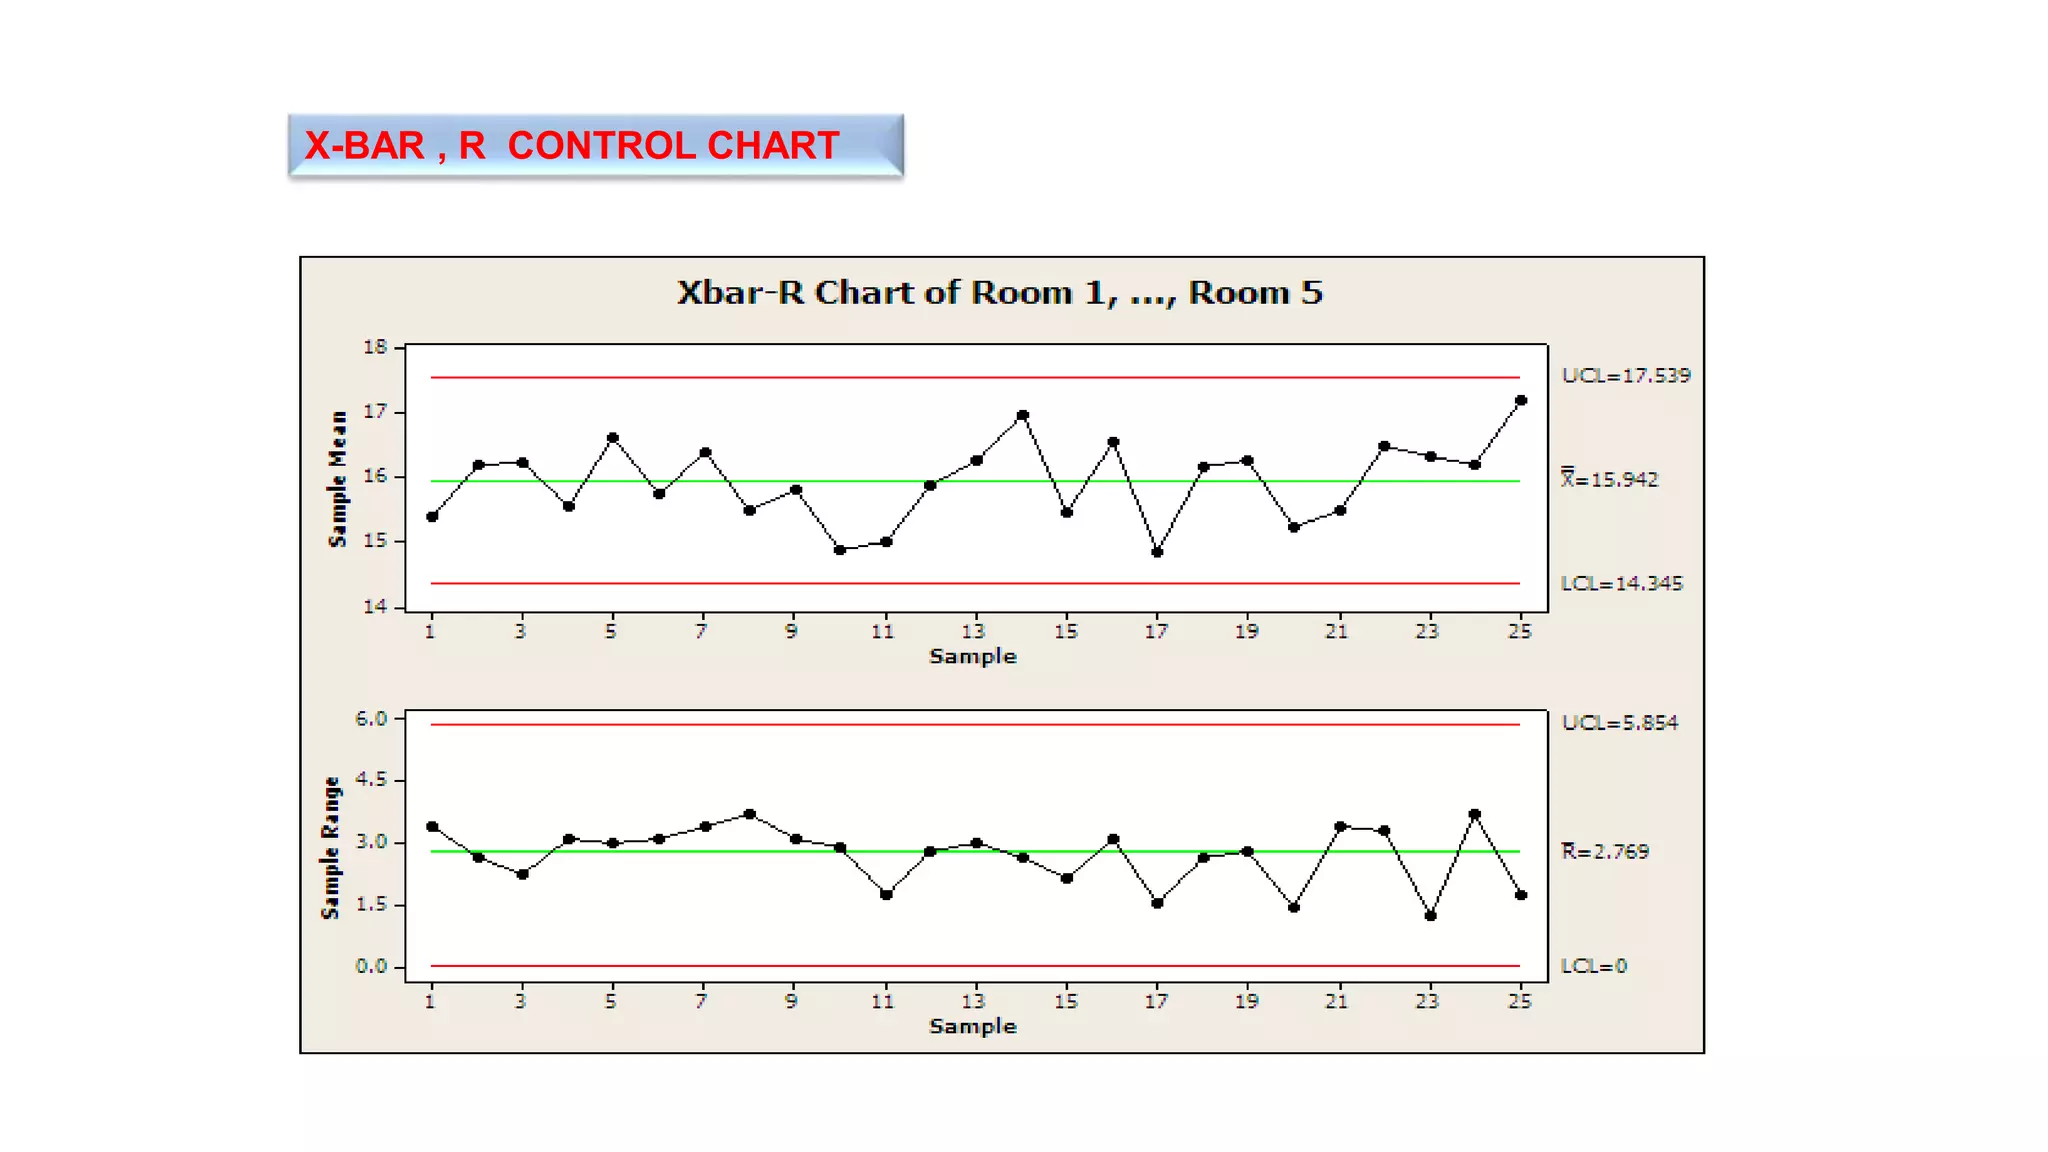
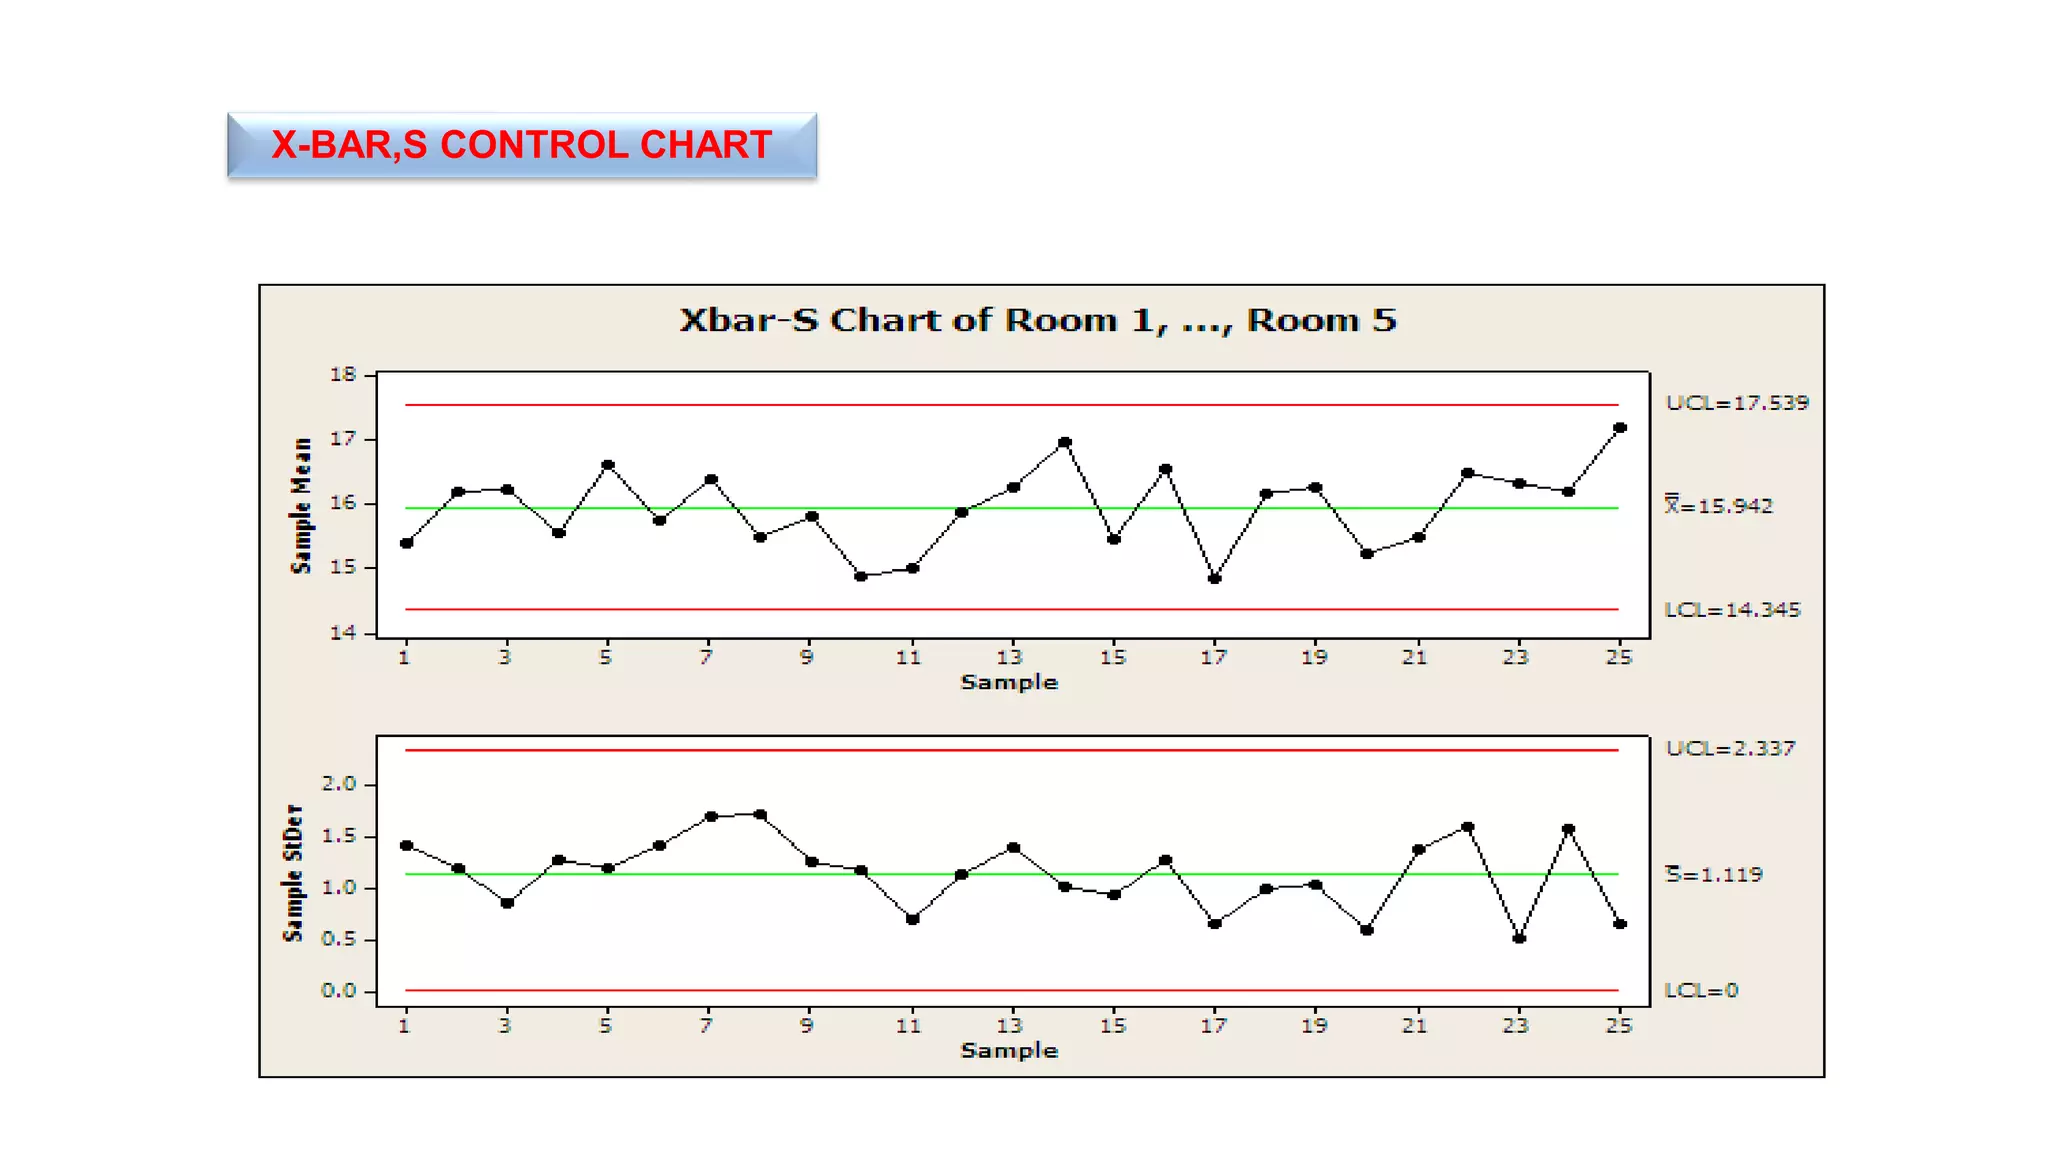
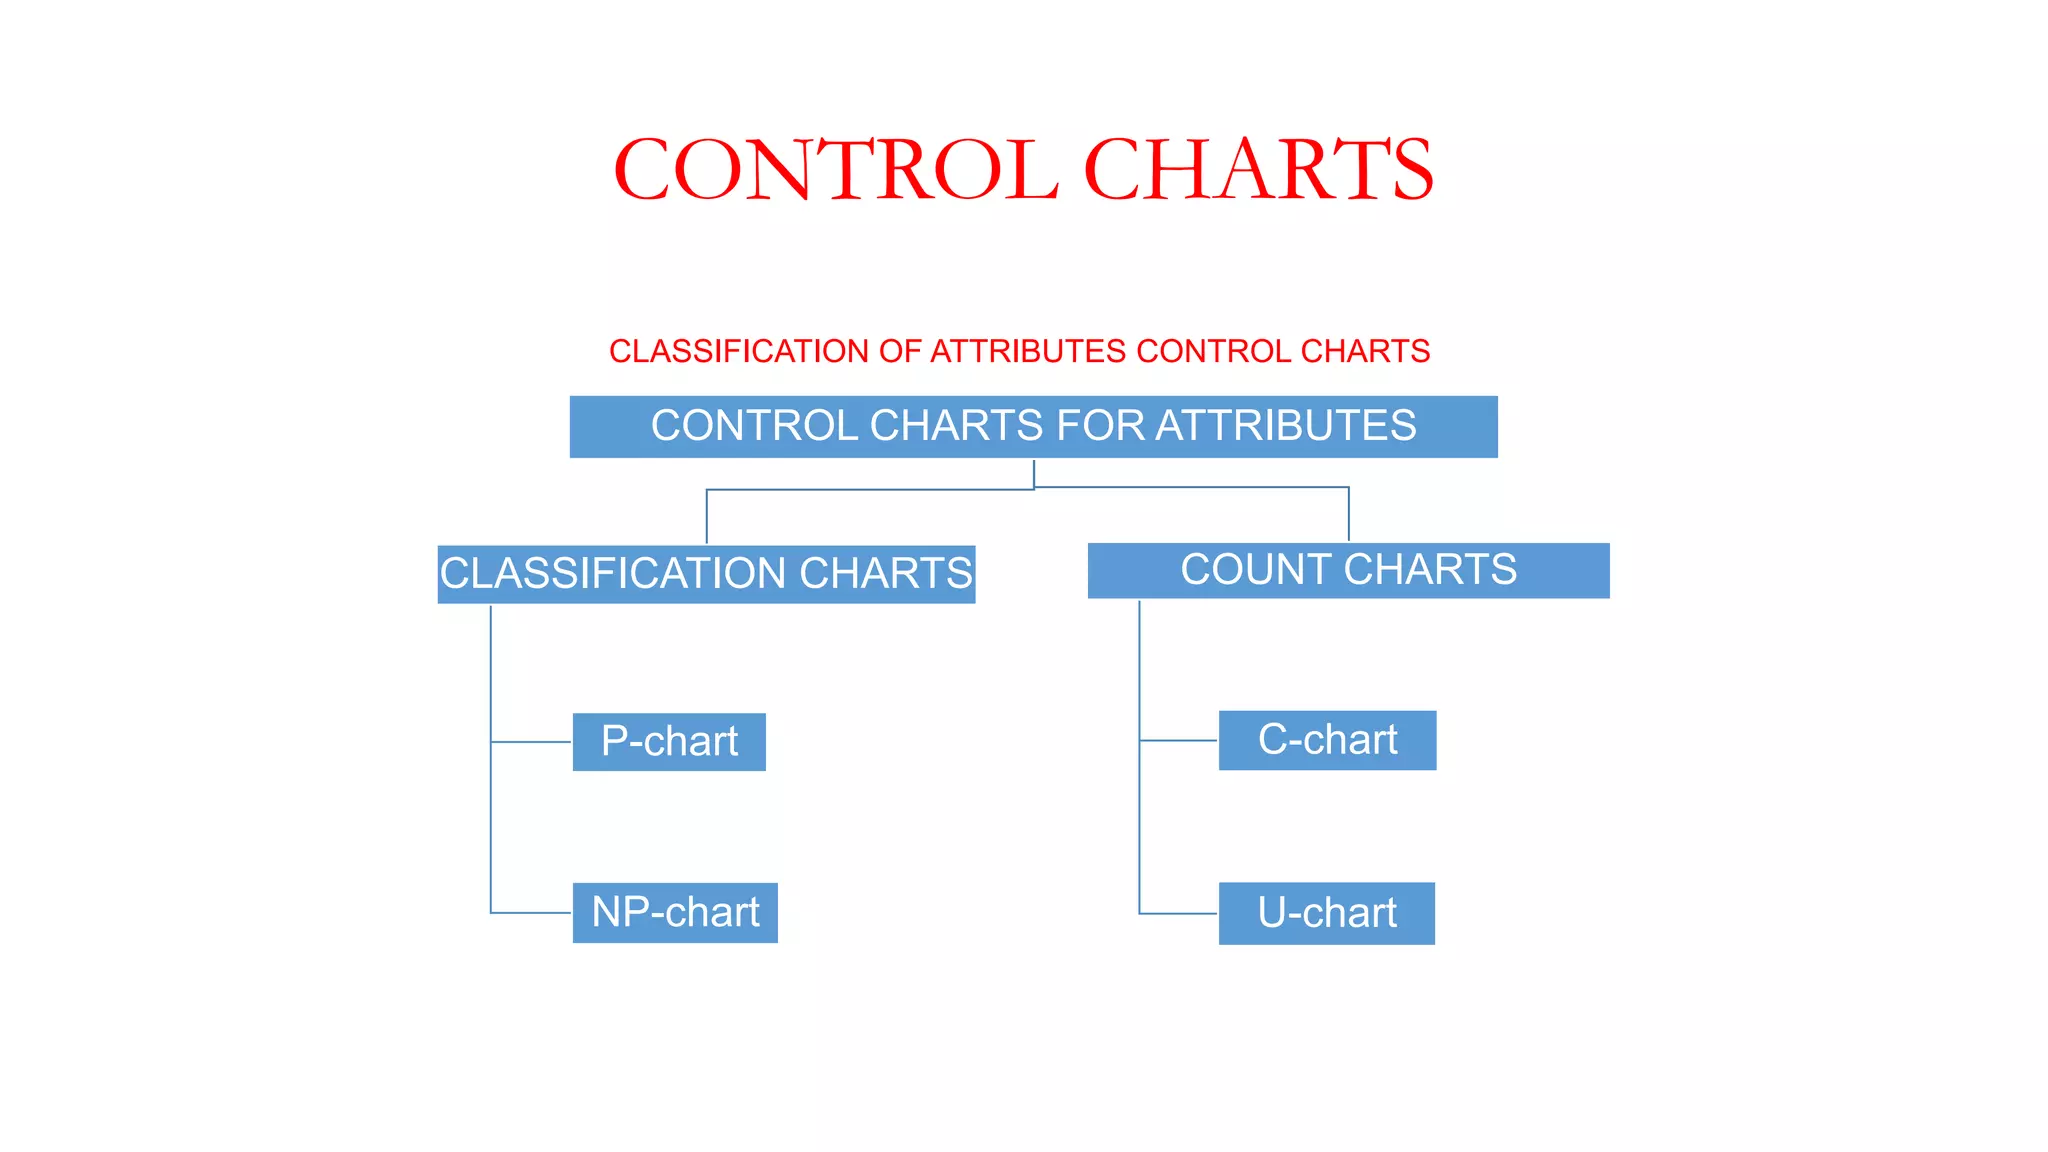
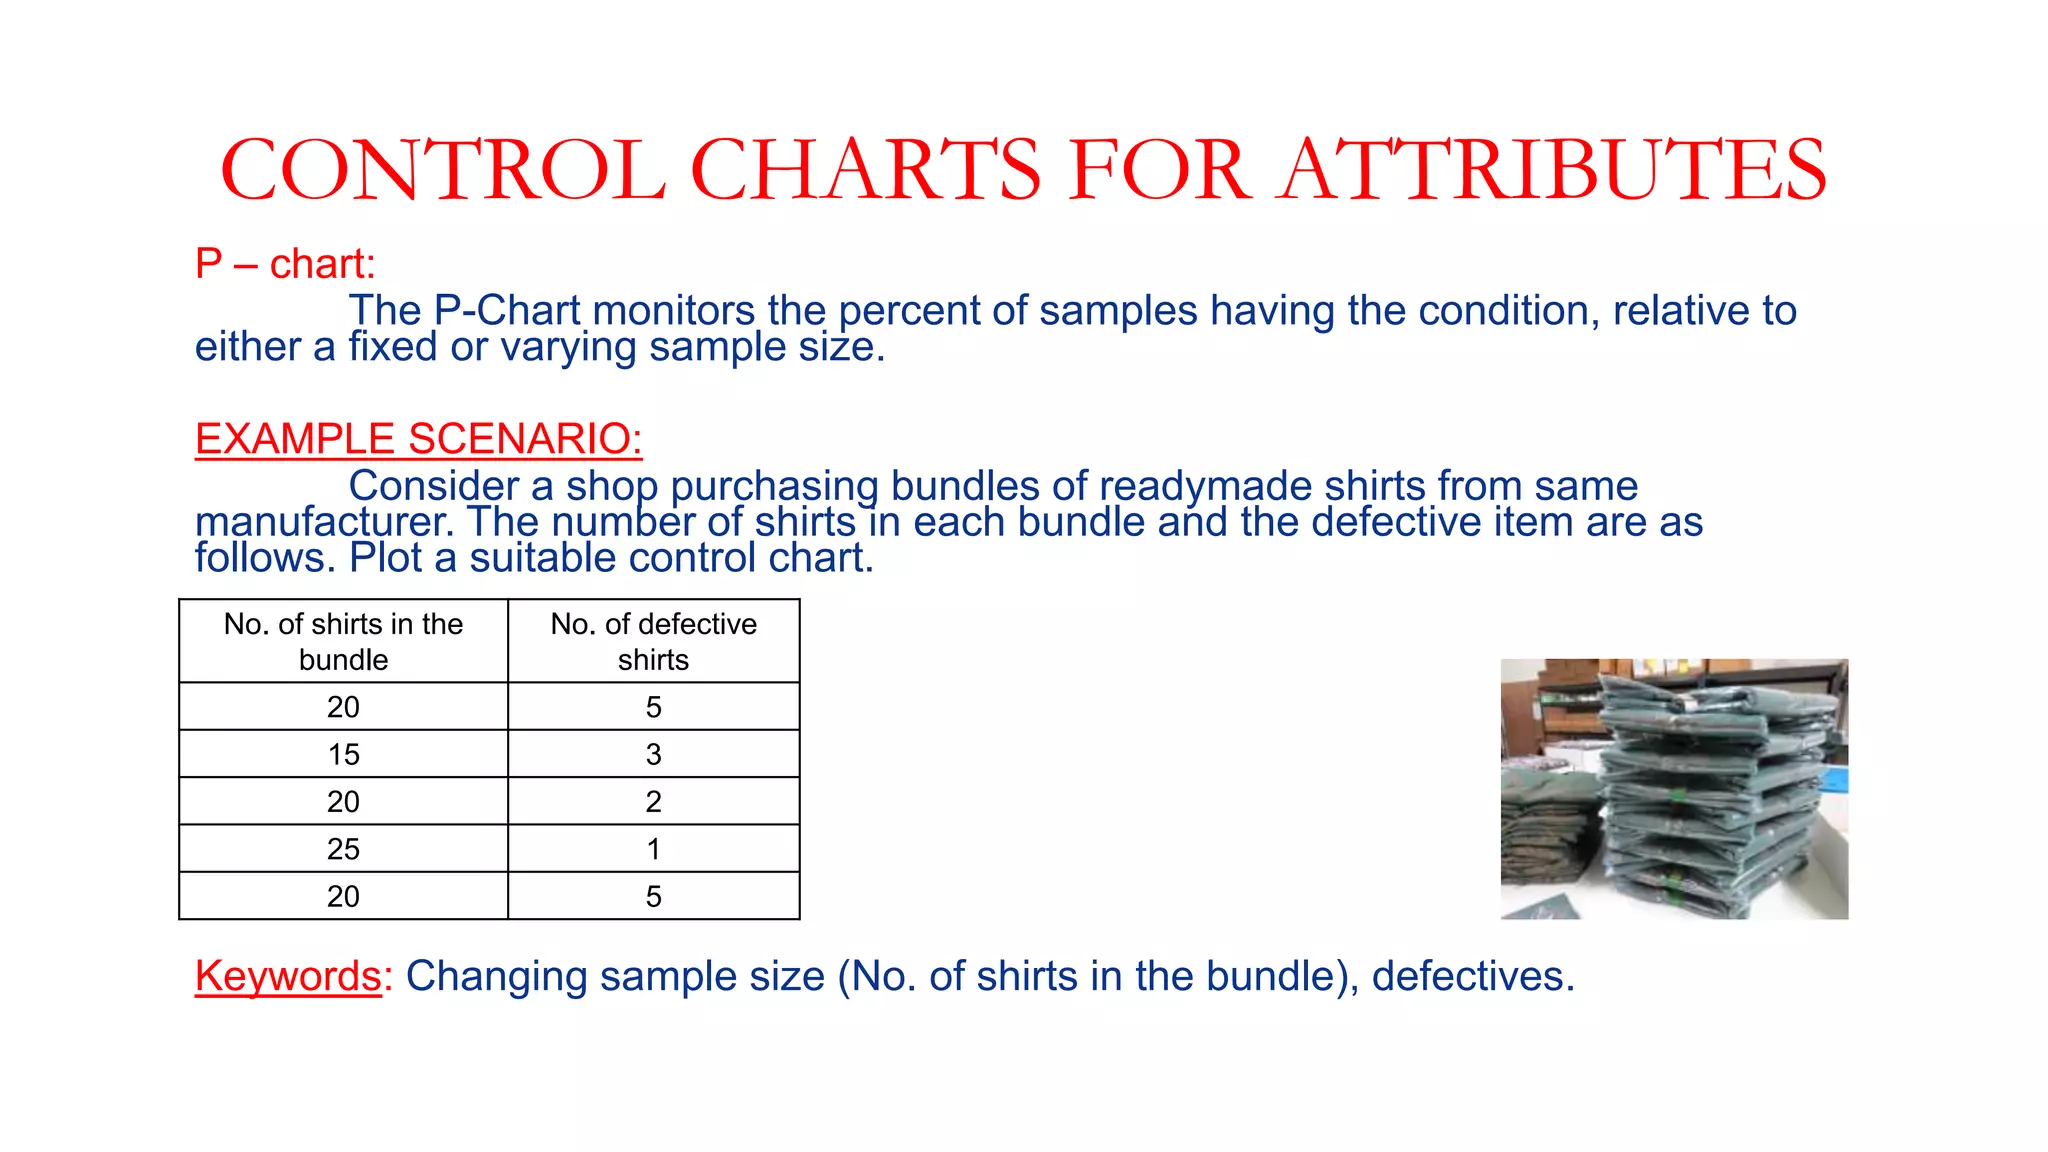
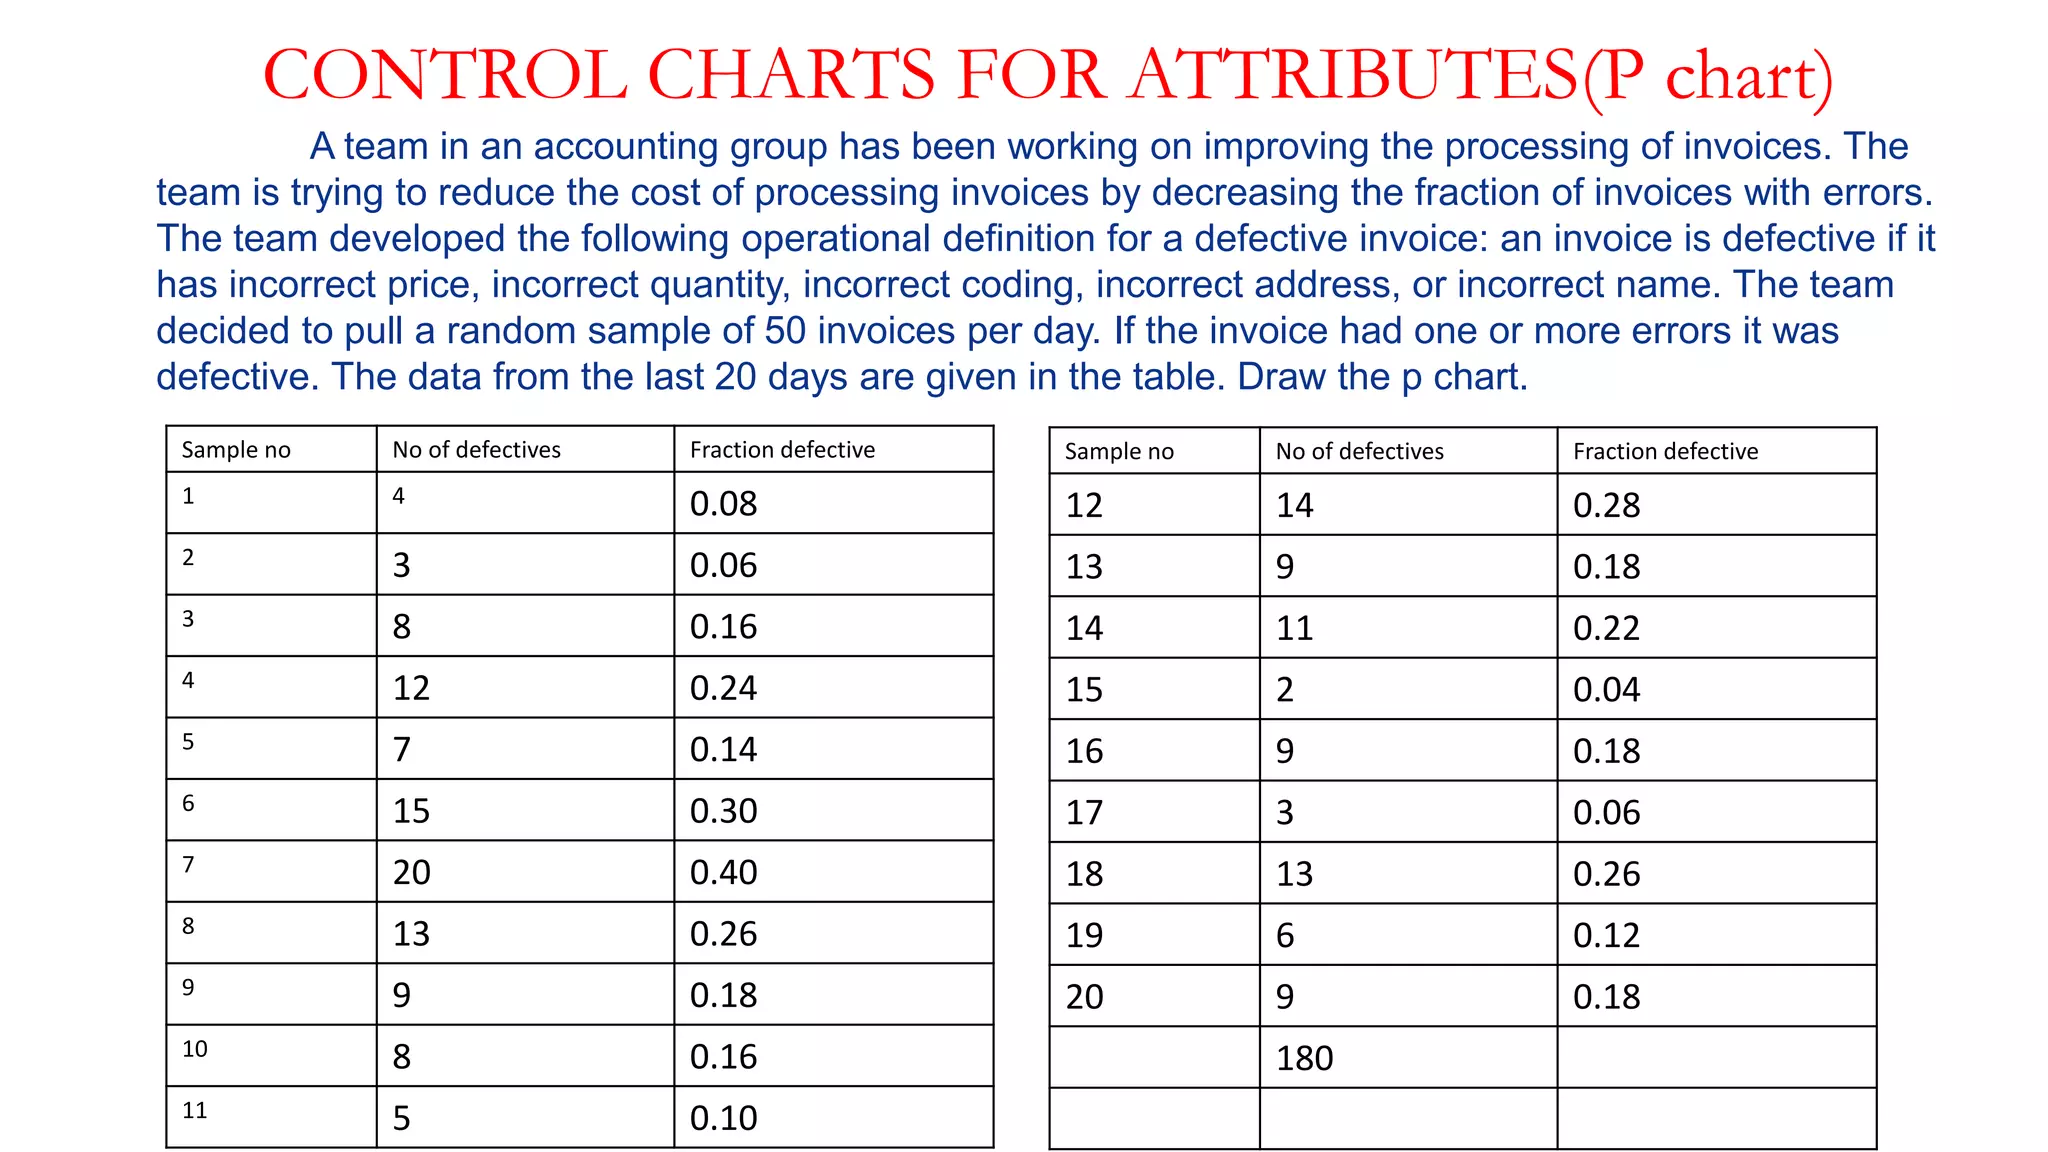


This document provides an overview of control charts, including: - Control charts are statistical tools used to monitor processes over time by analyzing variation. They have a central line for the average and upper and lower control limits. - Walter Shewhart invented control charts in the 1920s to reduce failures and repairs in telephone transmission systems by distinguishing between common and special causes of variation. - There are variable control charts that monitor continuous data using statistics like the mean and range, and attribute control charts that monitor discrete data using statistics like defects per sample. - Examples of control charts discussed include X-bar and R charts for variables, and P and NP charts for attributes. An example problem demonstrates how to construct and


![Control Charts[1]](https://cdn.slidesharecdn.com/ss_thumbnails/controlcharts1-1226081330857138-9-thumbnail.jpg?width=640&height=640&fit=bounds)


![Control Charts[1]](https://cdn.slidesharecdn.com/ss_thumbnails/controlcharts1-1226961283054520-8-thumbnail.jpg?width=640&height=640&fit=bounds)


![Control charts[1]](https://cdn.slidesharecdn.com/ss_thumbnails/controlcharts1-100924110931-phpapp01-thumbnail.jpg?width=640&height=640&fit=bounds)


