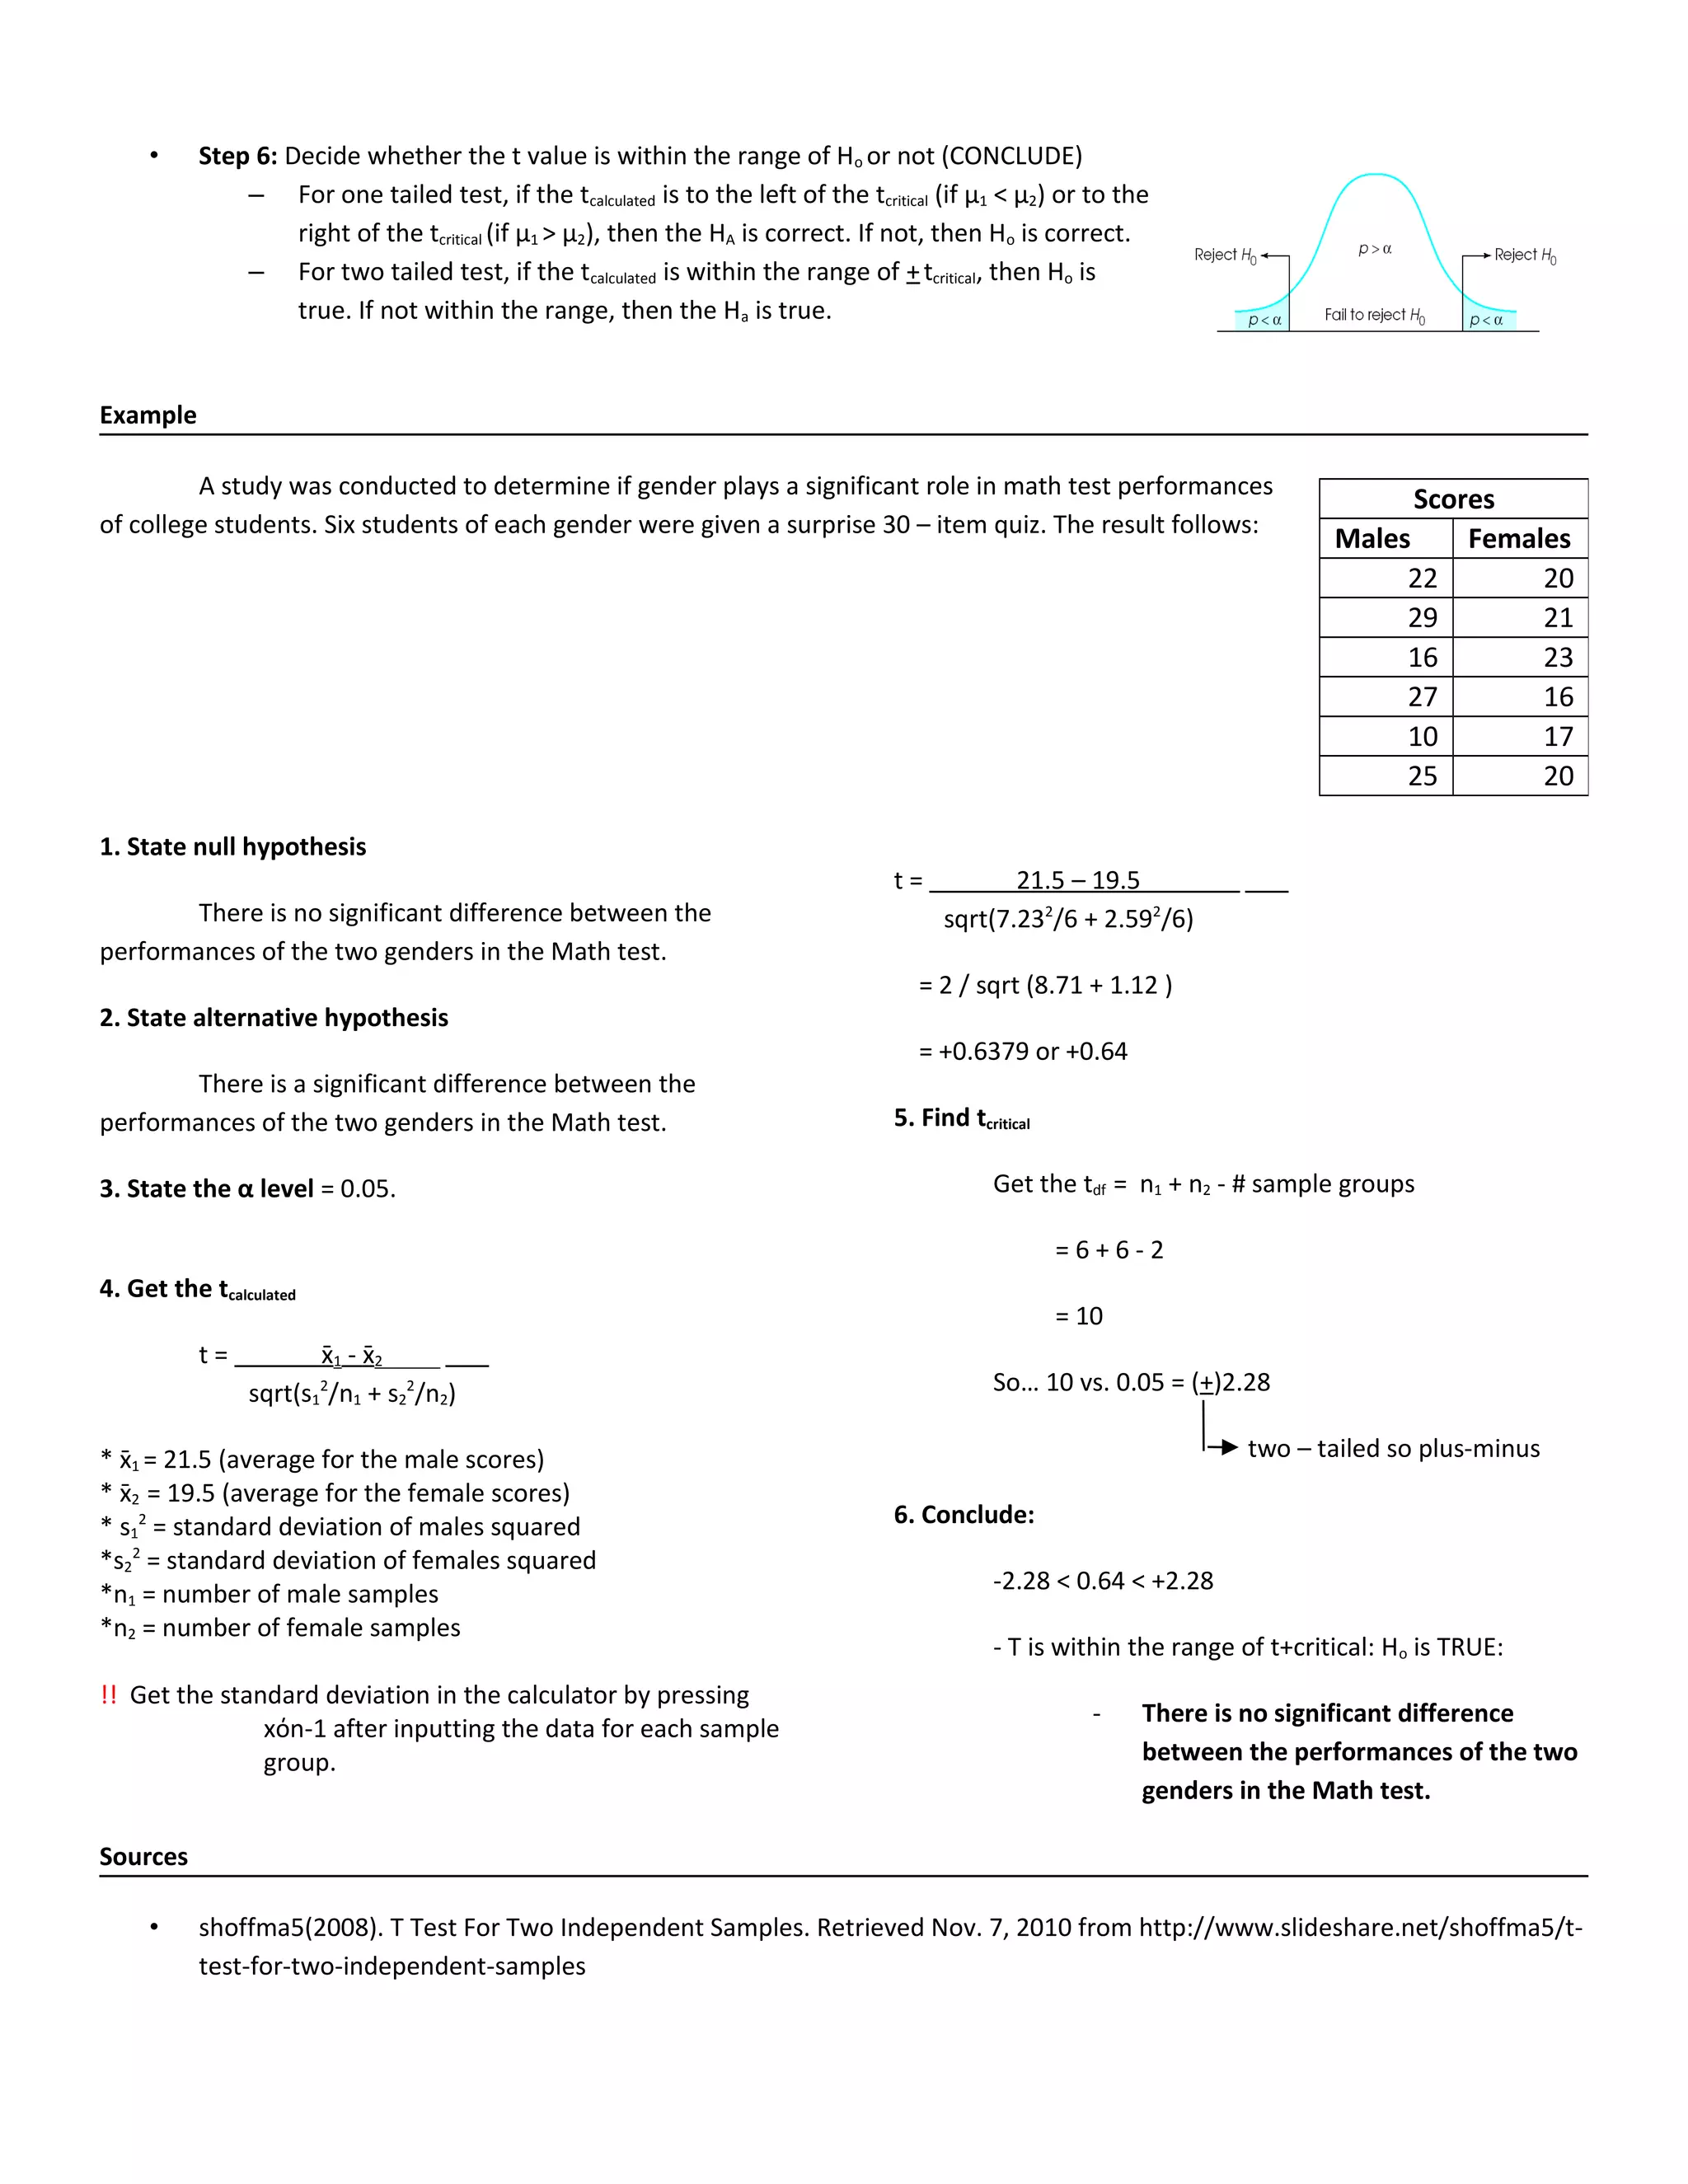
T-test for Two Independent Samples
Group 1: Emman, Misola, Peralta, Sulam, Dumagpi, Tamayo
• This is probably the most widely used statistical test of all time, and certainly the most widely known. It is simple,
straightforward, easy to use, and adaptable to a broad range of situations.
• It is a method of comparing two independent populations by evaluating the mean difference. The measurement is usually
expressed in either interval or ratio.
• A third variable (a dependent variable) is measured using continuous scale of measurement. This variable will be used as
a reference for comparison of the two independent variables.
• The parameters are unknown.
Application:
• It is best utilized in researches trying to answer the question:
“If we examine two different levels of one variable,
will we find them to be associated with different levels of the other?”
• Assumptions when doing the test:
– The two groups are independent of each other.
– The dependent variable is normally distributed.
– The two groups have approximately equal variance on the dependent variable.
Steps
• Step 1: State the Null Hypothesis.
– The null hypothesis is the main antithesis of the research. It is the hypothesis of non-significance. It is expressed as
Ho: µ1 = µ2, µ1 ≤ µ2 or µ1 ≥ µ2. Basically the research aims to disprove this assumption – by evaluating if there is any
significance in the data results.
• Step 2: State the alternative hypothesis.
– The alternative hypothesis, denoted as HA , is the hypothesis of significance – that there is significance in the mean
differences of the two populations. It is expressed as HA: µ1 ≠ µ2, µ1 < µ2 or µ1 > µ2.
• Step 3: Set the alpha level. α = 0.05 is the most commonly used level of significance.
– This can be expressed in decimals such as 0.1, 0.5, etc. This defines the range at which the range of Ho rejection
under the standard curve may be.
• Step 4: Do the calculations to get tcalculated
– First compute for the means of samples 1 and 2.
– Then Compute for standard error of the differences of the two means.
– Lastly, compute for the t (t = (sample mean1 – sample mean 2)/standard error)
t = x̄1 - x̄2 f------------------> Difference of the sample means
sqrt(s1
2
/n1 + s2
2
/n2) -------------------> Standard Error
• Step 5: Find the critical or tabular t
- Get the degree of freedom (df) of the test.
- Then, in the Table of Critical Value of t (refer to the research manual), get the tcritical. In the y axis is the
degrees of freedom and in the x axis is the alpha. Consider whether the study is a one-tailed or a two-
tailed test.
Where:
x̄ = sample mean
s2
= standard deviation of sample
(denoted as xόn-1 in common
calculators)
n = number of samples (sample
size)
df = n1 + n2 - # of sample groups
• Step 6: Decide whether the t value is within the range of Ho or not (CONCLUDE)
– For one tailed test, if the tcalculated is to the left of the tcritical (if µ1 < µ2) or to the
right of the tcritical (if µ1 > µ2), then the HA is correct. If not, then Ho is correct.
– For two tailed test, if the tcalculated is within the range of +tcritical, then Ho is
true. If not within the range, then the Ha is true.
Example
A study was conducted to determine if gender plays a significant role in math test performances
of college students. Six students of each gender were given a surprise 30 – item quiz. The result follows:
1. State null hypothesis
There is no significant difference between the
performances of the two genders in the Math test.
2. State alternative hypothesis
There is a significant difference between the
performances of the two genders in the Math test.
3. State the α level = 0.05.
4. Get the tcalculated
t = x̄1 - x̄2 f
sqrt(s1
2
/n1 + s2
2
/n2)
* x̄1 = 21.5 (average for the male scores)
* x̄2 = 19.5 (average for the female scores)
* s1
2
= standard deviation of males squared
*s2
2
= standard deviation of females squared
*n1 = number of male samples
*n2 = number of female samples
!! Get the standard deviation in the calculator by pressing
xόn-1 after inputting the data for each sample
group.
t = 21.5 – 19.5 f
sqrt(7.232
/6 + 2.592
/6)
= 2 / sqrt (8.71 + 1.12 )
= +0.6379 or +0.64
5. Find tcritical
Get the tdf = n1 + n2 - # sample groups
= 6 + 6 - 2
= 10
So… 10 vs. 0.05 = (+)2.28
two – tailed so plus-minus
6. Conclude:
-2.28 < 0.64 < +2.28
- T is within the range of t+critical: Ho is TRUE:
- There is no significant difference
between the performances of the two
genders in the Math test.
Sources
• shoffma5(2008). T Test For Two Independent Samples. Retrieved Nov. 7, 2010 from http://www.slideshare.net/shoffma5/t-
test-for-two-independent-samples
Scores
Males Females
22 20
29 21
16 23
27 16
10 17
25 20
• Lowry R. (1999-2010). Chapter 11. t-Test for the Significance of the Difference between the Means of Two Independent
Samples. Retrieved Nov. 7, 2010 from http://faculty.vassar.edu/lowry/ch11pt1.html
• MacFarland T.W. (1998). Student's t-Test for Independent Samples. Retrieved Nov. 7, 2010 from
http://www.nyx.net/~tmacfarl/STAT_TUT/studen_t.ssi

Str t-test1

  • 1.
    T-test for TwoIndependent Samples Group 1: Emman, Misola, Peralta, Sulam, Dumagpi, Tamayo • This is probably the most widely used statistical test of all time, and certainly the most widely known. It is simple, straightforward, easy to use, and adaptable to a broad range of situations. • It is a method of comparing two independent populations by evaluating the mean difference. The measurement is usually expressed in either interval or ratio. • A third variable (a dependent variable) is measured using continuous scale of measurement. This variable will be used as a reference for comparison of the two independent variables. • The parameters are unknown. Application: • It is best utilized in researches trying to answer the question: “If we examine two different levels of one variable, will we find them to be associated with different levels of the other?” • Assumptions when doing the test: – The two groups are independent of each other. – The dependent variable is normally distributed. – The two groups have approximately equal variance on the dependent variable. Steps • Step 1: State the Null Hypothesis. – The null hypothesis is the main antithesis of the research. It is the hypothesis of non-significance. It is expressed as Ho: µ1 = µ2, µ1 ≤ µ2 or µ1 ≥ µ2. Basically the research aims to disprove this assumption – by evaluating if there is any significance in the data results. • Step 2: State the alternative hypothesis. – The alternative hypothesis, denoted as HA , is the hypothesis of significance – that there is significance in the mean differences of the two populations. It is expressed as HA: µ1 ≠ µ2, µ1 < µ2 or µ1 > µ2. • Step 3: Set the alpha level. α = 0.05 is the most commonly used level of significance. – This can be expressed in decimals such as 0.1, 0.5, etc. This defines the range at which the range of Ho rejection under the standard curve may be. • Step 4: Do the calculations to get tcalculated – First compute for the means of samples 1 and 2. – Then Compute for standard error of the differences of the two means. – Lastly, compute for the t (t = (sample mean1 – sample mean 2)/standard error) t = x̄1 - x̄2 f------------------> Difference of the sample means sqrt(s1 2 /n1 + s2 2 /n2) -------------------> Standard Error • Step 5: Find the critical or tabular t - Get the degree of freedom (df) of the test. - Then, in the Table of Critical Value of t (refer to the research manual), get the tcritical. In the y axis is the degrees of freedom and in the x axis is the alpha. Consider whether the study is a one-tailed or a two- tailed test. Where: x̄ = sample mean s2 = standard deviation of sample (denoted as xόn-1 in common calculators) n = number of samples (sample size) df = n1 + n2 - # of sample groups
  • 2.
    • Step 6:Decide whether the t value is within the range of Ho or not (CONCLUDE) – For one tailed test, if the tcalculated is to the left of the tcritical (if µ1 < µ2) or to the right of the tcritical (if µ1 > µ2), then the HA is correct. If not, then Ho is correct. – For two tailed test, if the tcalculated is within the range of +tcritical, then Ho is true. If not within the range, then the Ha is true. Example A study was conducted to determine if gender plays a significant role in math test performances of college students. Six students of each gender were given a surprise 30 – item quiz. The result follows: 1. State null hypothesis There is no significant difference between the performances of the two genders in the Math test. 2. State alternative hypothesis There is a significant difference between the performances of the two genders in the Math test. 3. State the α level = 0.05. 4. Get the tcalculated t = x̄1 - x̄2 f sqrt(s1 2 /n1 + s2 2 /n2) * x̄1 = 21.5 (average for the male scores) * x̄2 = 19.5 (average for the female scores) * s1 2 = standard deviation of males squared *s2 2 = standard deviation of females squared *n1 = number of male samples *n2 = number of female samples !! Get the standard deviation in the calculator by pressing xόn-1 after inputting the data for each sample group. t = 21.5 – 19.5 f sqrt(7.232 /6 + 2.592 /6) = 2 / sqrt (8.71 + 1.12 ) = +0.6379 or +0.64 5. Find tcritical Get the tdf = n1 + n2 - # sample groups = 6 + 6 - 2 = 10 So… 10 vs. 0.05 = (+)2.28 two – tailed so plus-minus 6. Conclude: -2.28 < 0.64 < +2.28 - T is within the range of t+critical: Ho is TRUE: - There is no significant difference between the performances of the two genders in the Math test. Sources • shoffma5(2008). T Test For Two Independent Samples. Retrieved Nov. 7, 2010 from http://www.slideshare.net/shoffma5/t- test-for-two-independent-samples Scores Males Females 22 20 29 21 16 23 27 16 10 17 25 20
  • 3.
    • Lowry R.(1999-2010). Chapter 11. t-Test for the Significance of the Difference between the Means of Two Independent Samples. Retrieved Nov. 7, 2010 from http://faculty.vassar.edu/lowry/ch11pt1.html • MacFarland T.W. (1998). Student's t-Test for Independent Samples. Retrieved Nov. 7, 2010 from http://www.nyx.net/~tmacfarl/STAT_TUT/studen_t.ssi