SlideShare a Scribd company logo
1 of 10
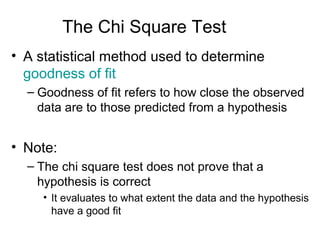
The Chi Square Test
• A statistical method used to determine
goodness of fit
– Goodness of fit refers to how close the observed
data are to those predicted from a hypothesis

• Note:
– The chi square test does not prove that a
hypothesis is correct
• It evaluates to what extent the data and the hypothesis
have a good fit
The Chi Square Test (we will cover this
in lab; the following slides will be useful to
review after that lab)

• The general formula is

χ2 = Σ

(O – E)2
E

• where
– O = observed data in each category
– E = observed data in each category based on the
experimenter’s hypothesis
Σ = Sum of the calculations for each category
• Consider the following example in Drosophila
melanogaster
• Gene affecting wing shape
– c+ = Normal wing
– c = Curved wing

• Gene affecting body color
– e+ = Normal (gray)
– e = ebony

• Note:
– The wild-type allele is designated with a + sign
– Recessive mutant alleles are designated with lowercase
letters

• The Cross:
– A cross is made between two true-breeding flies (c+c+e+e+
and ccee). The flies of the F1 generation are then allowed
to mate with each other to produce an F2 generation.
• The outcome
– F1 generation
• All offspring have straight wings and gray bodies
– F2 generation
•
•
•
•
•

193 straight wings, gray bodies
69 straight wings, ebony bodies
64 curved wings, gray bodies
26 curved wings, ebony bodies
352 total flies

• Applying the chi square test
– Step 1: Propose a null hypothesis (Ho) that allows us to
calculate the expected values based on Mendel’s laws
• The two traits are independently assorting
– Step 2: Calculate the expected values of the four
phenotypes, based on the hypothesis
• According to our hypothesis, there should be a
9:3:3:1 ratio on the F2 generation
Phenotype

Expected
probability

Expected
number

Observed number

straight wings,
gray bodies

9/16

9/16 X 352 = 198

193

straight wings,
ebony bodies

3/16

3/16 X 352 = 66

64

curved wings,
gray bodies

3/16

3/16 X 352 = 66

62

curved wings,
ebony bodies

1/16

1/16 X 352 = 22

24
– Step 3: Apply the chi square formula

χ2 =
χ2 =

(O1 – E1)2
E1
(193 – 198)2
198

+

+

(O2 – E2)2
E2
(69 – 66)2
66

χ2 = 0.13 + 0.14 + 0.06 + 0.73
χ = 1.06
2

+

+

(O3 – E3)2
E3
(64 – 66)2
66

+

+

(O4 – E4)2
E4
(26 – 22)2
22

Expected
number

Observed
number

198

193

66

64

66

62

22

24
• Step 4: Interpret the chi square value
– The calculated chi square value can be used to obtain
probabilities, or P values, from a chi square table
• These probabilities allow us to determine the likelihood that the
observed deviations are due to random chance alone

– Low chi square values indicate a high probability that the
observed deviations could be due to random chance alone
– High chi square values indicate a low probability that the
observed deviations are due to random chance alone
– If the chi square value results in a probability that is less than
0.05 (ie: less than 5%) it is considered statistically
significant
• The hypothesis is rejected
• Step 4: Interpret the chi square value
– Before we can use the chi square table, we have to
determine the degrees of freedom (df)
• The df is a measure of the number of categories that are
independent of each other
• If you know the 3 of the 4 categories you can deduce the
4th (total number of progeny – categories 1-3)
• df = n – 1
– where n = total number of categories
• In our experiment, there are four phenotypes/categories
– Therefore, df = 4 – 1 = 3
– Refer to Table 2.1
1.06
• Step 4: Interpret the chi square value
– With df = 3, the chi square value of 1.06 is slightly greater
than 1.005 (which corresponds to P-value = 0.80)
– P-value = 0.80 means that Chi-square values equal to or
greater than 1.005 are expected to occur 80% of the time
due to random chance alone; that is, when the null
hypothesis is true.
– Therefore, it is quite probable that the deviations between
the observed and expected values in this experiment can be
explained by random sampling error and the null hypothesis
is not rejected. What was the null hypothesis?

More Related Content

What's hot

Correlation and regression analysis
Correlation and regression analysisCorrelation and regression analysis
Correlation and regression analysis_pem
 
Analysis of variance (ANOVA)
Analysis of variance (ANOVA)Analysis of variance (ANOVA)
Analysis of variance (ANOVA)Sneh Kumari
 
Regression
Regression Regression
Regression Ali Raza
 
t distribution, paired and unpaired t-test
t distribution, paired and unpaired t-testt distribution, paired and unpaired t-test
t distribution, paired and unpaired t-testBPKIHS
 
Chi squared test
Chi squared testChi squared test
Chi squared testDhruv Patel
 
PROBABILITY AND IT'S TYPES WITH RULES
PROBABILITY AND IT'S TYPES WITH RULESPROBABILITY AND IT'S TYPES WITH RULES
PROBABILITY AND IT'S TYPES WITH RULESBhargavi Bhanu
 
Measure of Central Tendency (Mean, Median, Mode and Quantiles)
Measure of Central Tendency (Mean, Median, Mode and Quantiles)Measure of Central Tendency (Mean, Median, Mode and Quantiles)
Measure of Central Tendency (Mean, Median, Mode and Quantiles)Salman Khan
 
Presentation chi-square test & Anova
Presentation   chi-square test & AnovaPresentation   chi-square test & Anova
Presentation chi-square test & AnovaSonnappan Sridhar
 
F test mamtesh ppt.pptx
F test mamtesh ppt.pptxF test mamtesh ppt.pptx
F test mamtesh ppt.pptxArikB
 
Normal distribution
Normal distributionNormal distribution
Normal distributionSonamWadhwa3
 
F Distribution
F  DistributionF  Distribution
F Distributionjravish
 
Introduction to biostatistics
Introduction to biostatisticsIntroduction to biostatistics
Introduction to biostatisticsshivamdixit57
 
One way anova final ppt.
One way anova final ppt.One way anova final ppt.
One way anova final ppt.Aadab Mushrib
 

What's hot (20)

Correlation and regression analysis
Correlation and regression analysisCorrelation and regression analysis
Correlation and regression analysis
 
Parametric vs Non-Parametric
Parametric vs Non-ParametricParametric vs Non-Parametric
Parametric vs Non-Parametric
 
T test statistics
T test statisticsT test statistics
T test statistics
 
Analysis of variance (ANOVA)
Analysis of variance (ANOVA)Analysis of variance (ANOVA)
Analysis of variance (ANOVA)
 
Regression
Regression Regression
Regression
 
t distribution, paired and unpaired t-test
t distribution, paired and unpaired t-testt distribution, paired and unpaired t-test
t distribution, paired and unpaired t-test
 
Probability Distributions
Probability DistributionsProbability Distributions
Probability Distributions
 
Chi squared test
Chi squared testChi squared test
Chi squared test
 
Basic concepts of probability
Basic concepts of probabilityBasic concepts of probability
Basic concepts of probability
 
The Chi Square Test
The Chi Square TestThe Chi Square Test
The Chi Square Test
 
PROBABILITY AND IT'S TYPES WITH RULES
PROBABILITY AND IT'S TYPES WITH RULESPROBABILITY AND IT'S TYPES WITH RULES
PROBABILITY AND IT'S TYPES WITH RULES
 
Chi square test
Chi square testChi square test
Chi square test
 
Measure of Central Tendency (Mean, Median, Mode and Quantiles)
Measure of Central Tendency (Mean, Median, Mode and Quantiles)Measure of Central Tendency (Mean, Median, Mode and Quantiles)
Measure of Central Tendency (Mean, Median, Mode and Quantiles)
 
Presentation chi-square test & Anova
Presentation   chi-square test & AnovaPresentation   chi-square test & Anova
Presentation chi-square test & Anova
 
F test mamtesh ppt.pptx
F test mamtesh ppt.pptxF test mamtesh ppt.pptx
F test mamtesh ppt.pptx
 
Normal distribution
Normal distributionNormal distribution
Normal distribution
 
F Distribution
F  DistributionF  Distribution
F Distribution
 
Introduction to biostatistics
Introduction to biostatisticsIntroduction to biostatistics
Introduction to biostatistics
 
One way anova final ppt.
One way anova final ppt.One way anova final ppt.
One way anova final ppt.
 
Standard deviation
Standard deviationStandard deviation
Standard deviation
 

Viewers also liked

The Chi Square Test
The Chi Square TestThe Chi Square Test
The Chi Square TestMax Chipulu
 
Statistical concepts
Statistical conceptsStatistical concepts
Statistical conceptsCarlo Magno
 
Significance tests
Significance testsSignificance tests
Significance testsJinho Choi
 
Quantitative techniques in research
Quantitative techniques in researchQuantitative techniques in research
Quantitative techniques in researchCarlo Magno
 
Aron chpt 11 ed (2)
Aron chpt 11 ed (2)Aron chpt 11 ed (2)
Aron chpt 11 ed (2)Sandra Nicks
 
Reporting chi square goodness of fit test of independence in apa
Reporting chi square goodness of fit test of independence in apaReporting chi square goodness of fit test of independence in apa
Reporting chi square goodness of fit test of independence in apaKen Plummer
 
Friedman Test- A Presentation
Friedman Test- A PresentationFriedman Test- A Presentation
Friedman Test- A PresentationIrene Gabiana
 
Ang Mapahitas-on nga Mariposa
Ang Mapahitas-on nga MariposaAng Mapahitas-on nga Mariposa
Ang Mapahitas-on nga MariposaHuni-huni
 
Chi-Square Test of Independence
Chi-Square Test of IndependenceChi-Square Test of Independence
Chi-Square Test of IndependenceKen Plummer
 
Reporting Pearson Correlation Test of Independence in APA
Reporting Pearson Correlation Test of Independence in APAReporting Pearson Correlation Test of Independence in APA
Reporting Pearson Correlation Test of Independence in APAKen Plummer
 
GCSE Geography: How And Why To Use Spearman’s Rank
GCSE Geography: How And Why To Use Spearman’s RankGCSE Geography: How And Why To Use Spearman’s Rank
GCSE Geography: How And Why To Use Spearman’s RankMark Cowan
 
Spearman Rank Correlation Presentation
Spearman Rank Correlation PresentationSpearman Rank Correlation Presentation
Spearman Rank Correlation Presentationcae_021
 
Chi square test final
Chi square test finalChi square test final
Chi square test finalHar Jindal
 

Viewers also liked (20)

Chi square test
Chi square testChi square test
Chi square test
 
The Chi Square Test
The Chi Square TestThe Chi Square Test
The Chi Square Test
 
Statistical concepts
Statistical conceptsStatistical concepts
Statistical concepts
 
Significance tests
Significance testsSignificance tests
Significance tests
 
Hypothesis testing
Hypothesis testingHypothesis testing
Hypothesis testing
 
Lesson2
Lesson2Lesson2
Lesson2
 
Quantitative techniques in research
Quantitative techniques in researchQuantitative techniques in research
Quantitative techniques in research
 
Chi square
Chi squareChi square
Chi square
 
Aron chpt 11 ed (2)
Aron chpt 11 ed (2)Aron chpt 11 ed (2)
Aron chpt 11 ed (2)
 
Reporting chi square goodness of fit test of independence in apa
Reporting chi square goodness of fit test of independence in apaReporting chi square goodness of fit test of independence in apa
Reporting chi square goodness of fit test of independence in apa
 
Friedman Test- A Presentation
Friedman Test- A PresentationFriedman Test- A Presentation
Friedman Test- A Presentation
 
Ang Mapahitas-on nga Mariposa
Ang Mapahitas-on nga MariposaAng Mapahitas-on nga Mariposa
Ang Mapahitas-on nga Mariposa
 
Chi squared test
Chi squared testChi squared test
Chi squared test
 
Chi square analysis
Chi square analysisChi square analysis
Chi square analysis
 
Chi-Square Test of Independence
Chi-Square Test of IndependenceChi-Square Test of Independence
Chi-Square Test of Independence
 
Reporting Pearson Correlation Test of Independence in APA
Reporting Pearson Correlation Test of Independence in APAReporting Pearson Correlation Test of Independence in APA
Reporting Pearson Correlation Test of Independence in APA
 
GCSE Geography: How And Why To Use Spearman’s Rank
GCSE Geography: How And Why To Use Spearman’s RankGCSE Geography: How And Why To Use Spearman’s Rank
GCSE Geography: How And Why To Use Spearman’s Rank
 
Spearman Rank Correlation Presentation
Spearman Rank Correlation PresentationSpearman Rank Correlation Presentation
Spearman Rank Correlation Presentation
 
Chi square test final
Chi square test finalChi square test final
Chi square test final
 
Correlation
CorrelationCorrelation
Correlation
 

Similar to The Chi Square Goodness of Fit Test

Chi square distribution and analysis of frequencies.pptx
Chi square distribution and analysis of frequencies.pptxChi square distribution and analysis of frequencies.pptx
Chi square distribution and analysis of frequencies.pptxZayYa9
 
random variable and distribution
random variable and distributionrandom variable and distribution
random variable and distributionlovemucheca
 
Str t-test1
Str   t-test1Str   t-test1
Str t-test1iamkim
 
Top schools in India | Delhi NCR | Noida |
Top schools in India | Delhi NCR | Noida | Top schools in India | Delhi NCR | Noida |
Top schools in India | Delhi NCR | Noida | Edhole.com
 
Chi square[1]
Chi square[1]Chi square[1]
Chi square[1]sbarkanic
 
Geneticschapter2part2 140126121602-phpapp02
Geneticschapter2part2 140126121602-phpapp02Geneticschapter2part2 140126121602-phpapp02
Geneticschapter2part2 140126121602-phpapp02Cleophas Rwemera
 
Top schools in ghaziabad
Top schools in ghaziabadTop schools in ghaziabad
Top schools in ghaziabadEdhole.com
 
Lect w7 t_test_amp_chi_test
Lect w7 t_test_amp_chi_testLect w7 t_test_amp_chi_test
Lect w7 t_test_amp_chi_testRione Drevale
 
ch09-Simulation.ppt
ch09-Simulation.pptch09-Simulation.ppt
ch09-Simulation.pptLuckySaigon1
 

Similar to The Chi Square Goodness of Fit Test (20)

Chi sequare
Chi sequareChi sequare
Chi sequare
 
Chi square test
Chi square test Chi square test
Chi square test
 
Probability Theory for Data Scientists
Probability Theory for Data ScientistsProbability Theory for Data Scientists
Probability Theory for Data Scientists
 
Chi square distribution and analysis of frequencies.pptx
Chi square distribution and analysis of frequencies.pptxChi square distribution and analysis of frequencies.pptx
Chi square distribution and analysis of frequencies.pptx
 
random variable and distribution
random variable and distributionrandom variable and distribution
random variable and distribution
 
Goodness of fit (ppt)
Goodness of fit (ppt)Goodness of fit (ppt)
Goodness of fit (ppt)
 
Business research methods 2
Business research methods 2Business research methods 2
Business research methods 2
 
Str t-test1
Str   t-test1Str   t-test1
Str t-test1
 
Chapter7ppt.pdf
Chapter7ppt.pdfChapter7ppt.pdf
Chapter7ppt.pdf
 
Top schools in India | Delhi NCR | Noida |
Top schools in India | Delhi NCR | Noida | Top schools in India | Delhi NCR | Noida |
Top schools in India | Delhi NCR | Noida |
 
Chi square[1]
Chi square[1]Chi square[1]
Chi square[1]
 
Chi square test
Chi square testChi square test
Chi square test
 
Random Error Theory
Random Error TheoryRandom Error Theory
Random Error Theory
 
Geneticschapter2part2 140126121602-phpapp02
Geneticschapter2part2 140126121602-phpapp02Geneticschapter2part2 140126121602-phpapp02
Geneticschapter2part2 140126121602-phpapp02
 
Probability and Statistics - Week 1
Probability and Statistics - Week 1Probability and Statistics - Week 1
Probability and Statistics - Week 1
 
Probablity
ProbablityProbablity
Probablity
 
Top schools in ghaziabad
Top schools in ghaziabadTop schools in ghaziabad
Top schools in ghaziabad
 
Probability
ProbabilityProbability
Probability
 
Lect w7 t_test_amp_chi_test
Lect w7 t_test_amp_chi_testLect w7 t_test_amp_chi_test
Lect w7 t_test_amp_chi_test
 
ch09-Simulation.ppt
ch09-Simulation.pptch09-Simulation.ppt
ch09-Simulation.ppt
 

Recently uploaded

Human Factors of XR: Using Human Factors to Design XR Systems
Human Factors of XR: Using Human Factors to Design XR SystemsHuman Factors of XR: Using Human Factors to Design XR Systems
Human Factors of XR: Using Human Factors to Design XR SystemsMark Billinghurst
 
Kotlin Multiplatform & Compose Multiplatform - Starter kit for pragmatics
Kotlin Multiplatform & Compose Multiplatform - Starter kit for pragmaticsKotlin Multiplatform & Compose Multiplatform - Starter kit for pragmatics
Kotlin Multiplatform & Compose Multiplatform - Starter kit for pragmaticscarlostorres15106
 
Vector Databases 101 - An introduction to the world of Vector Databases
Vector Databases 101 - An introduction to the world of Vector DatabasesVector Databases 101 - An introduction to the world of Vector Databases
Vector Databases 101 - An introduction to the world of Vector DatabasesZilliz
 
DevEX - reference for building teams, processes, and platforms
DevEX - reference for building teams, processes, and platformsDevEX - reference for building teams, processes, and platforms
DevEX - reference for building teams, processes, and platformsSergiu Bodiu
 
Vertex AI Gemini Prompt Engineering Tips
Vertex AI Gemini Prompt Engineering TipsVertex AI Gemini Prompt Engineering Tips
Vertex AI Gemini Prompt Engineering TipsMiki Katsuragi
 
Search Engine Optimization SEO PDF for 2024.pdf
Search Engine Optimization SEO PDF for 2024.pdfSearch Engine Optimization SEO PDF for 2024.pdf
Search Engine Optimization SEO PDF for 2024.pdfRankYa
 
Integration and Automation in Practice: CI/CD in Mule Integration and Automat...
Integration and Automation in Practice: CI/CD in Mule Integration and Automat...Integration and Automation in Practice: CI/CD in Mule Integration and Automat...
Integration and Automation in Practice: CI/CD in Mule Integration and Automat...Patryk Bandurski
 
Transcript: New from BookNet Canada for 2024: BNC CataList - Tech Forum 2024
Transcript: New from BookNet Canada for 2024: BNC CataList - Tech Forum 2024Transcript: New from BookNet Canada for 2024: BNC CataList - Tech Forum 2024
Transcript: New from BookNet Canada for 2024: BNC CataList - Tech Forum 2024BookNet Canada
 
Gen AI in Business - Global Trends Report 2024.pdf
Gen AI in Business - Global Trends Report 2024.pdfGen AI in Business - Global Trends Report 2024.pdf
Gen AI in Business - Global Trends Report 2024.pdfAddepto
 
Beyond Boundaries: Leveraging No-Code Solutions for Industry Innovation
Beyond Boundaries: Leveraging No-Code Solutions for Industry InnovationBeyond Boundaries: Leveraging No-Code Solutions for Industry Innovation
Beyond Boundaries: Leveraging No-Code Solutions for Industry InnovationSafe Software
 
Scanning the Internet for External Cloud Exposures via SSL Certs
Scanning the Internet for External Cloud Exposures via SSL CertsScanning the Internet for External Cloud Exposures via SSL Certs
Scanning the Internet for External Cloud Exposures via SSL CertsRizwan Syed
 
Ensuring Technical Readiness For Copilot in Microsoft 365
Ensuring Technical Readiness For Copilot in Microsoft 365Ensuring Technical Readiness For Copilot in Microsoft 365
Ensuring Technical Readiness For Copilot in Microsoft 3652toLead Limited
 
Unraveling Multimodality with Large Language Models.pdf
Unraveling Multimodality with Large Language Models.pdfUnraveling Multimodality with Large Language Models.pdf
Unraveling Multimodality with Large Language Models.pdfAlex Barbosa Coqueiro
 
Nell’iperspazio con Rocket: il Framework Web di Rust!
Nell’iperspazio con Rocket: il Framework Web di Rust!Nell’iperspazio con Rocket: il Framework Web di Rust!
Nell’iperspazio con Rocket: il Framework Web di Rust!Commit University
 
Advanced Test Driven-Development @ php[tek] 2024
Advanced Test Driven-Development @ php[tek] 2024Advanced Test Driven-Development @ php[tek] 2024
Advanced Test Driven-Development @ php[tek] 2024Scott Keck-Warren
 
Leverage Zilliz Serverless - Up to 50X Saving for Your Vector Storage Cost
Leverage Zilliz Serverless - Up to 50X Saving for Your Vector Storage CostLeverage Zilliz Serverless - Up to 50X Saving for Your Vector Storage Cost
Leverage Zilliz Serverless - Up to 50X Saving for Your Vector Storage CostZilliz
 
Story boards and shot lists for my a level piece
Story boards and shot lists for my a level pieceStory boards and shot lists for my a level piece
Story boards and shot lists for my a level piececharlottematthew16
 
"LLMs for Python Engineers: Advanced Data Analysis and Semantic Kernel",Oleks...
"LLMs for Python Engineers: Advanced Data Analysis and Semantic Kernel",Oleks..."LLMs for Python Engineers: Advanced Data Analysis and Semantic Kernel",Oleks...
"LLMs for Python Engineers: Advanced Data Analysis and Semantic Kernel",Oleks...Fwdays
 
Commit 2024 - Secret Management made easy
Commit 2024 - Secret Management made easyCommit 2024 - Secret Management made easy
Commit 2024 - Secret Management made easyAlfredo García Lavilla
 
Powerpoint exploring the locations used in television show Time Clash
Powerpoint exploring the locations used in television show Time ClashPowerpoint exploring the locations used in television show Time Clash
Powerpoint exploring the locations used in television show Time Clashcharlottematthew16
 

Recently uploaded (20)

Human Factors of XR: Using Human Factors to Design XR Systems
Human Factors of XR: Using Human Factors to Design XR SystemsHuman Factors of XR: Using Human Factors to Design XR Systems
Human Factors of XR: Using Human Factors to Design XR Systems
 
Kotlin Multiplatform & Compose Multiplatform - Starter kit for pragmatics
Kotlin Multiplatform & Compose Multiplatform - Starter kit for pragmaticsKotlin Multiplatform & Compose Multiplatform - Starter kit for pragmatics
Kotlin Multiplatform & Compose Multiplatform - Starter kit for pragmatics
 
Vector Databases 101 - An introduction to the world of Vector Databases
Vector Databases 101 - An introduction to the world of Vector DatabasesVector Databases 101 - An introduction to the world of Vector Databases
Vector Databases 101 - An introduction to the world of Vector Databases
 
DevEX - reference for building teams, processes, and platforms
DevEX - reference for building teams, processes, and platformsDevEX - reference for building teams, processes, and platforms
DevEX - reference for building teams, processes, and platforms
 
Vertex AI Gemini Prompt Engineering Tips
Vertex AI Gemini Prompt Engineering TipsVertex AI Gemini Prompt Engineering Tips
Vertex AI Gemini Prompt Engineering Tips
 
Search Engine Optimization SEO PDF for 2024.pdf
Search Engine Optimization SEO PDF for 2024.pdfSearch Engine Optimization SEO PDF for 2024.pdf
Search Engine Optimization SEO PDF for 2024.pdf
 
Integration and Automation in Practice: CI/CD in Mule Integration and Automat...
Integration and Automation in Practice: CI/CD in Mule Integration and Automat...Integration and Automation in Practice: CI/CD in Mule Integration and Automat...
Integration and Automation in Practice: CI/CD in Mule Integration and Automat...
 
Transcript: New from BookNet Canada for 2024: BNC CataList - Tech Forum 2024
Transcript: New from BookNet Canada for 2024: BNC CataList - Tech Forum 2024Transcript: New from BookNet Canada for 2024: BNC CataList - Tech Forum 2024
Transcript: New from BookNet Canada for 2024: BNC CataList - Tech Forum 2024
 
Gen AI in Business - Global Trends Report 2024.pdf
Gen AI in Business - Global Trends Report 2024.pdfGen AI in Business - Global Trends Report 2024.pdf
Gen AI in Business - Global Trends Report 2024.pdf
 
Beyond Boundaries: Leveraging No-Code Solutions for Industry Innovation
Beyond Boundaries: Leveraging No-Code Solutions for Industry InnovationBeyond Boundaries: Leveraging No-Code Solutions for Industry Innovation
Beyond Boundaries: Leveraging No-Code Solutions for Industry Innovation
 
Scanning the Internet for External Cloud Exposures via SSL Certs
Scanning the Internet for External Cloud Exposures via SSL CertsScanning the Internet for External Cloud Exposures via SSL Certs
Scanning the Internet for External Cloud Exposures via SSL Certs
 
Ensuring Technical Readiness For Copilot in Microsoft 365
Ensuring Technical Readiness For Copilot in Microsoft 365Ensuring Technical Readiness For Copilot in Microsoft 365
Ensuring Technical Readiness For Copilot in Microsoft 365
 
Unraveling Multimodality with Large Language Models.pdf
Unraveling Multimodality with Large Language Models.pdfUnraveling Multimodality with Large Language Models.pdf
Unraveling Multimodality with Large Language Models.pdf
 
Nell’iperspazio con Rocket: il Framework Web di Rust!
Nell’iperspazio con Rocket: il Framework Web di Rust!Nell’iperspazio con Rocket: il Framework Web di Rust!
Nell’iperspazio con Rocket: il Framework Web di Rust!
 
Advanced Test Driven-Development @ php[tek] 2024
Advanced Test Driven-Development @ php[tek] 2024Advanced Test Driven-Development @ php[tek] 2024
Advanced Test Driven-Development @ php[tek] 2024
 
Leverage Zilliz Serverless - Up to 50X Saving for Your Vector Storage Cost
Leverage Zilliz Serverless - Up to 50X Saving for Your Vector Storage CostLeverage Zilliz Serverless - Up to 50X Saving for Your Vector Storage Cost
Leverage Zilliz Serverless - Up to 50X Saving for Your Vector Storage Cost
 
Story boards and shot lists for my a level piece
Story boards and shot lists for my a level pieceStory boards and shot lists for my a level piece
Story boards and shot lists for my a level piece
 
"LLMs for Python Engineers: Advanced Data Analysis and Semantic Kernel",Oleks...
"LLMs for Python Engineers: Advanced Data Analysis and Semantic Kernel",Oleks..."LLMs for Python Engineers: Advanced Data Analysis and Semantic Kernel",Oleks...
"LLMs for Python Engineers: Advanced Data Analysis and Semantic Kernel",Oleks...
 
Commit 2024 - Secret Management made easy
Commit 2024 - Secret Management made easyCommit 2024 - Secret Management made easy
Commit 2024 - Secret Management made easy
 
Powerpoint exploring the locations used in television show Time Clash
Powerpoint exploring the locations used in television show Time ClashPowerpoint exploring the locations used in television show Time Clash
Powerpoint exploring the locations used in television show Time Clash
 

The Chi Square Goodness of Fit Test

  • 1. The Chi Square Test • A statistical method used to determine goodness of fit – Goodness of fit refers to how close the observed data are to those predicted from a hypothesis • Note: – The chi square test does not prove that a hypothesis is correct • It evaluates to what extent the data and the hypothesis have a good fit
  • 2. The Chi Square Test (we will cover this in lab; the following slides will be useful to review after that lab) • The general formula is χ2 = Σ (O – E)2 E • where – O = observed data in each category – E = observed data in each category based on the experimenter’s hypothesis Σ = Sum of the calculations for each category
  • 3. • Consider the following example in Drosophila melanogaster • Gene affecting wing shape – c+ = Normal wing – c = Curved wing • Gene affecting body color – e+ = Normal (gray) – e = ebony • Note: – The wild-type allele is designated with a + sign – Recessive mutant alleles are designated with lowercase letters • The Cross: – A cross is made between two true-breeding flies (c+c+e+e+ and ccee). The flies of the F1 generation are then allowed to mate with each other to produce an F2 generation.
  • 4. • The outcome – F1 generation • All offspring have straight wings and gray bodies – F2 generation • • • • • 193 straight wings, gray bodies 69 straight wings, ebony bodies 64 curved wings, gray bodies 26 curved wings, ebony bodies 352 total flies • Applying the chi square test – Step 1: Propose a null hypothesis (Ho) that allows us to calculate the expected values based on Mendel’s laws • The two traits are independently assorting
  • 5. – Step 2: Calculate the expected values of the four phenotypes, based on the hypothesis • According to our hypothesis, there should be a 9:3:3:1 ratio on the F2 generation Phenotype Expected probability Expected number Observed number straight wings, gray bodies 9/16 9/16 X 352 = 198 193 straight wings, ebony bodies 3/16 3/16 X 352 = 66 64 curved wings, gray bodies 3/16 3/16 X 352 = 66 62 curved wings, ebony bodies 1/16 1/16 X 352 = 22 24
  • 6. – Step 3: Apply the chi square formula χ2 = χ2 = (O1 – E1)2 E1 (193 – 198)2 198 + + (O2 – E2)2 E2 (69 – 66)2 66 χ2 = 0.13 + 0.14 + 0.06 + 0.73 χ = 1.06 2 + + (O3 – E3)2 E3 (64 – 66)2 66 + + (O4 – E4)2 E4 (26 – 22)2 22 Expected number Observed number 198 193 66 64 66 62 22 24
  • 7. • Step 4: Interpret the chi square value – The calculated chi square value can be used to obtain probabilities, or P values, from a chi square table • These probabilities allow us to determine the likelihood that the observed deviations are due to random chance alone – Low chi square values indicate a high probability that the observed deviations could be due to random chance alone – High chi square values indicate a low probability that the observed deviations are due to random chance alone – If the chi square value results in a probability that is less than 0.05 (ie: less than 5%) it is considered statistically significant • The hypothesis is rejected
  • 8. • Step 4: Interpret the chi square value – Before we can use the chi square table, we have to determine the degrees of freedom (df) • The df is a measure of the number of categories that are independent of each other • If you know the 3 of the 4 categories you can deduce the 4th (total number of progeny – categories 1-3) • df = n – 1 – where n = total number of categories • In our experiment, there are four phenotypes/categories – Therefore, df = 4 – 1 = 3 – Refer to Table 2.1
  • 10. • Step 4: Interpret the chi square value – With df = 3, the chi square value of 1.06 is slightly greater than 1.005 (which corresponds to P-value = 0.80) – P-value = 0.80 means that Chi-square values equal to or greater than 1.005 are expected to occur 80% of the time due to random chance alone; that is, when the null hypothesis is true. – Therefore, it is quite probable that the deviations between the observed and expected values in this experiment can be explained by random sampling error and the null hypothesis is not rejected. What was the null hypothesis?