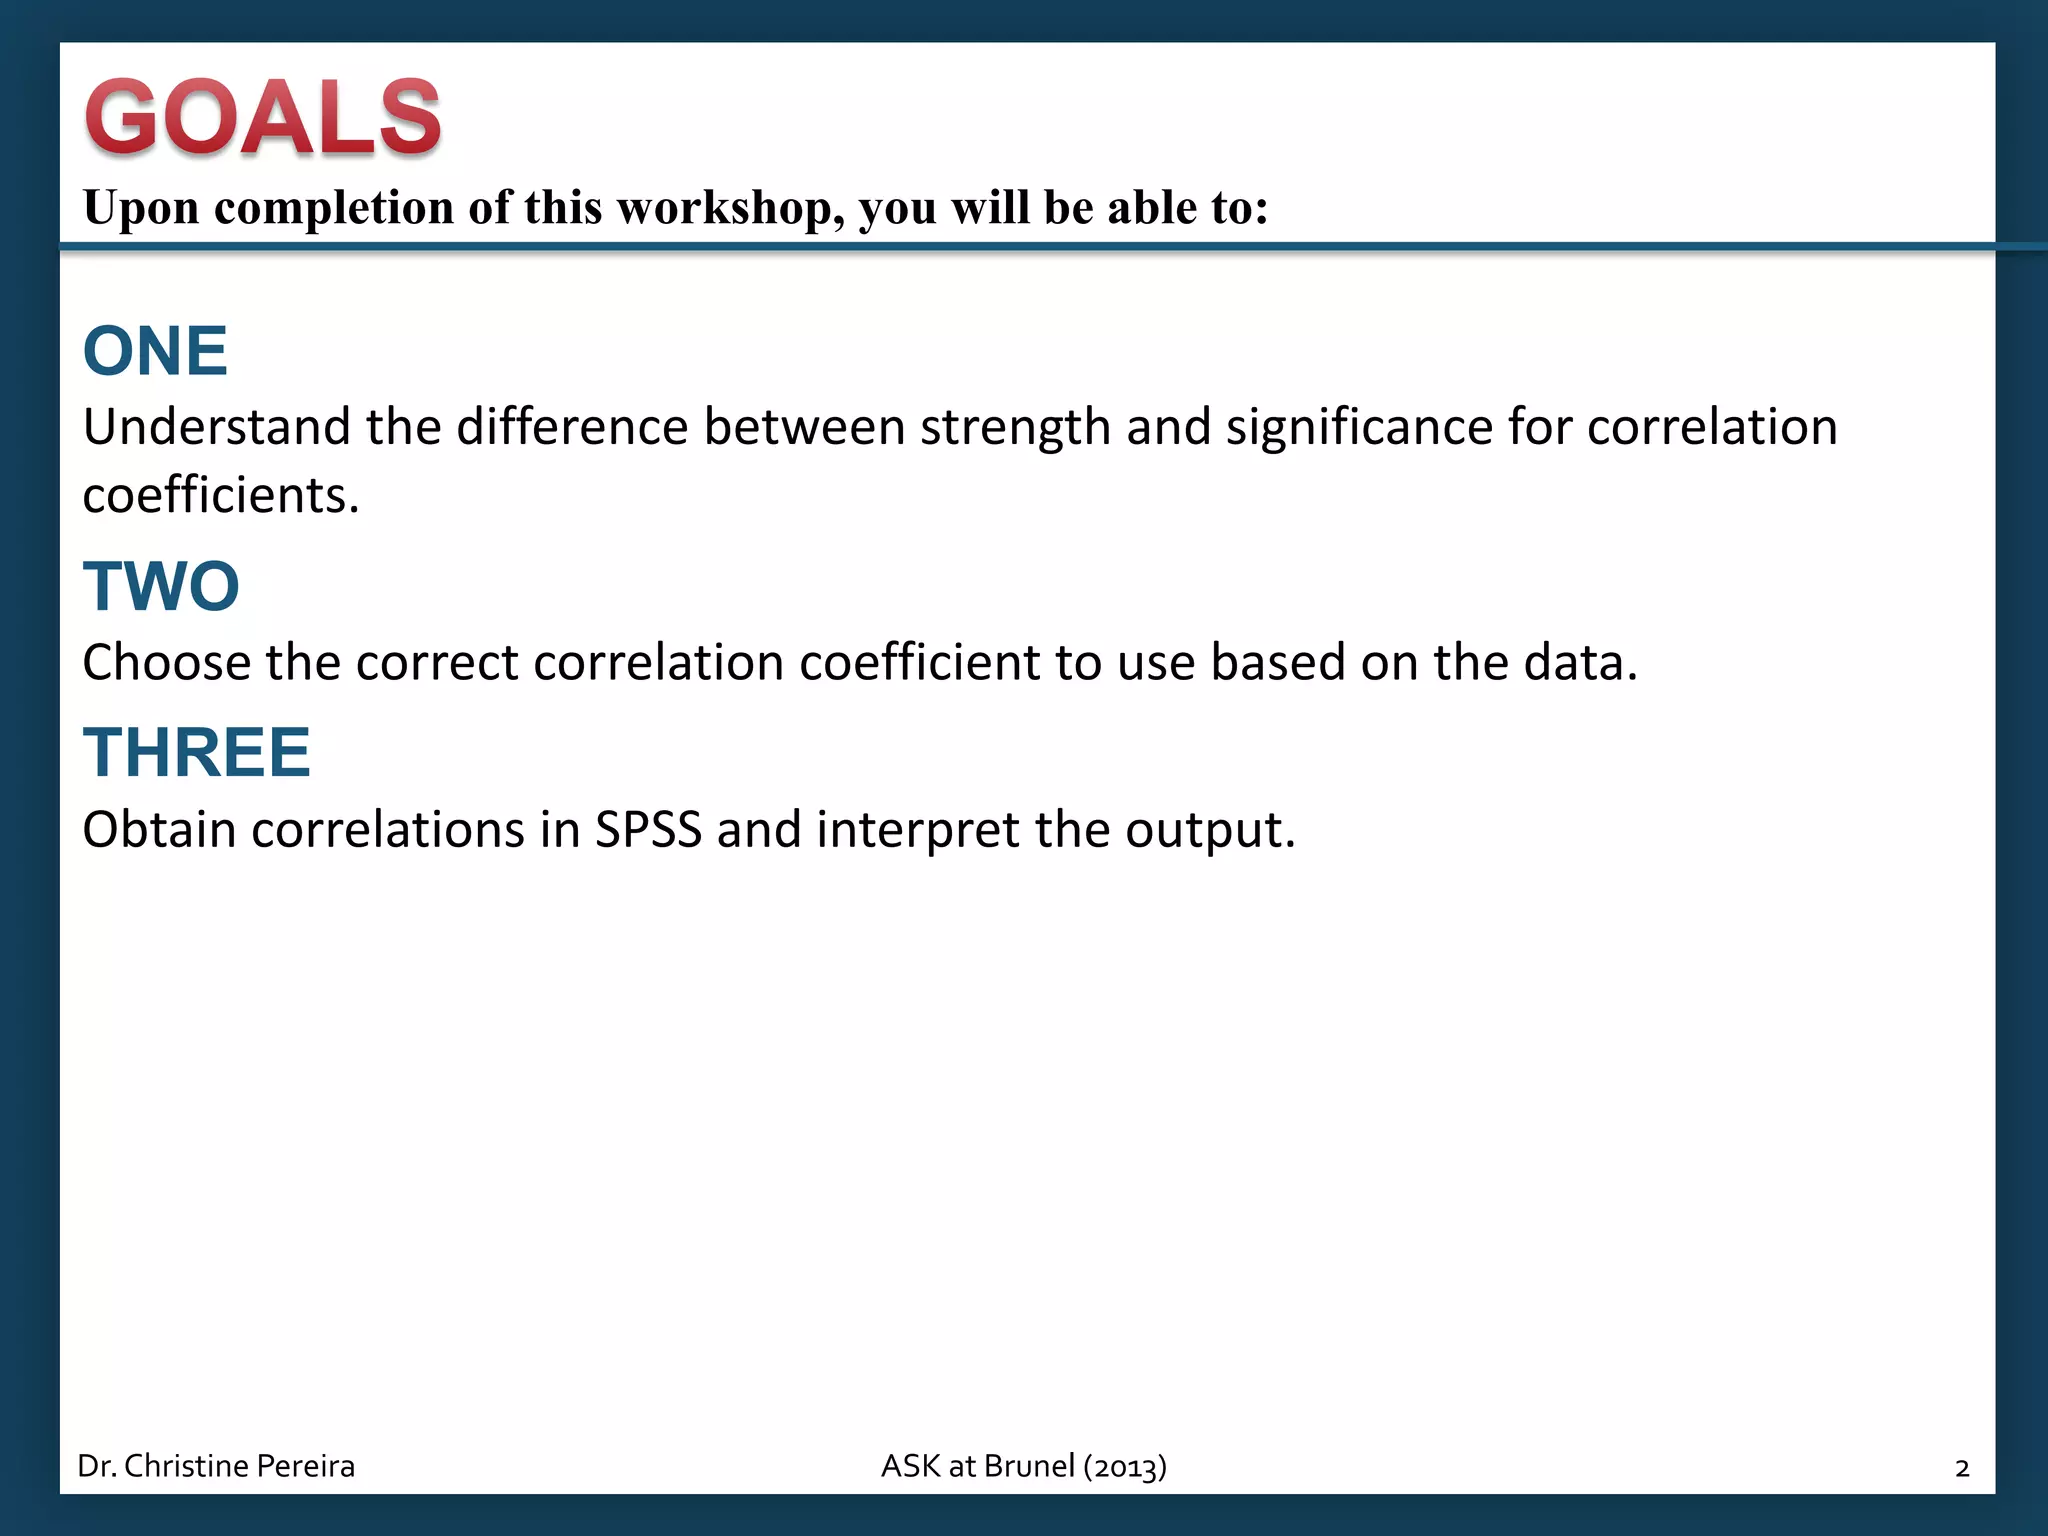

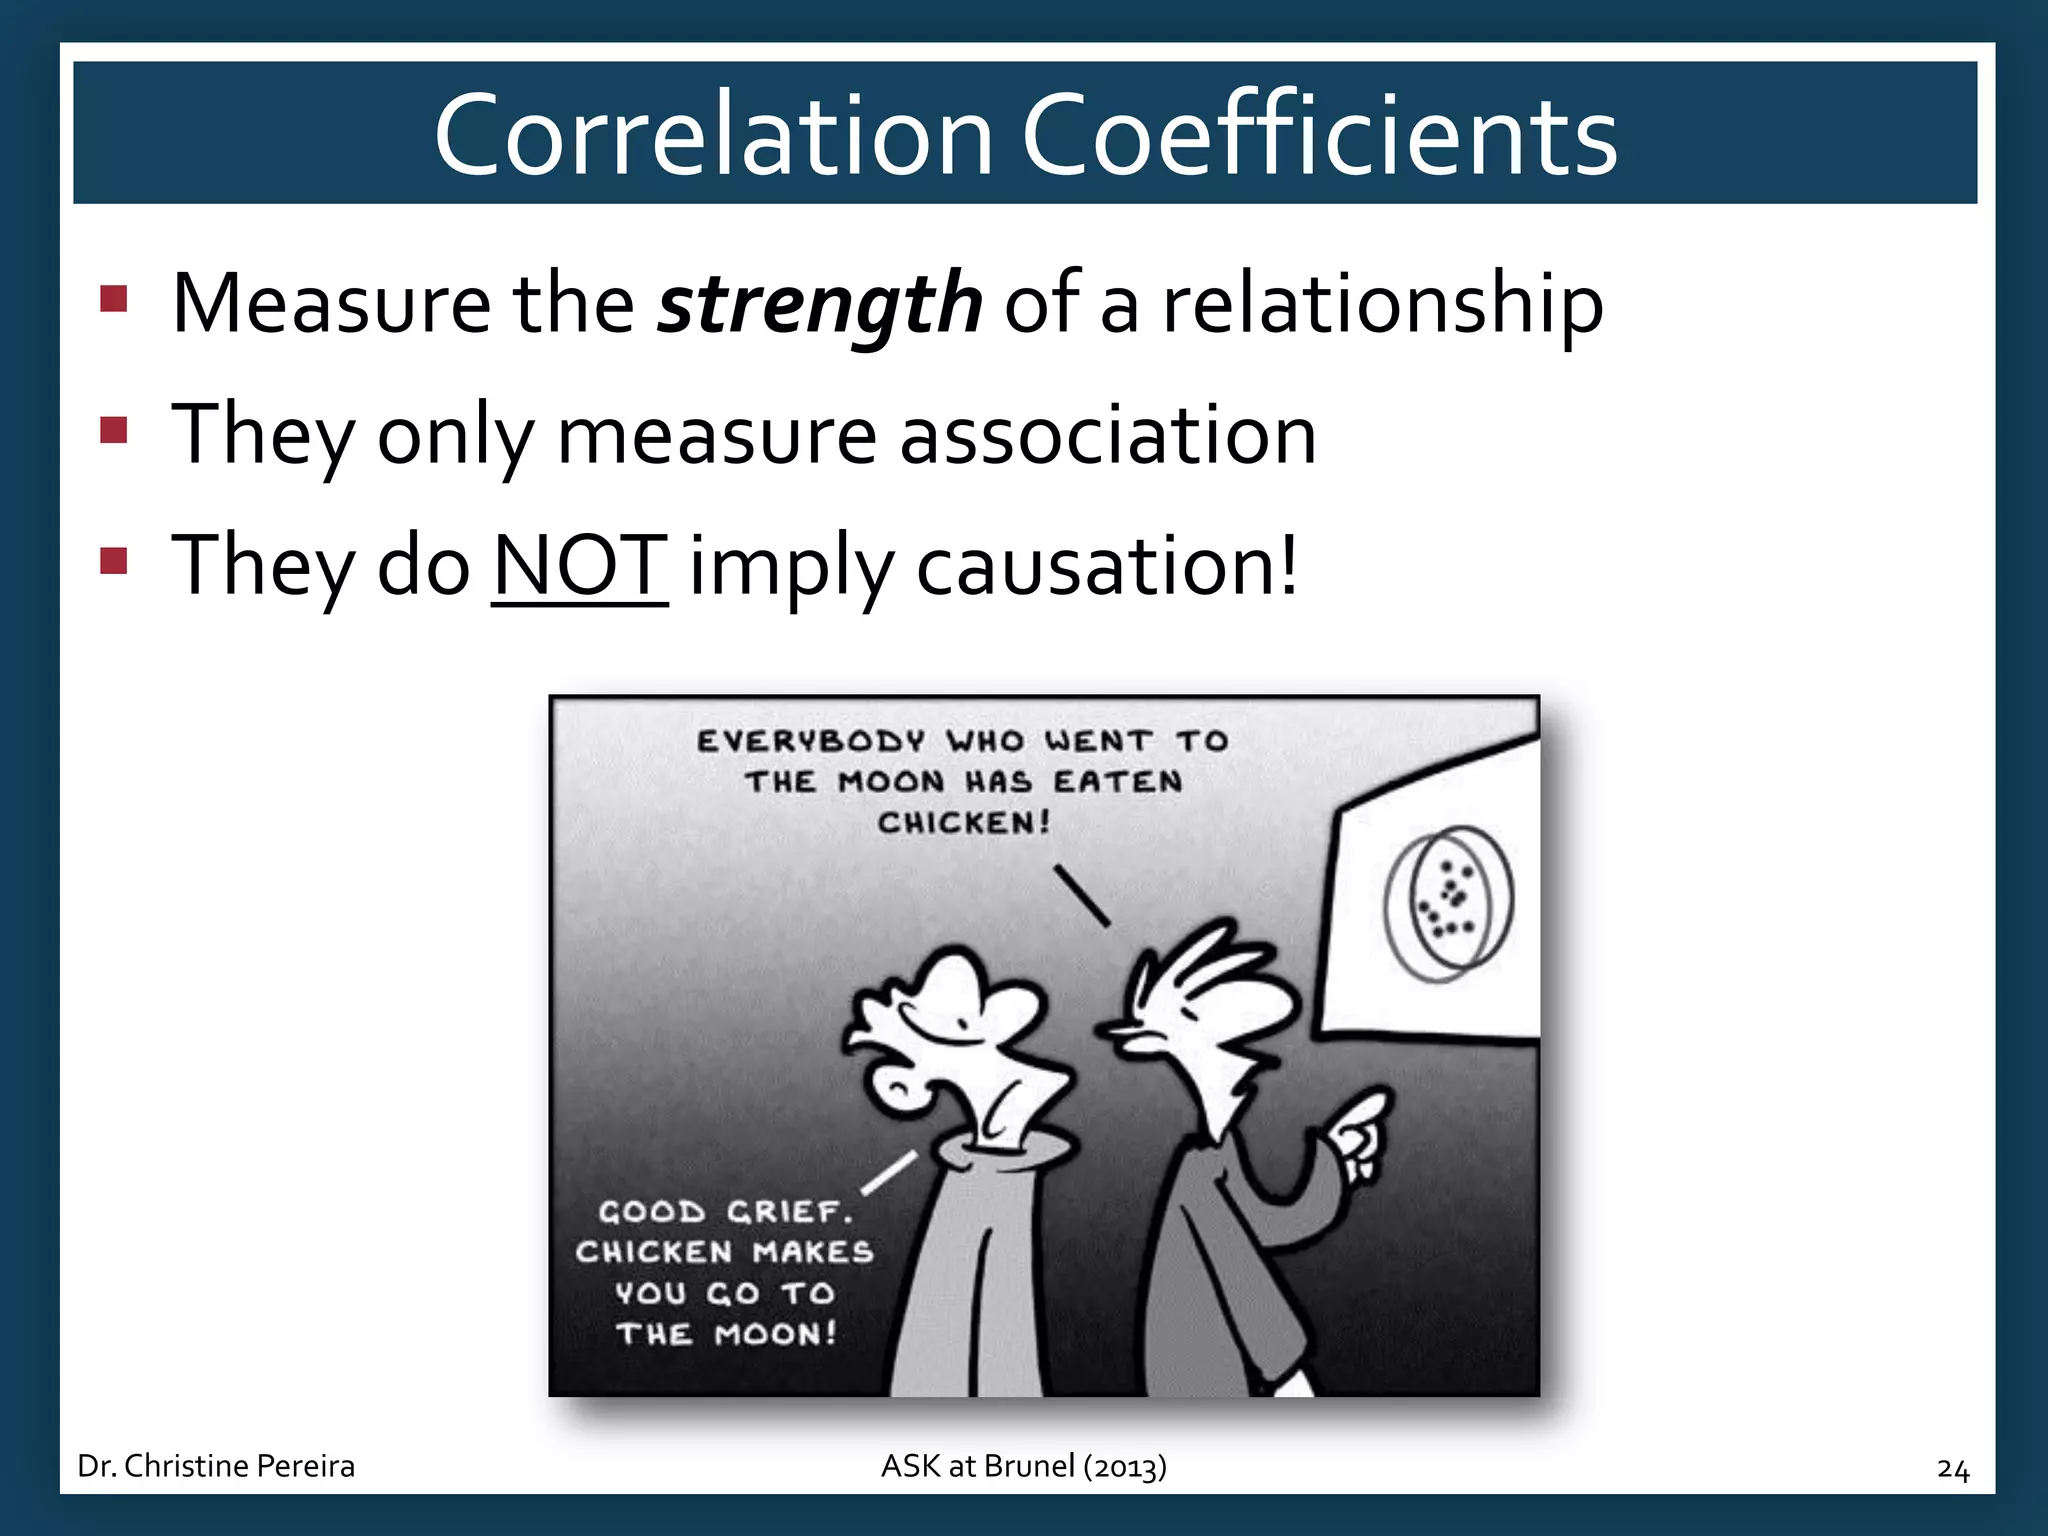
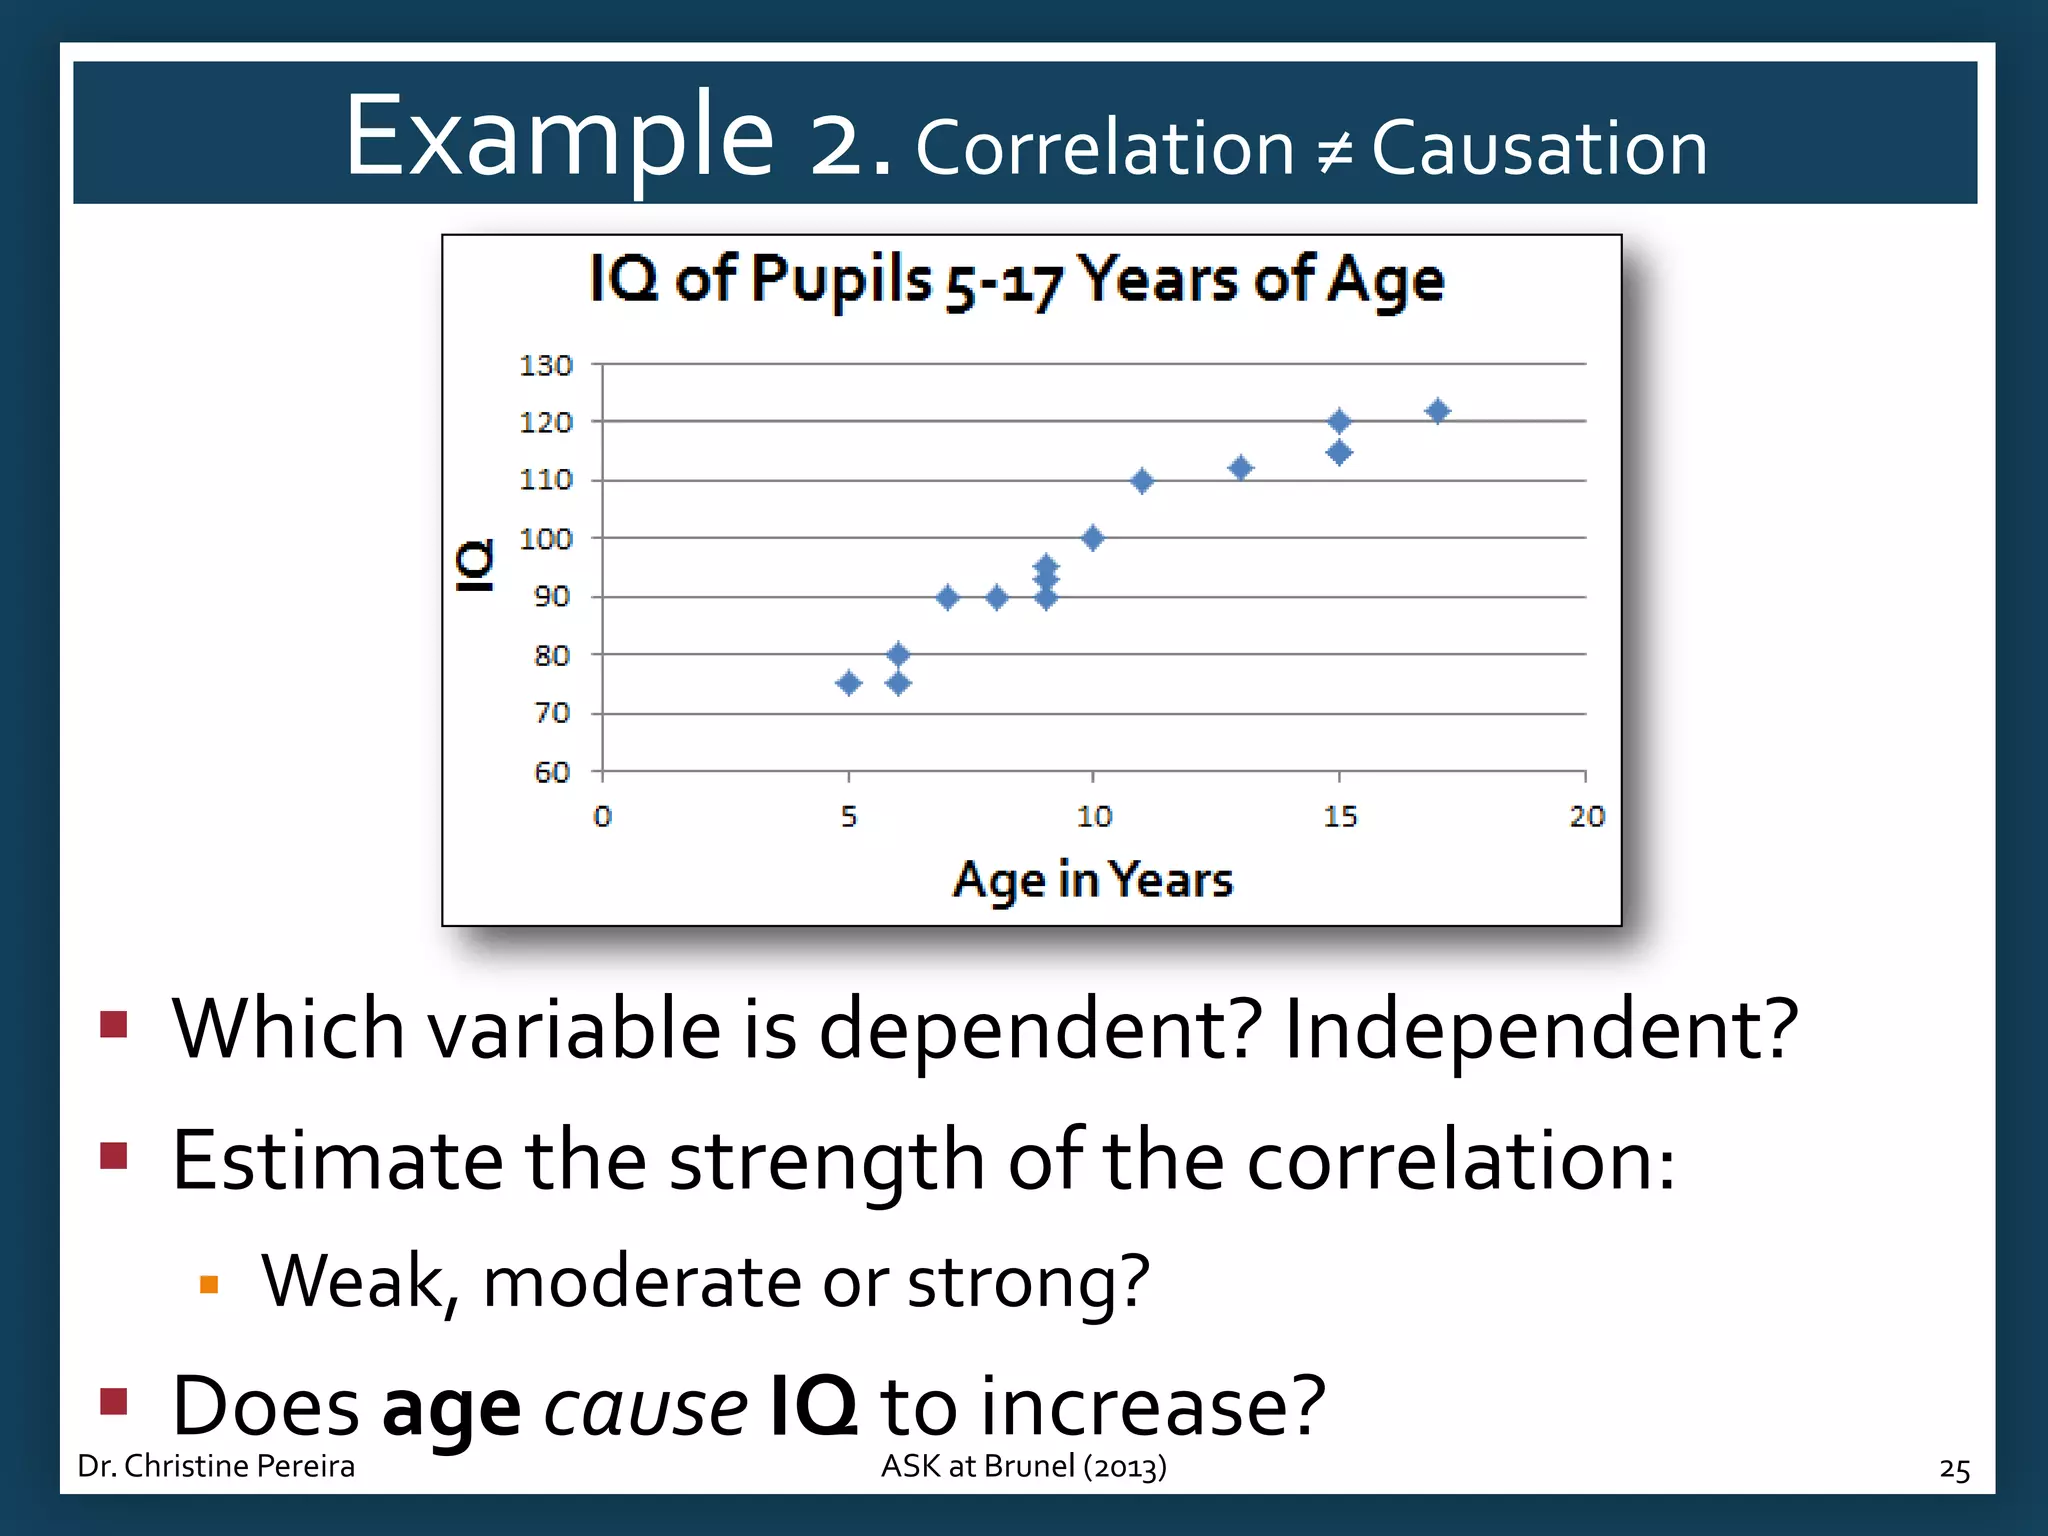


This document provides an overview of correlation coefficients and how to interpret them. It discusses the difference between correlation strength and significance. The key points covered are: ONE: Correlation coefficients measure the strength and direction of association between two variables but do not imply causation. Strength is evaluated on a scale from -1 to 1 while significance is determined by comparing the p-value to the significance level alpha. TWO: There are two parts to interpreting a correlation - the coefficient indicates strength (weak, moderate, strong) while the p-value determines if the correlation is statistically significant or could be due to chance. THREE: Examples are provided to demonstrate how to interpret correlation output and determine the most strongly correlated variables
Introduction by Dr. Christine Pereira; Overview of workshop objectives including understanding correlation coefficients.
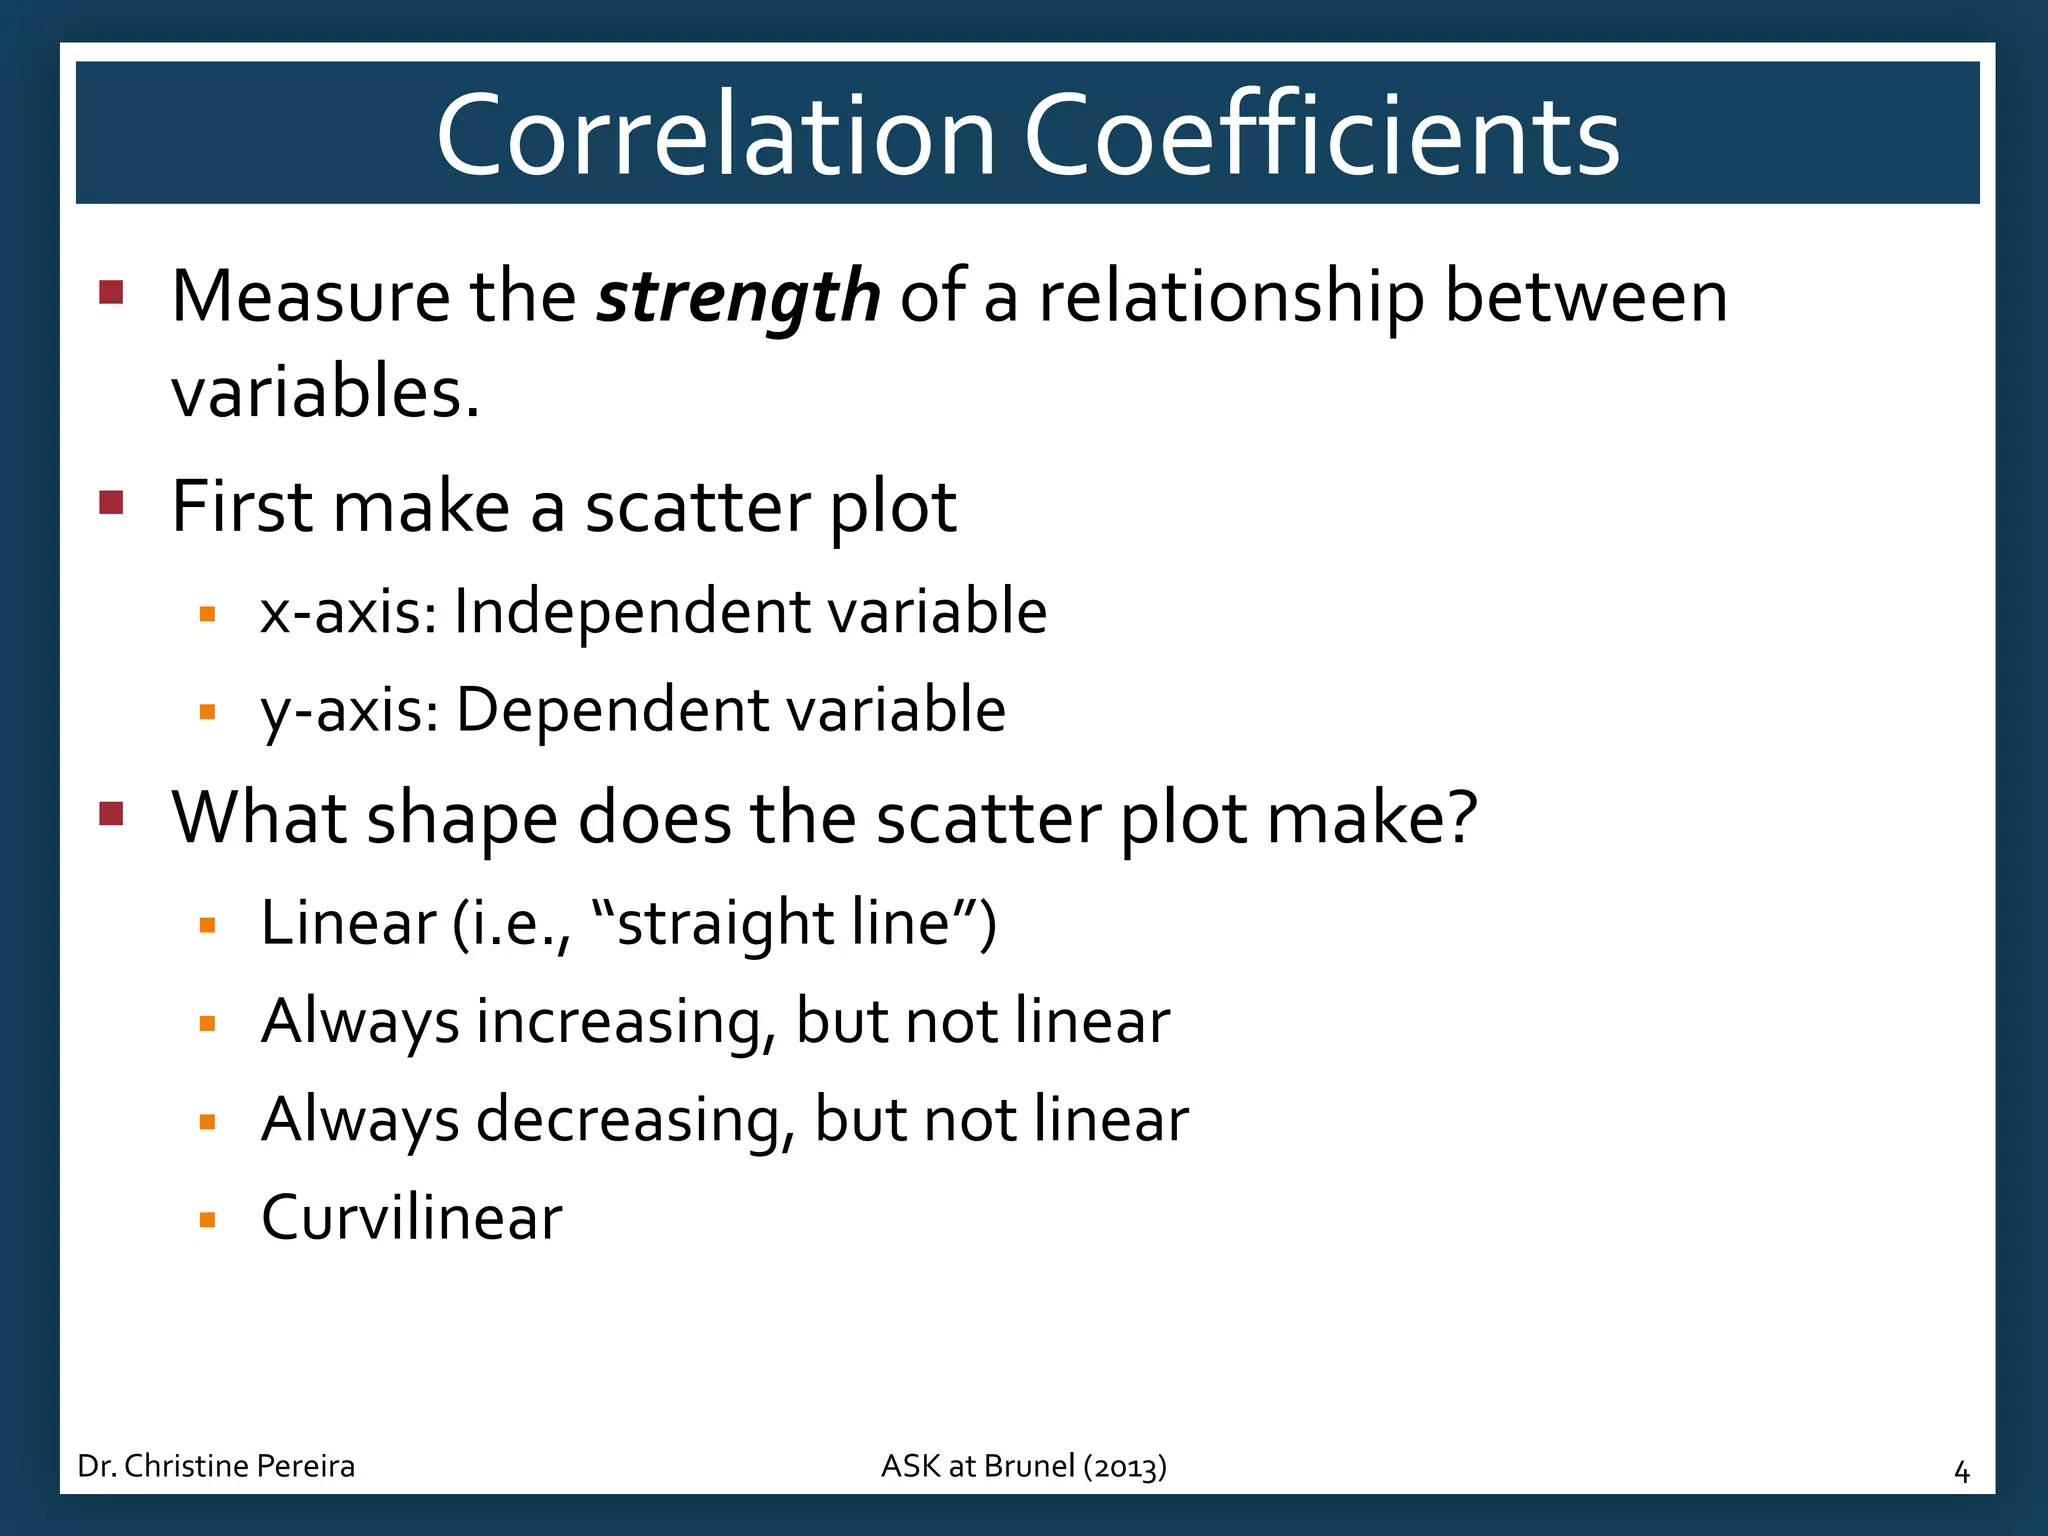
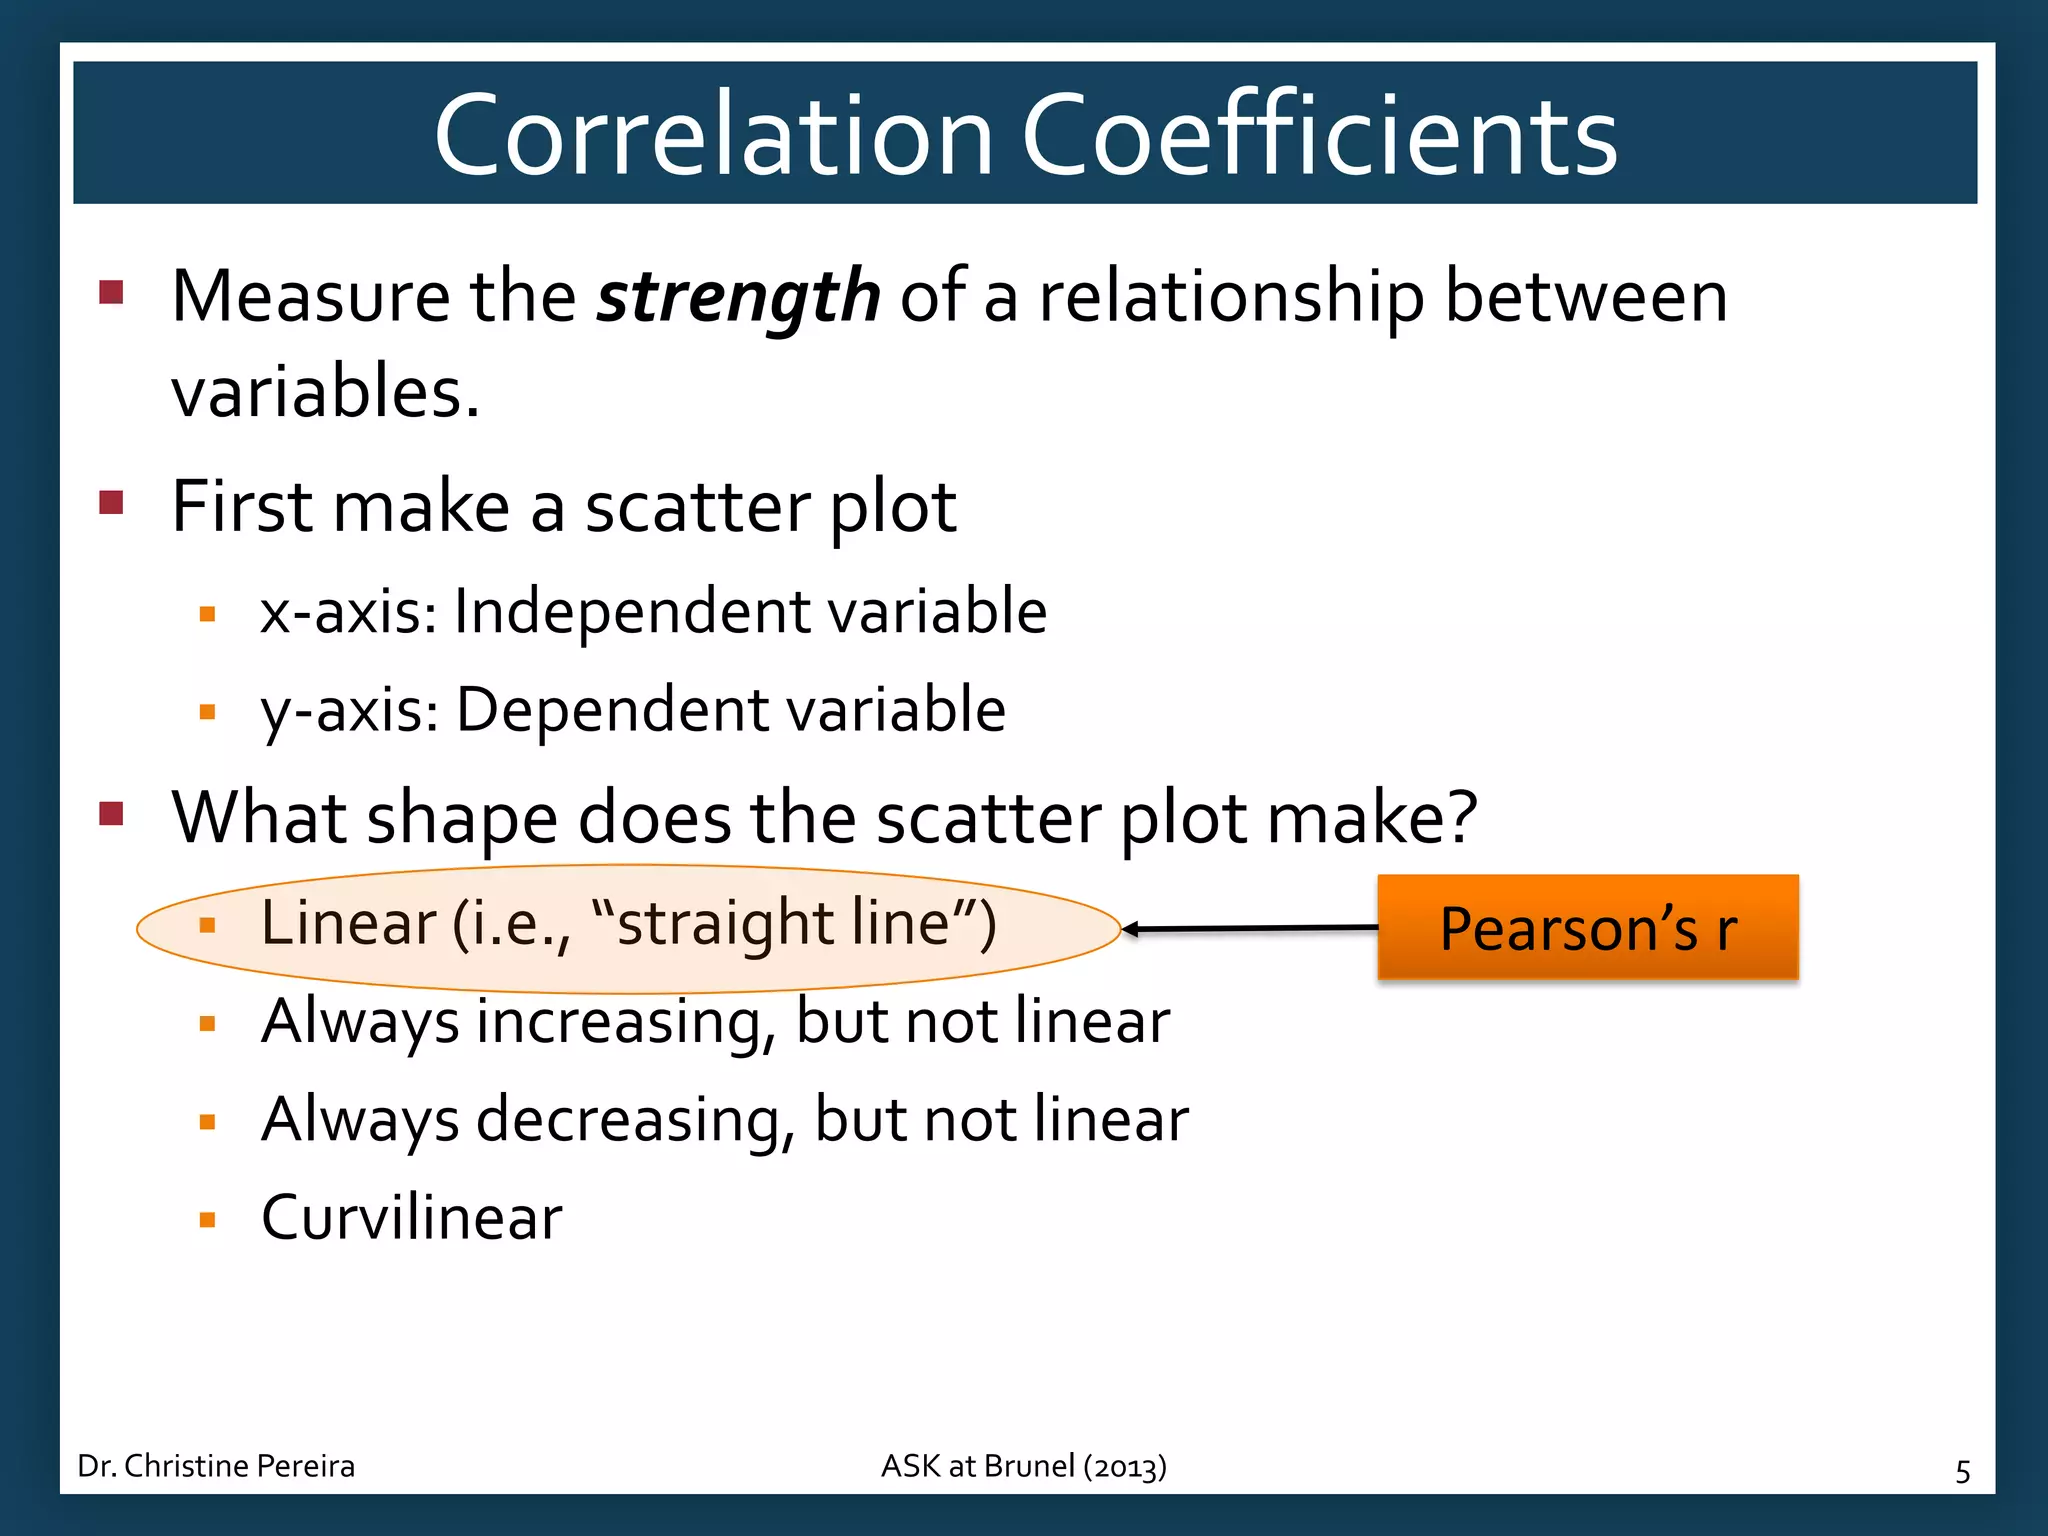
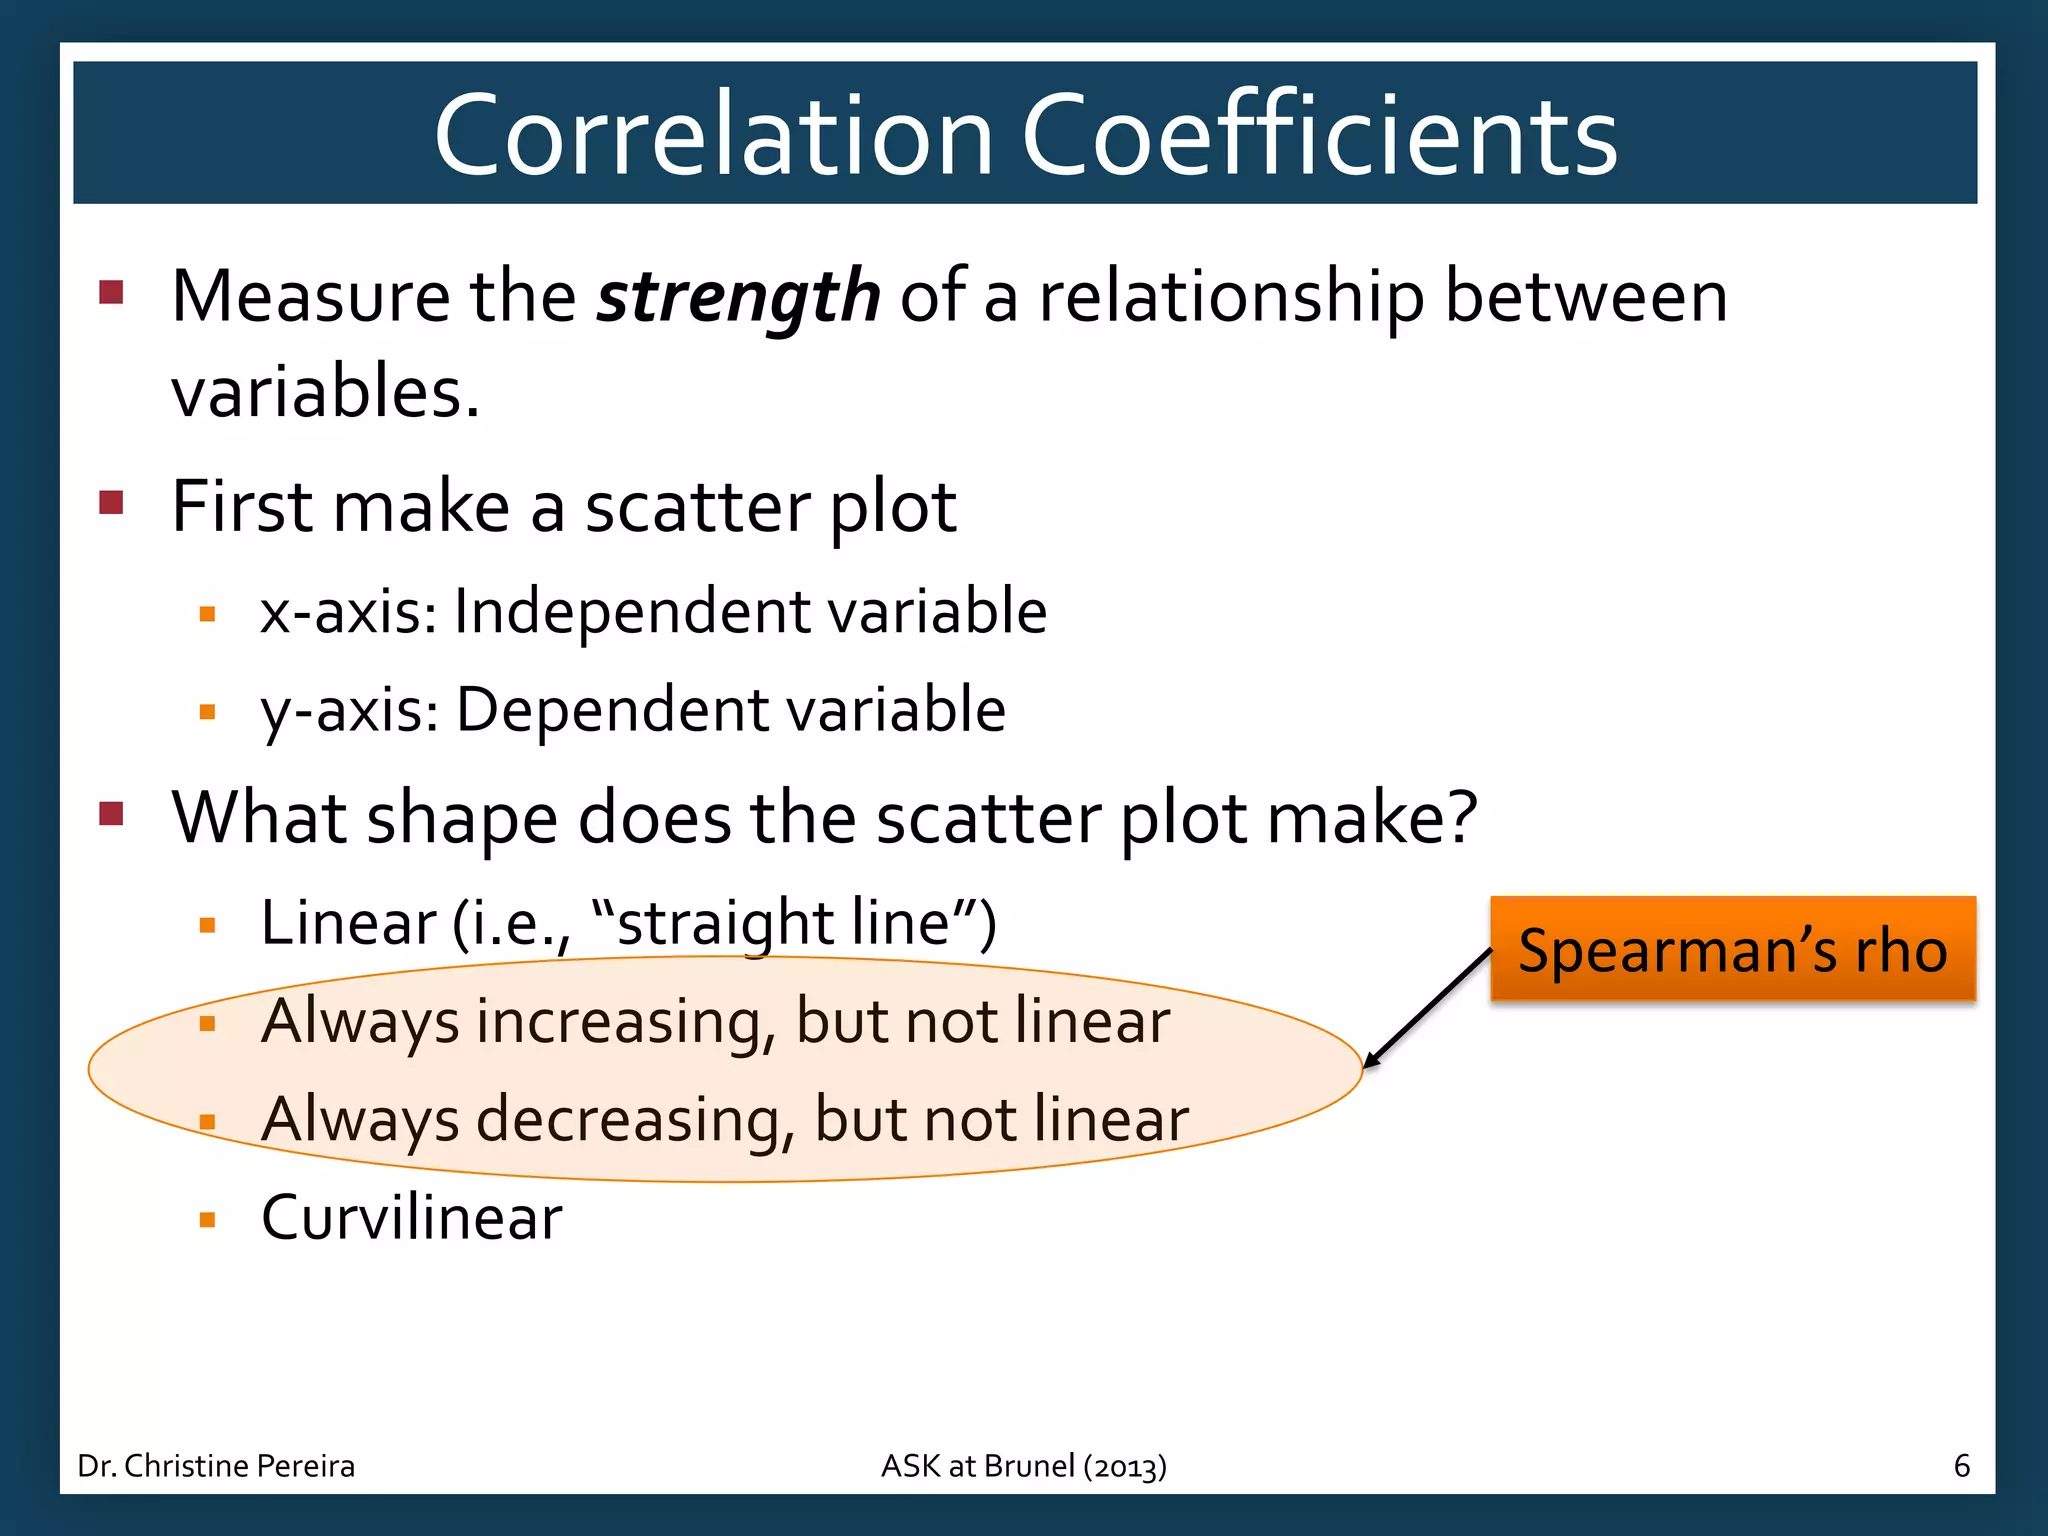
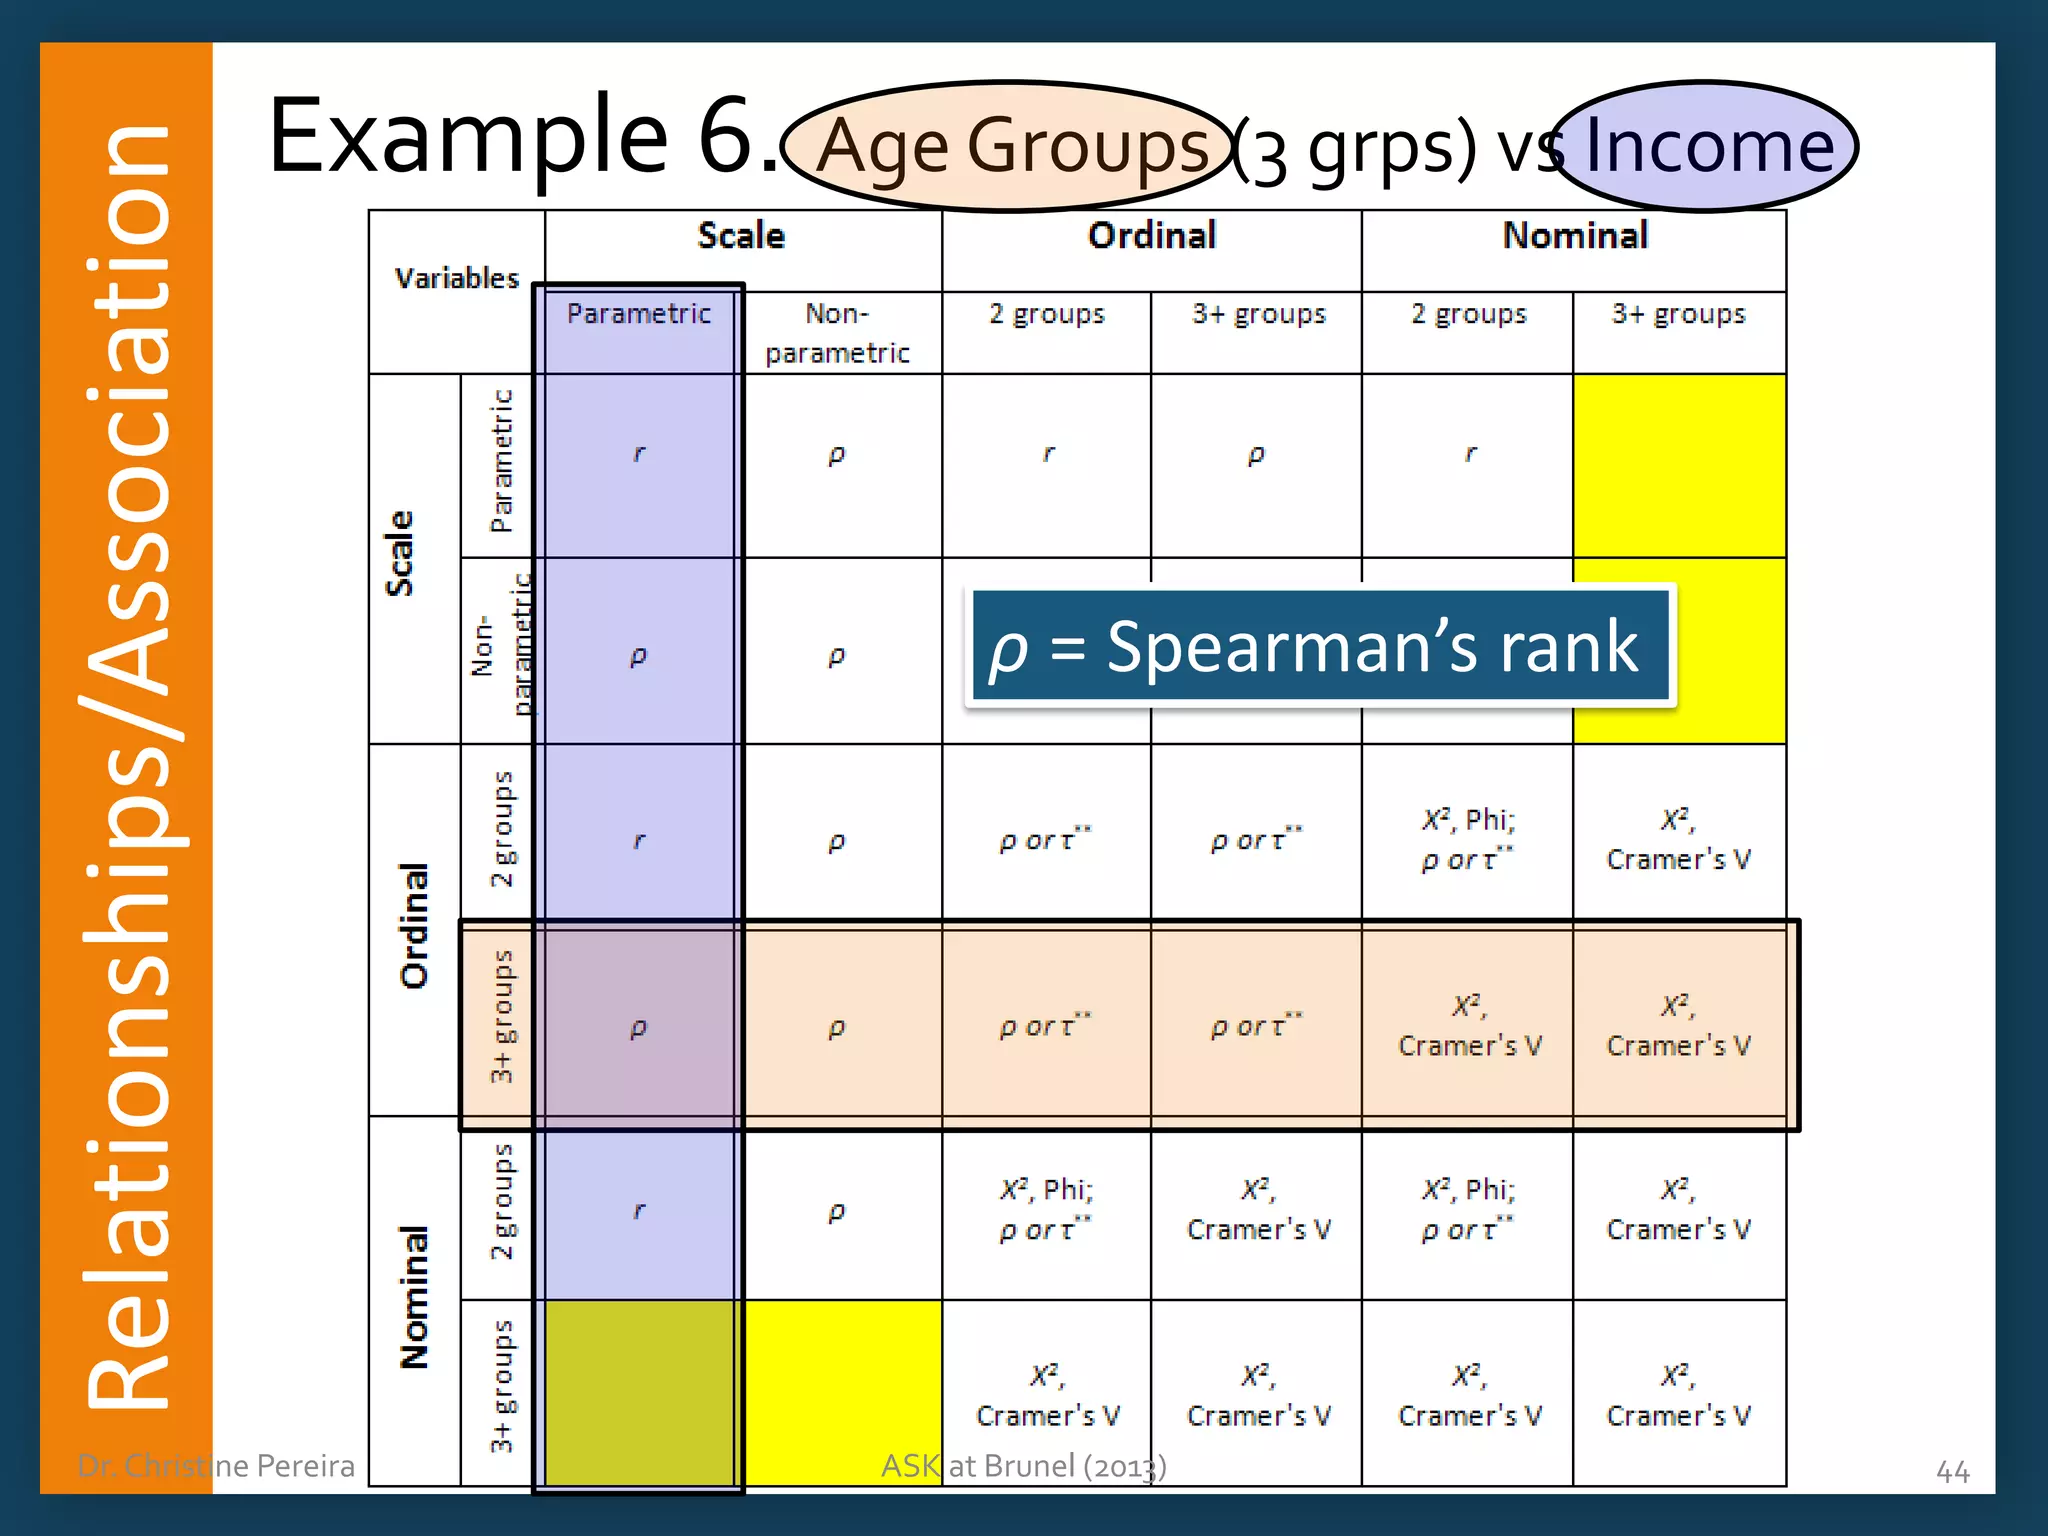
Definition and importance of correlation coefficients; scatter plot preparation; types like Pearson’s r and Spearman’s rho.
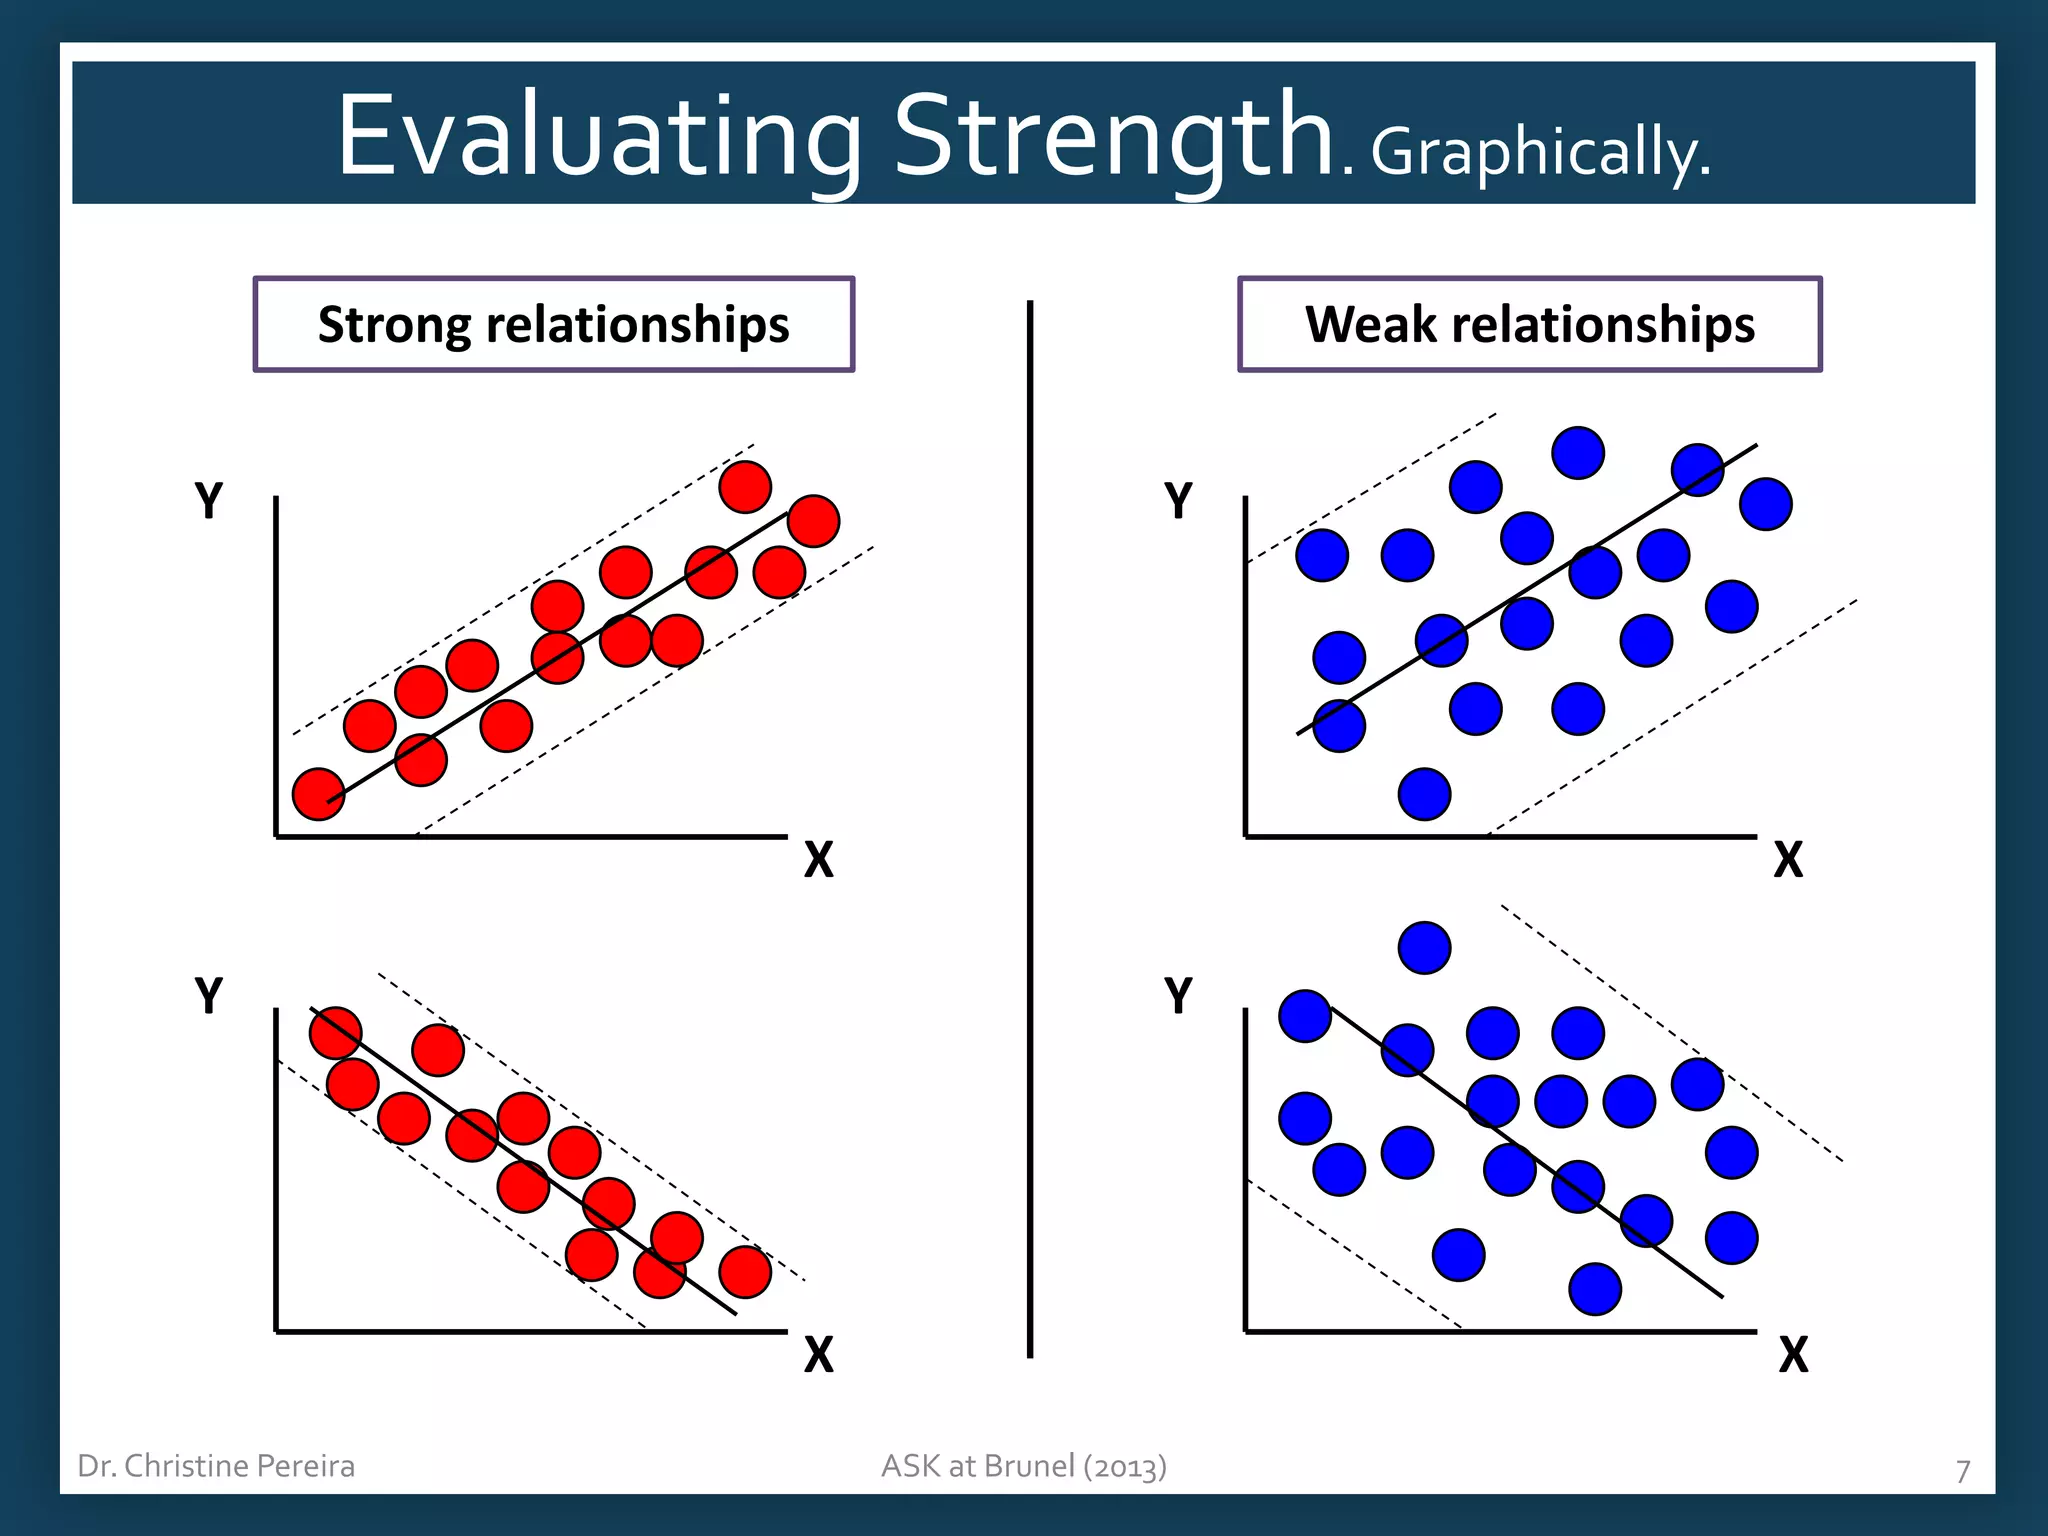
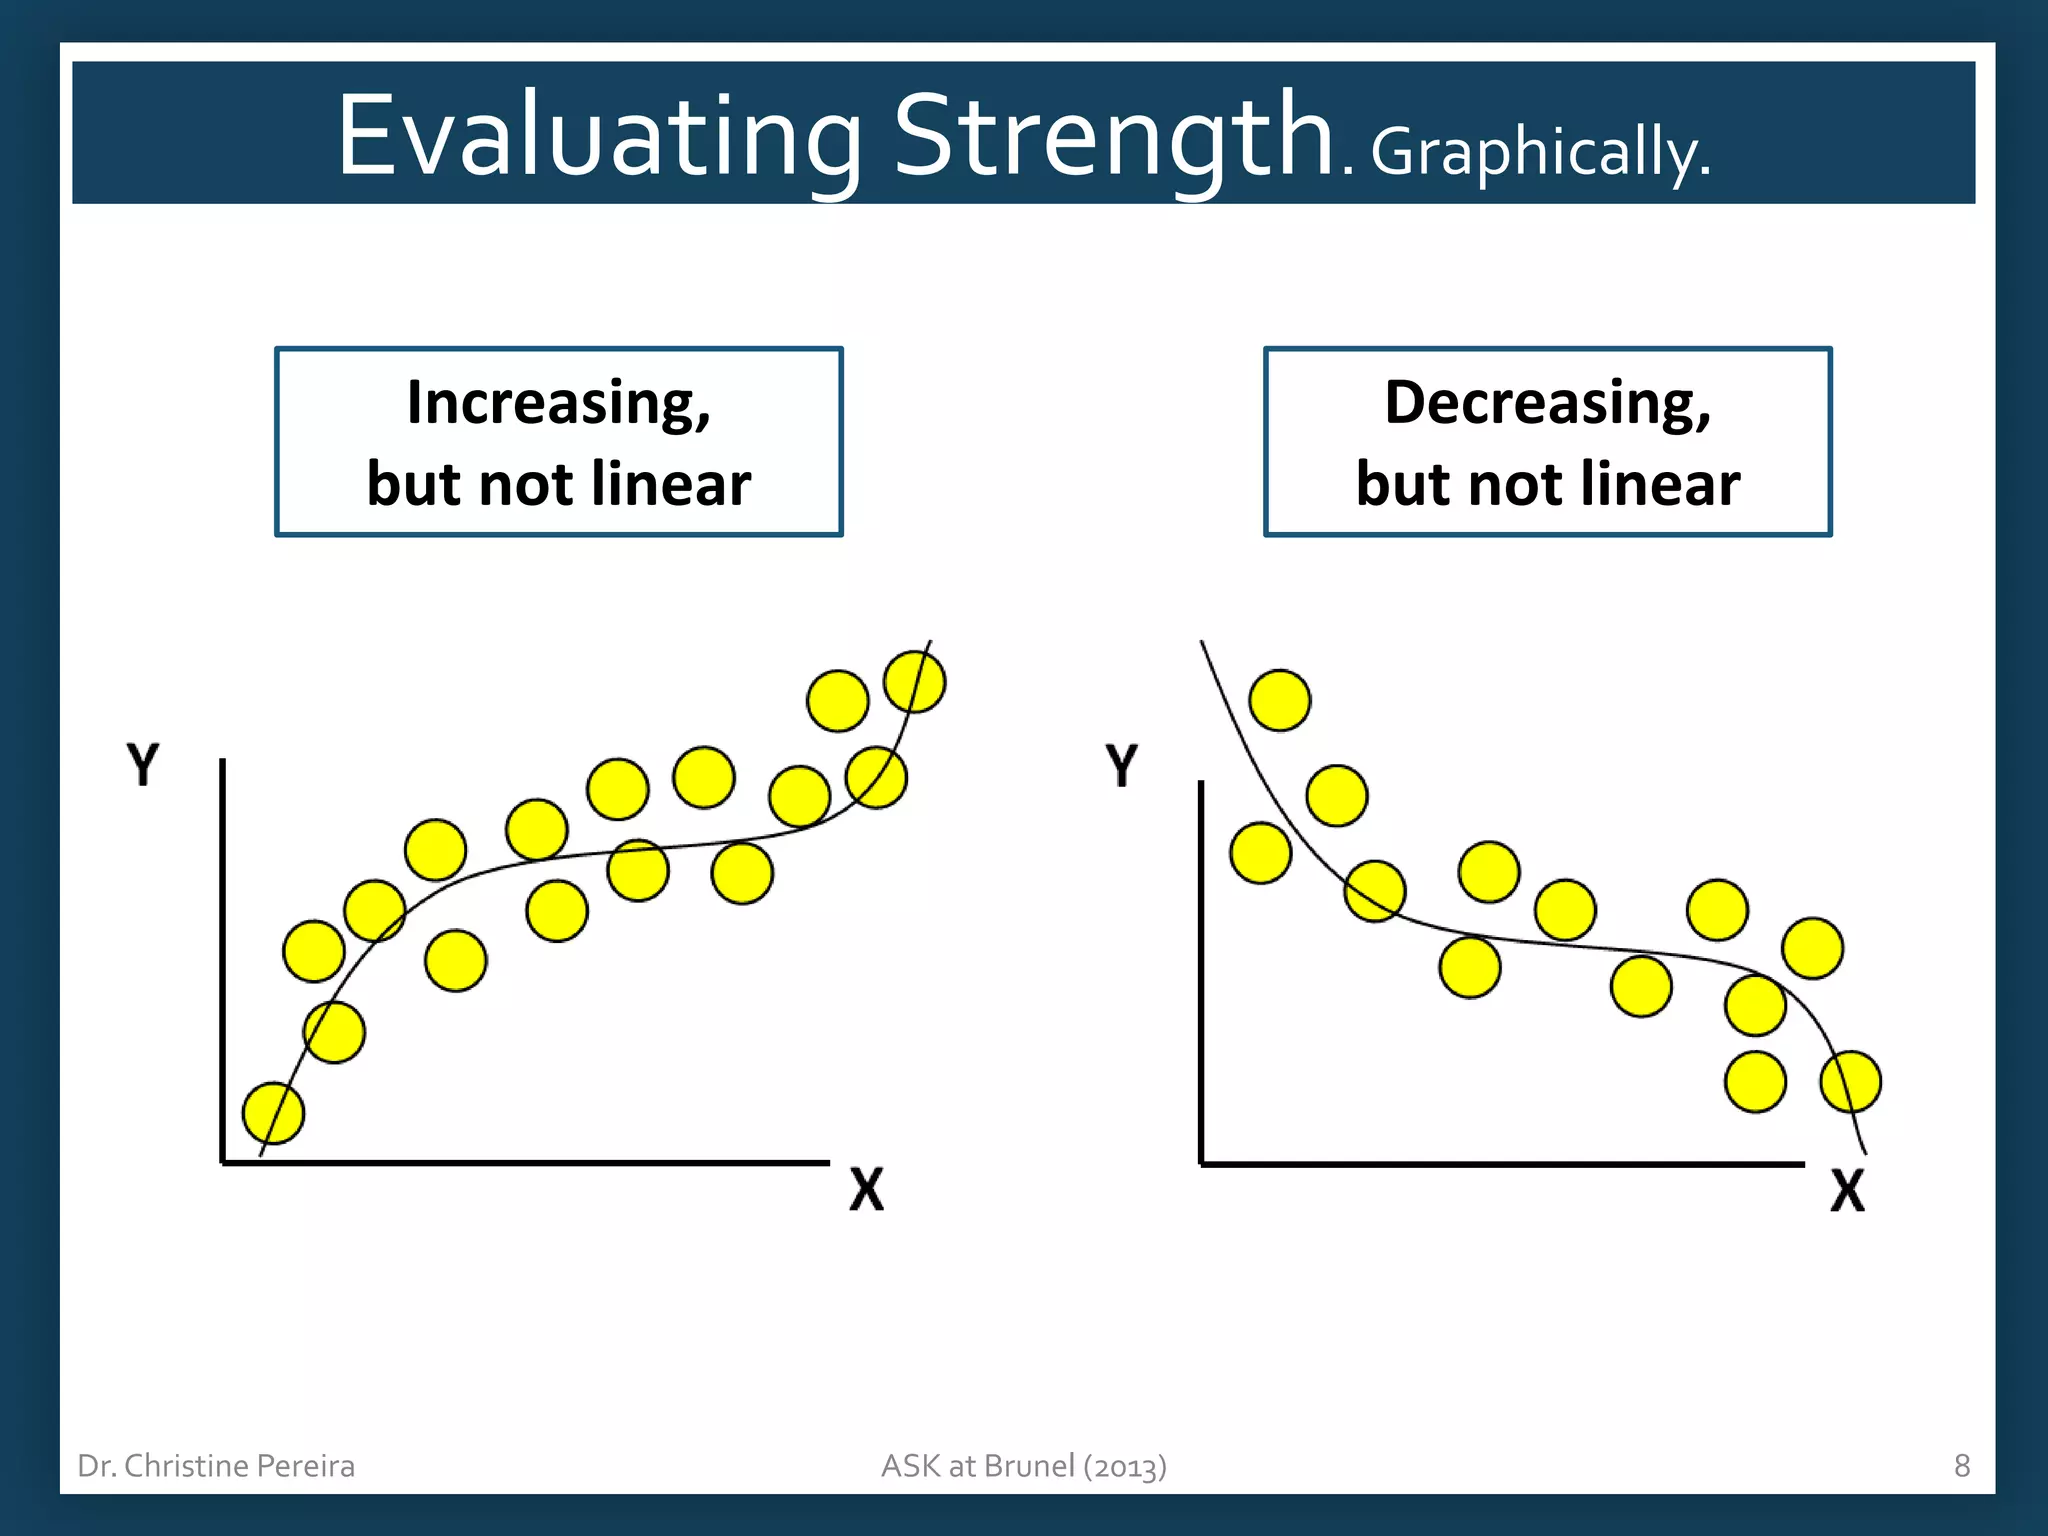
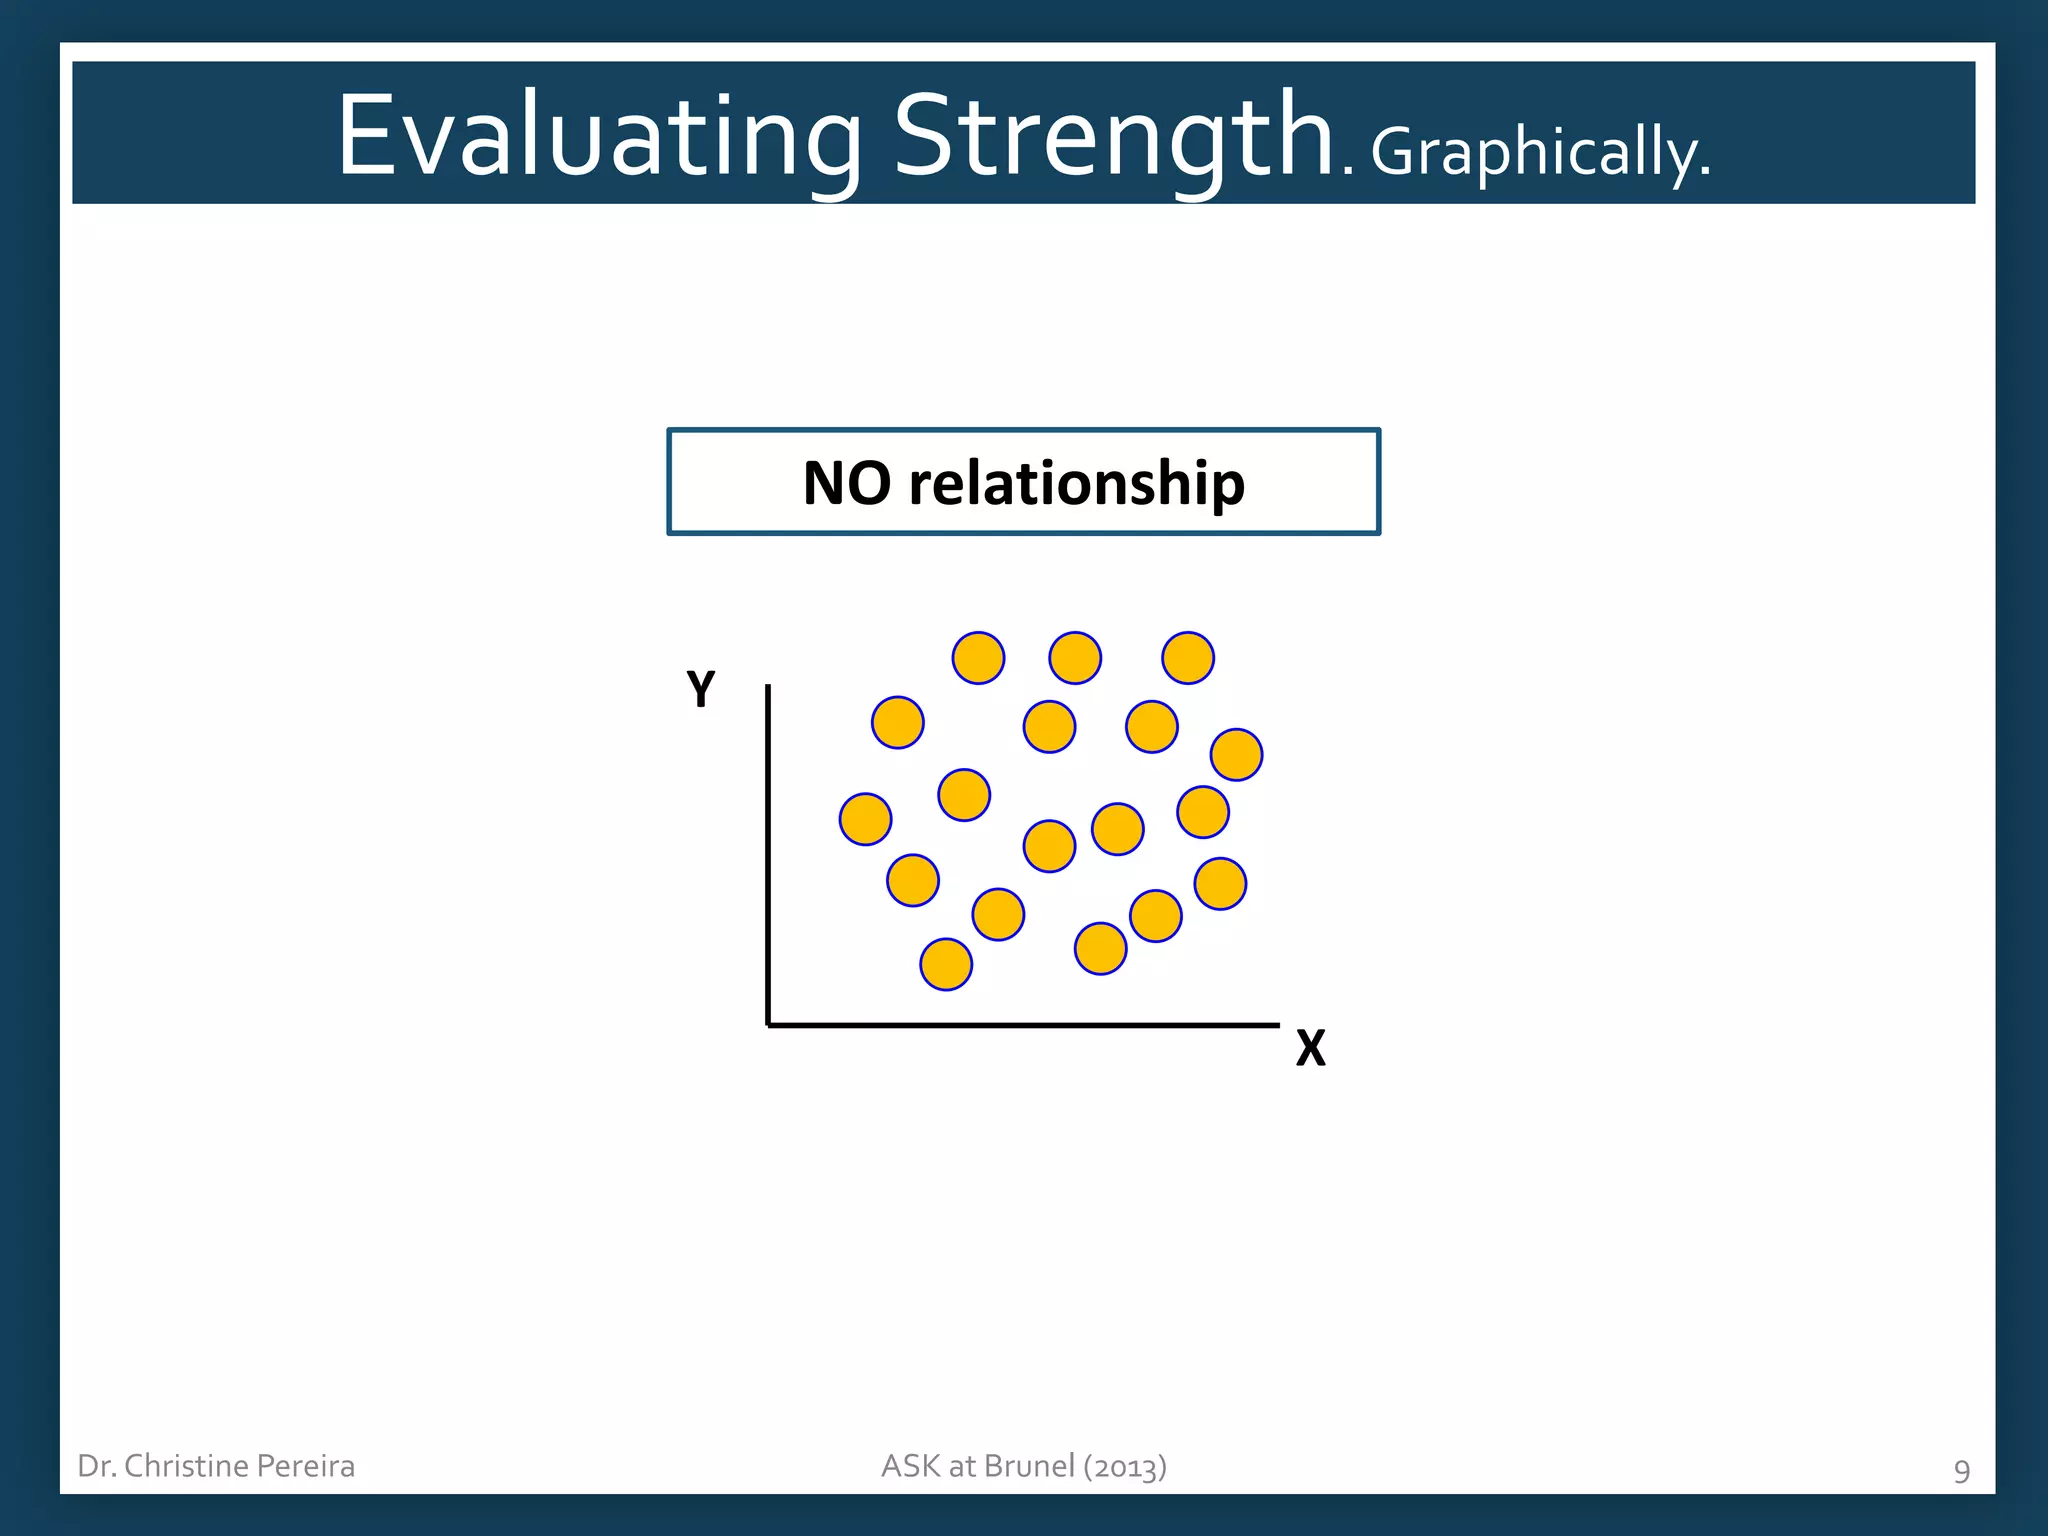
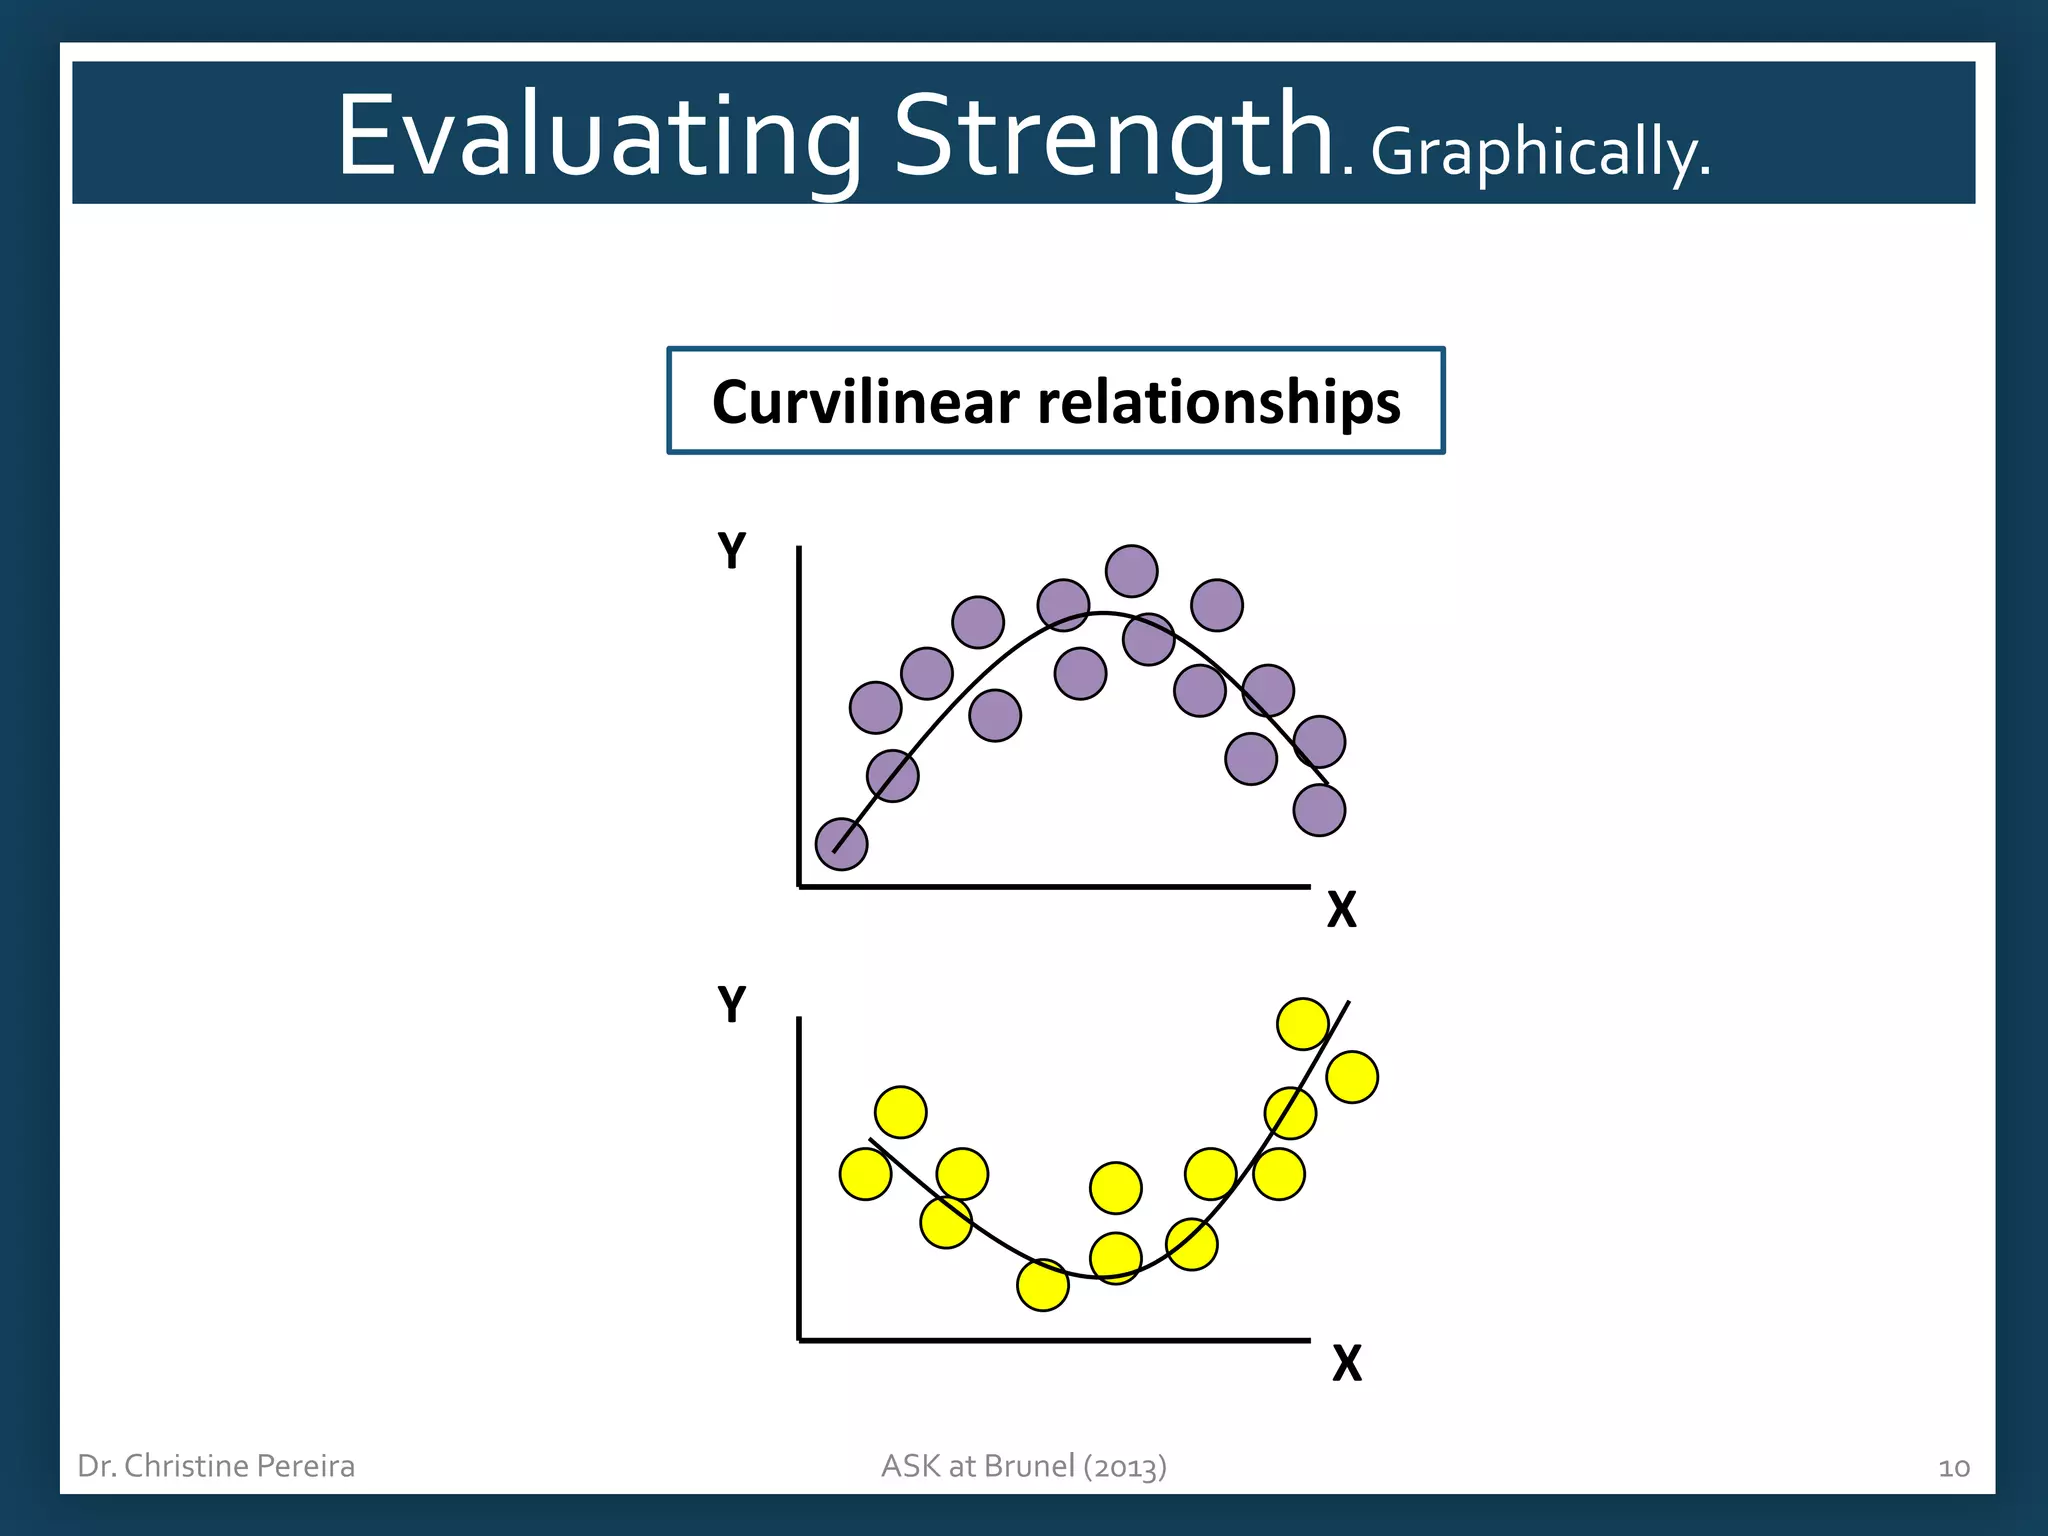
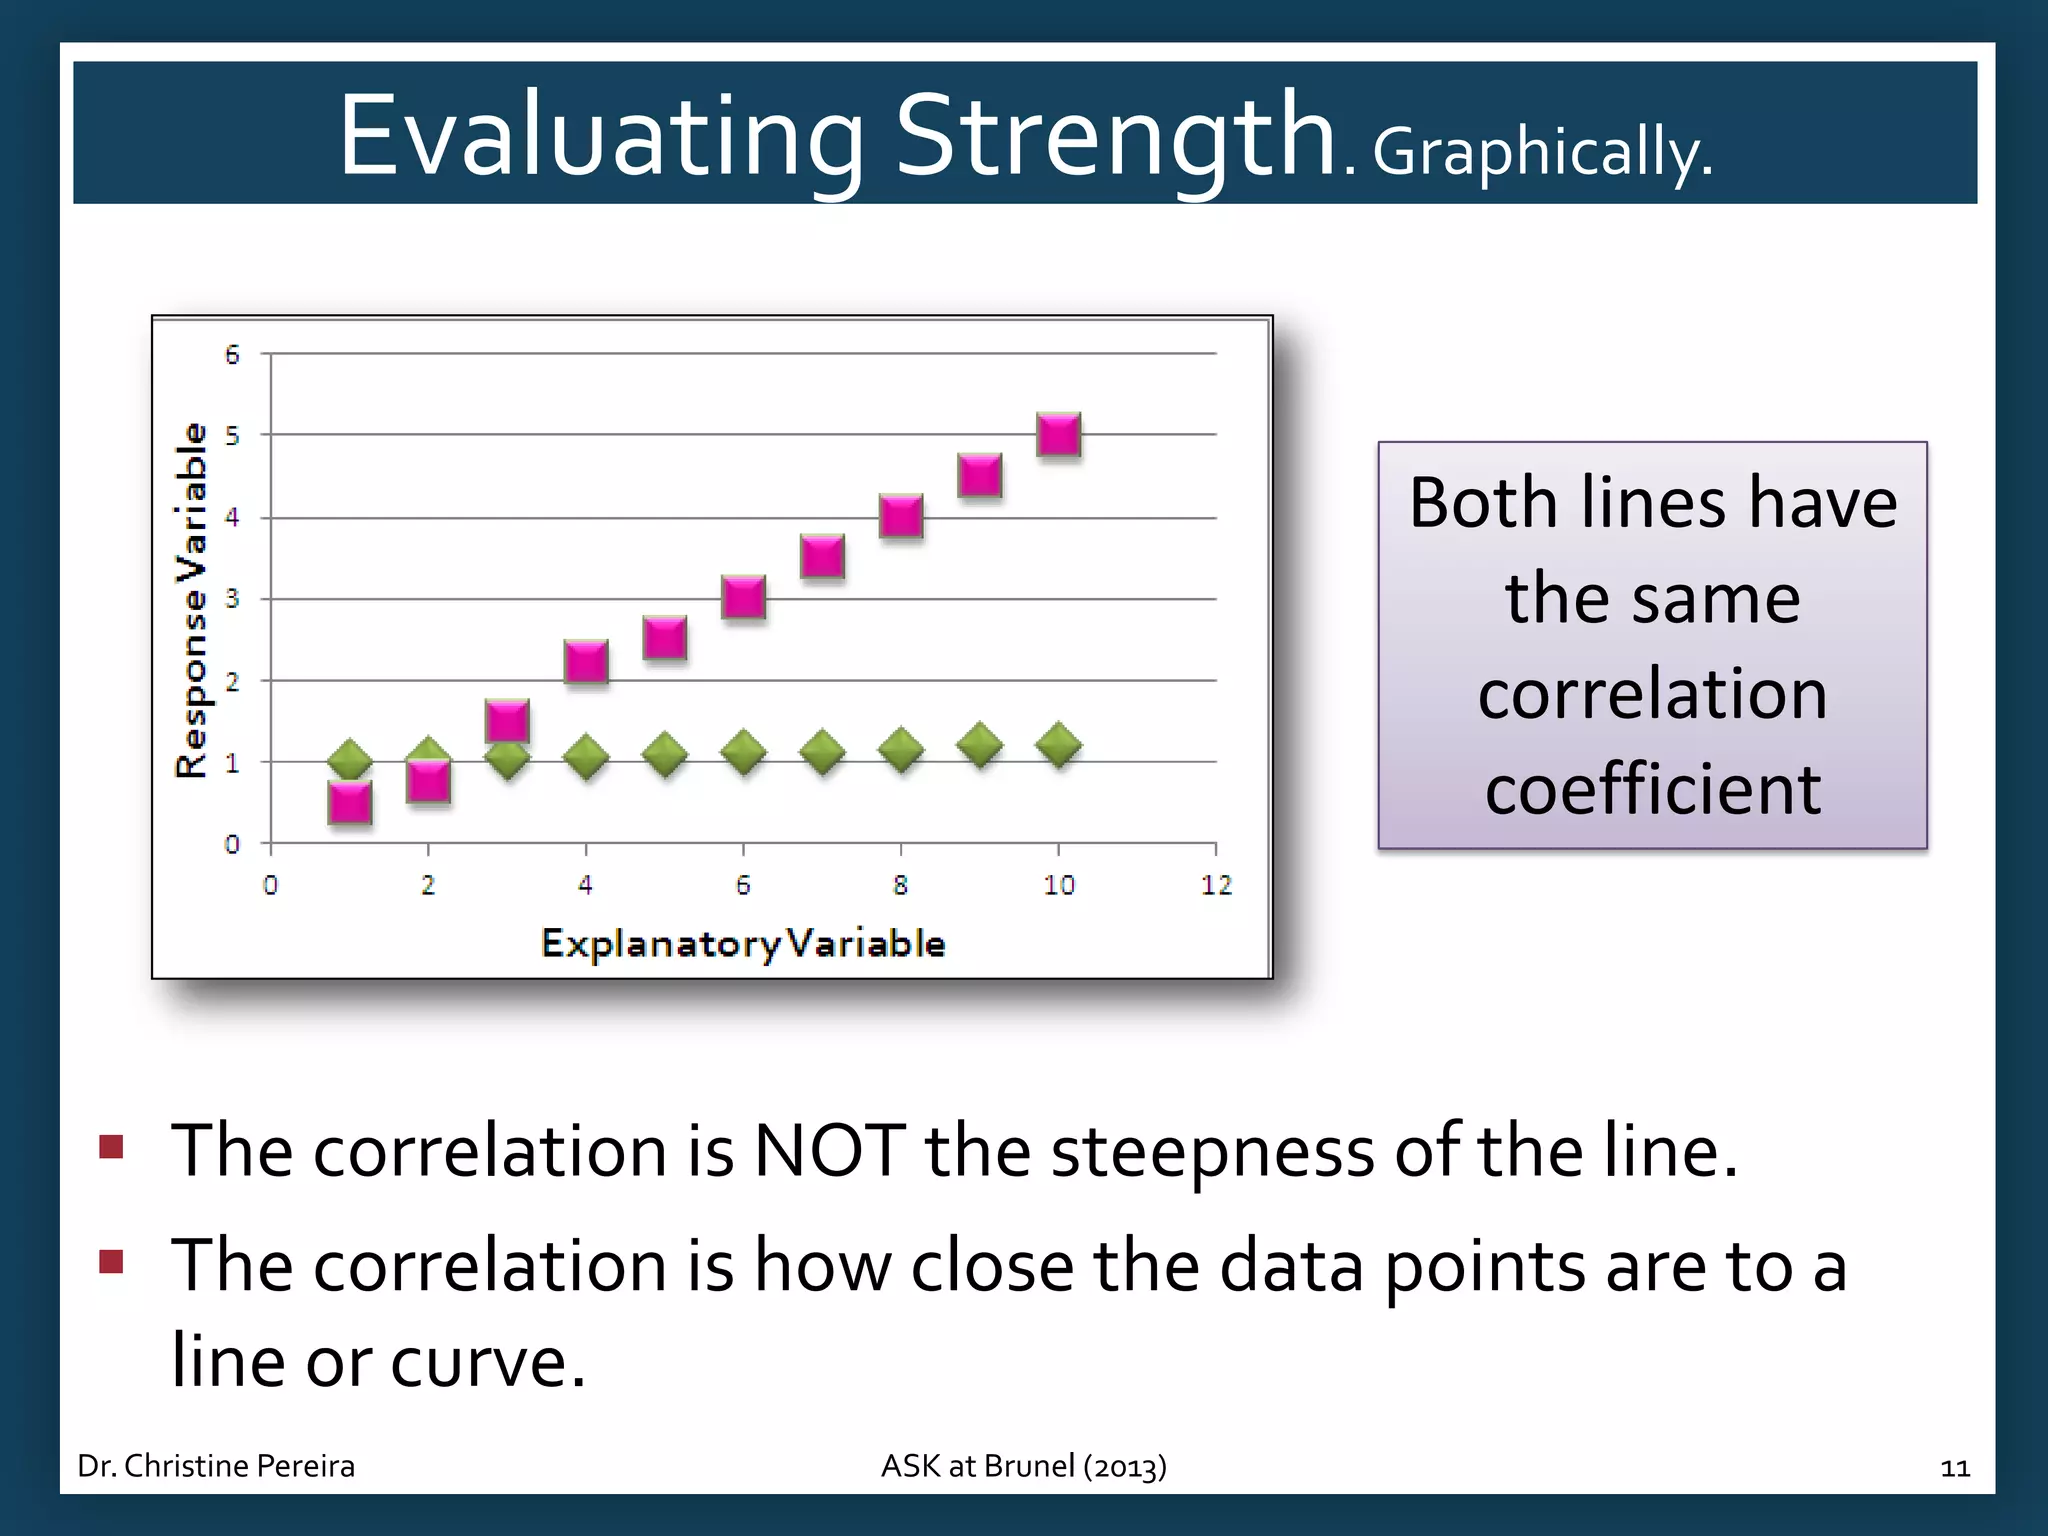
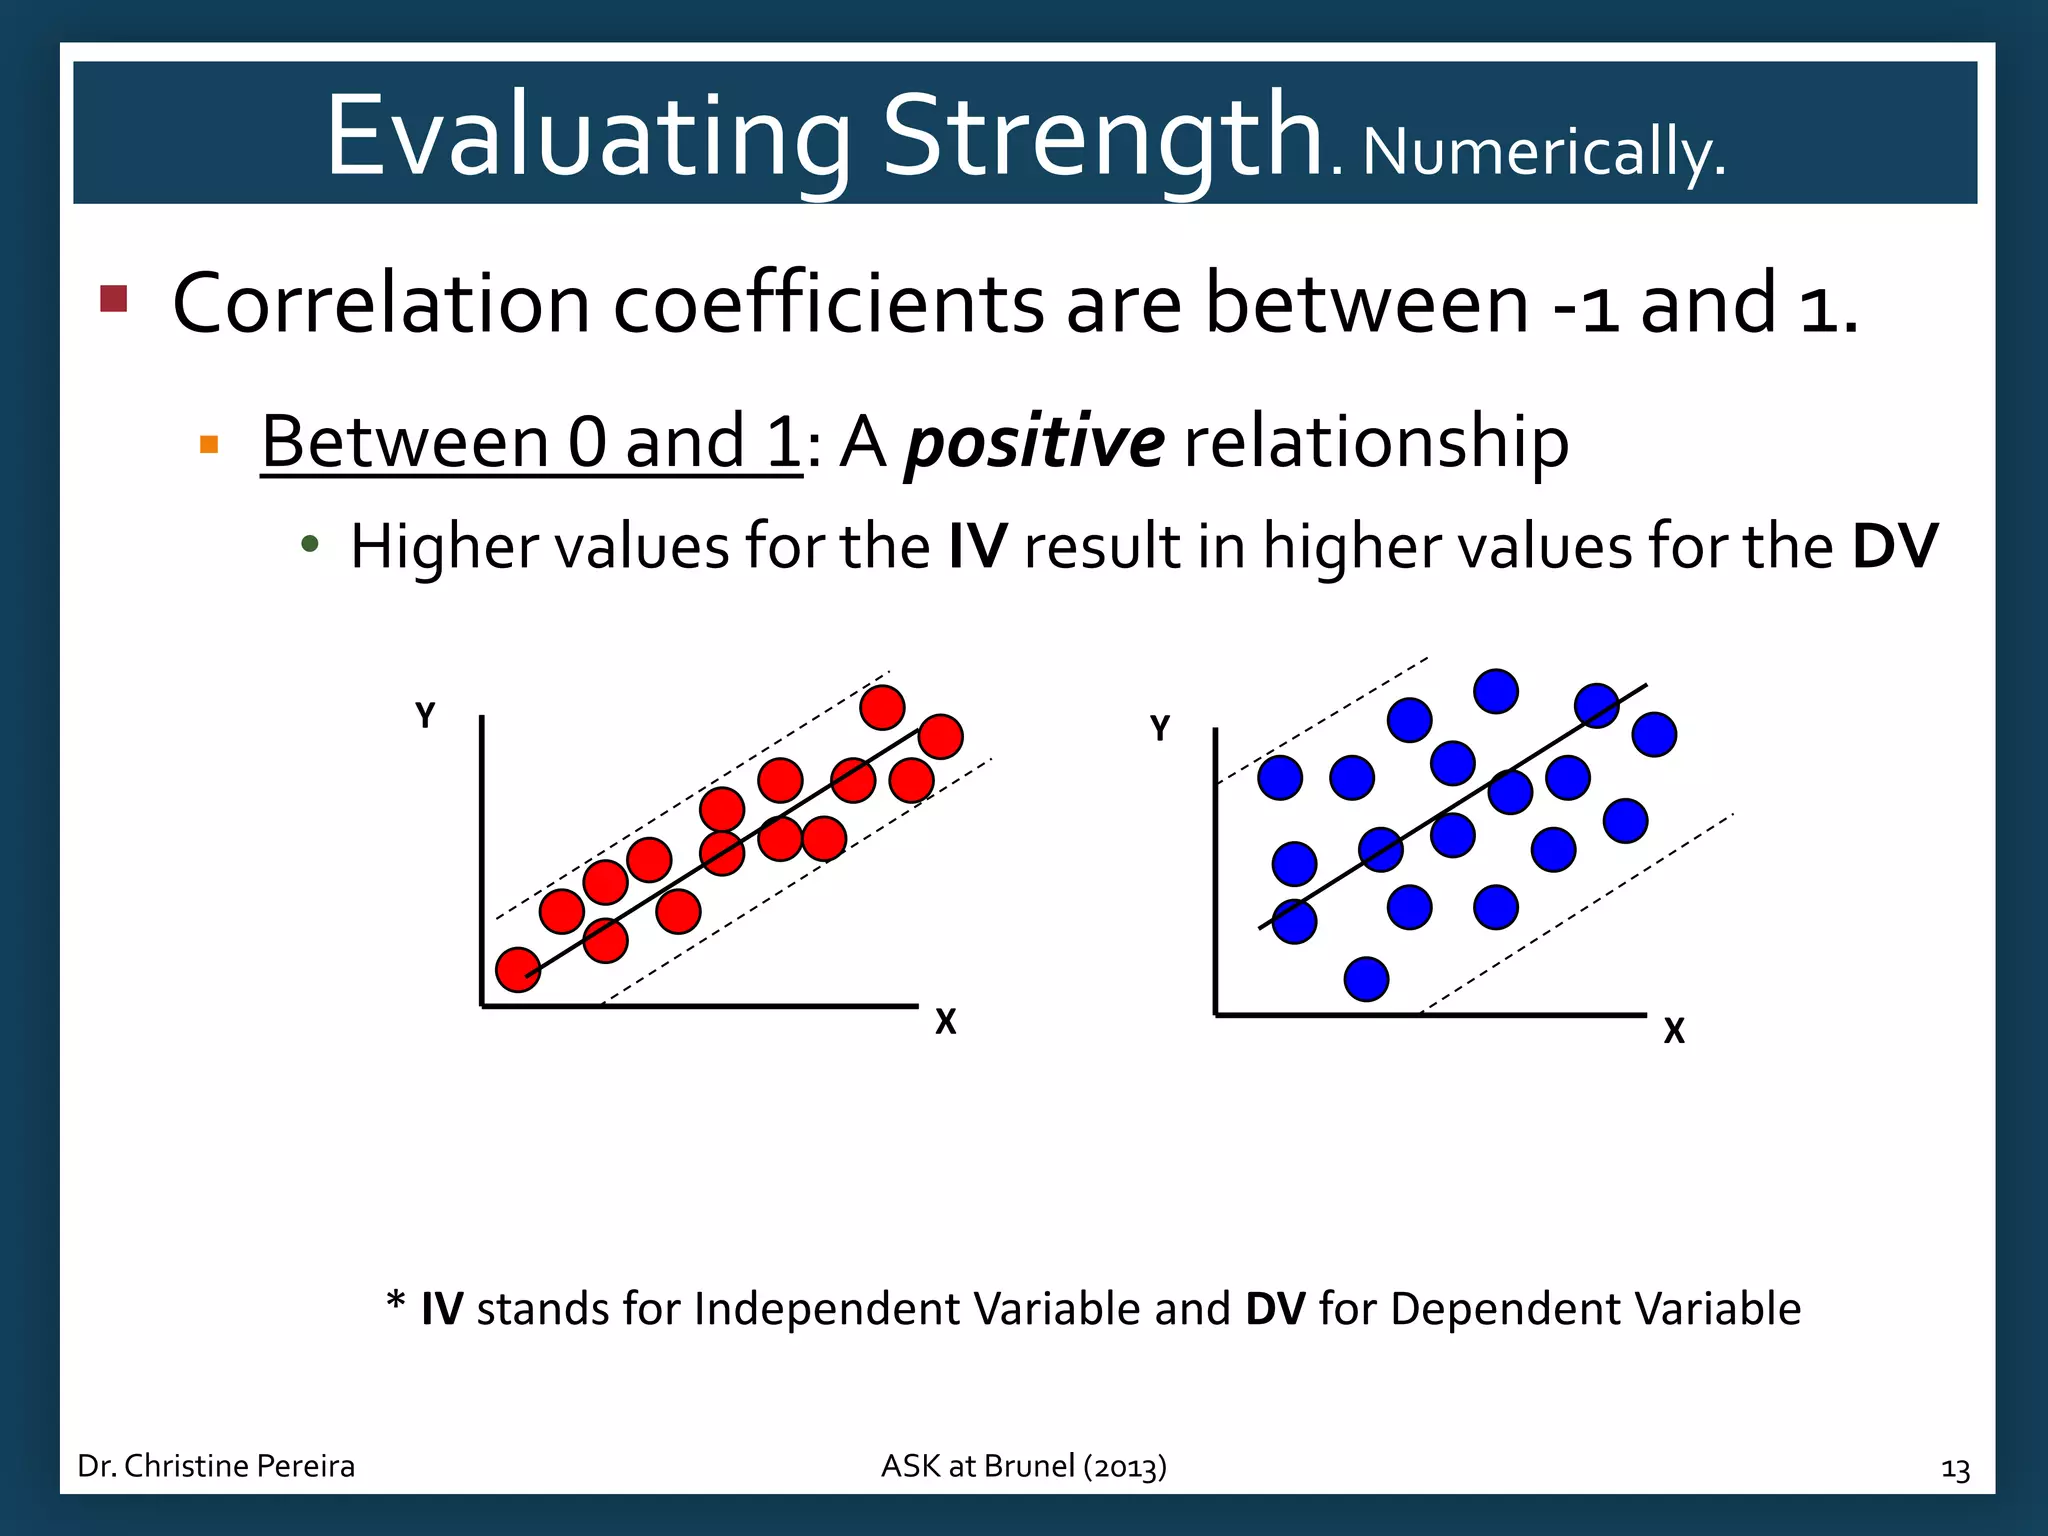
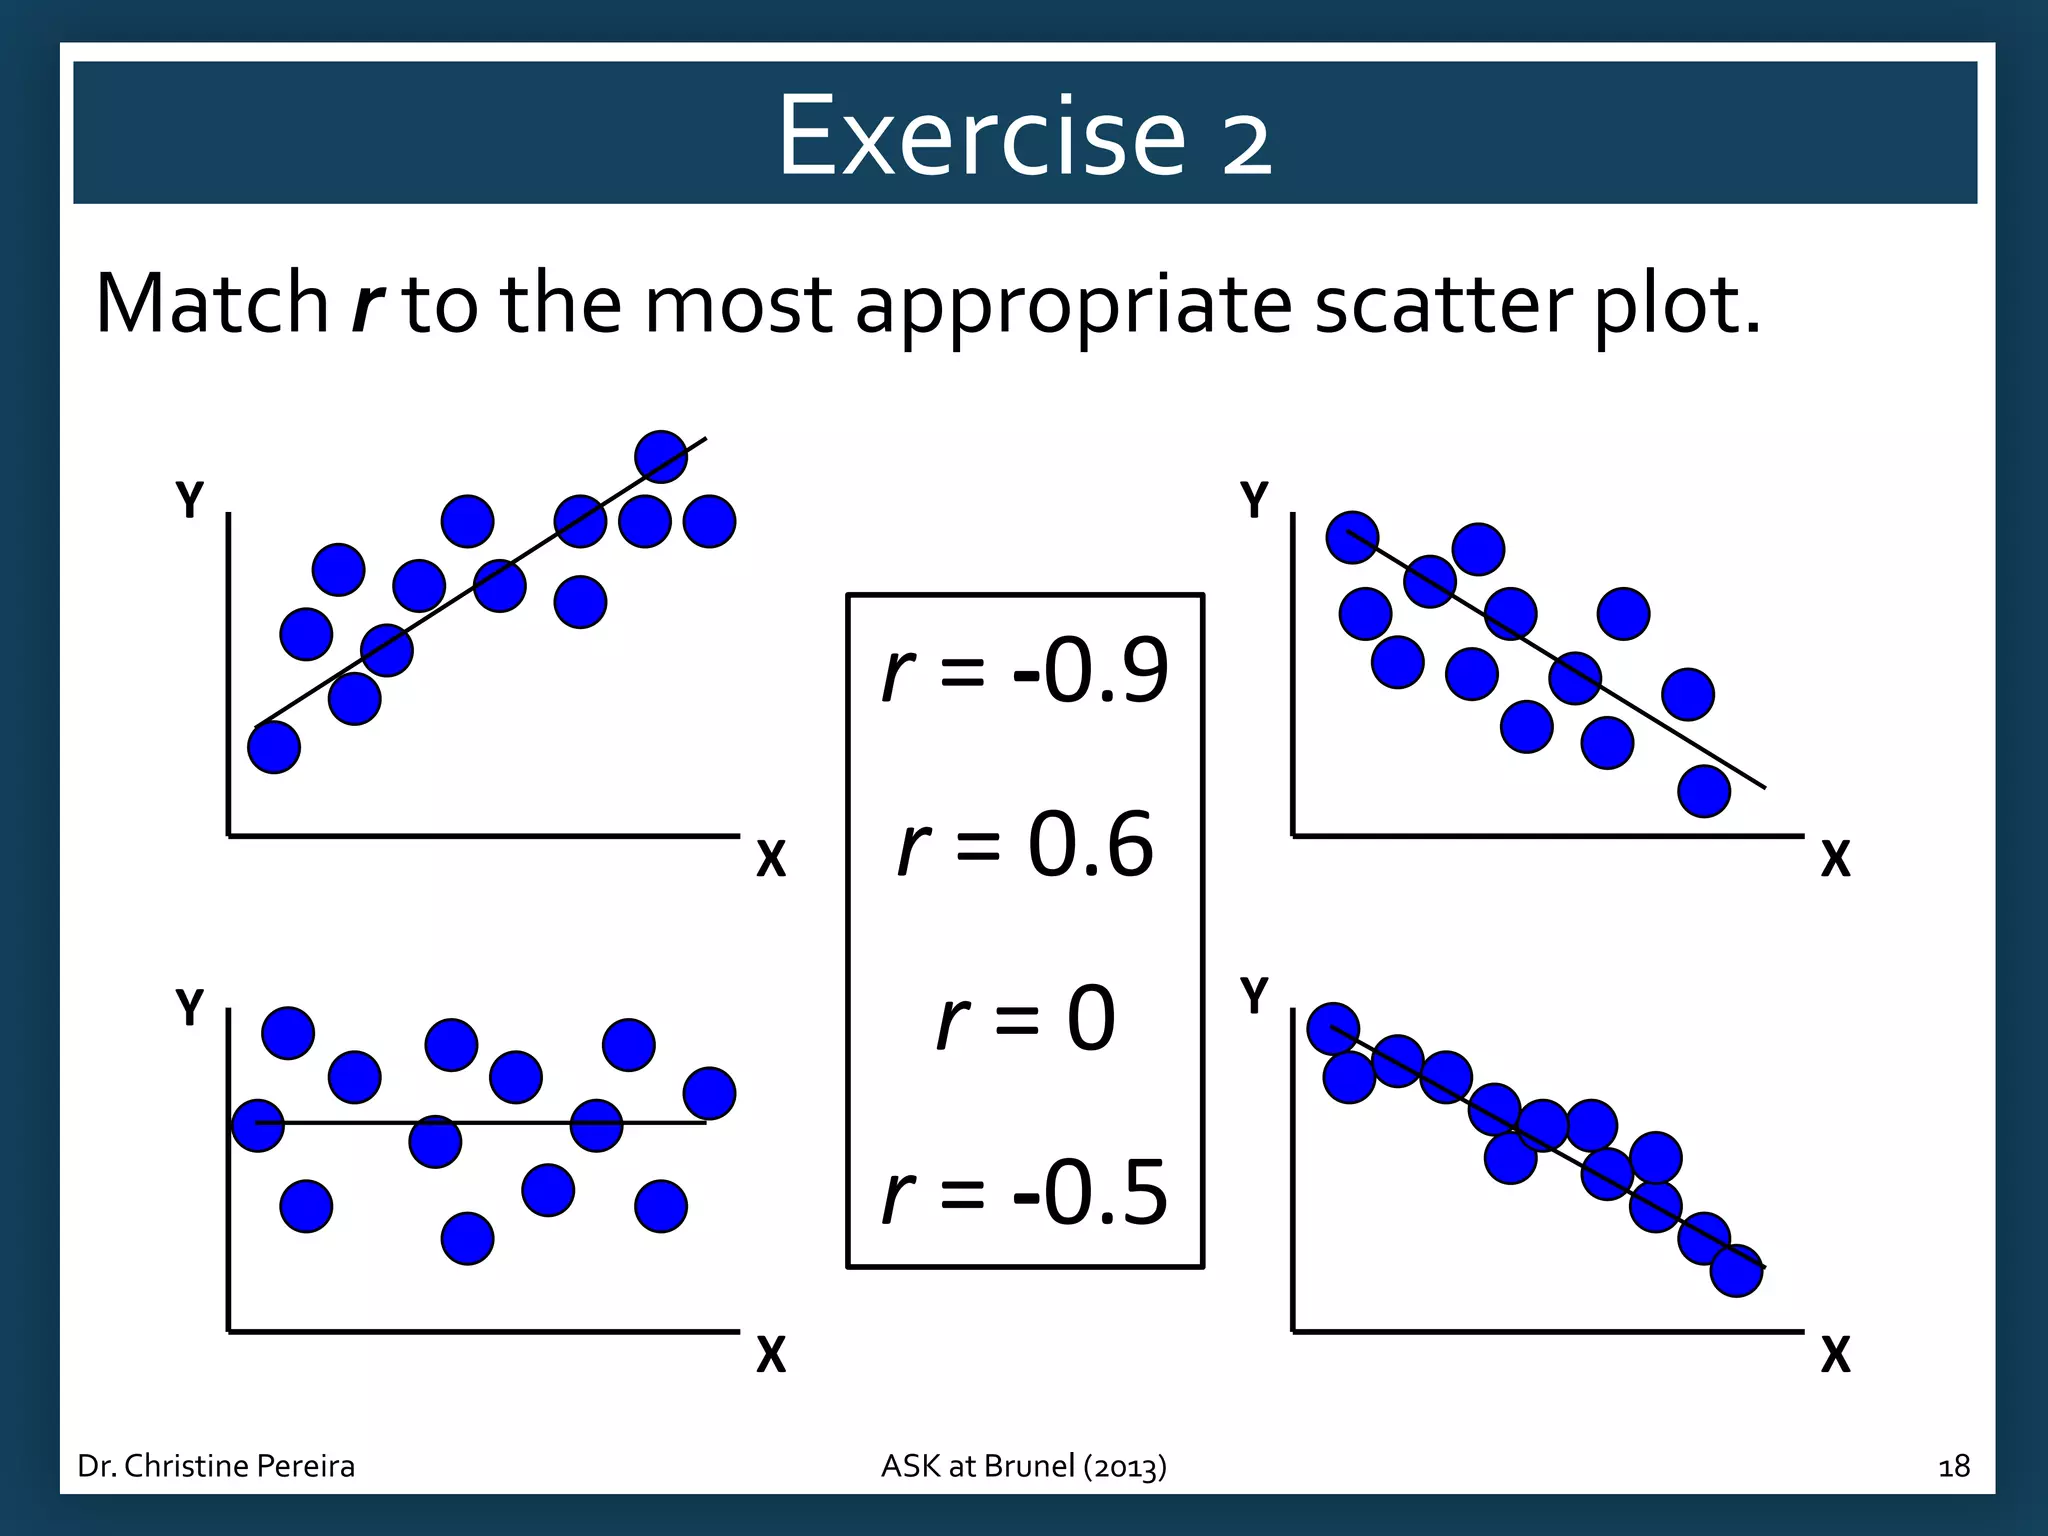
How to visually interpret strength of relationships through scatter plots; identifying strong, weak, and curvilinear relationships.
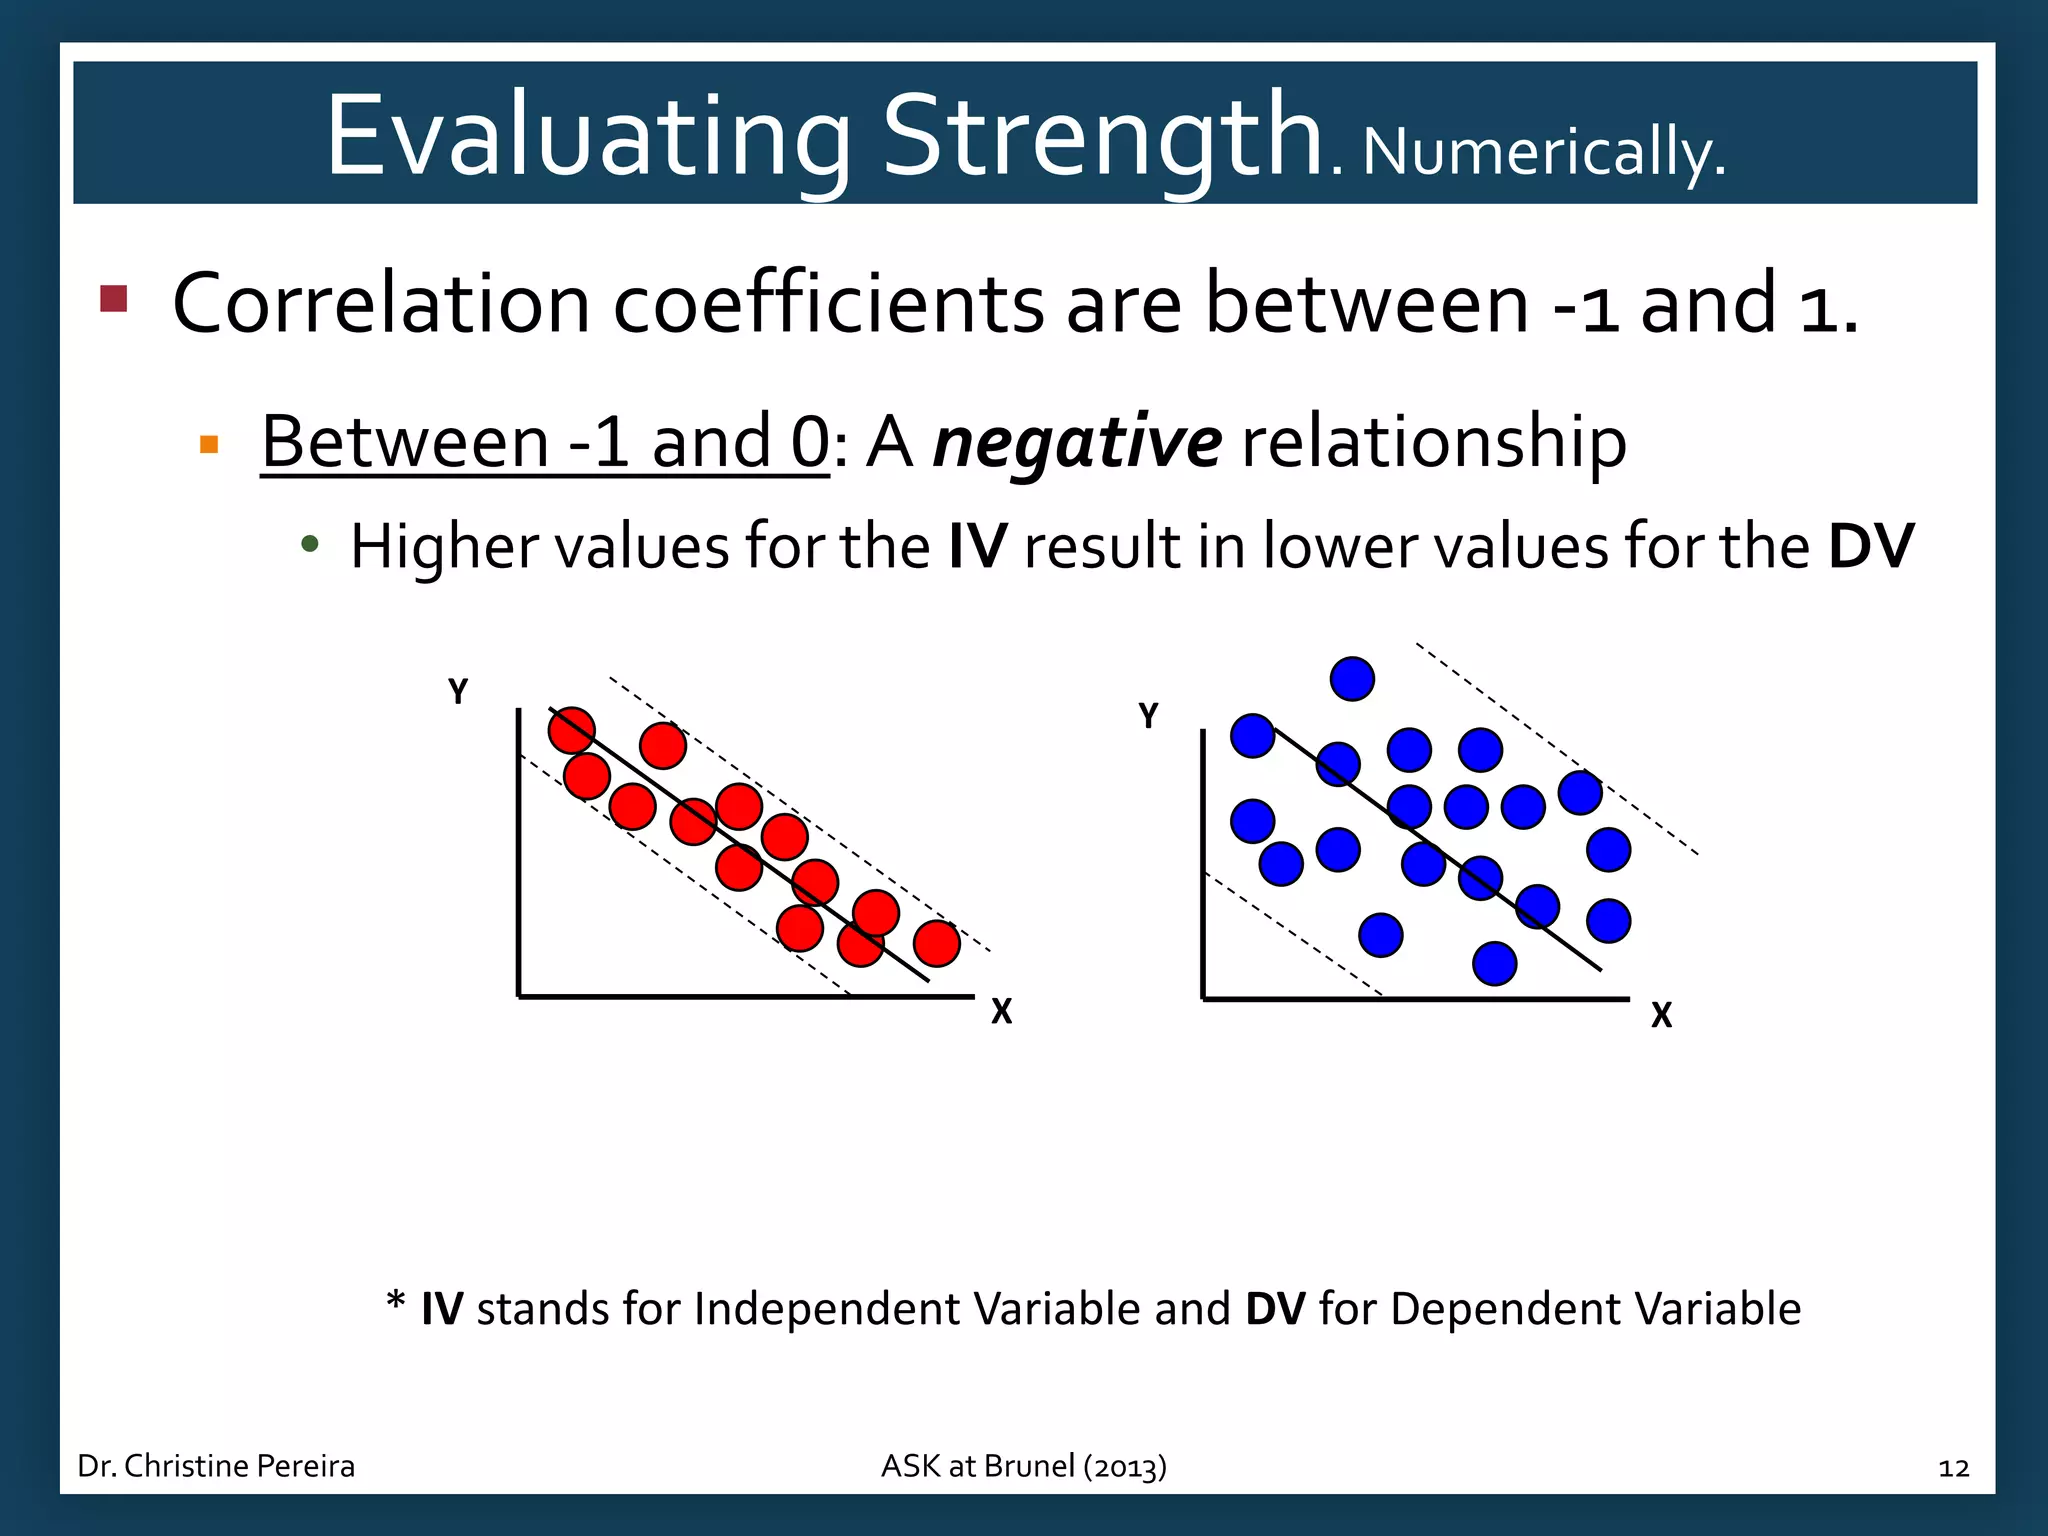
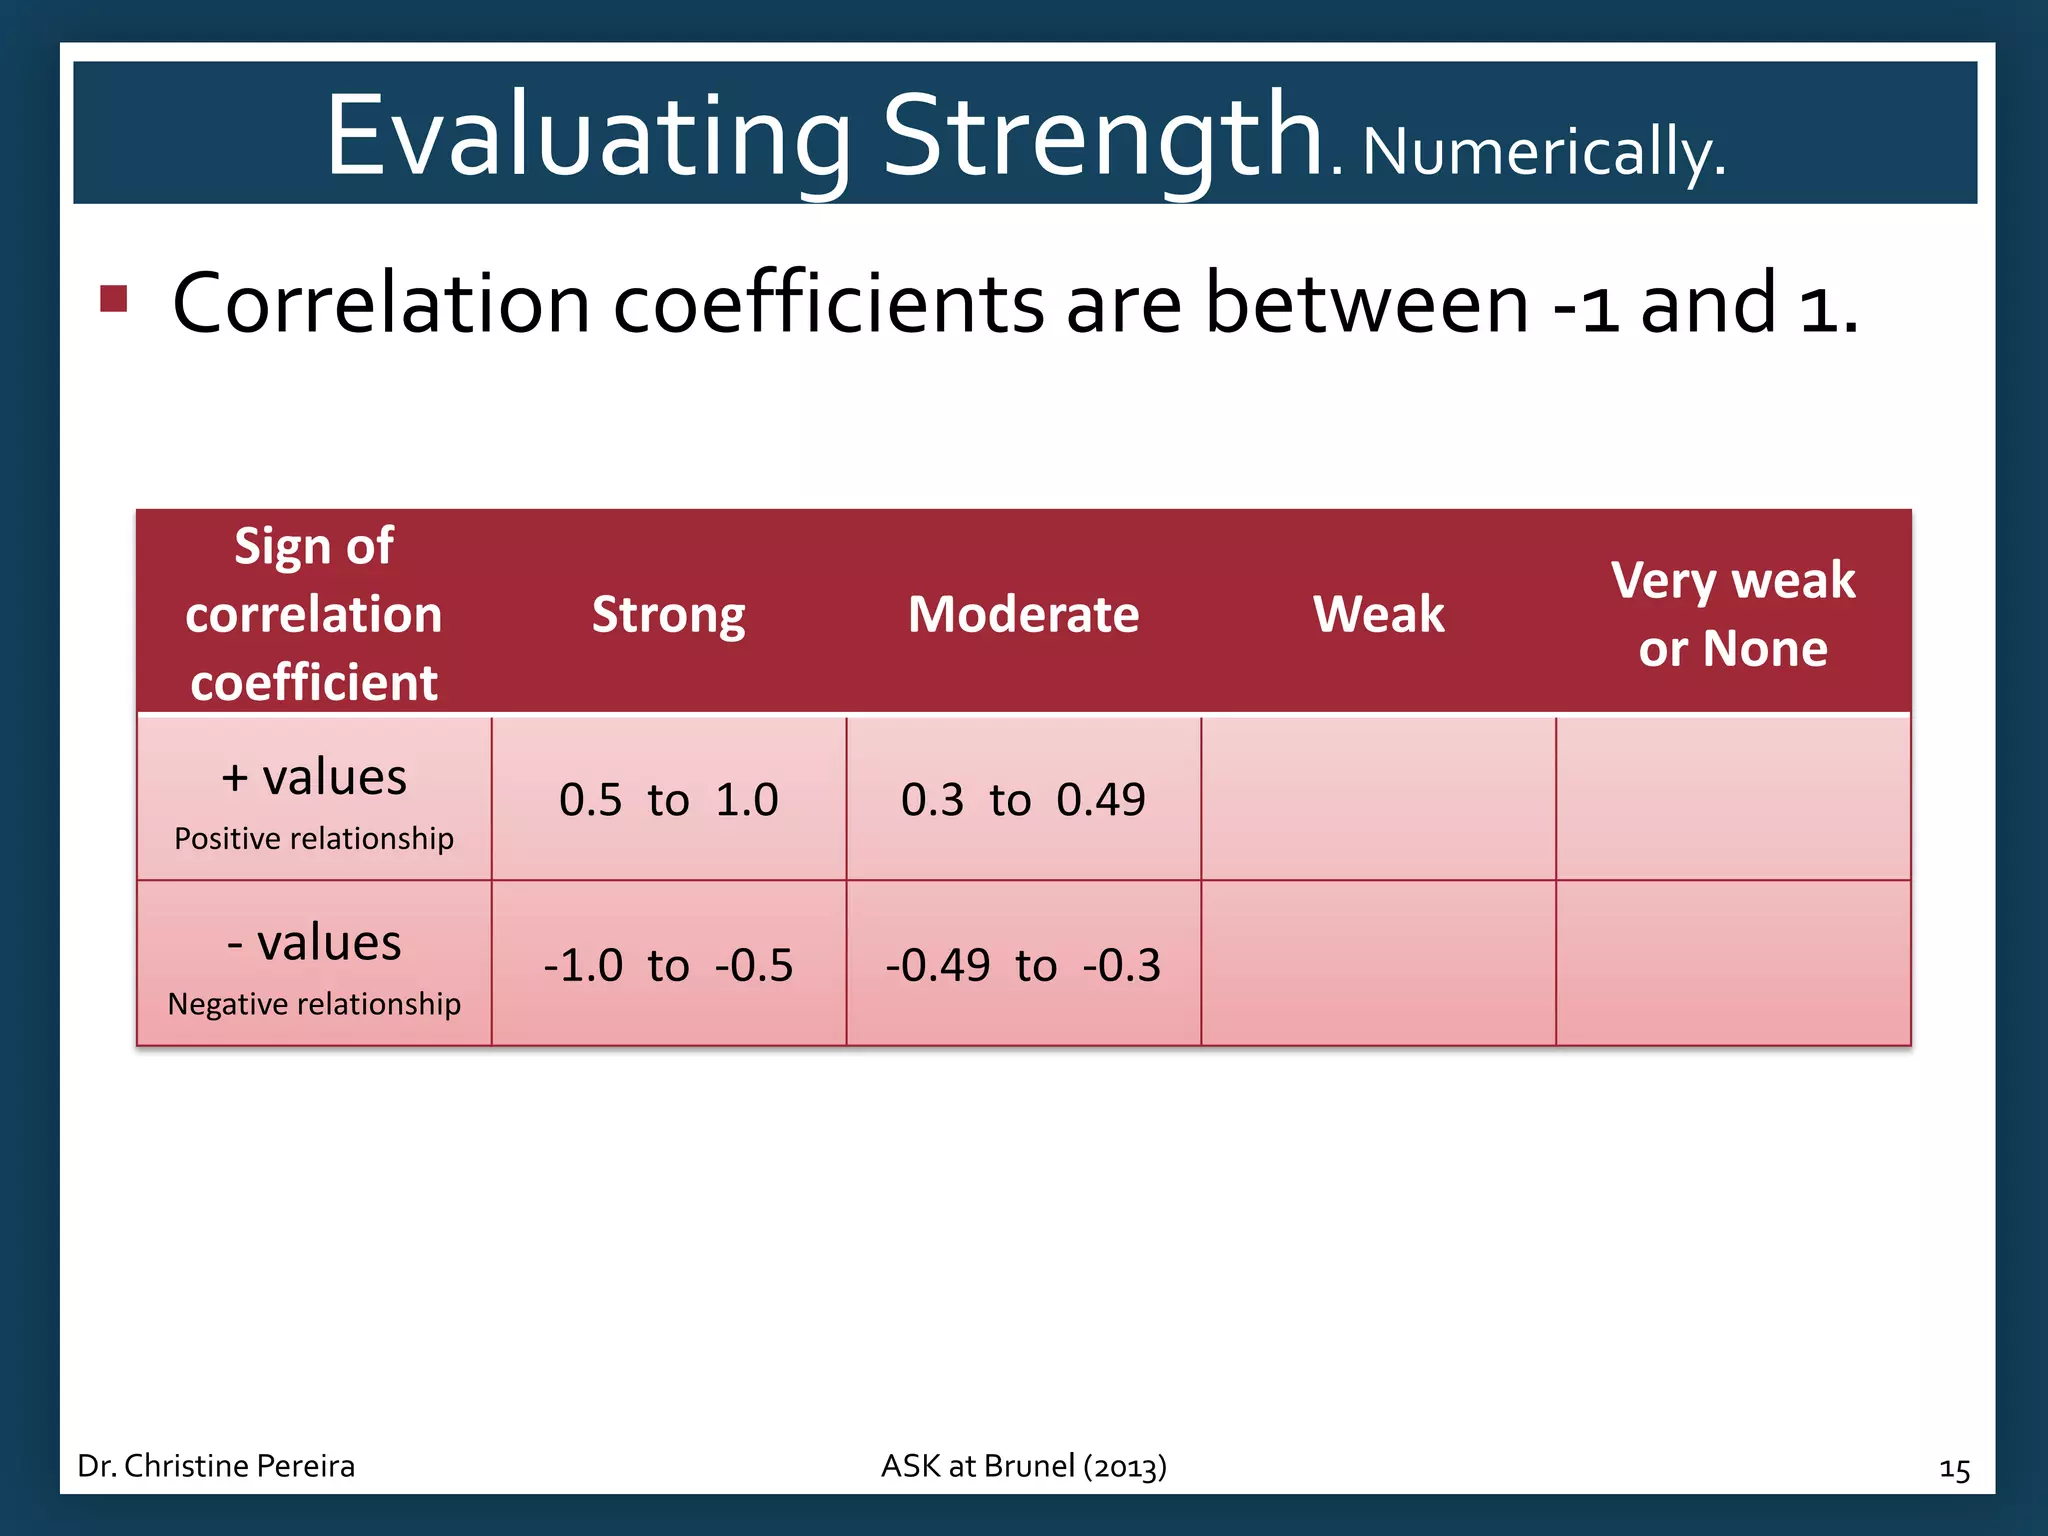
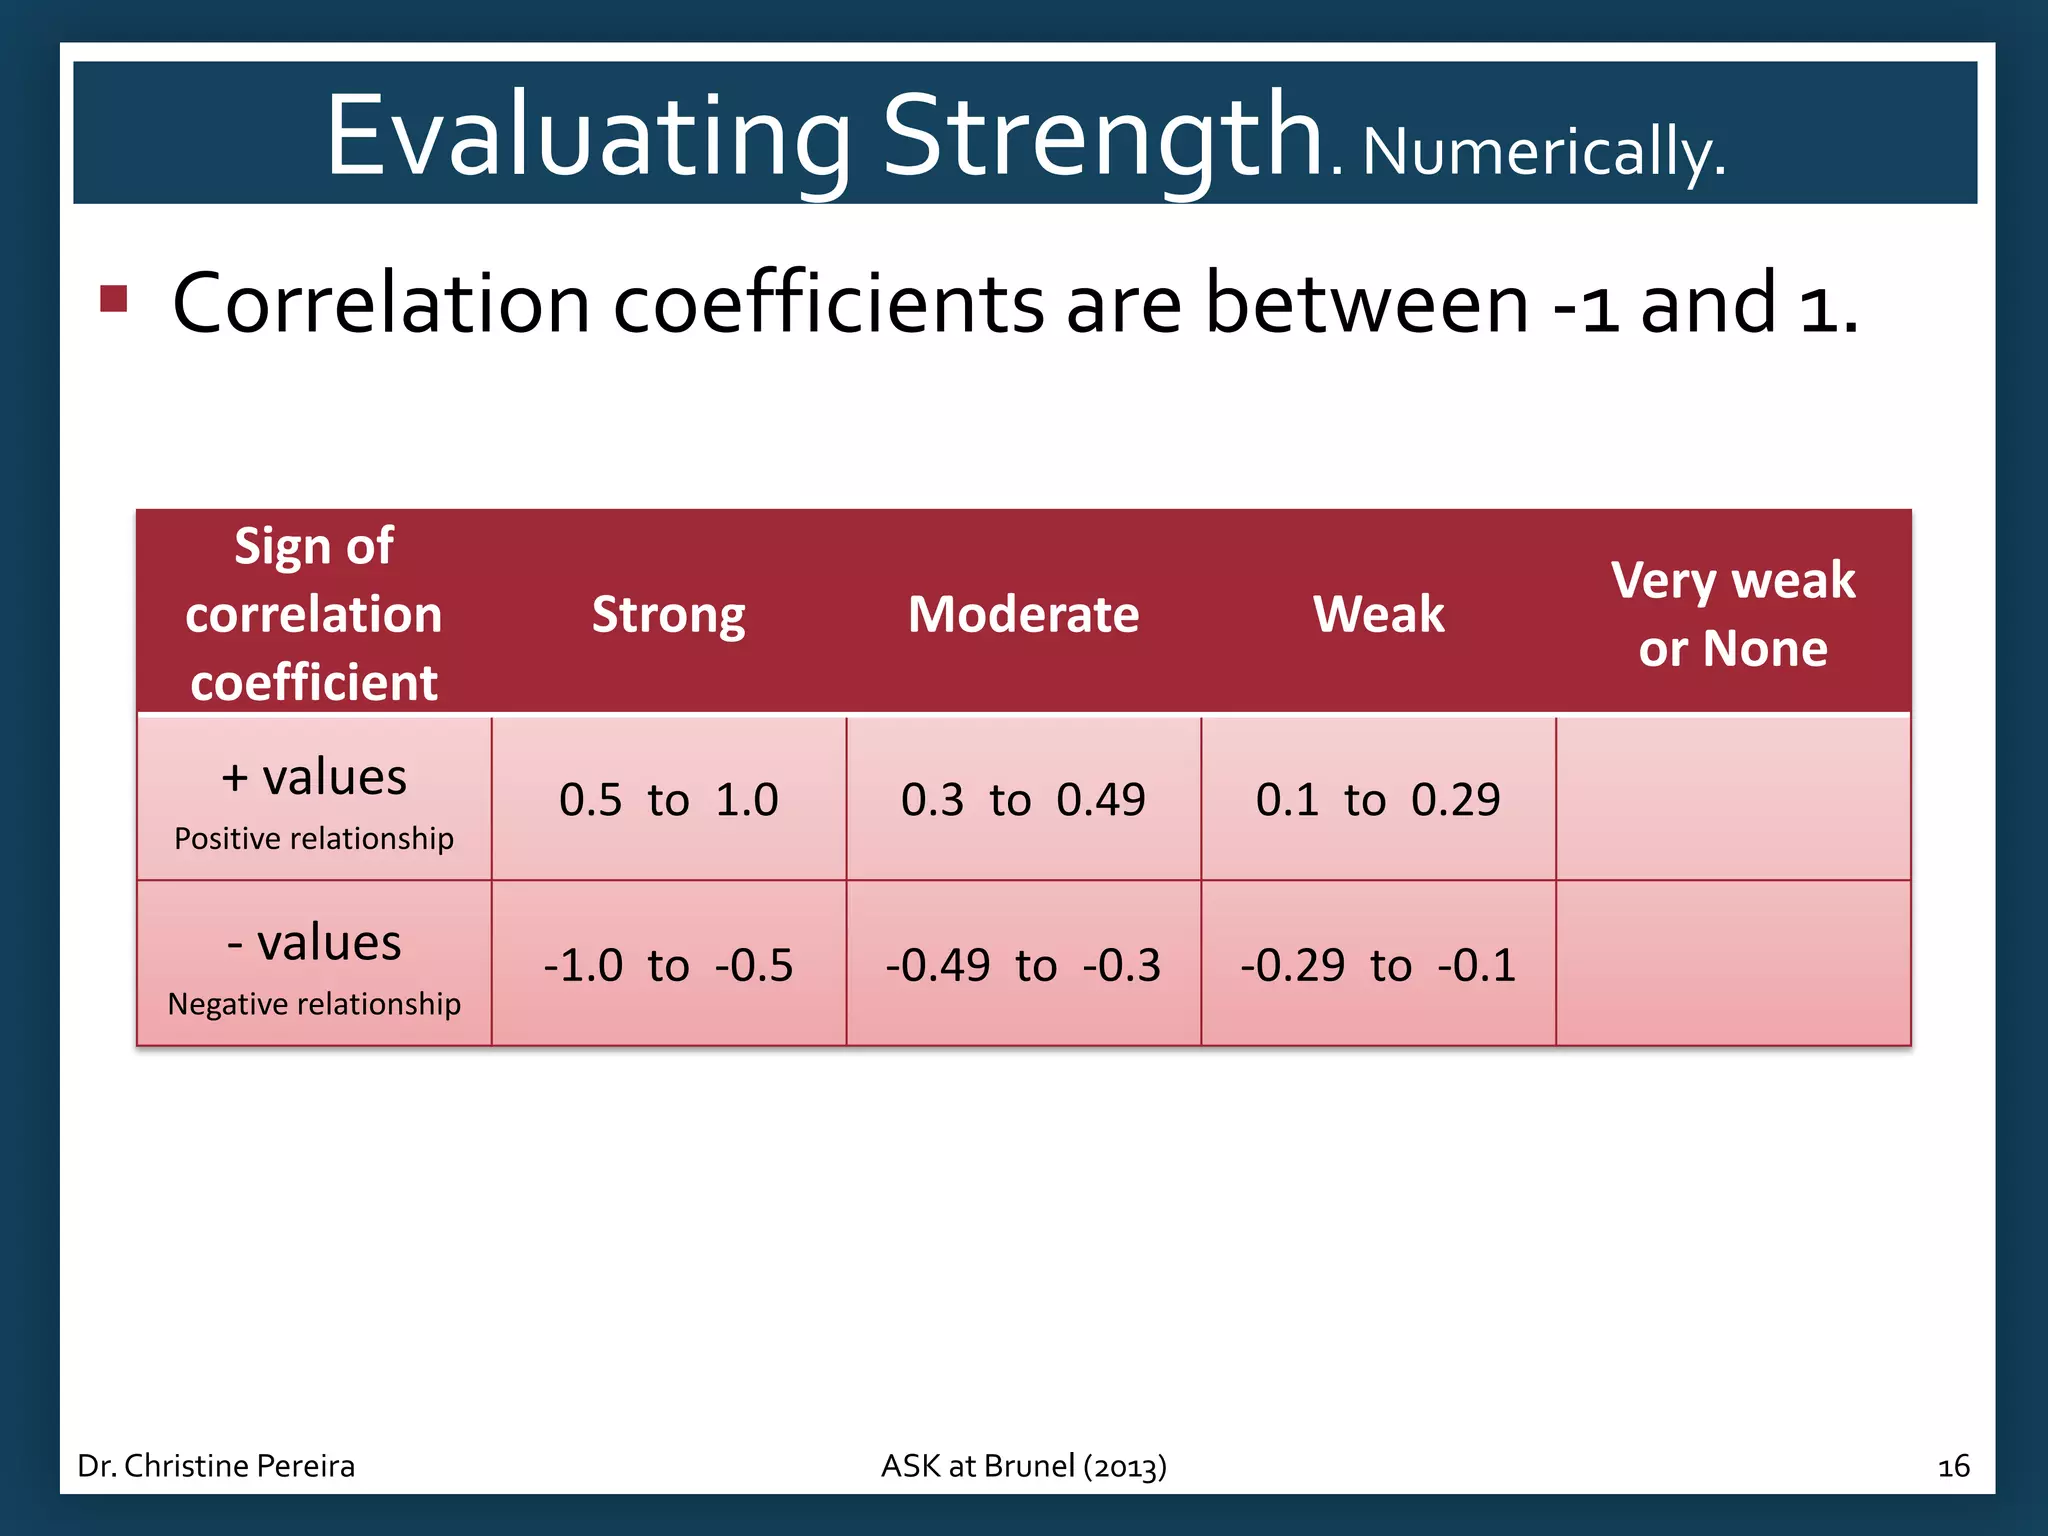
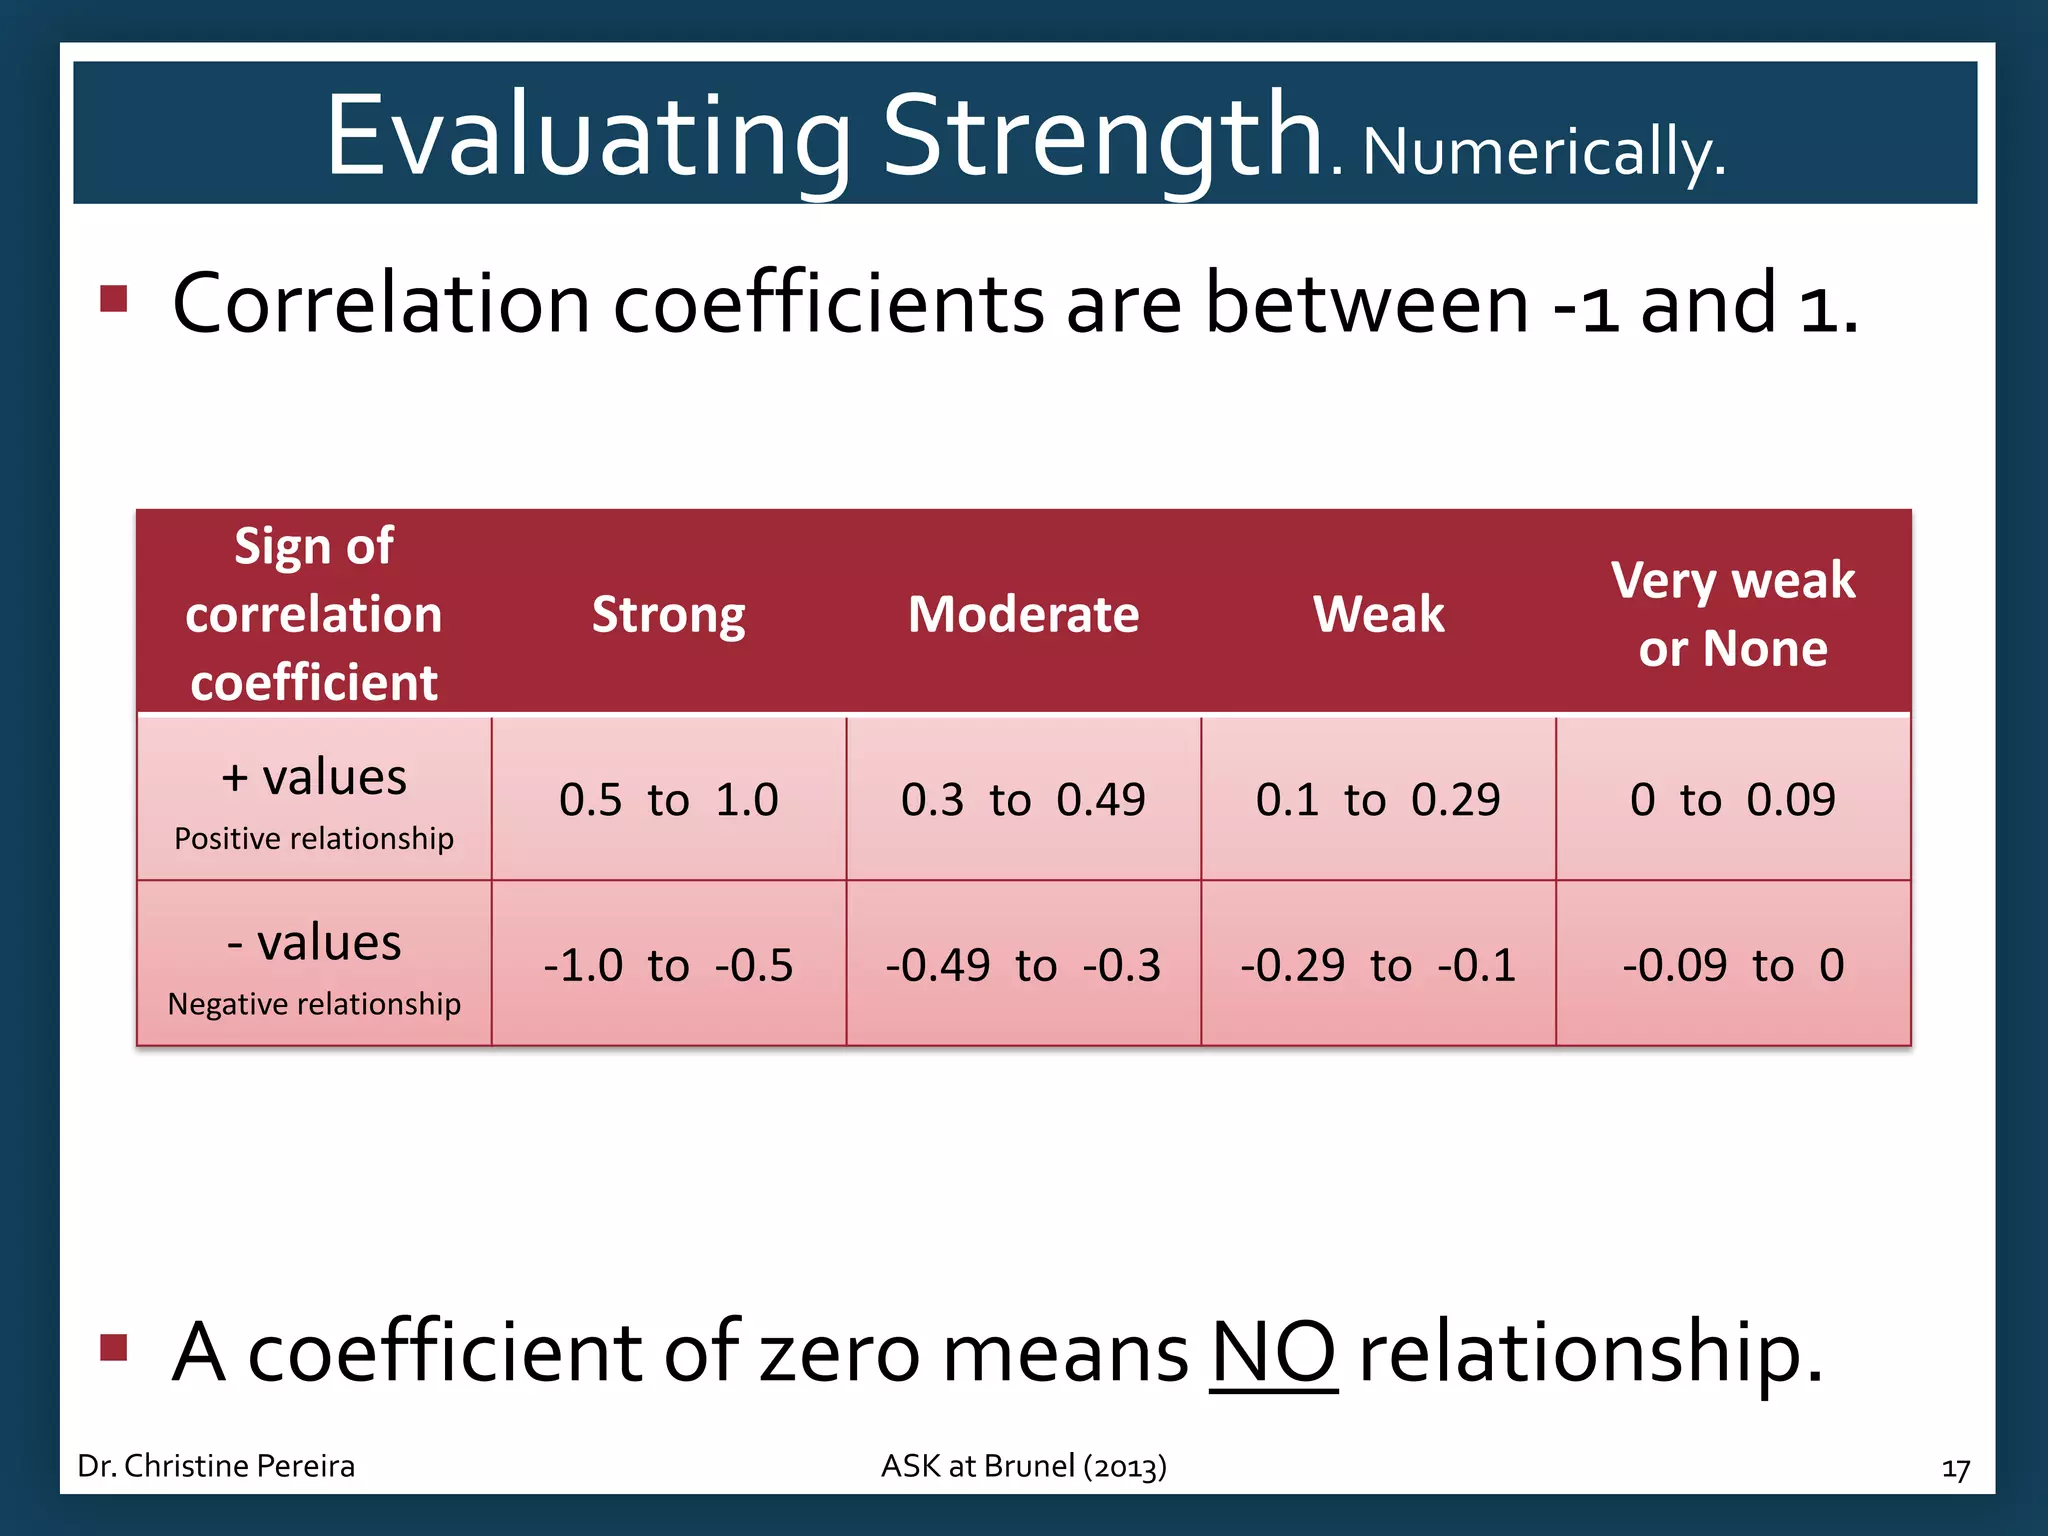
Interpreting correlation strengths with numerical values; classification of relationships based on correlation coefficients ranging from -1 to 1.
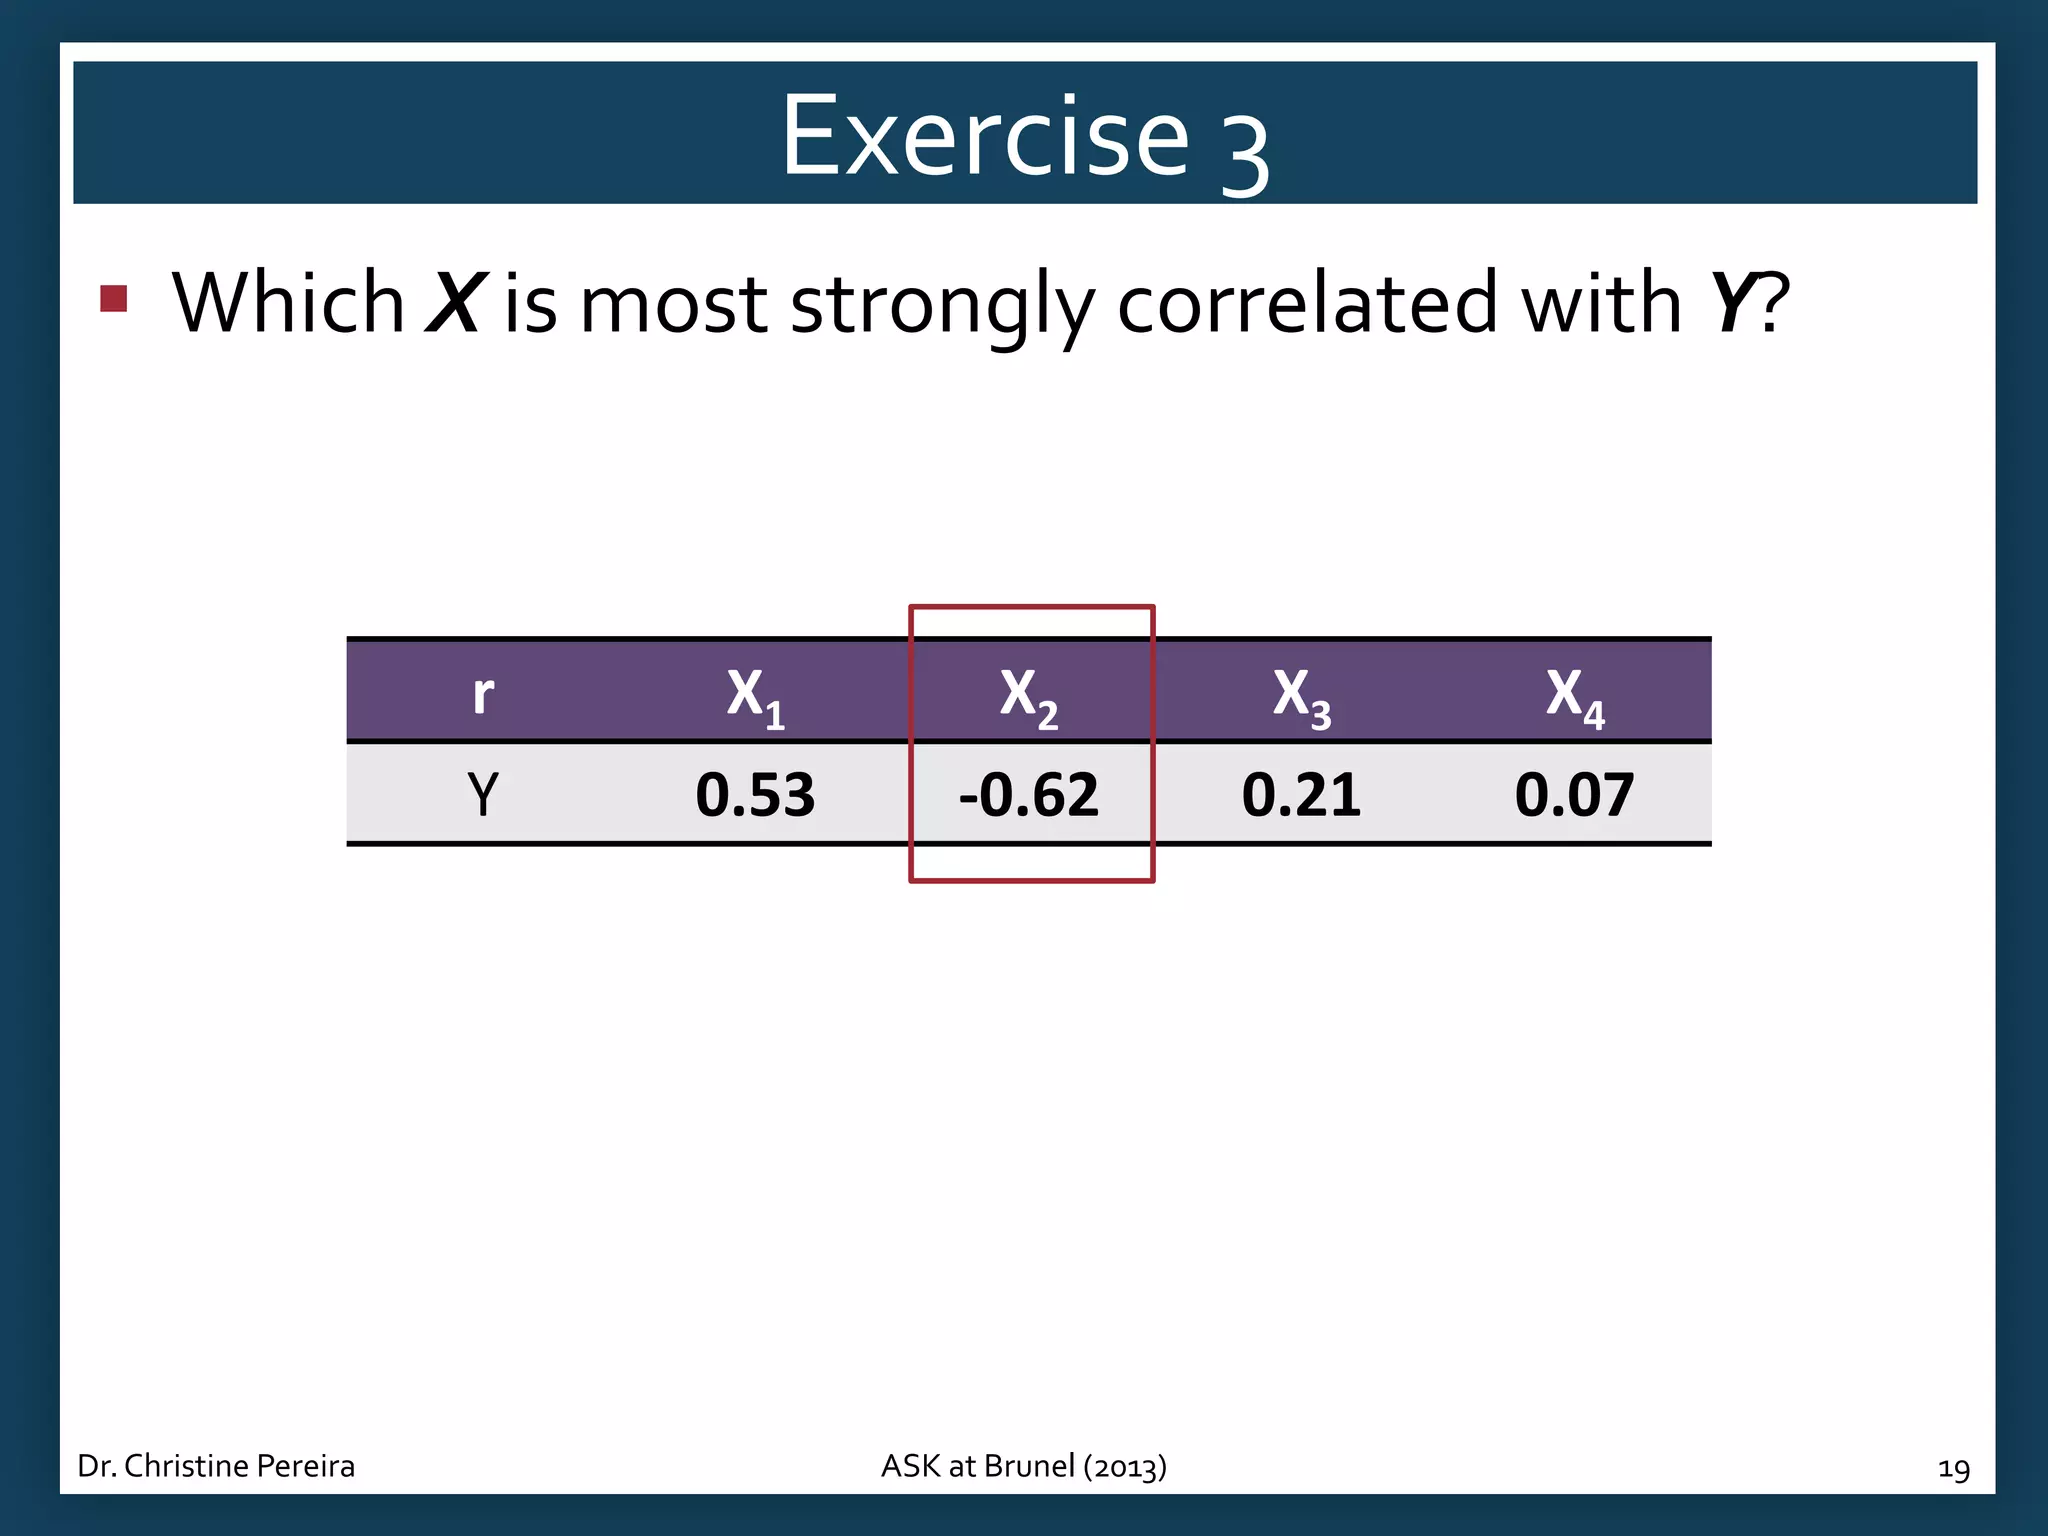
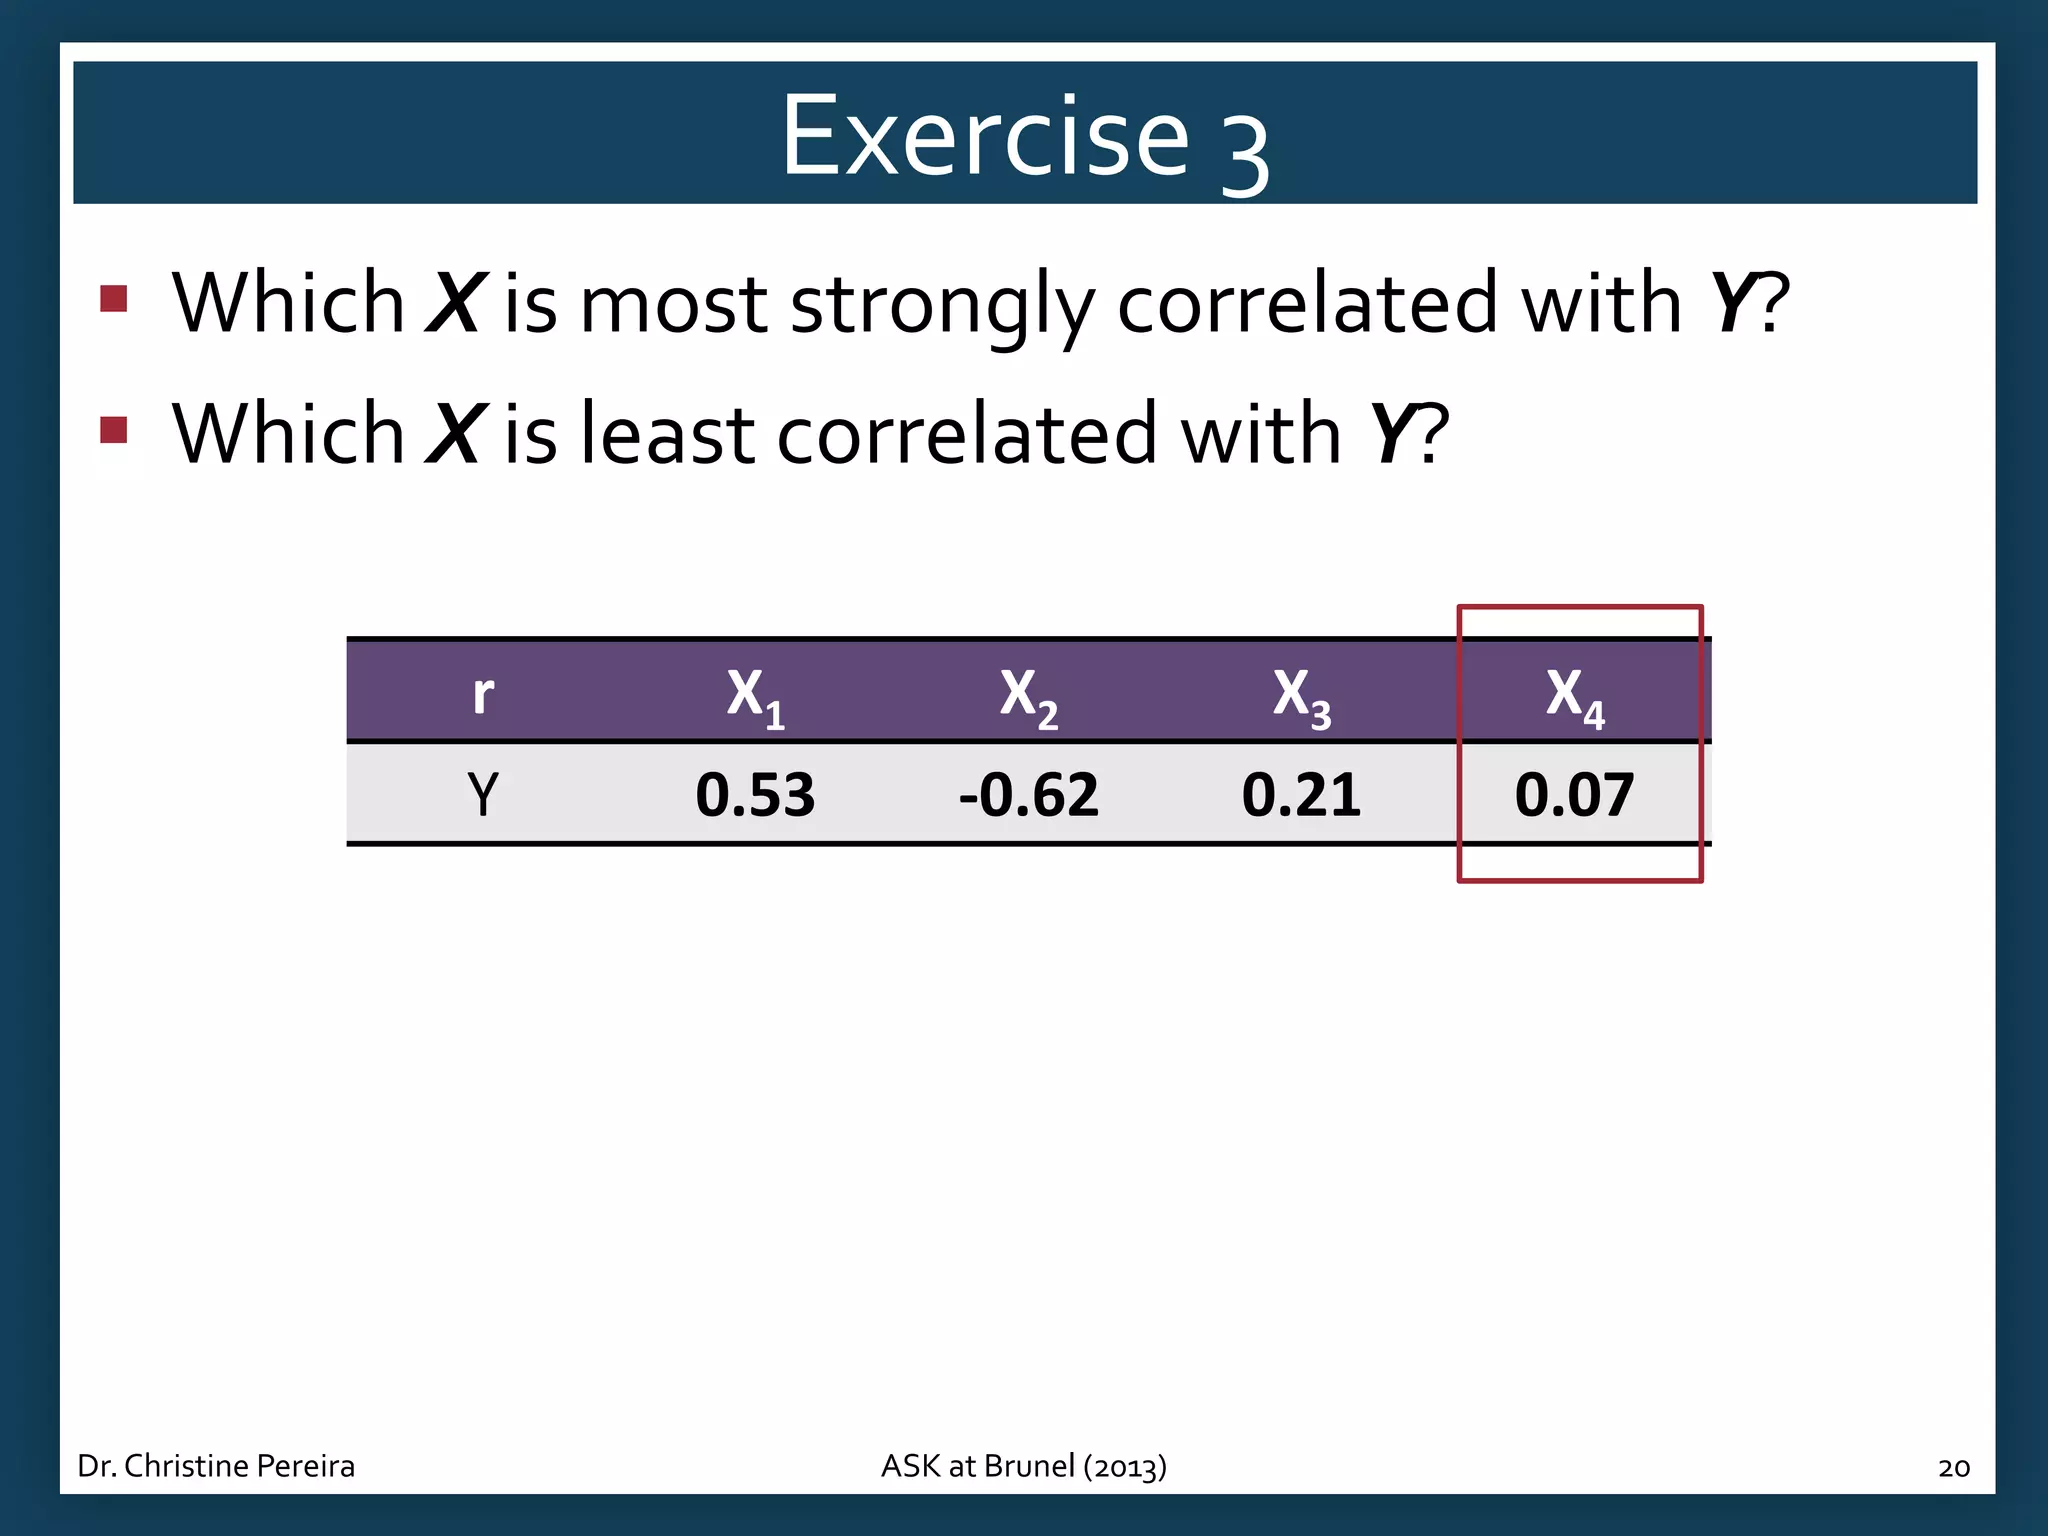
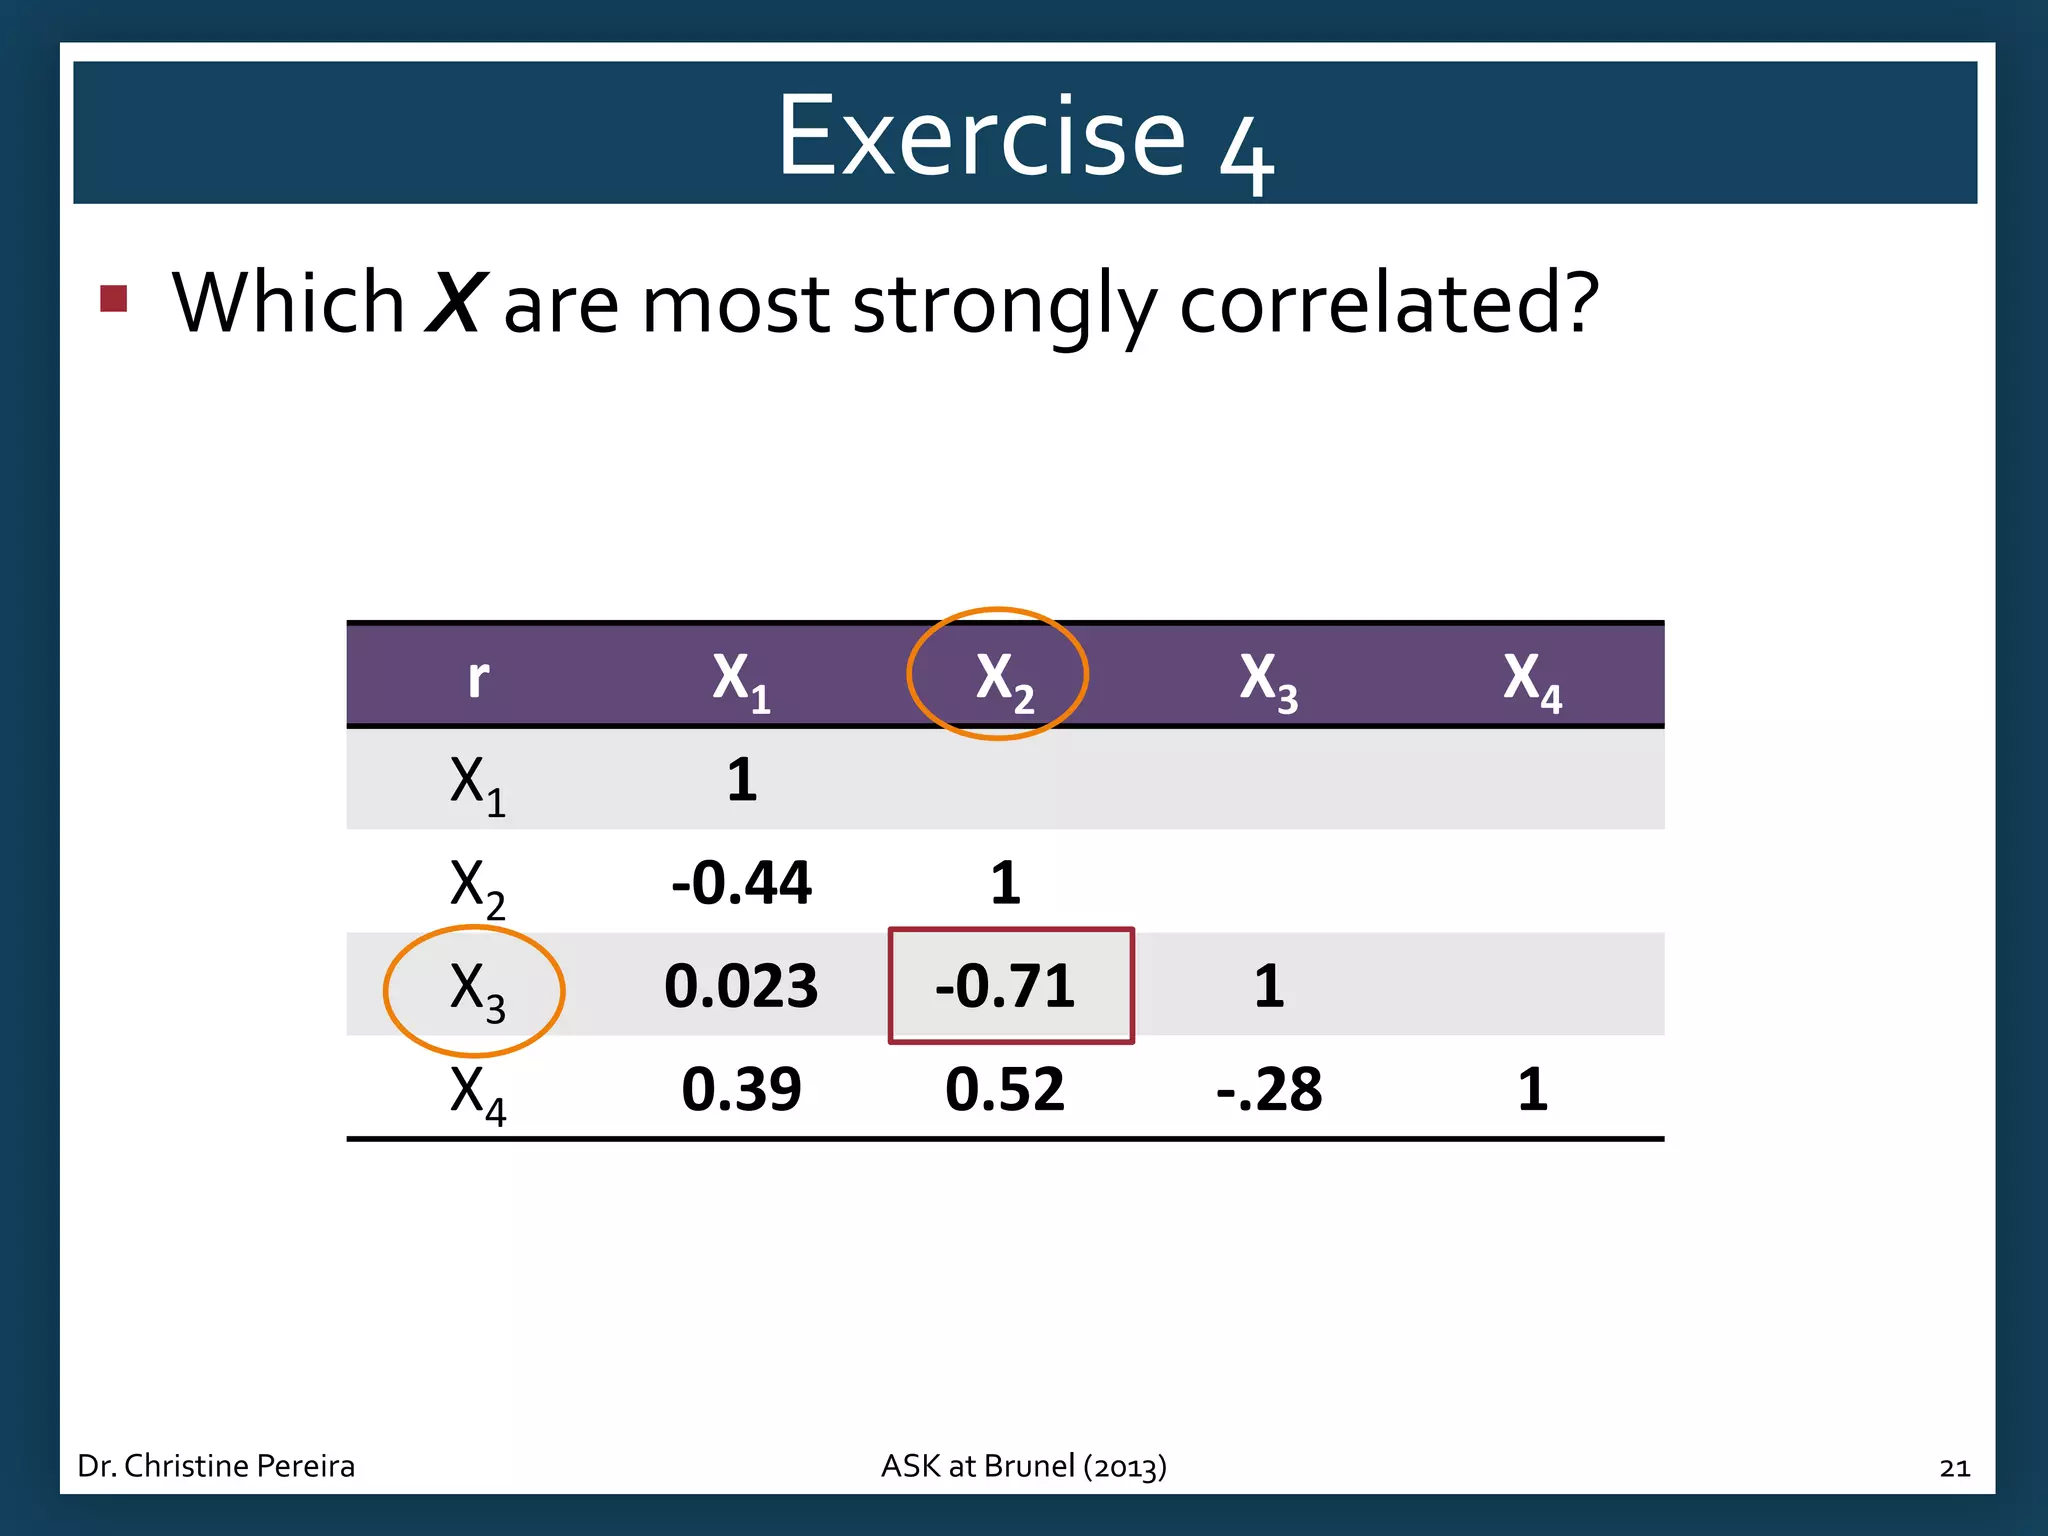
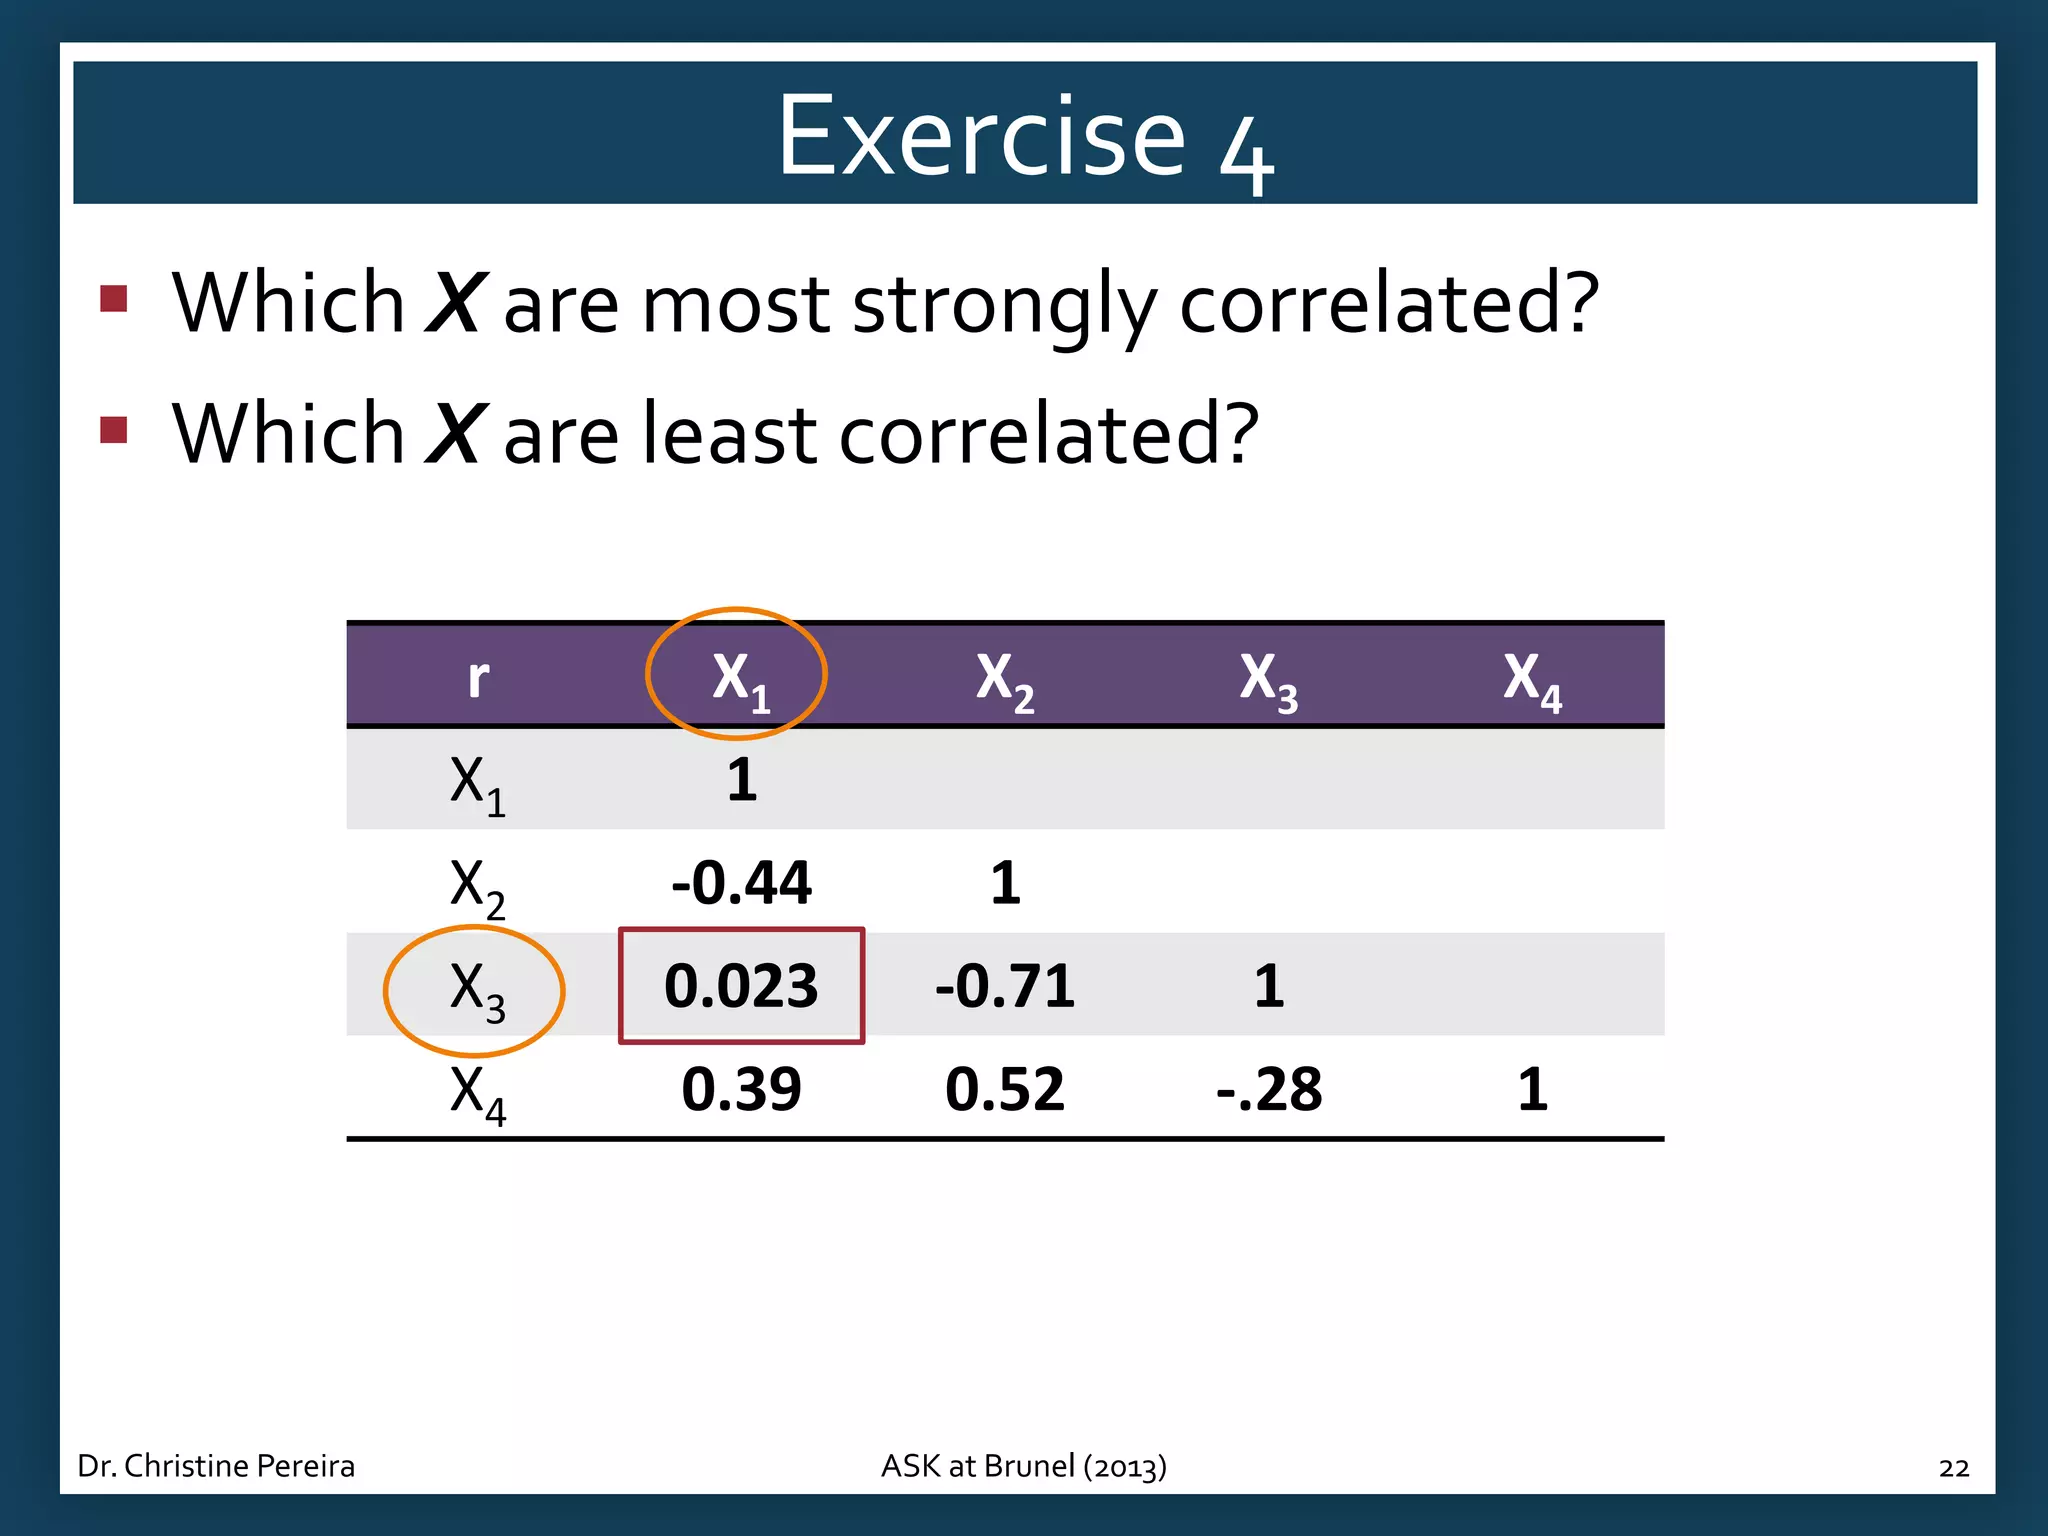
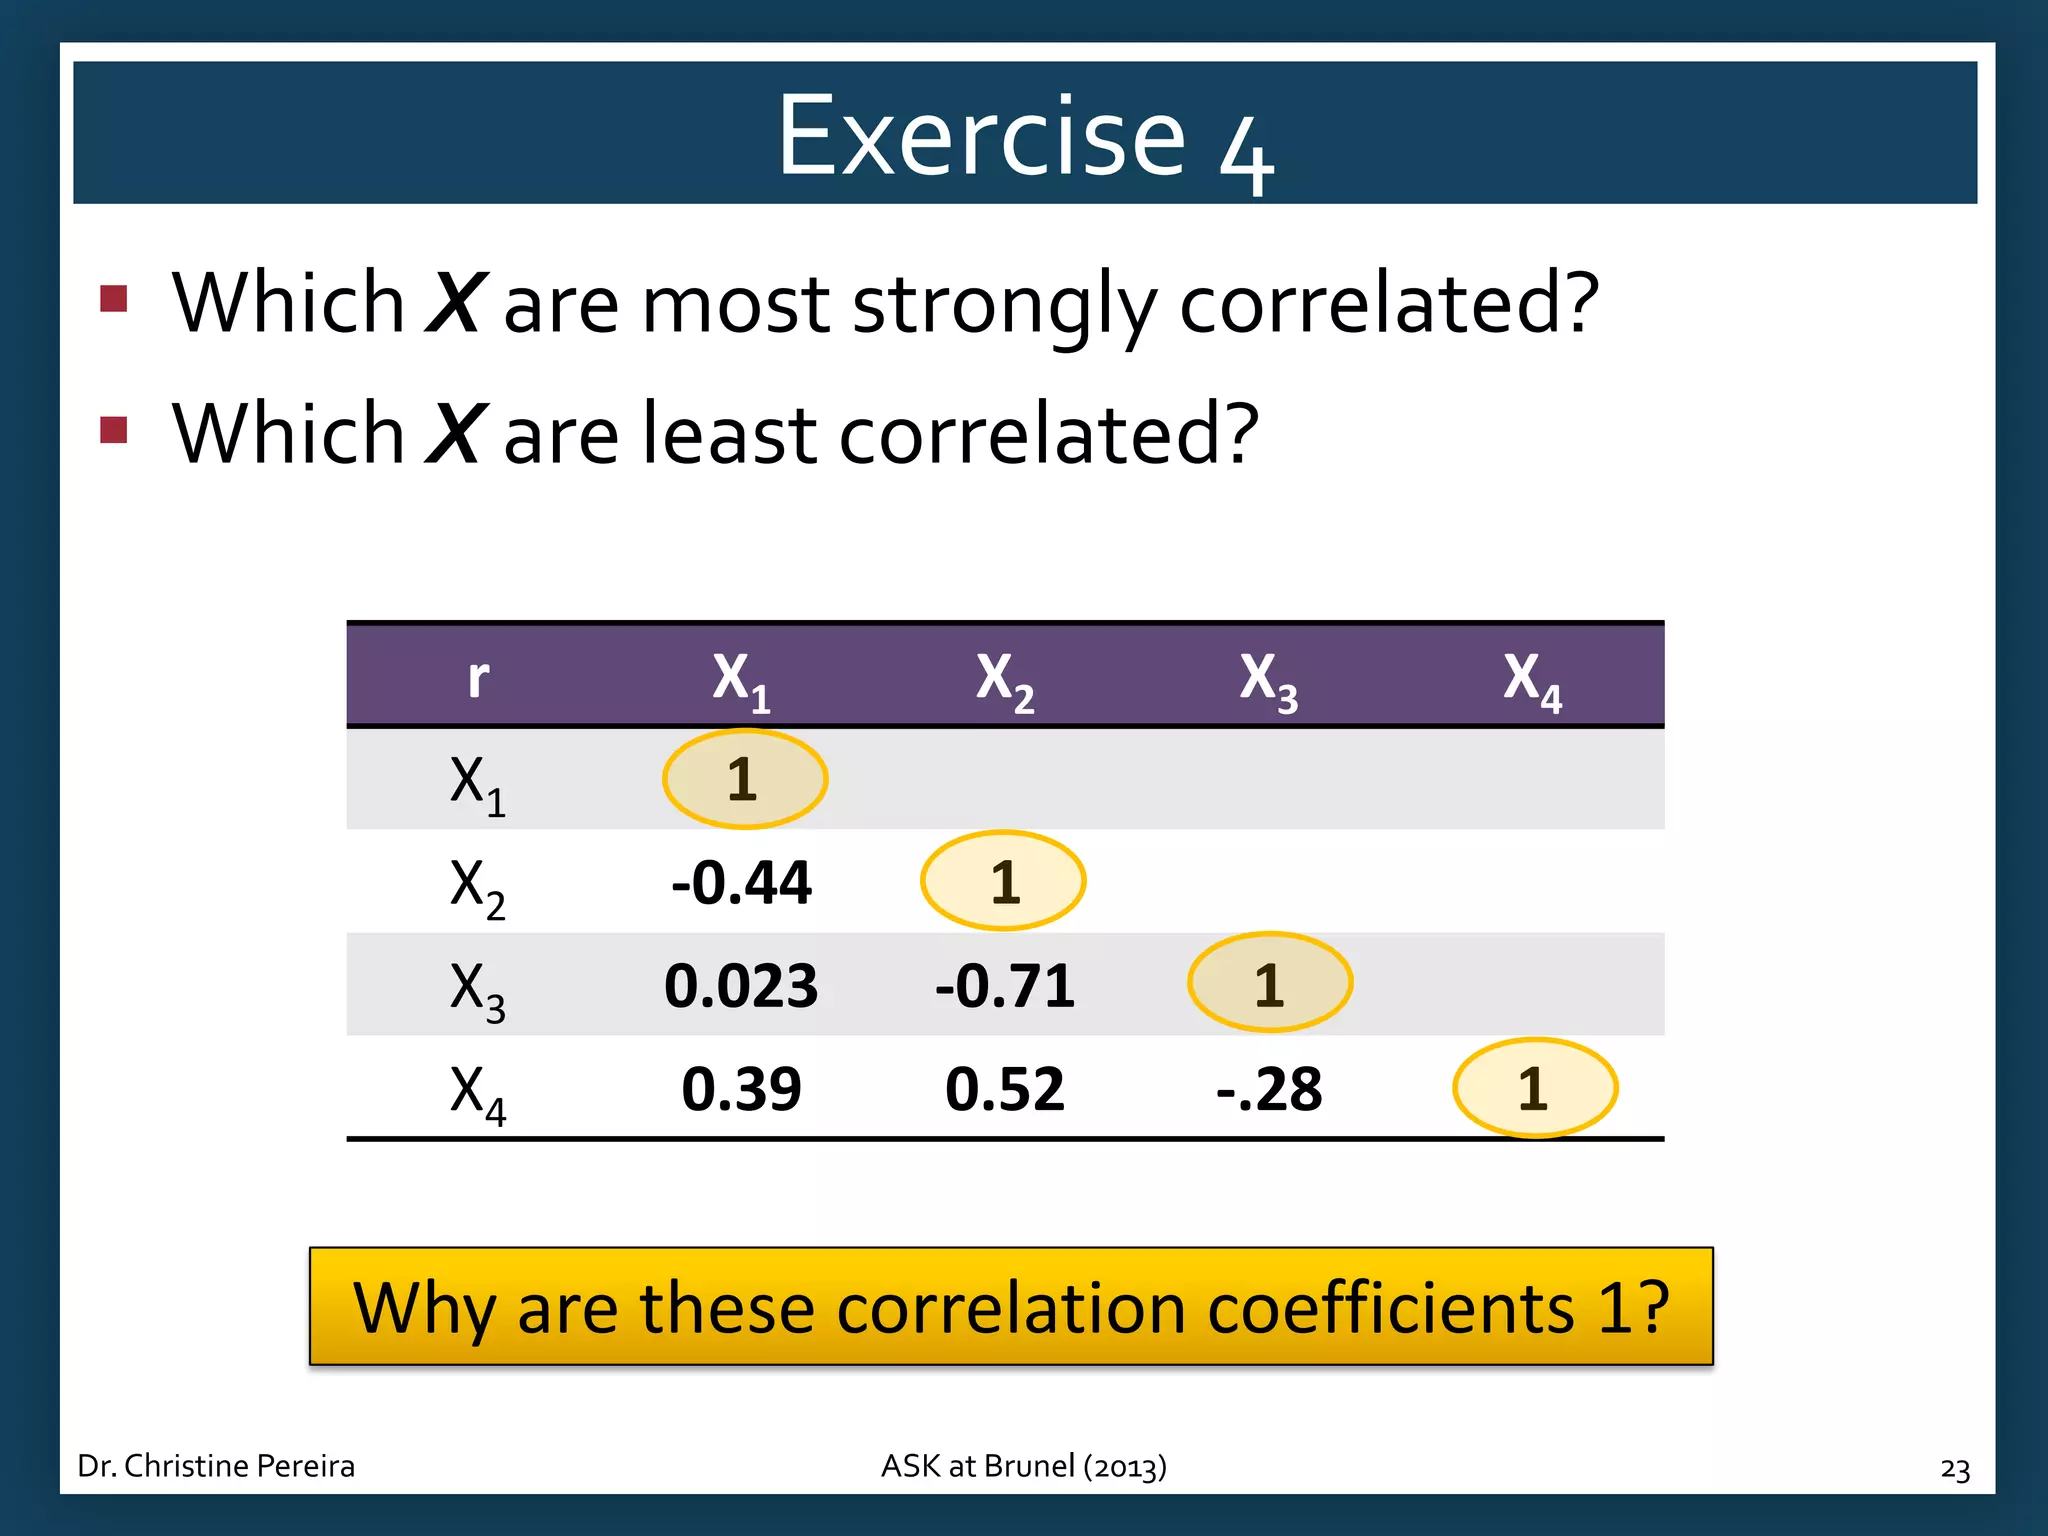
Interactive exercises matching scatter plots to correlation coefficients and identifying strengths of different pairs.
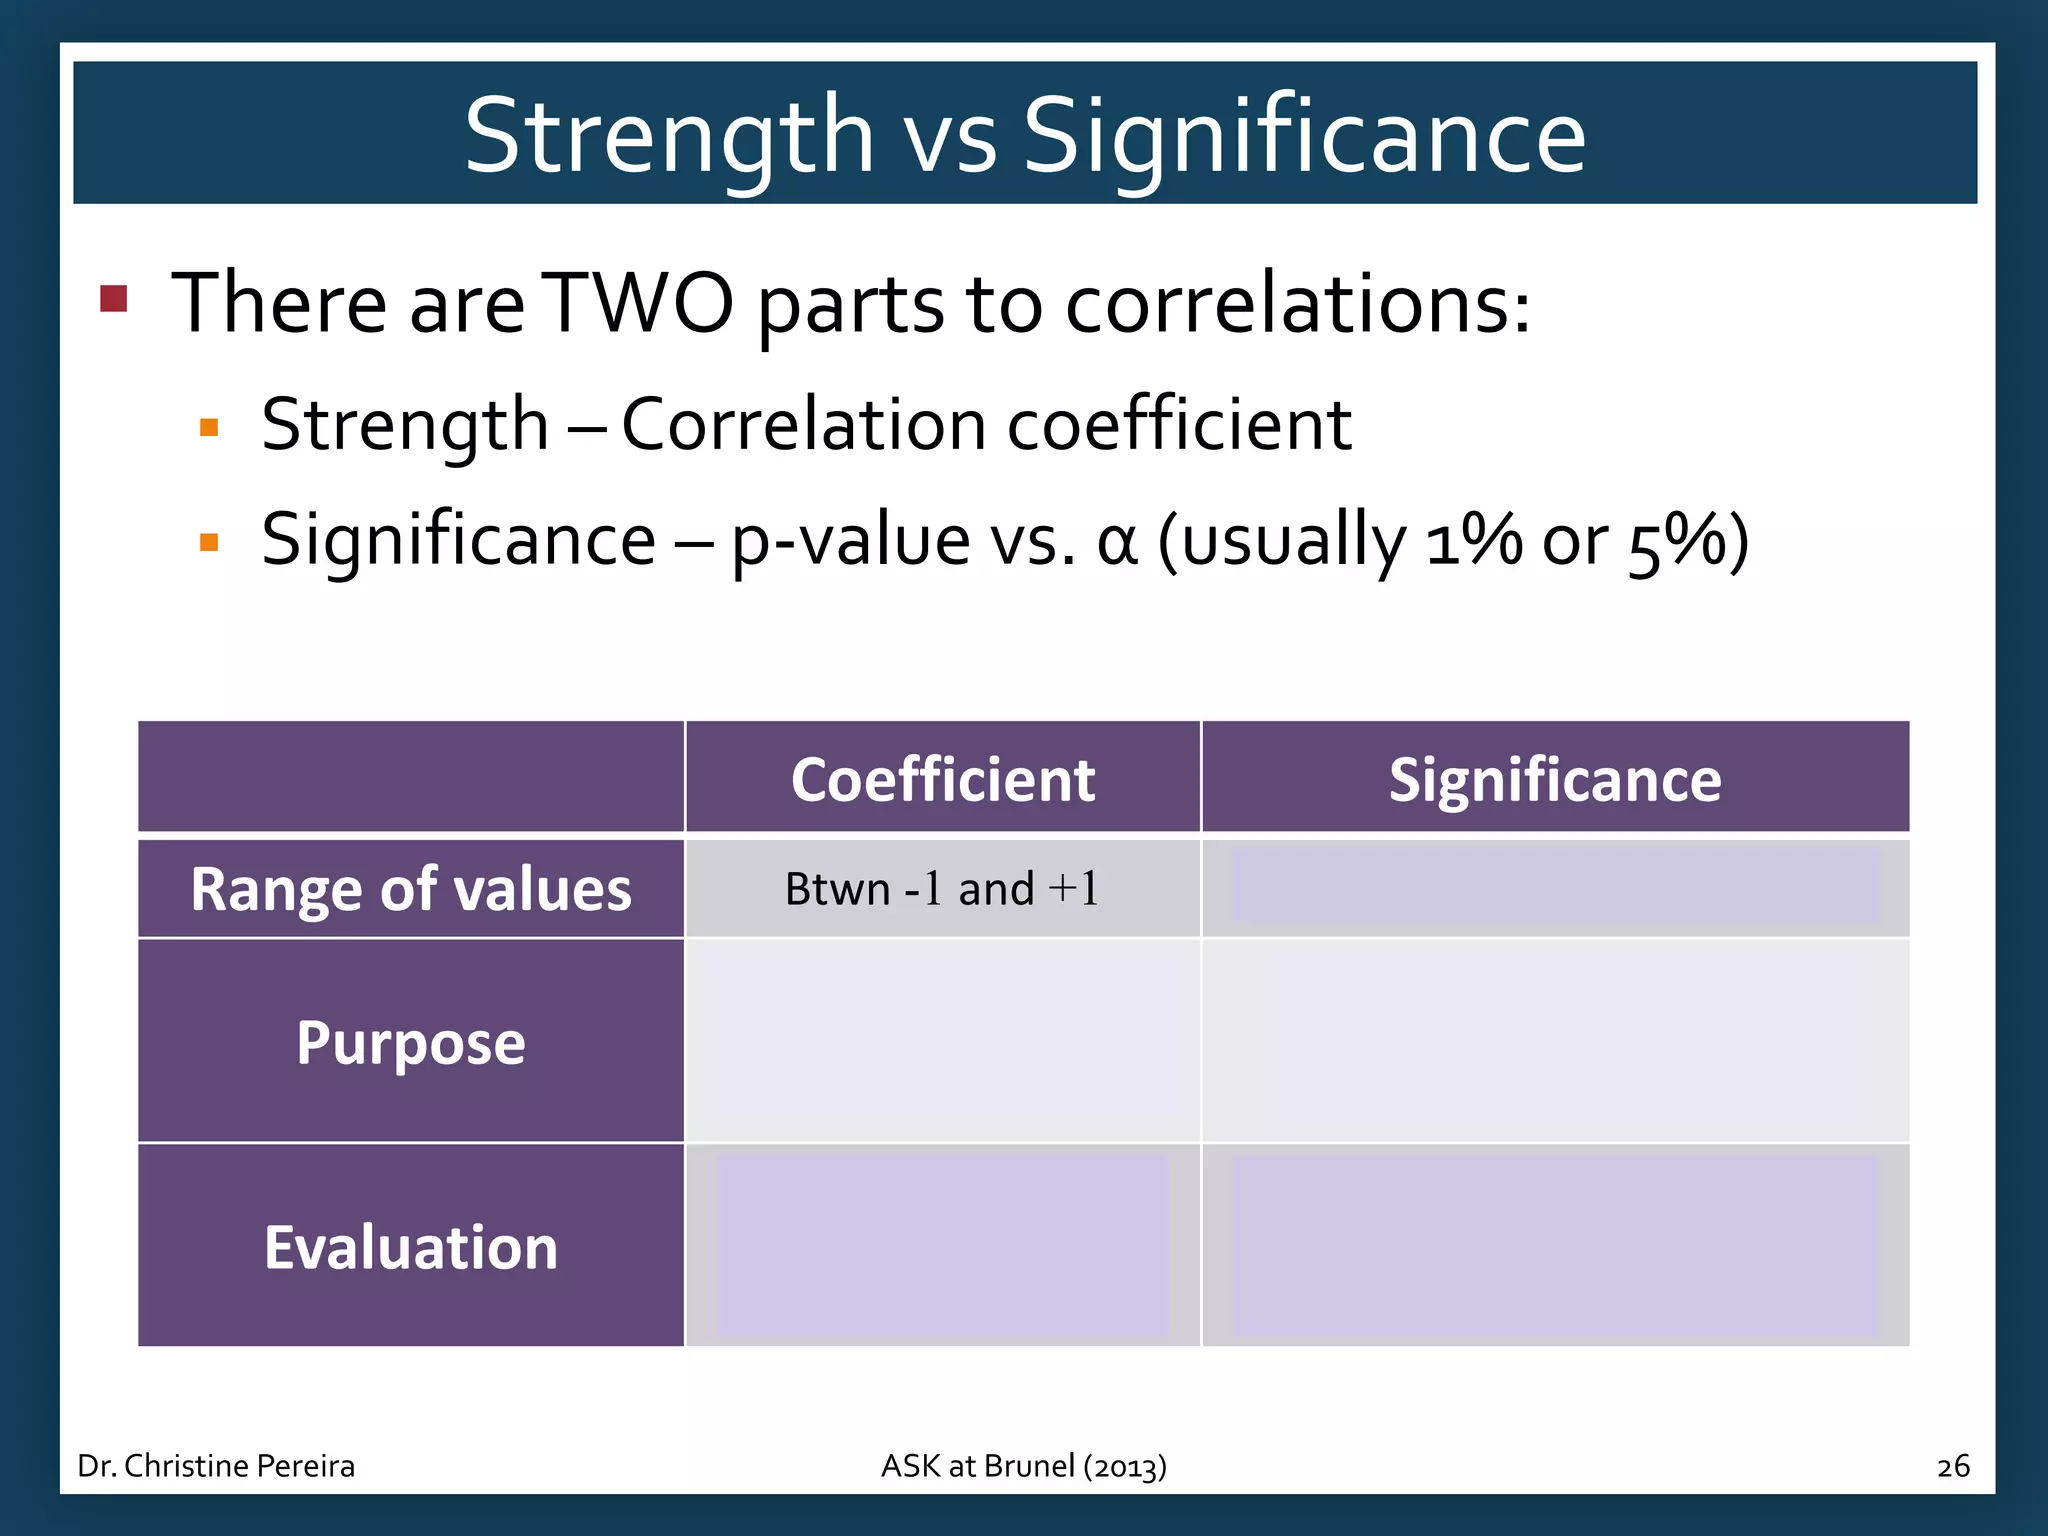
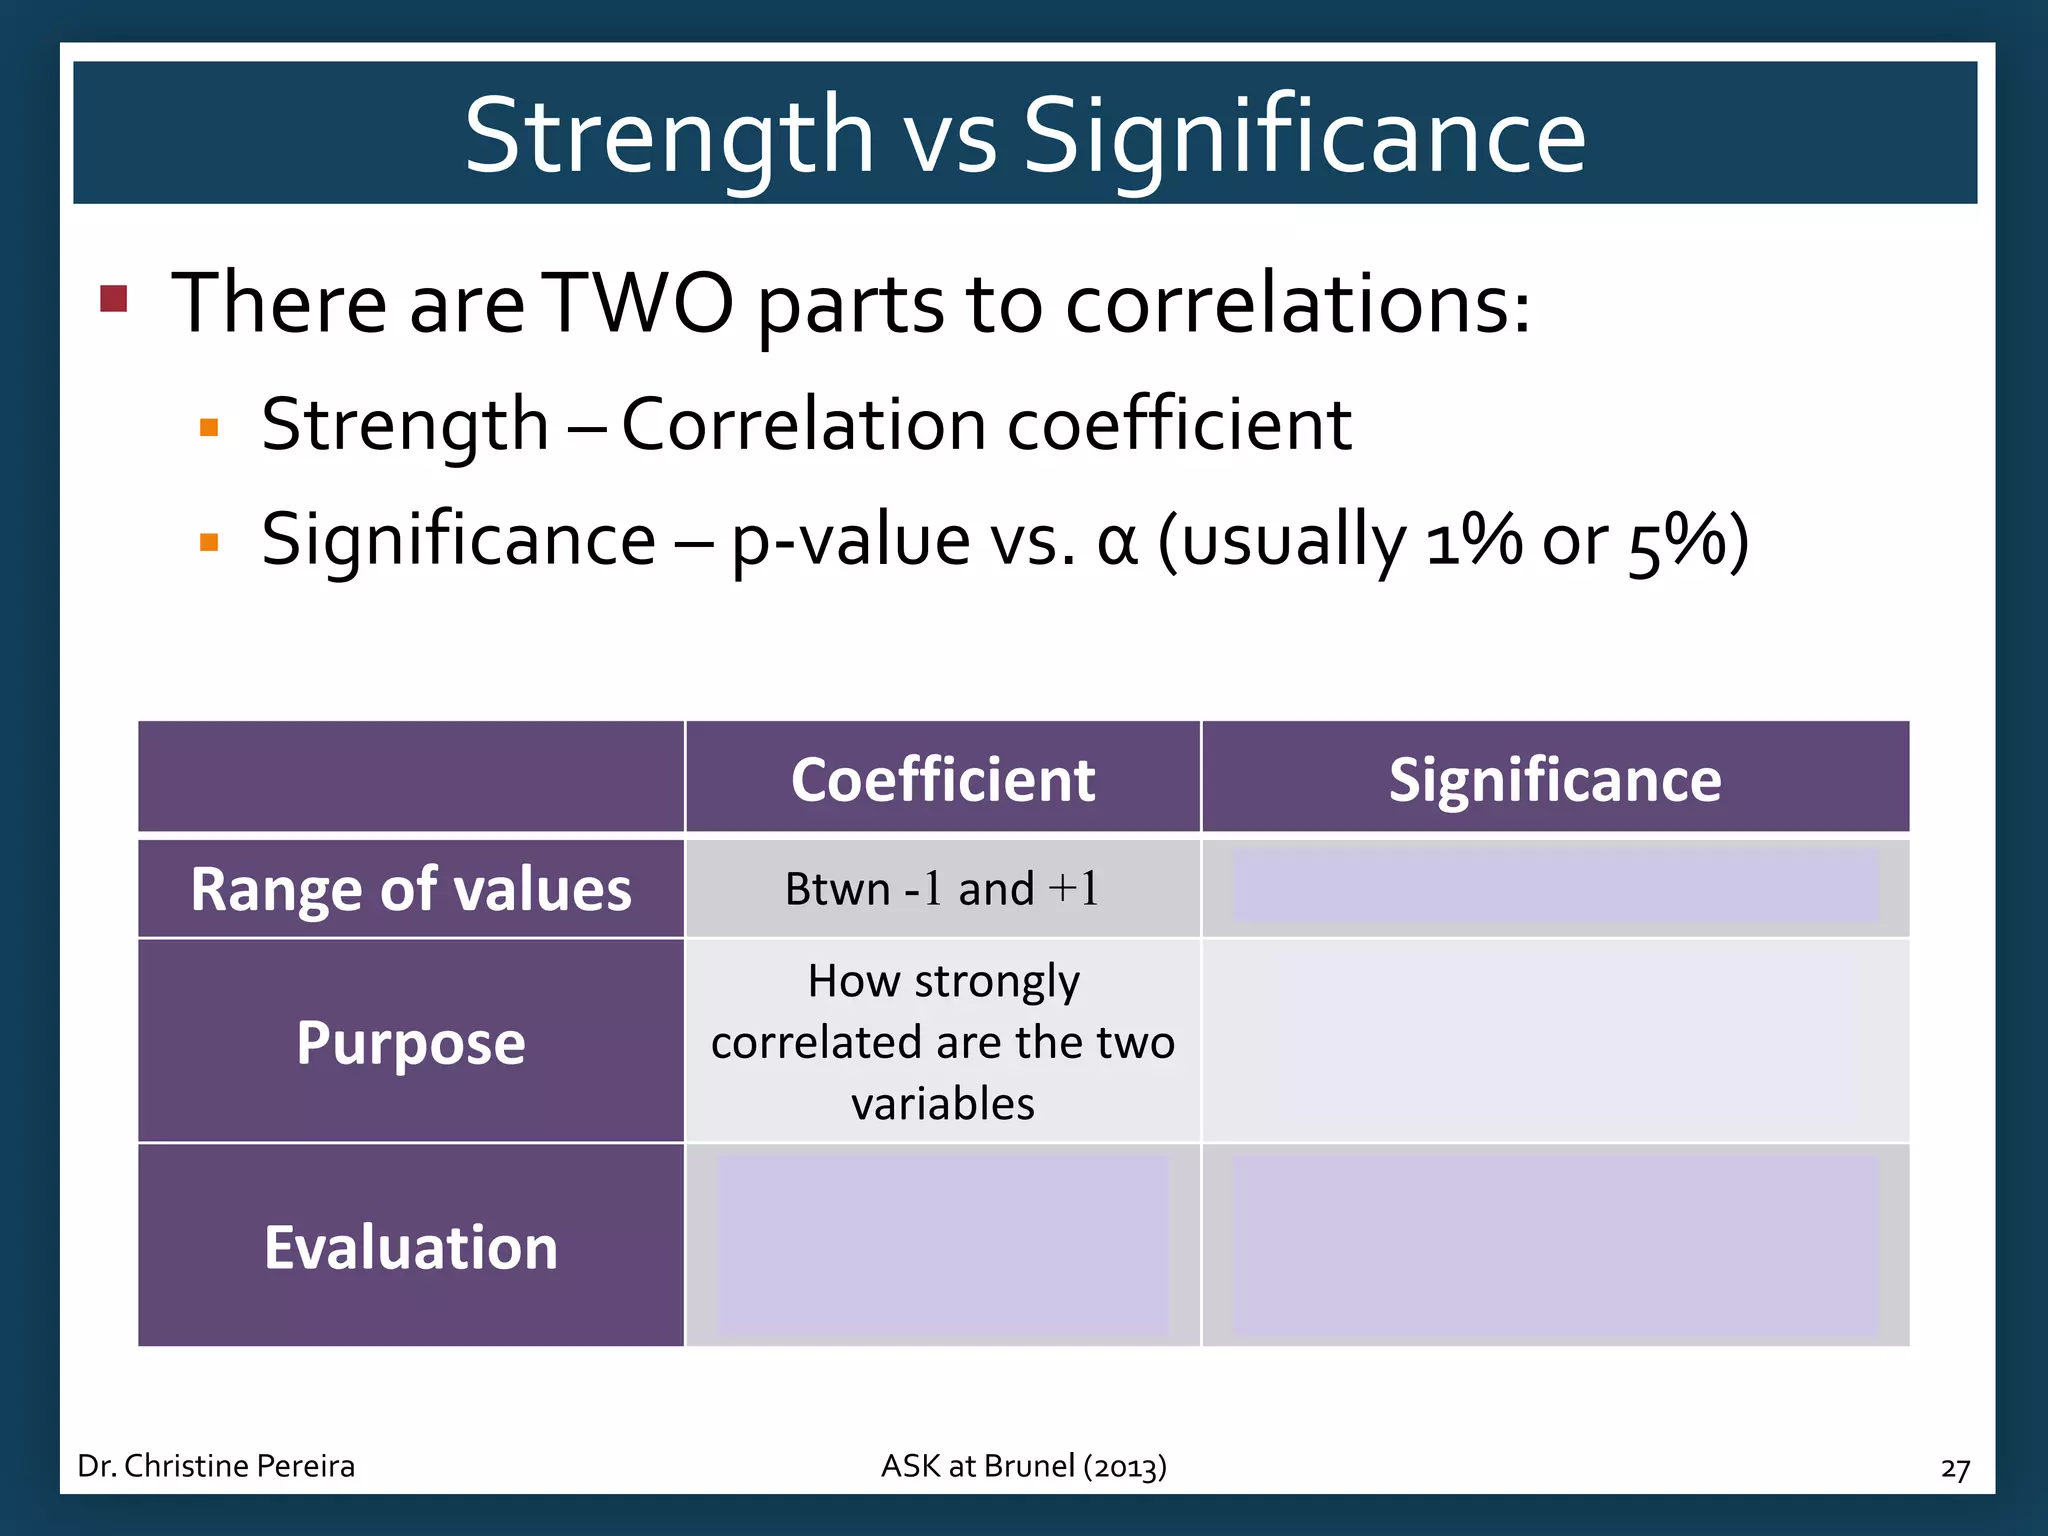
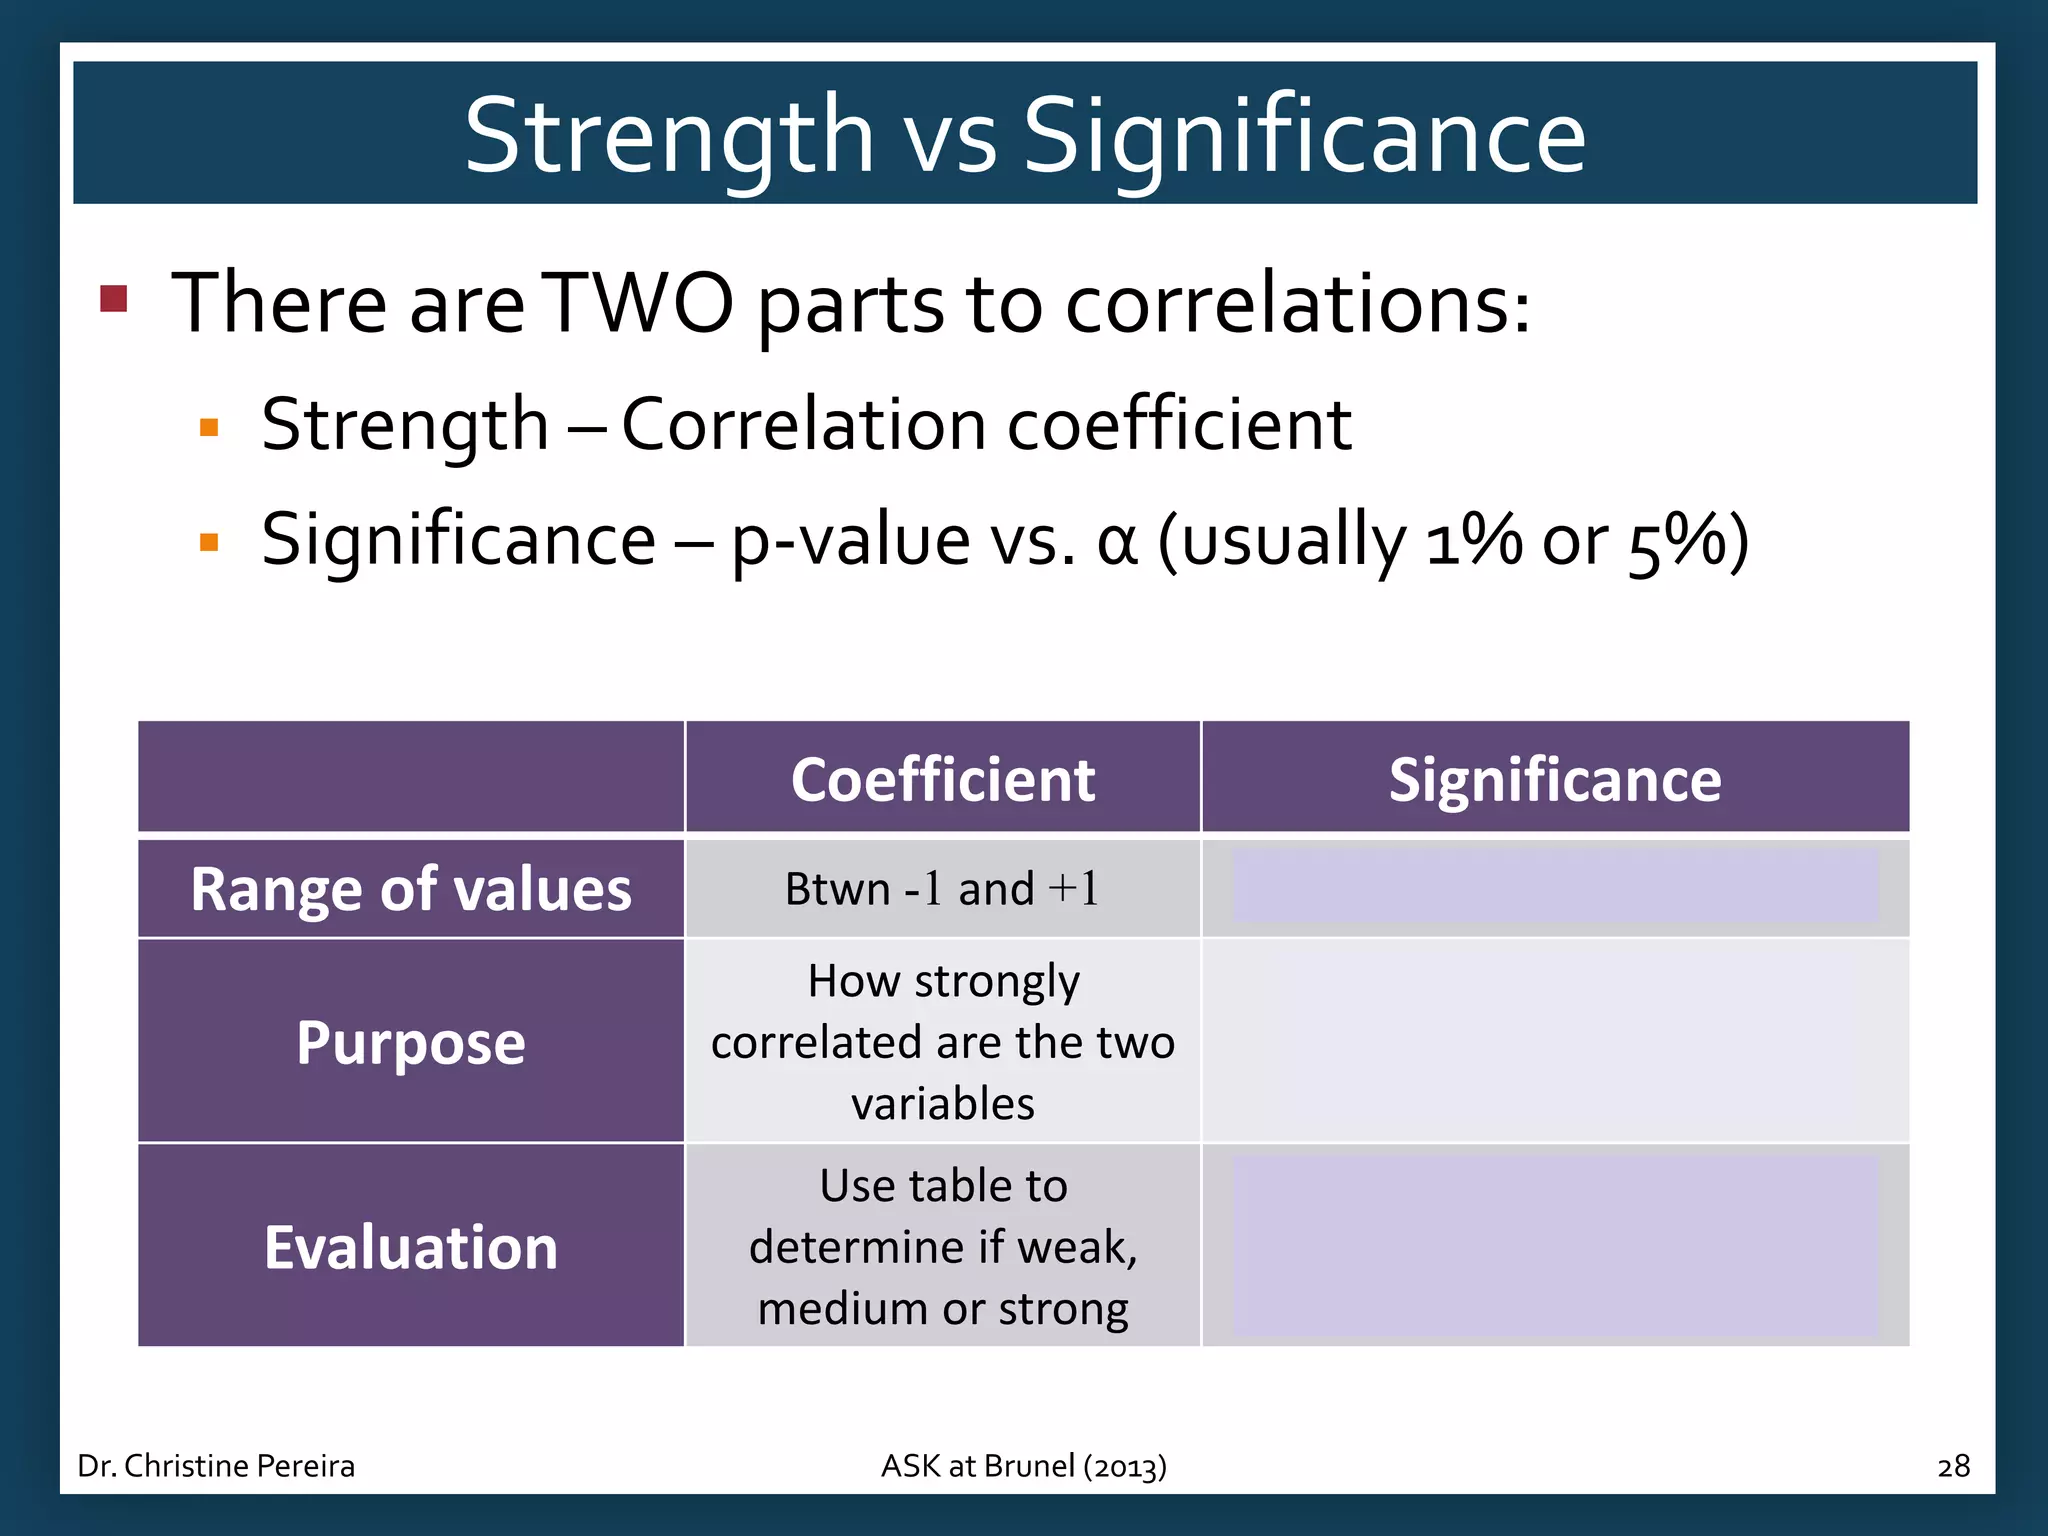
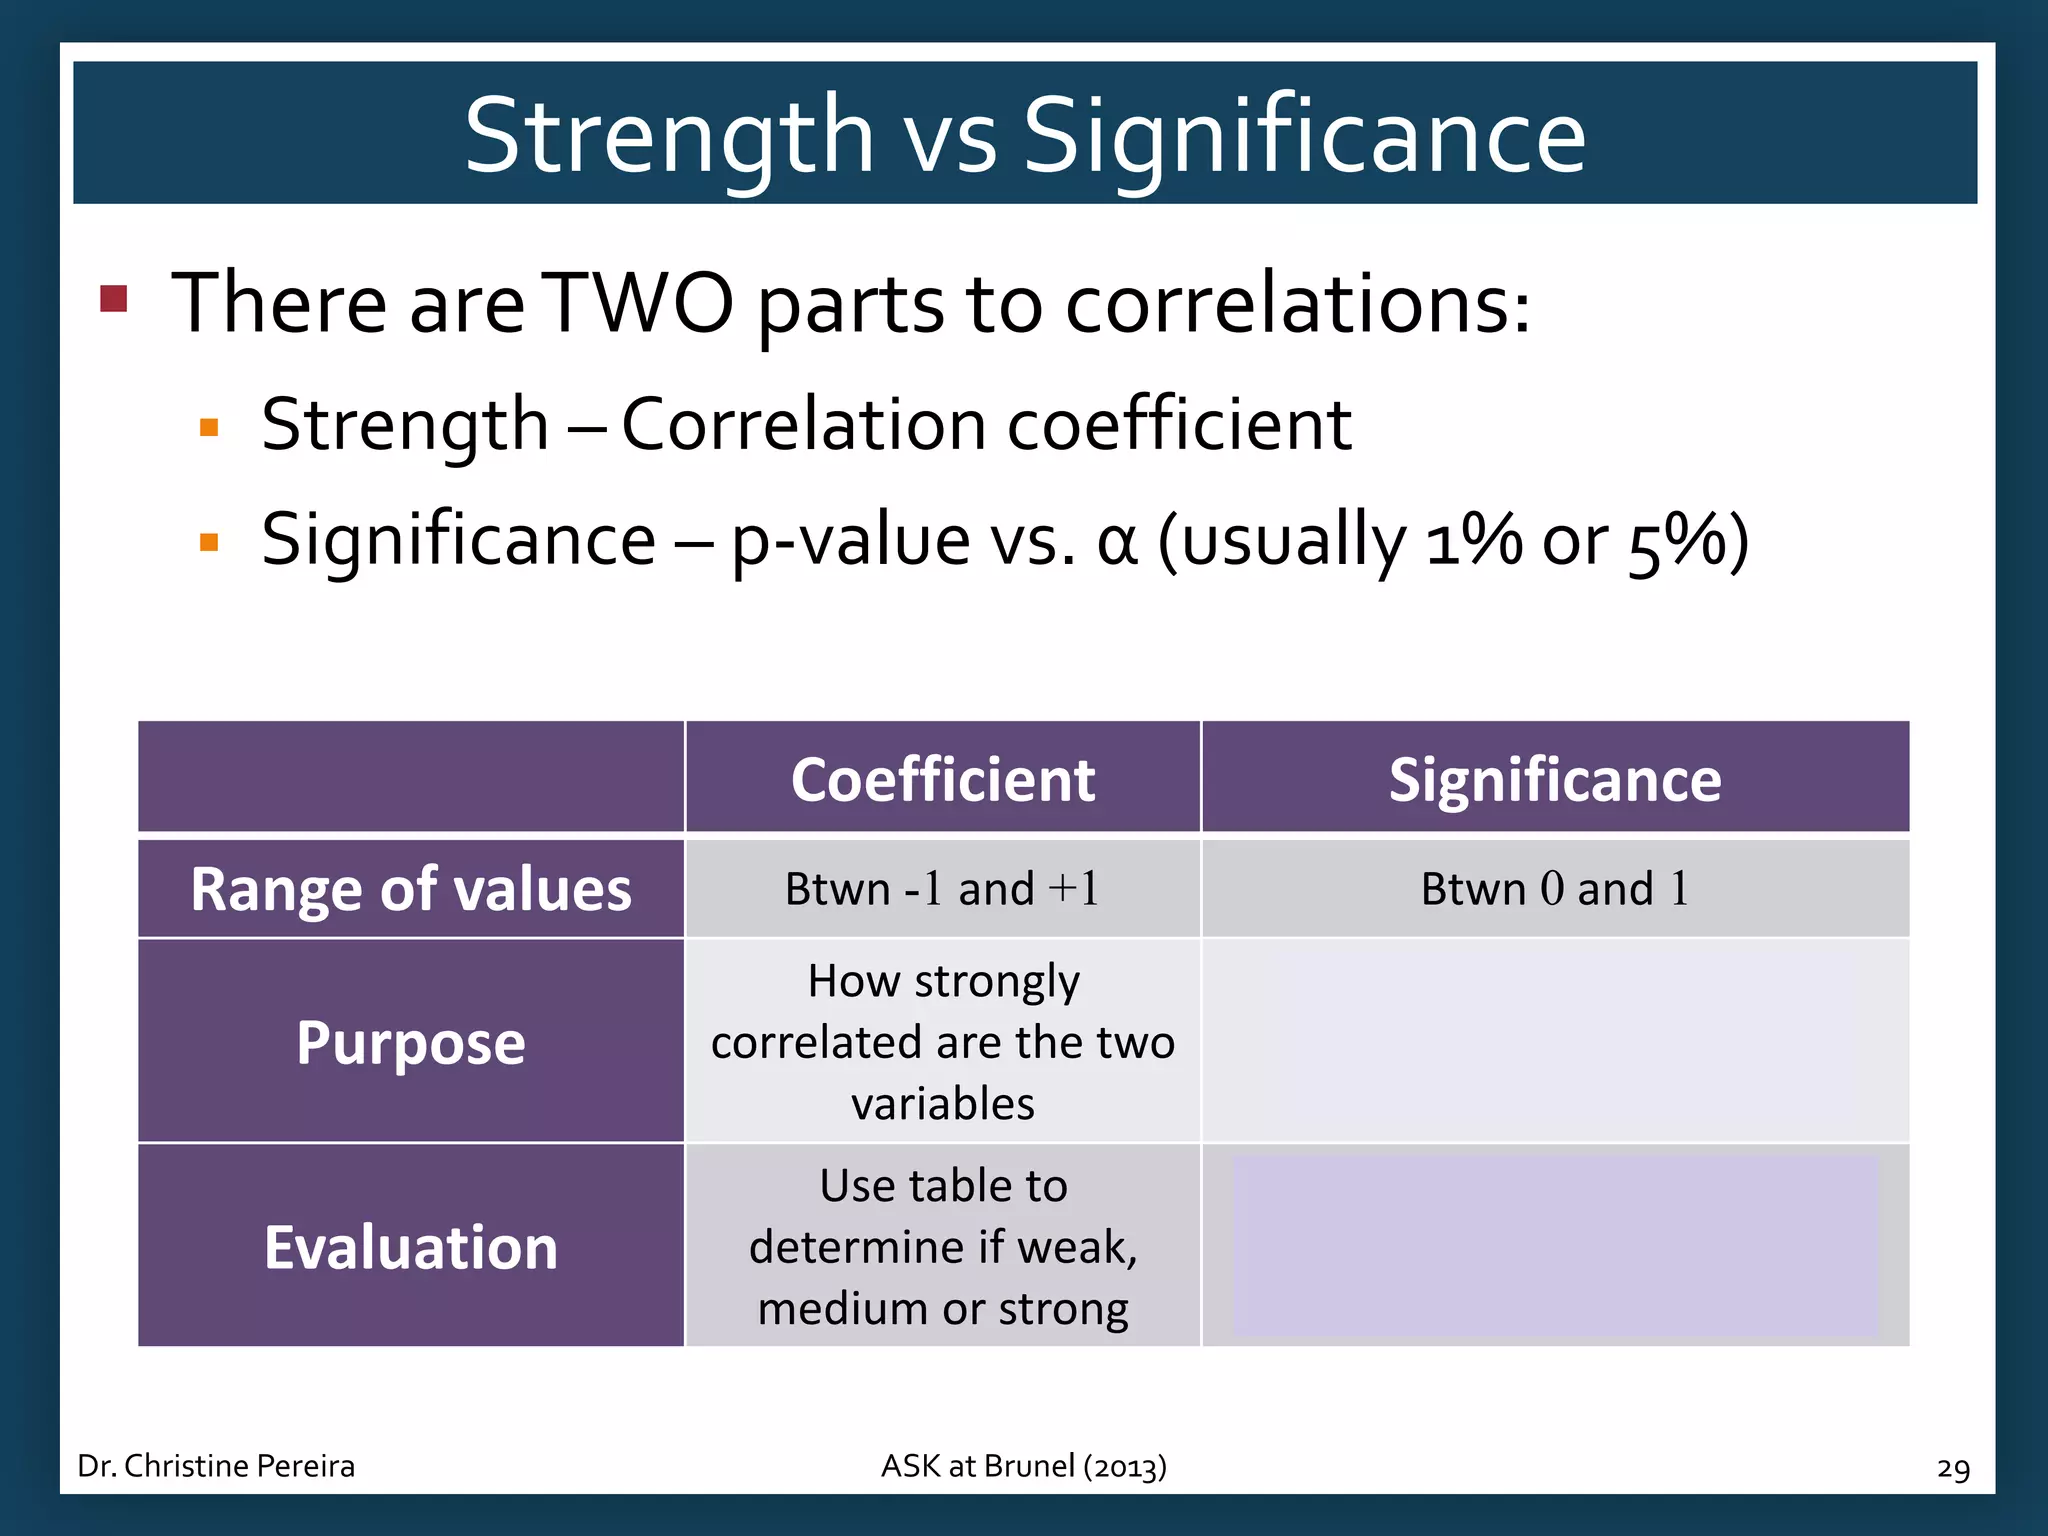
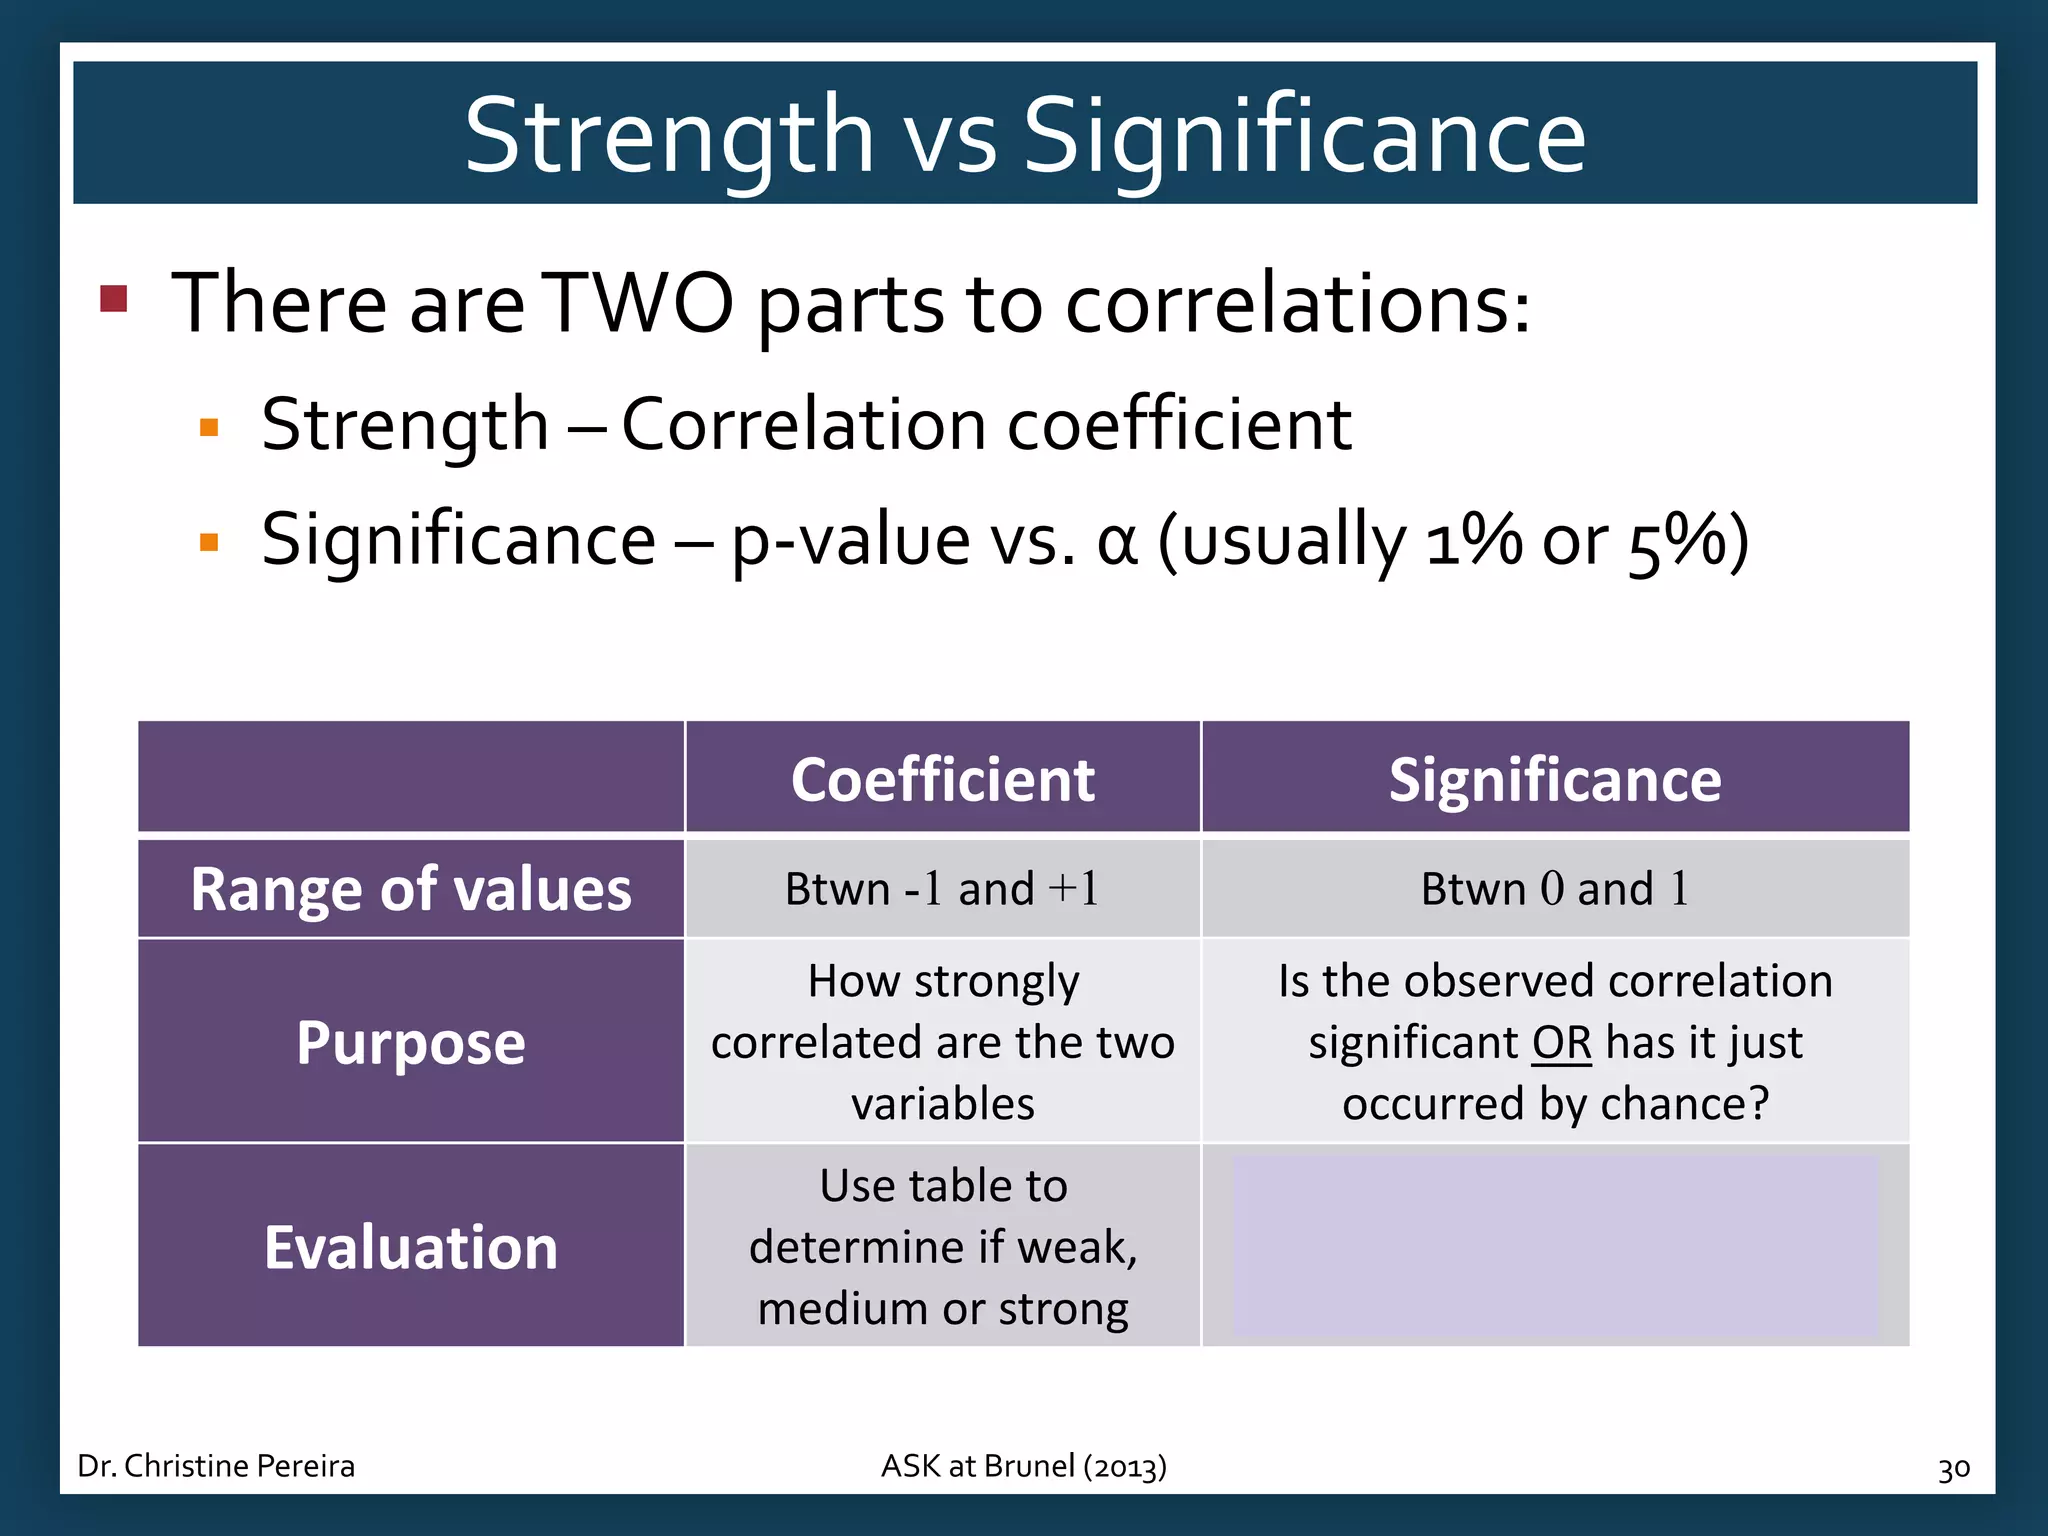
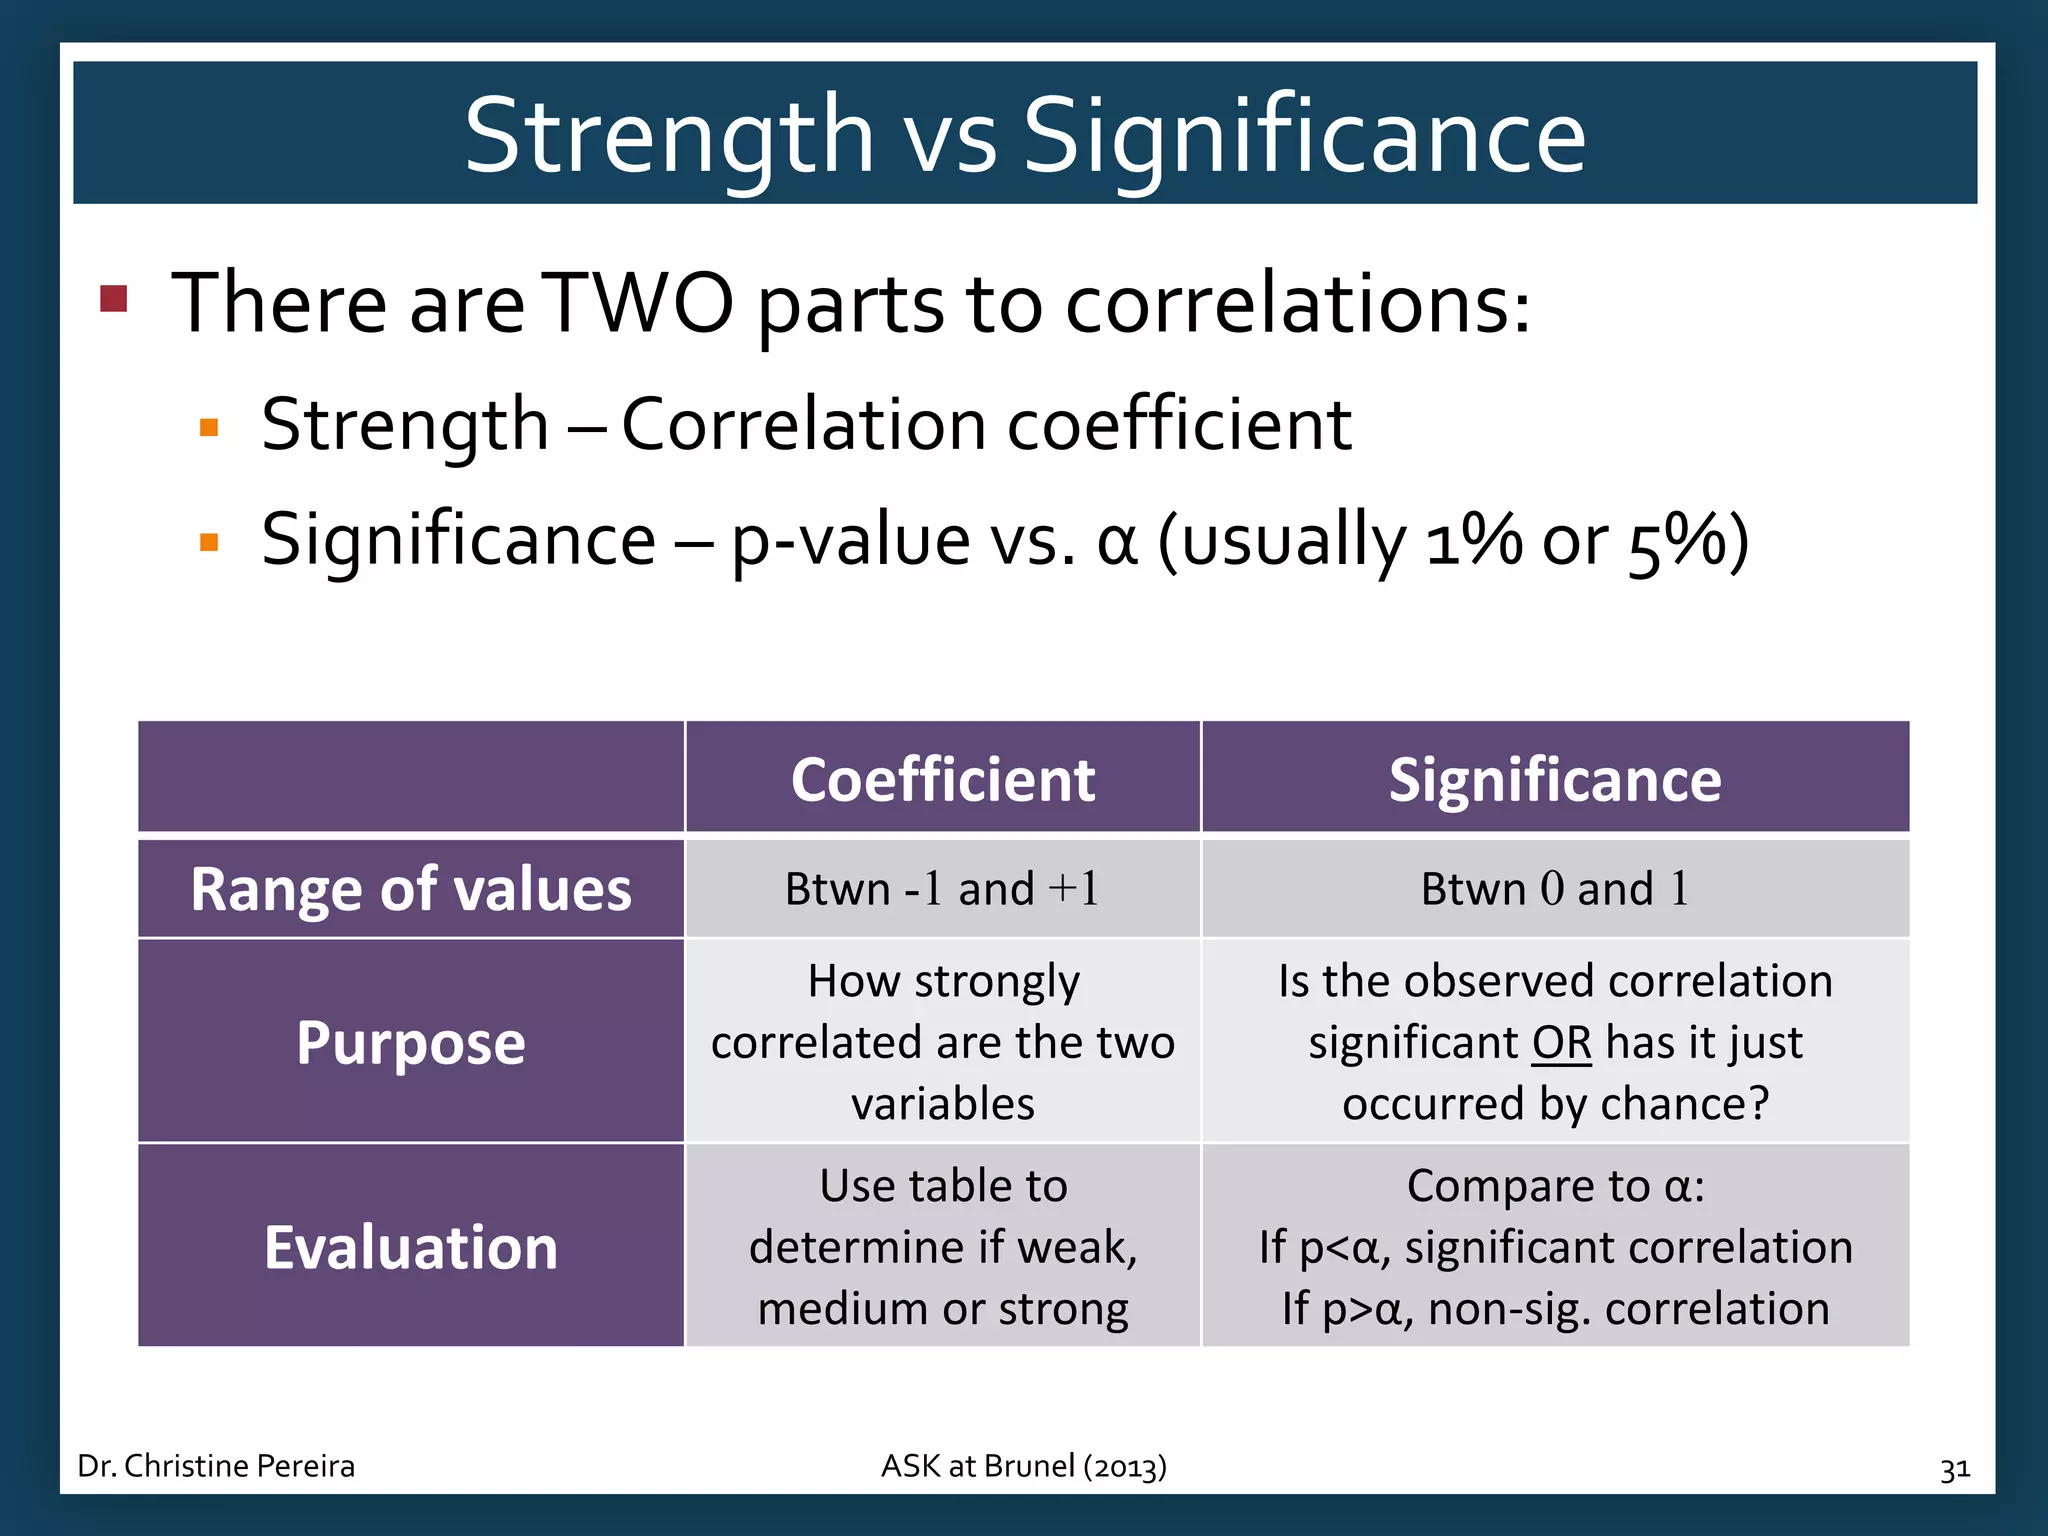
Explanation of correlation strength vs statistical significance and evaluation techniques based on p-values.
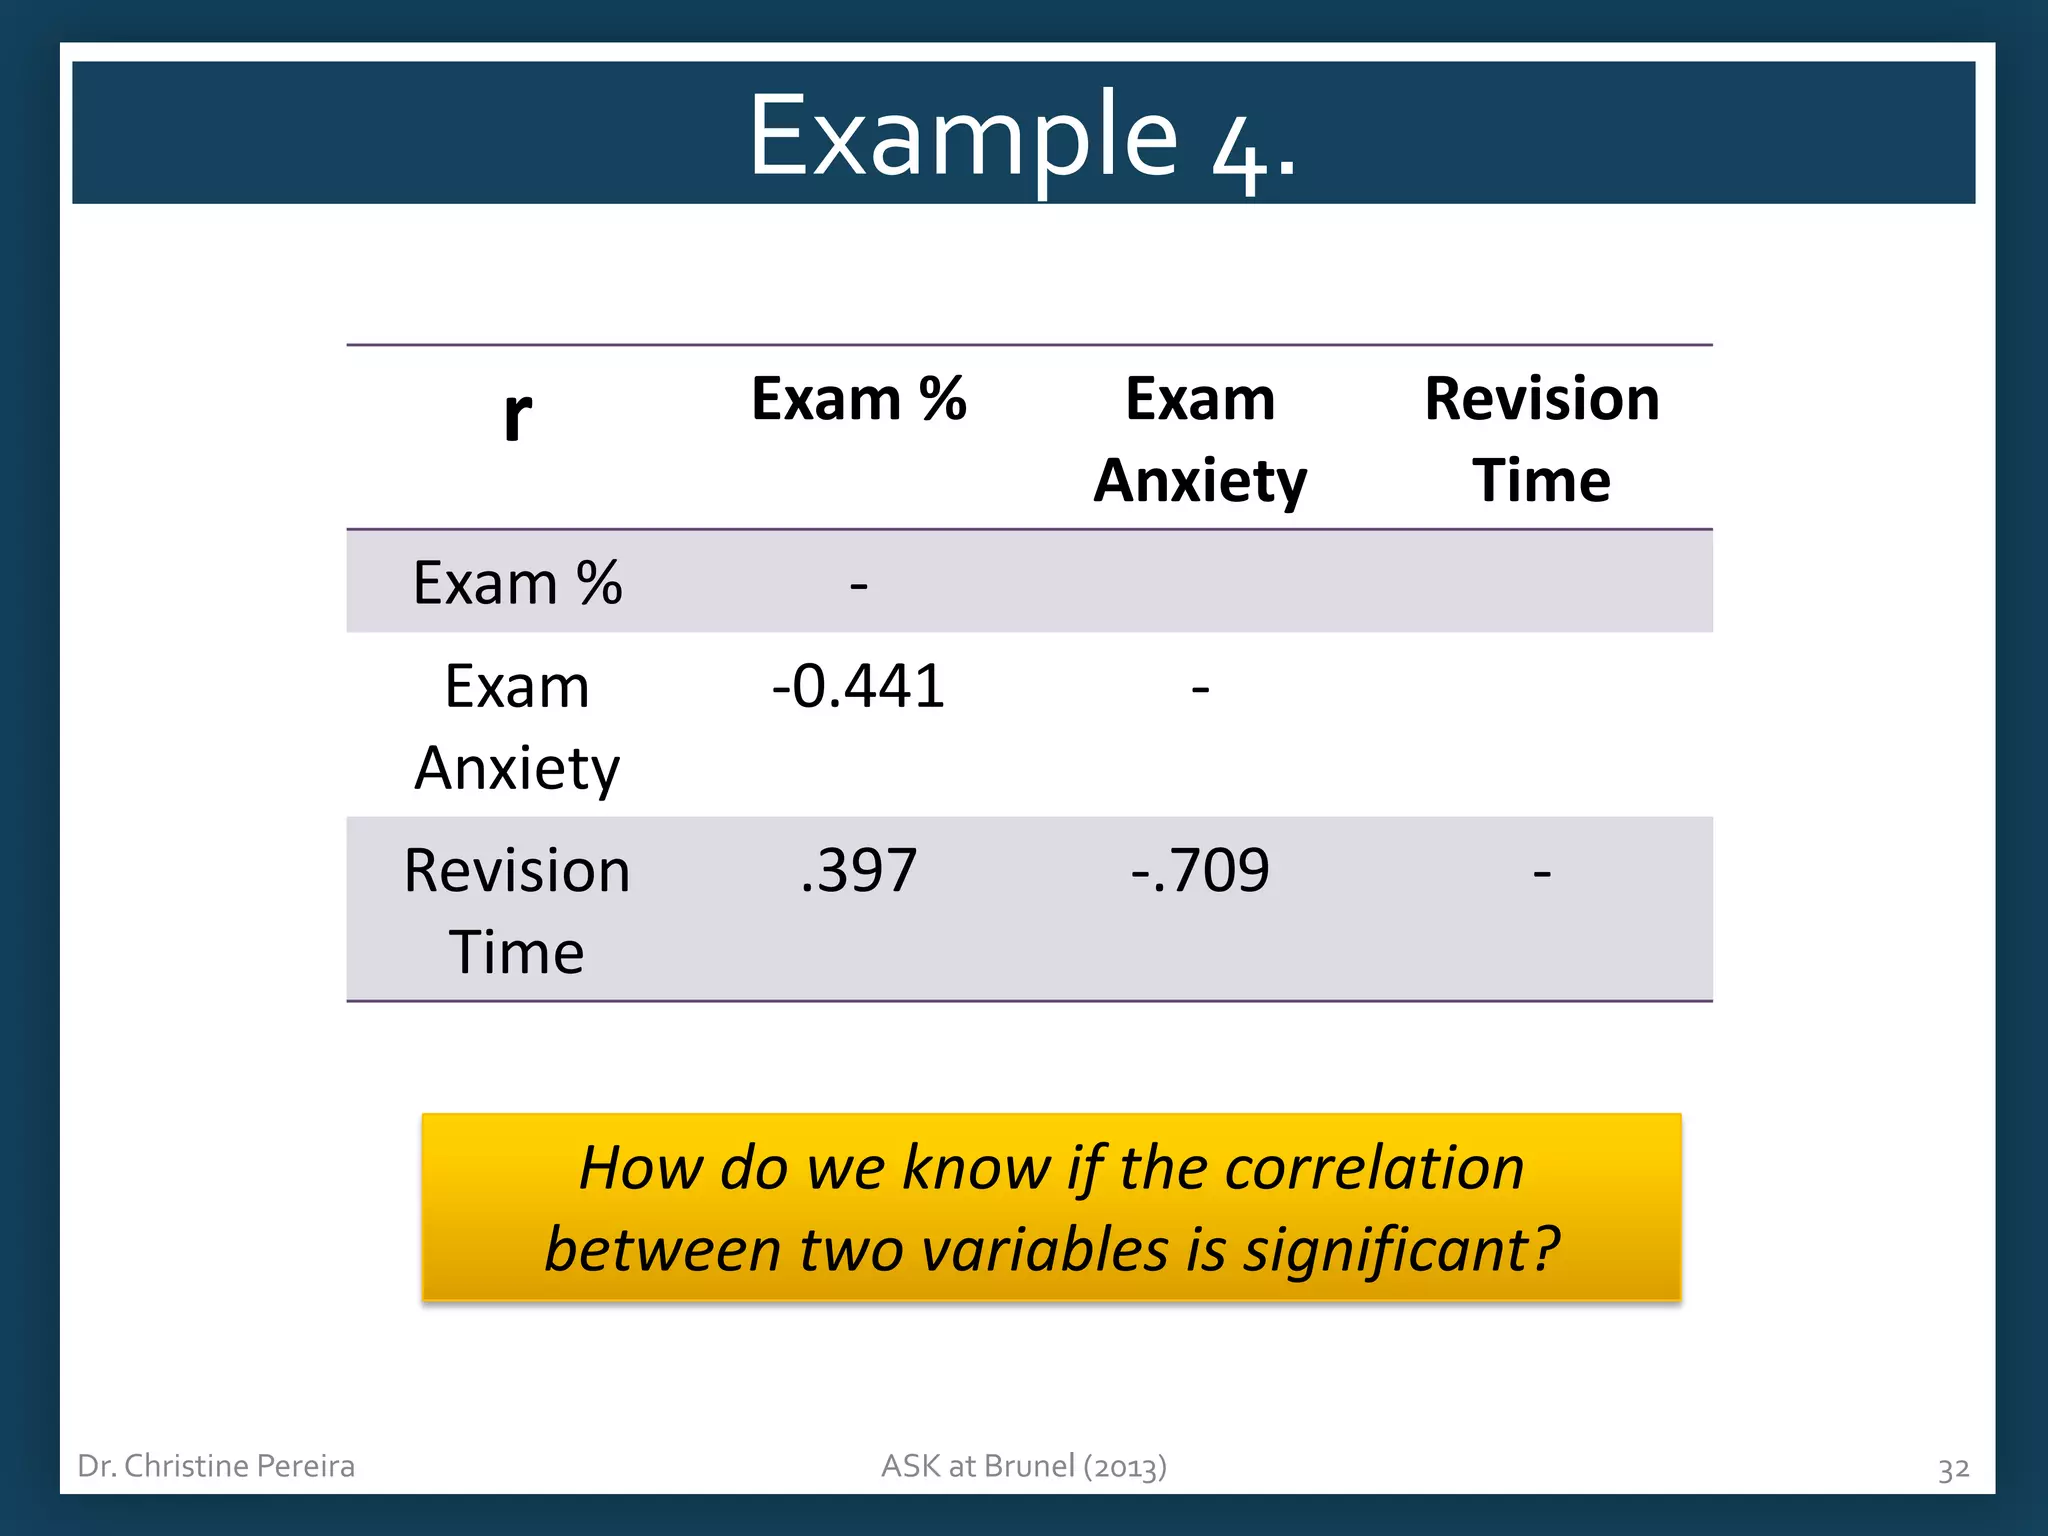
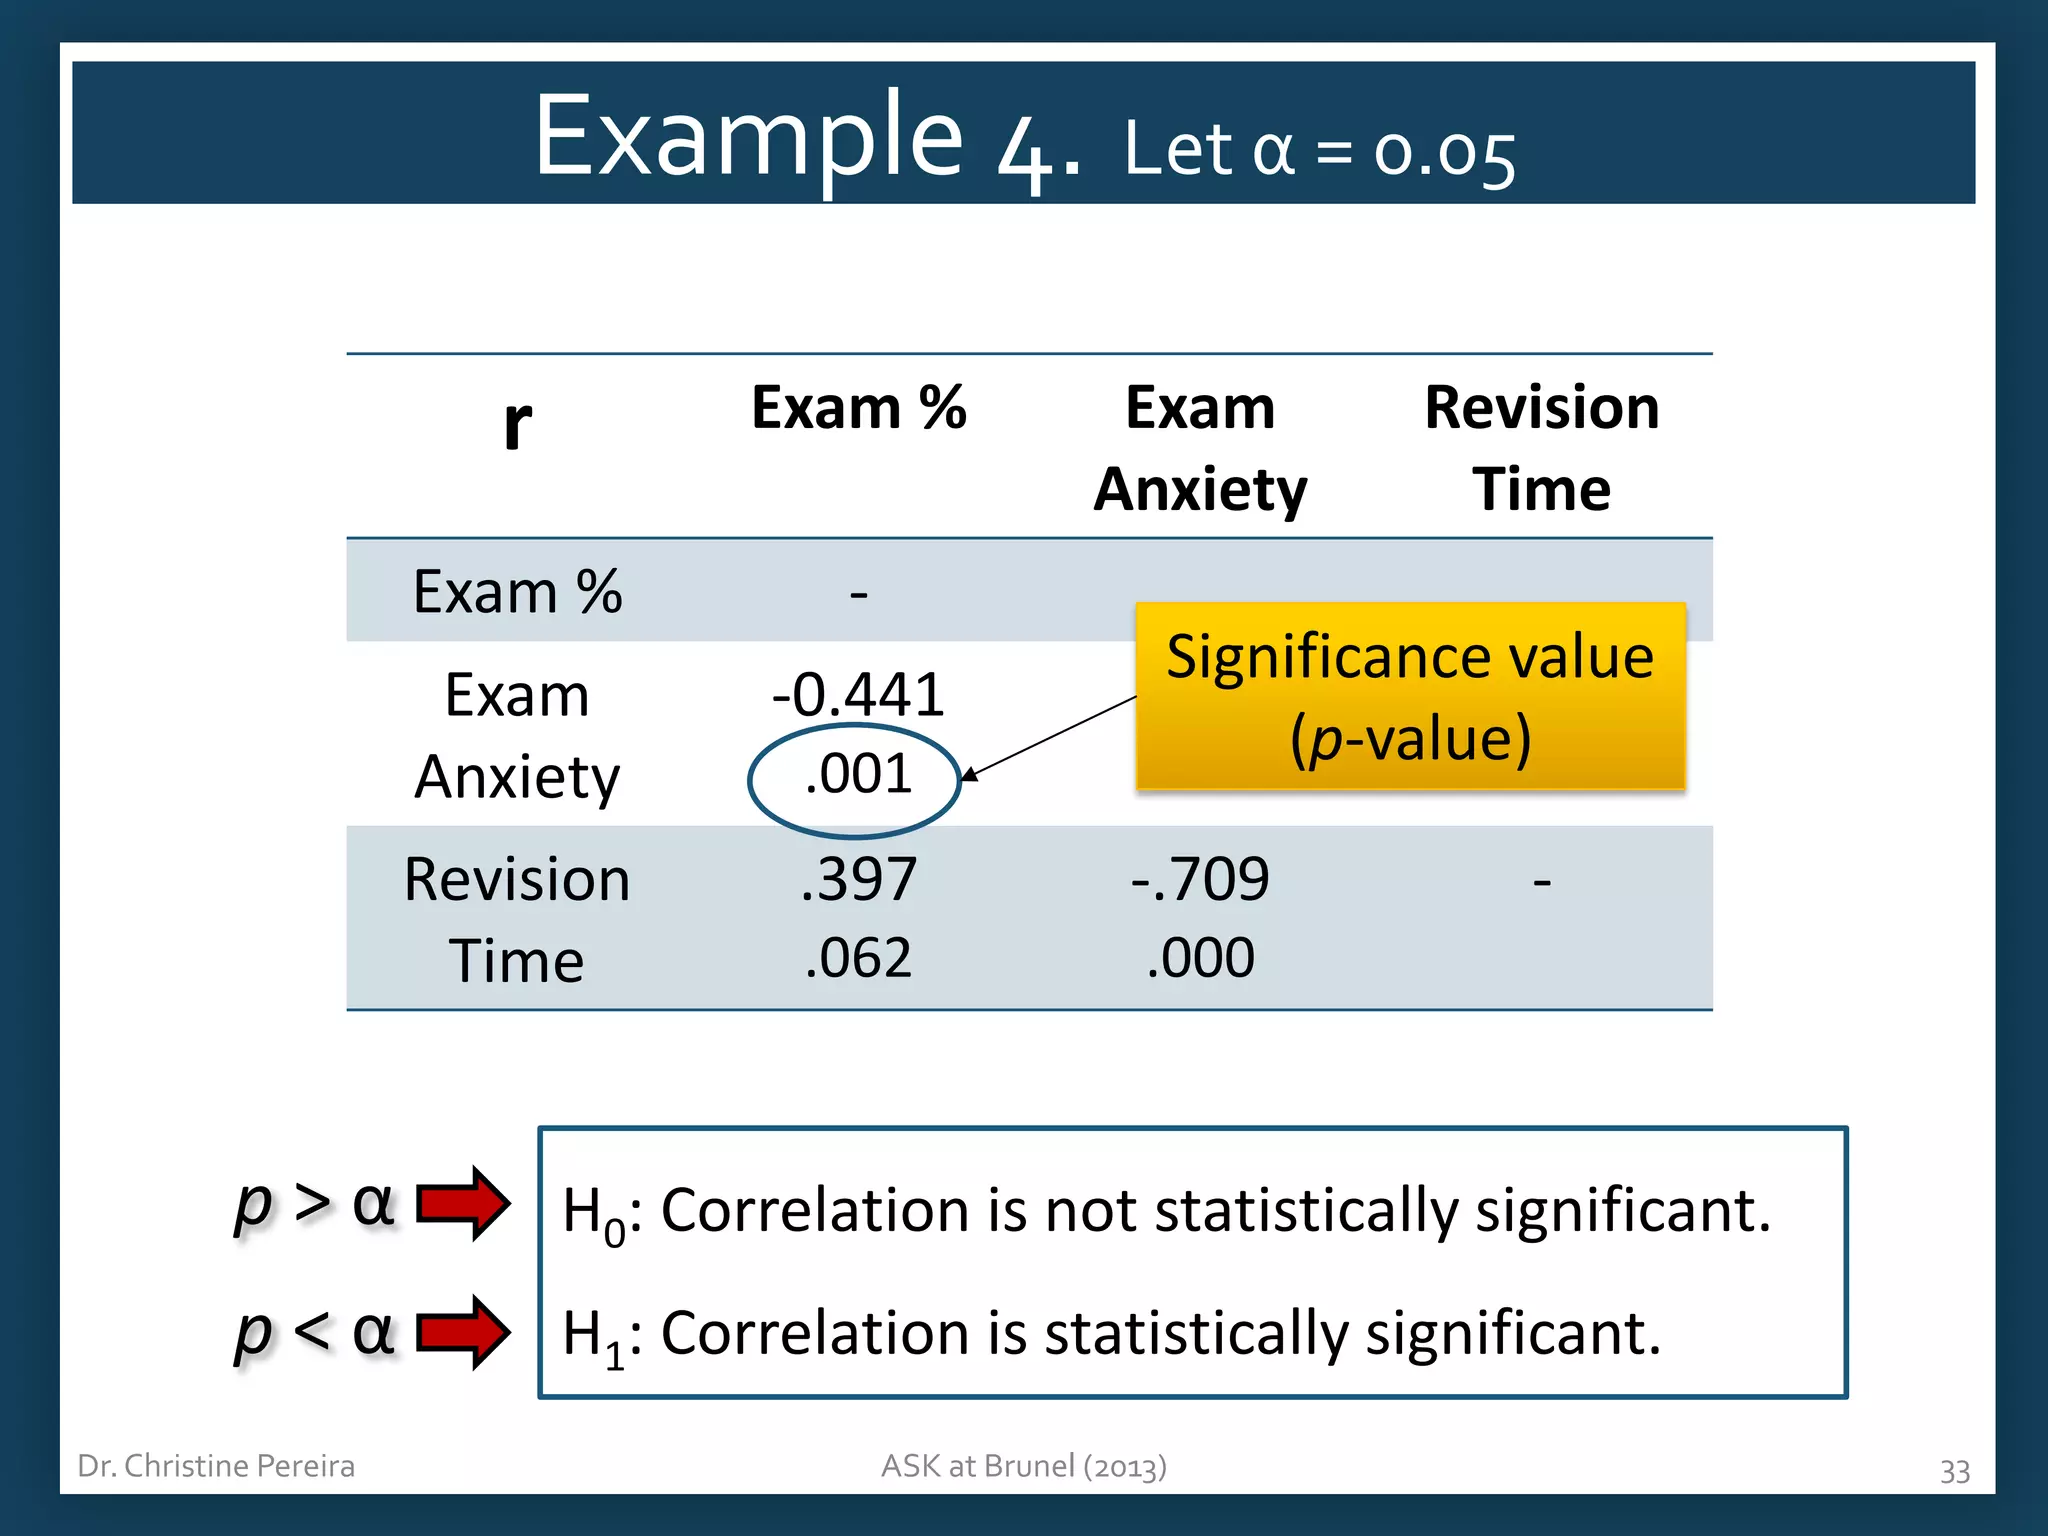
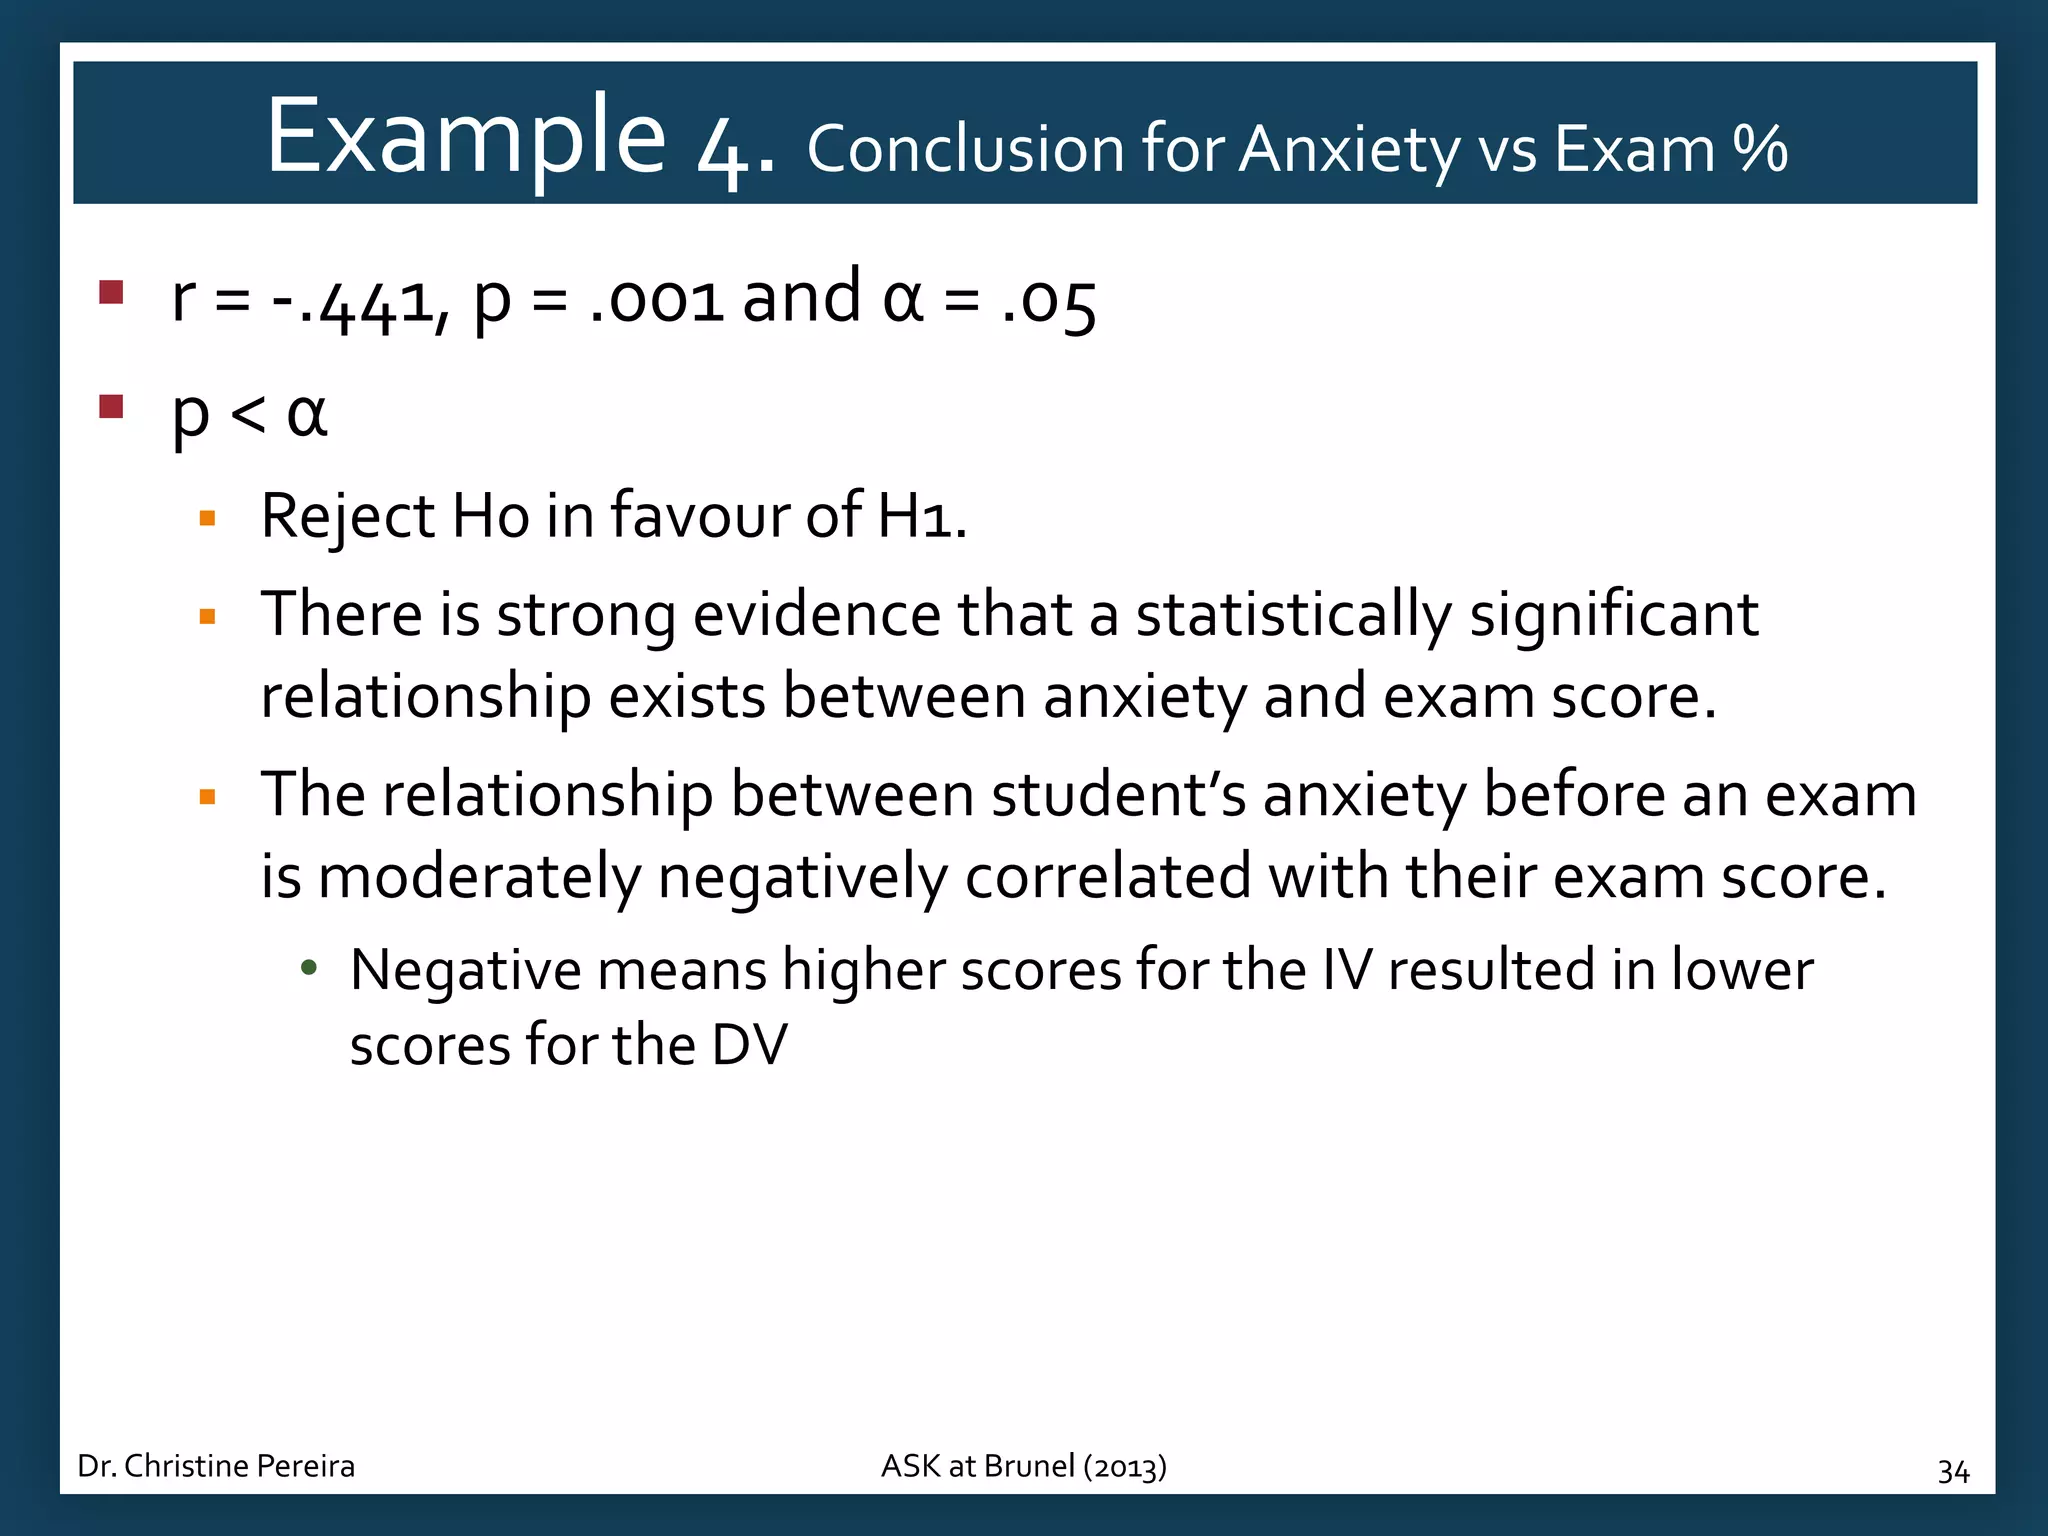
Example analysis on the correlation between anxiety and exam scores emphasizing statistical significance.
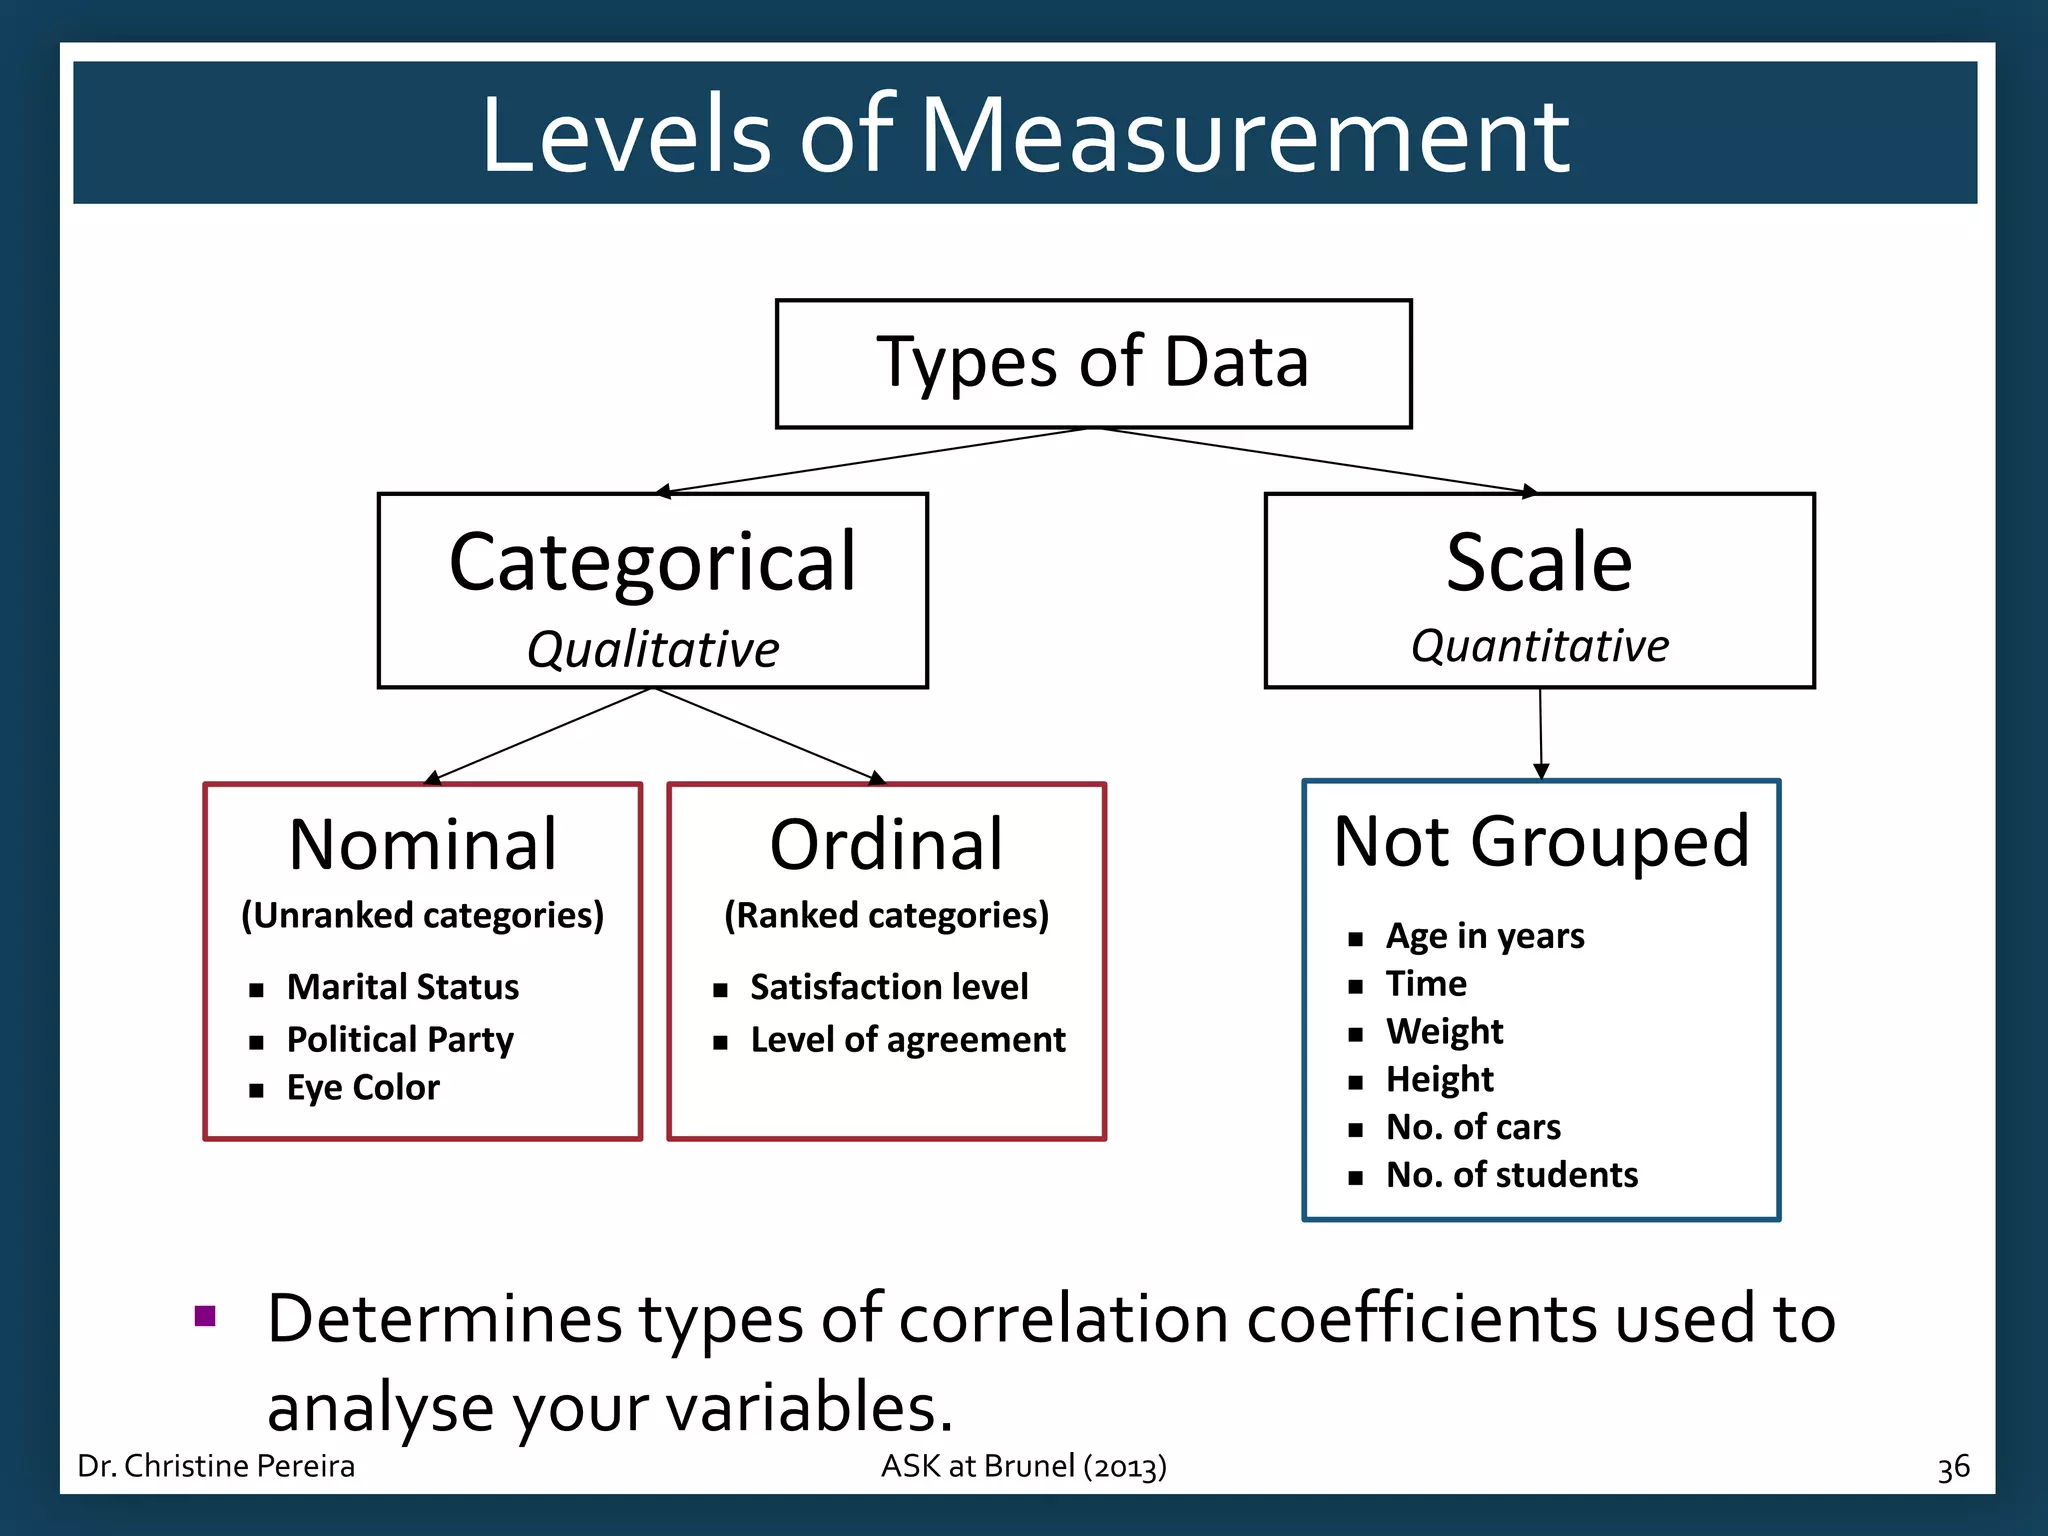
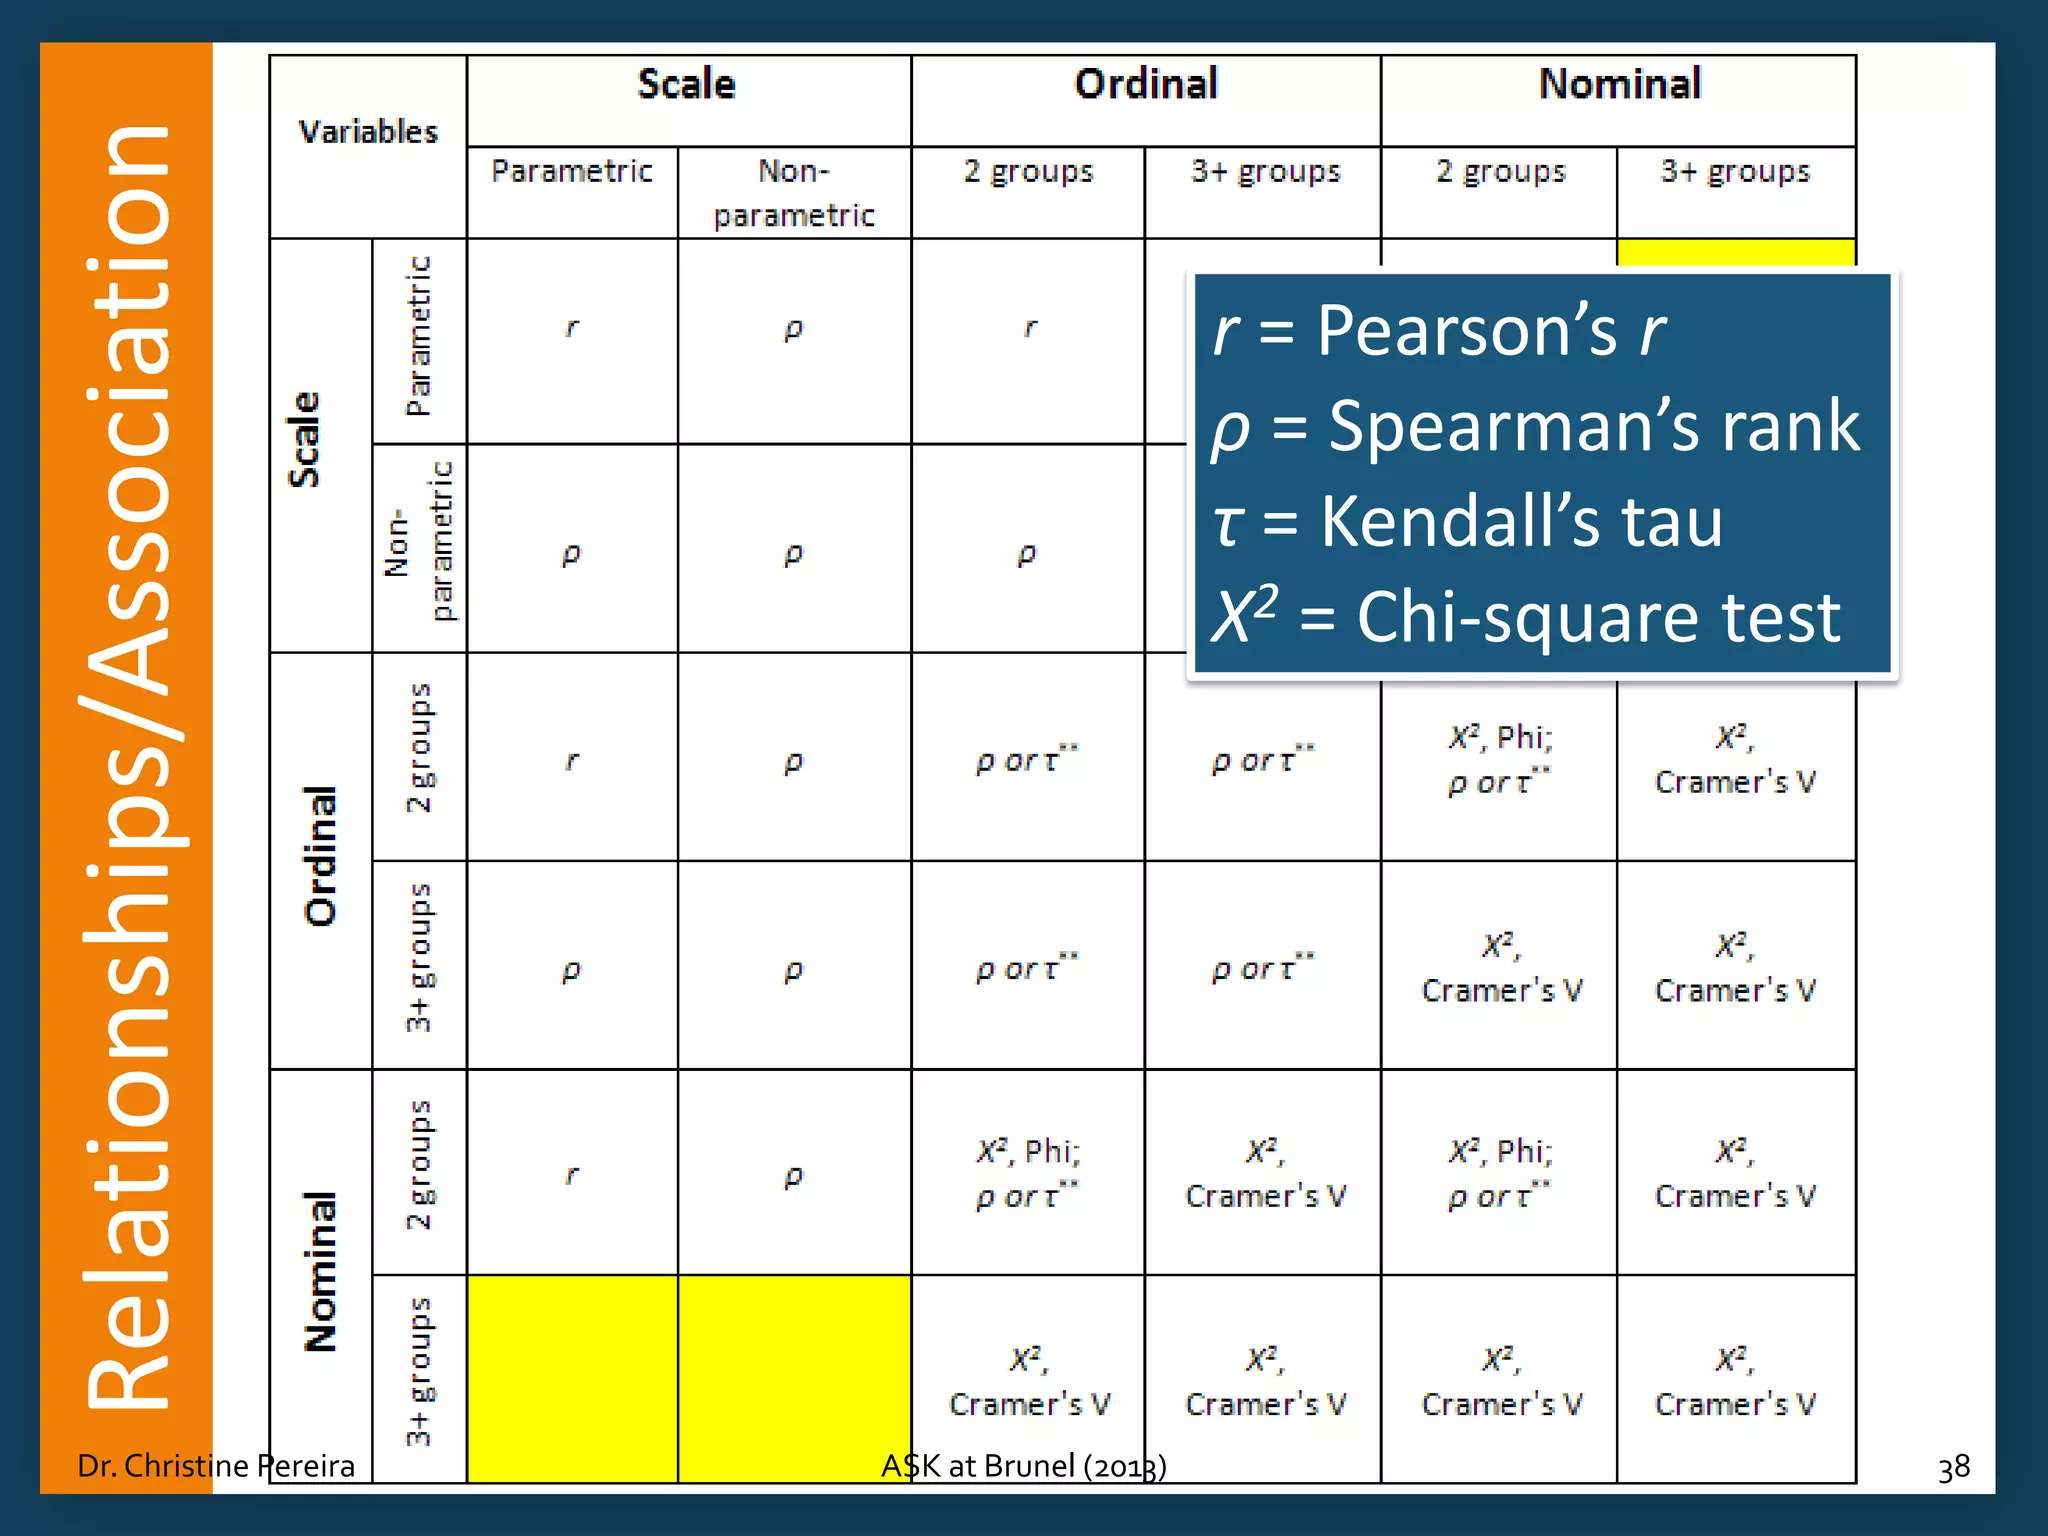
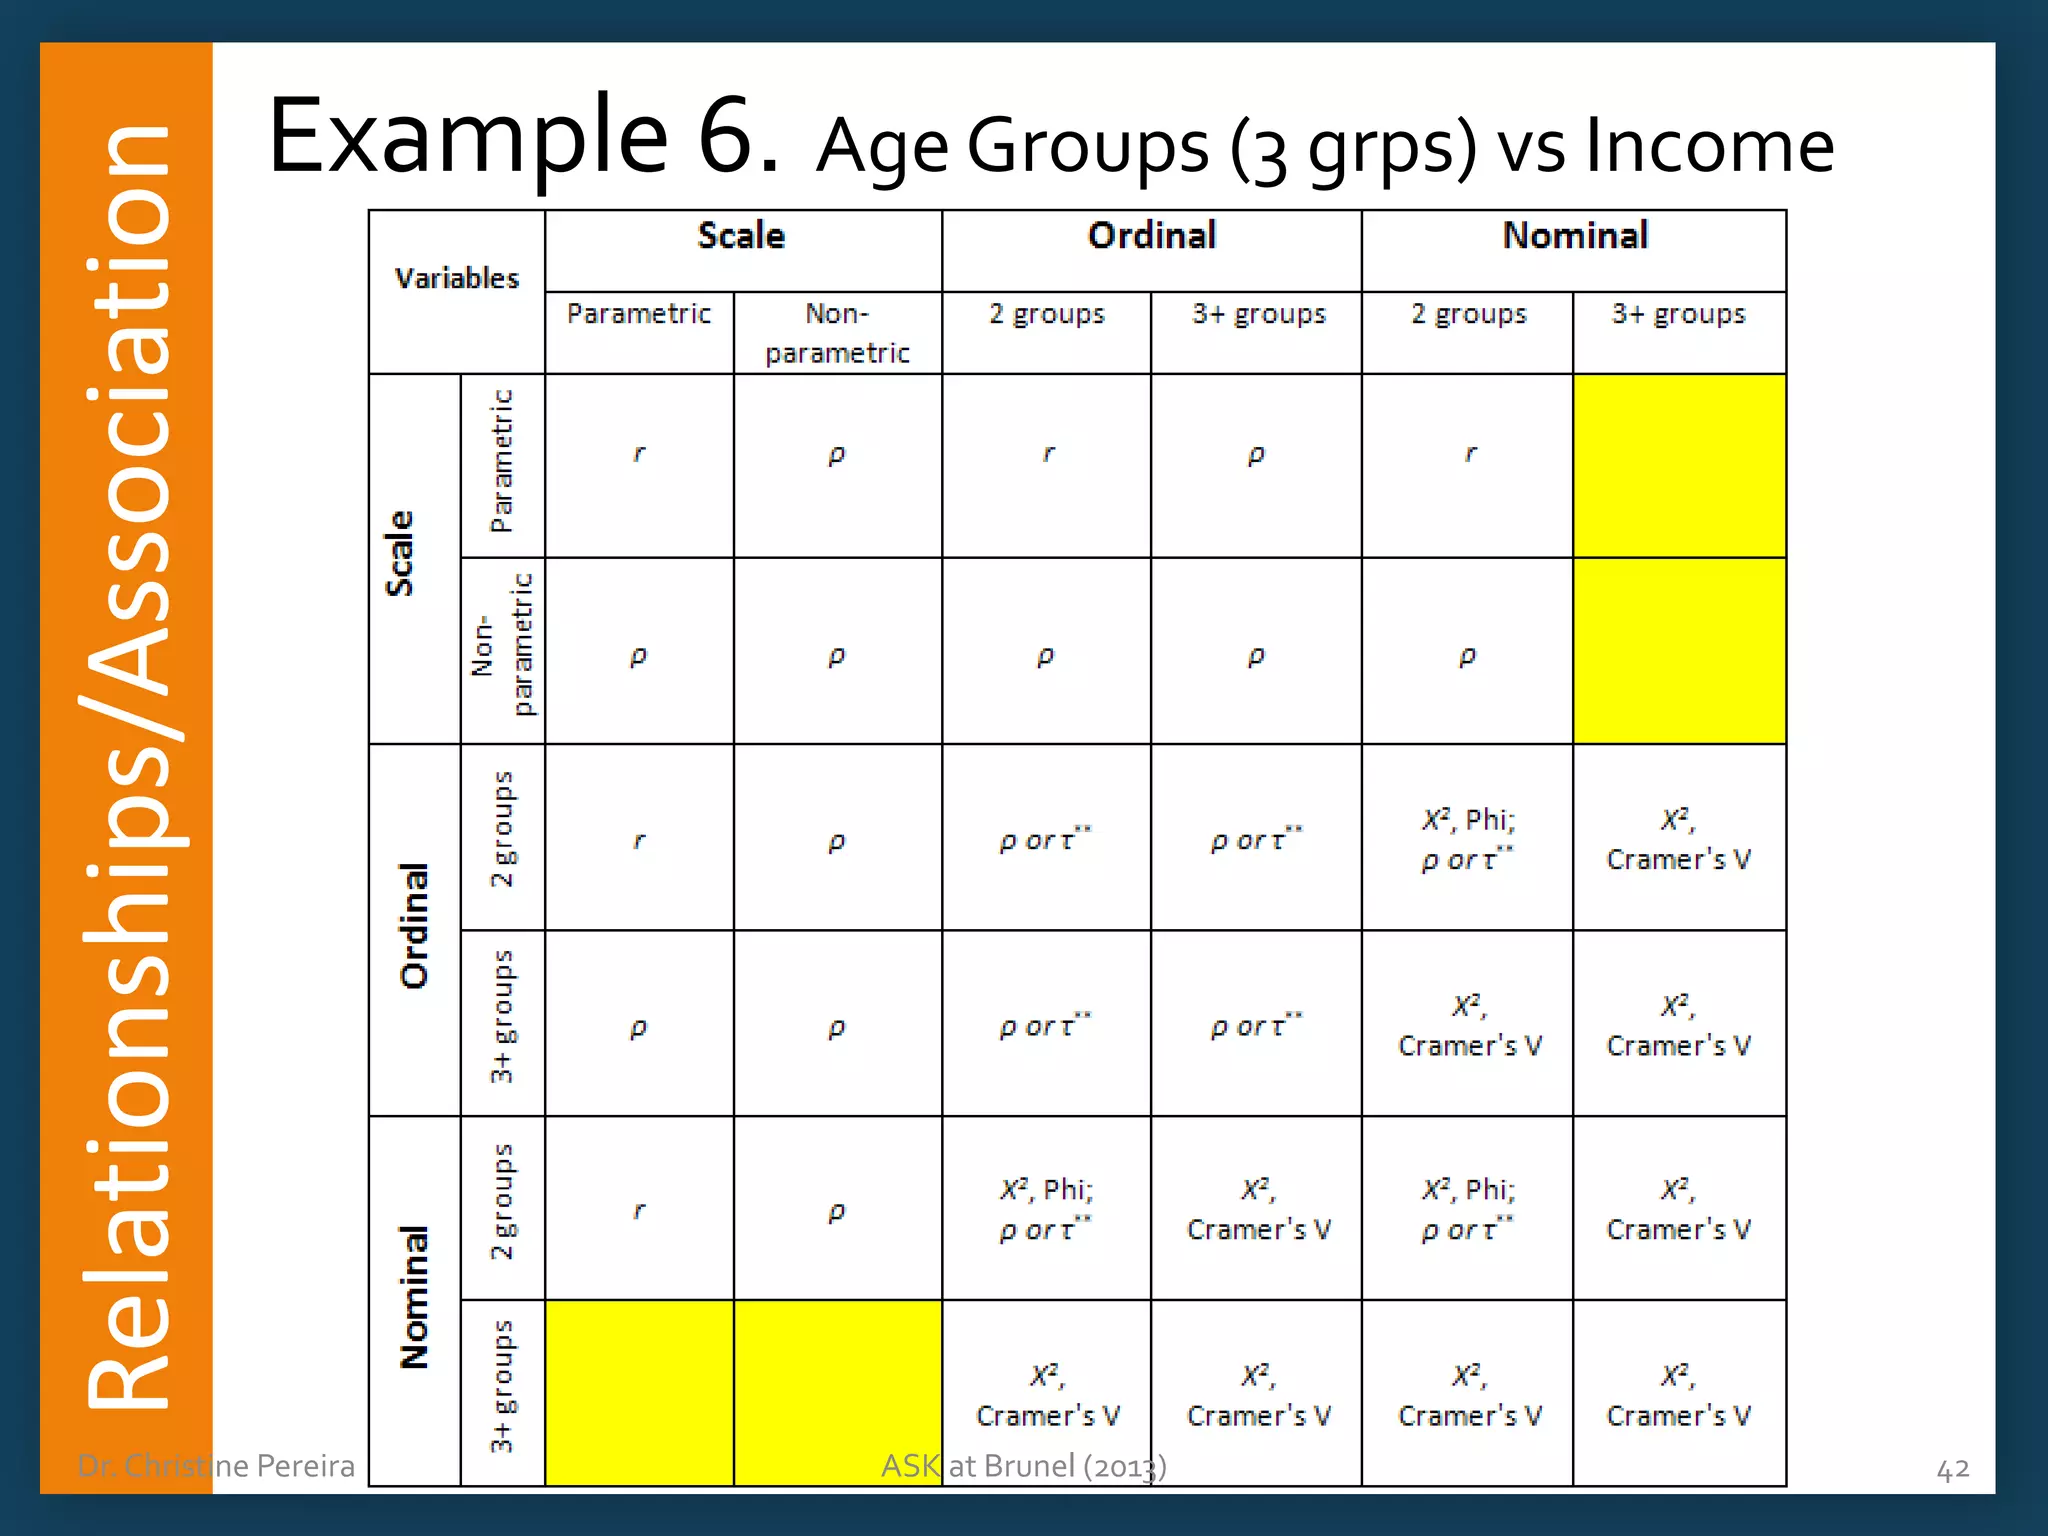
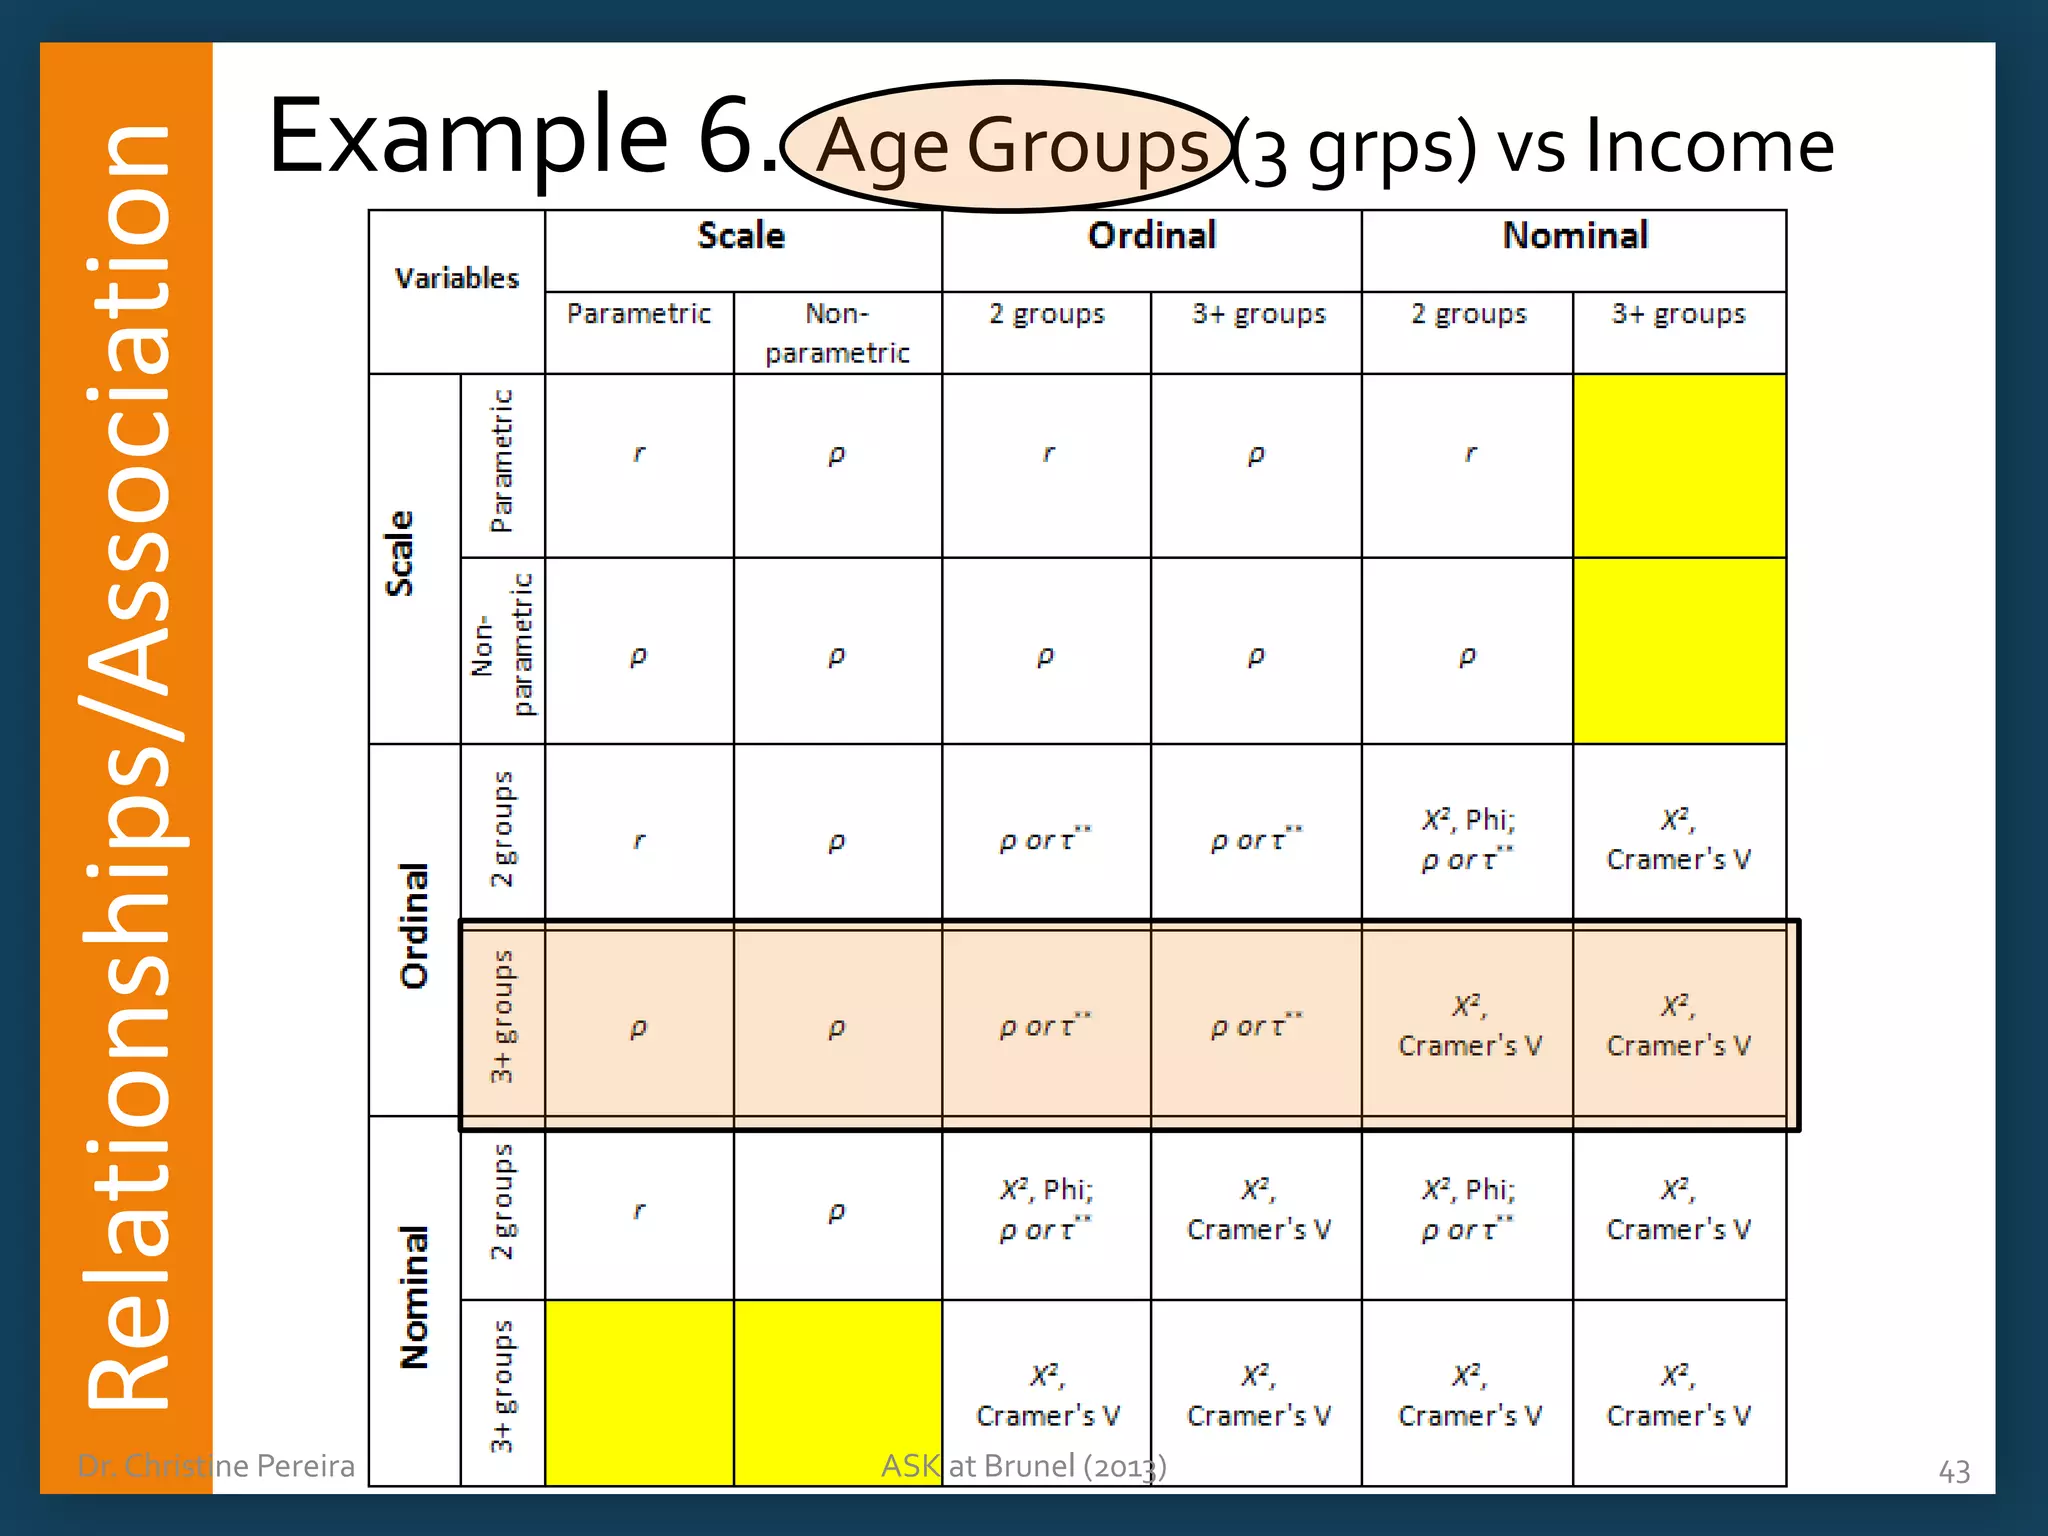
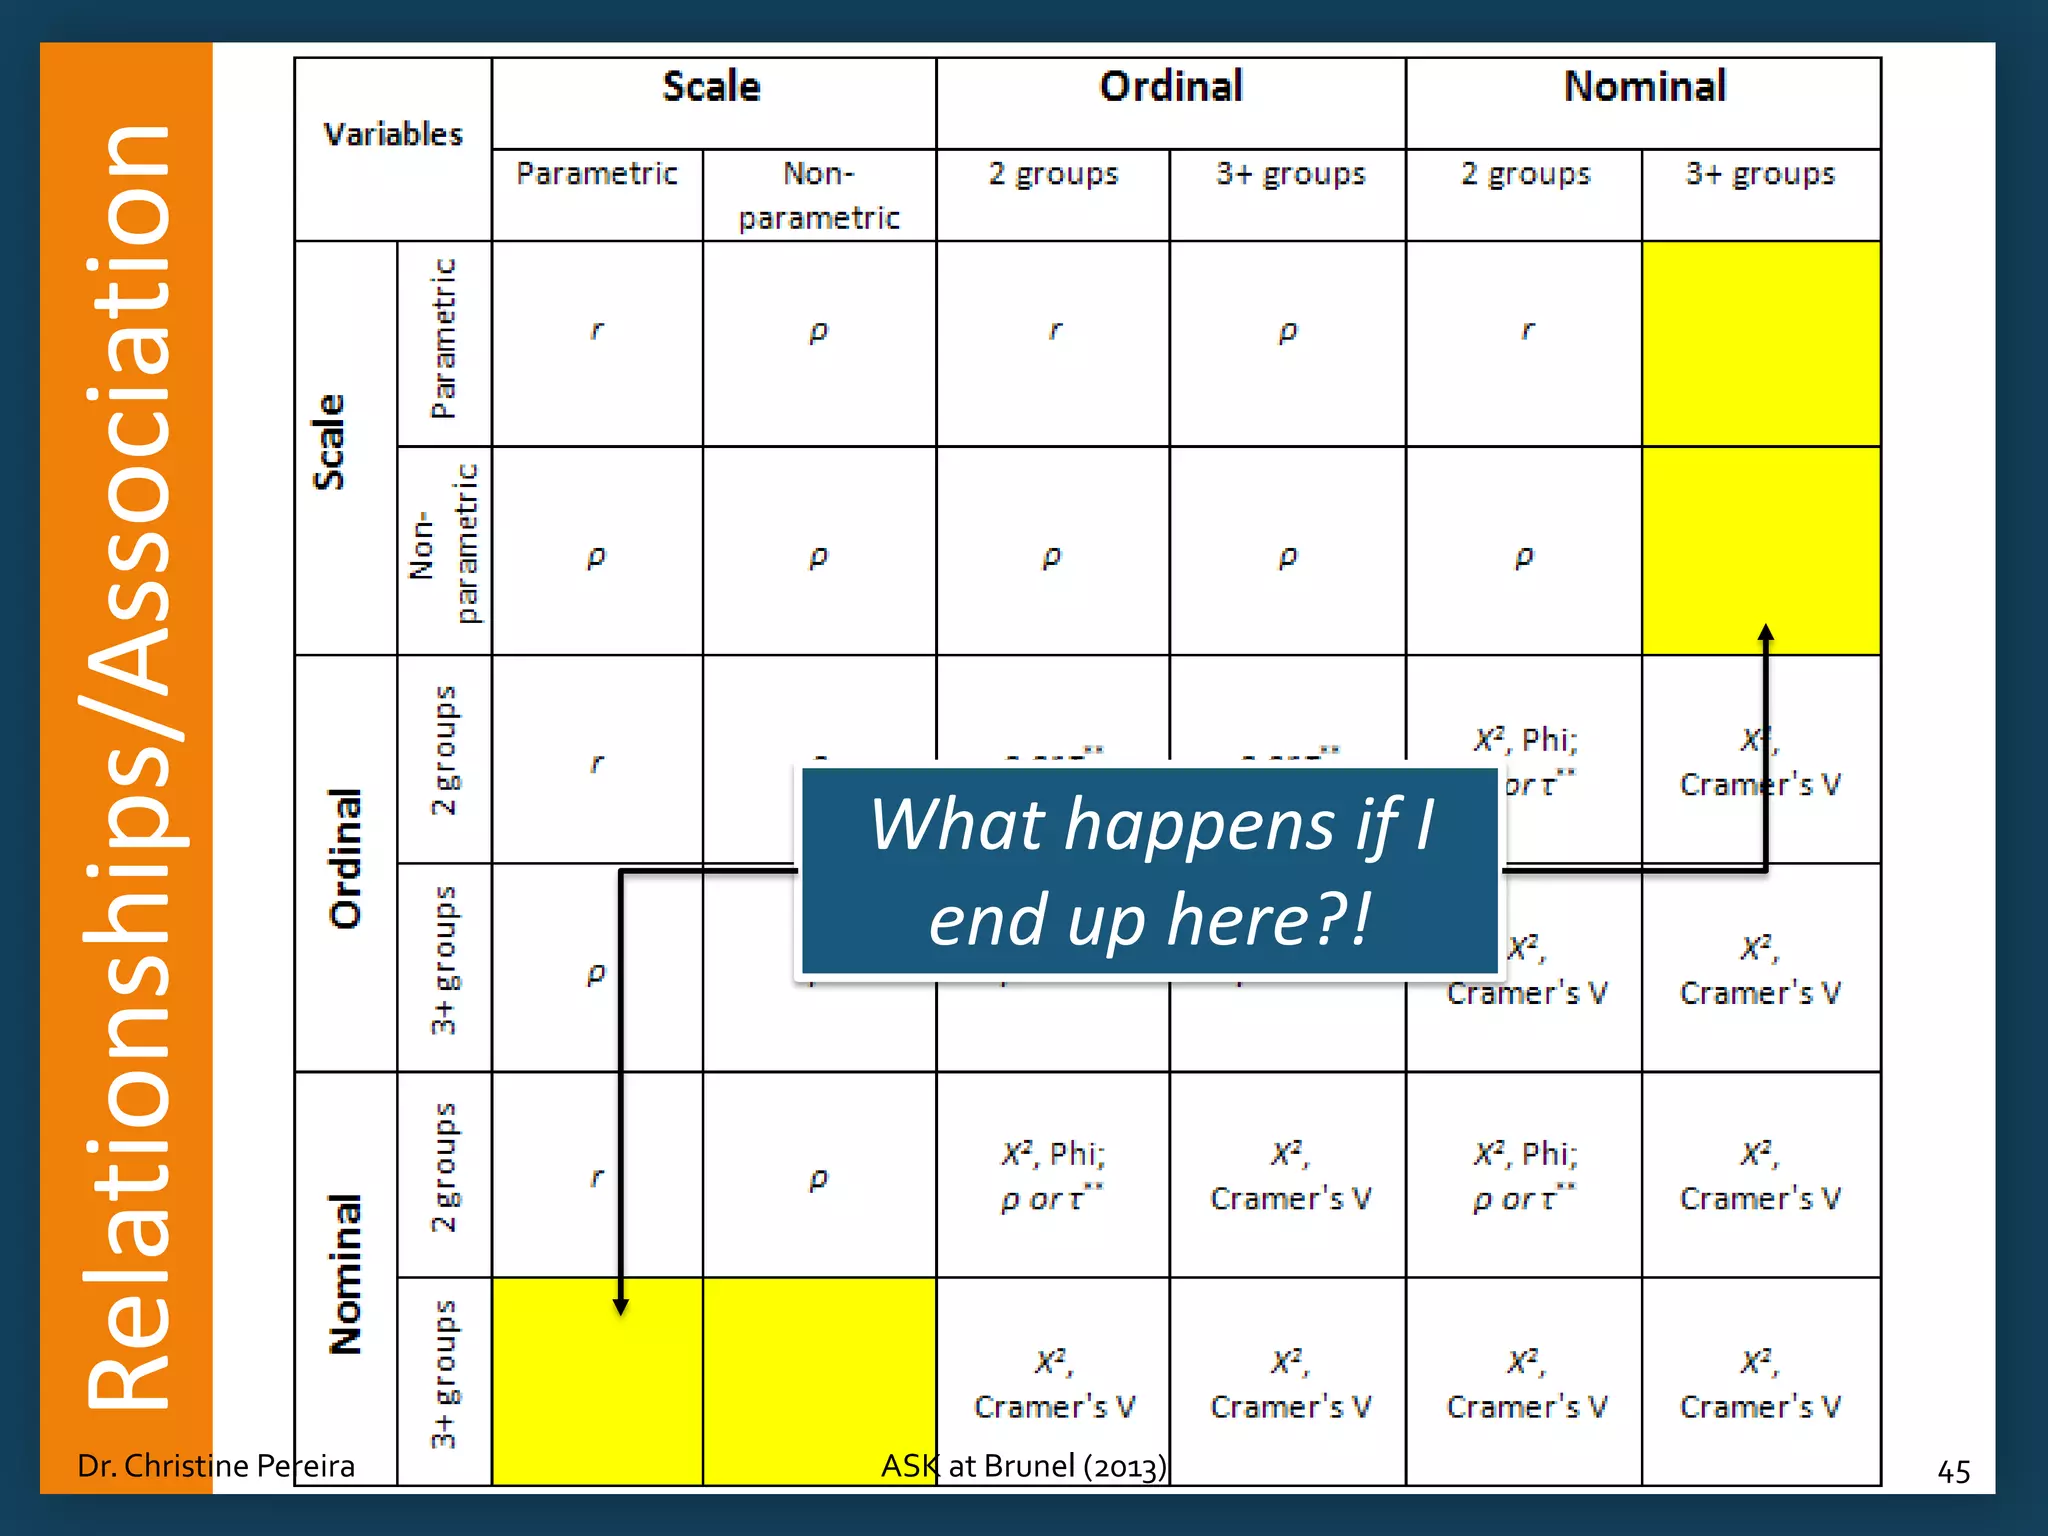
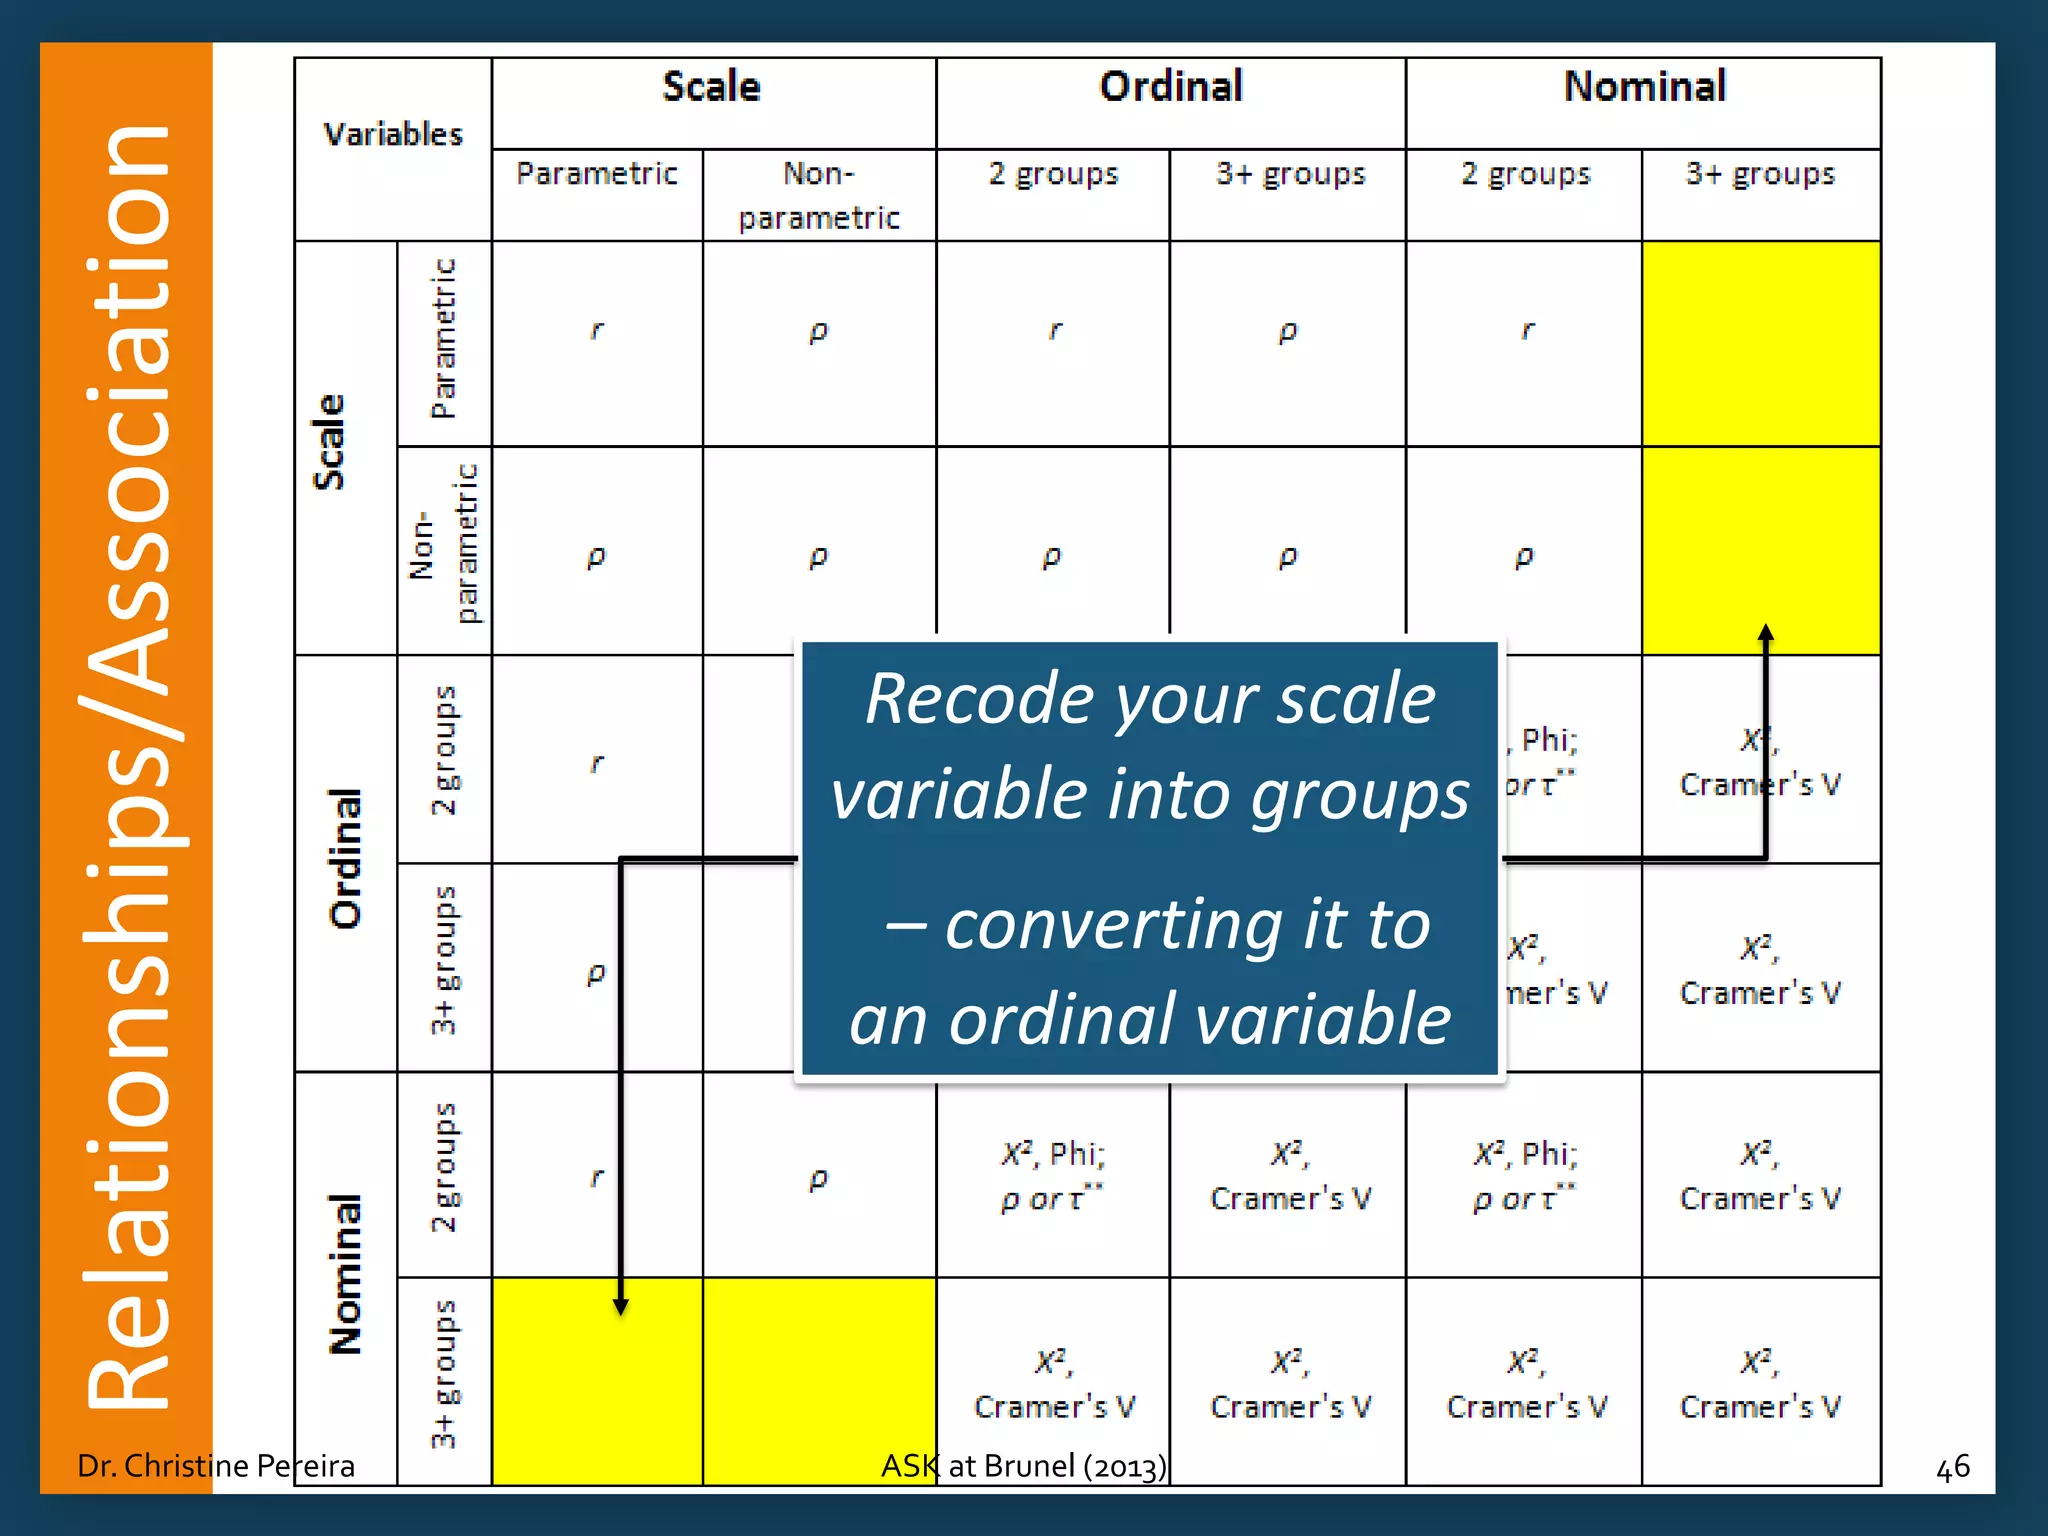
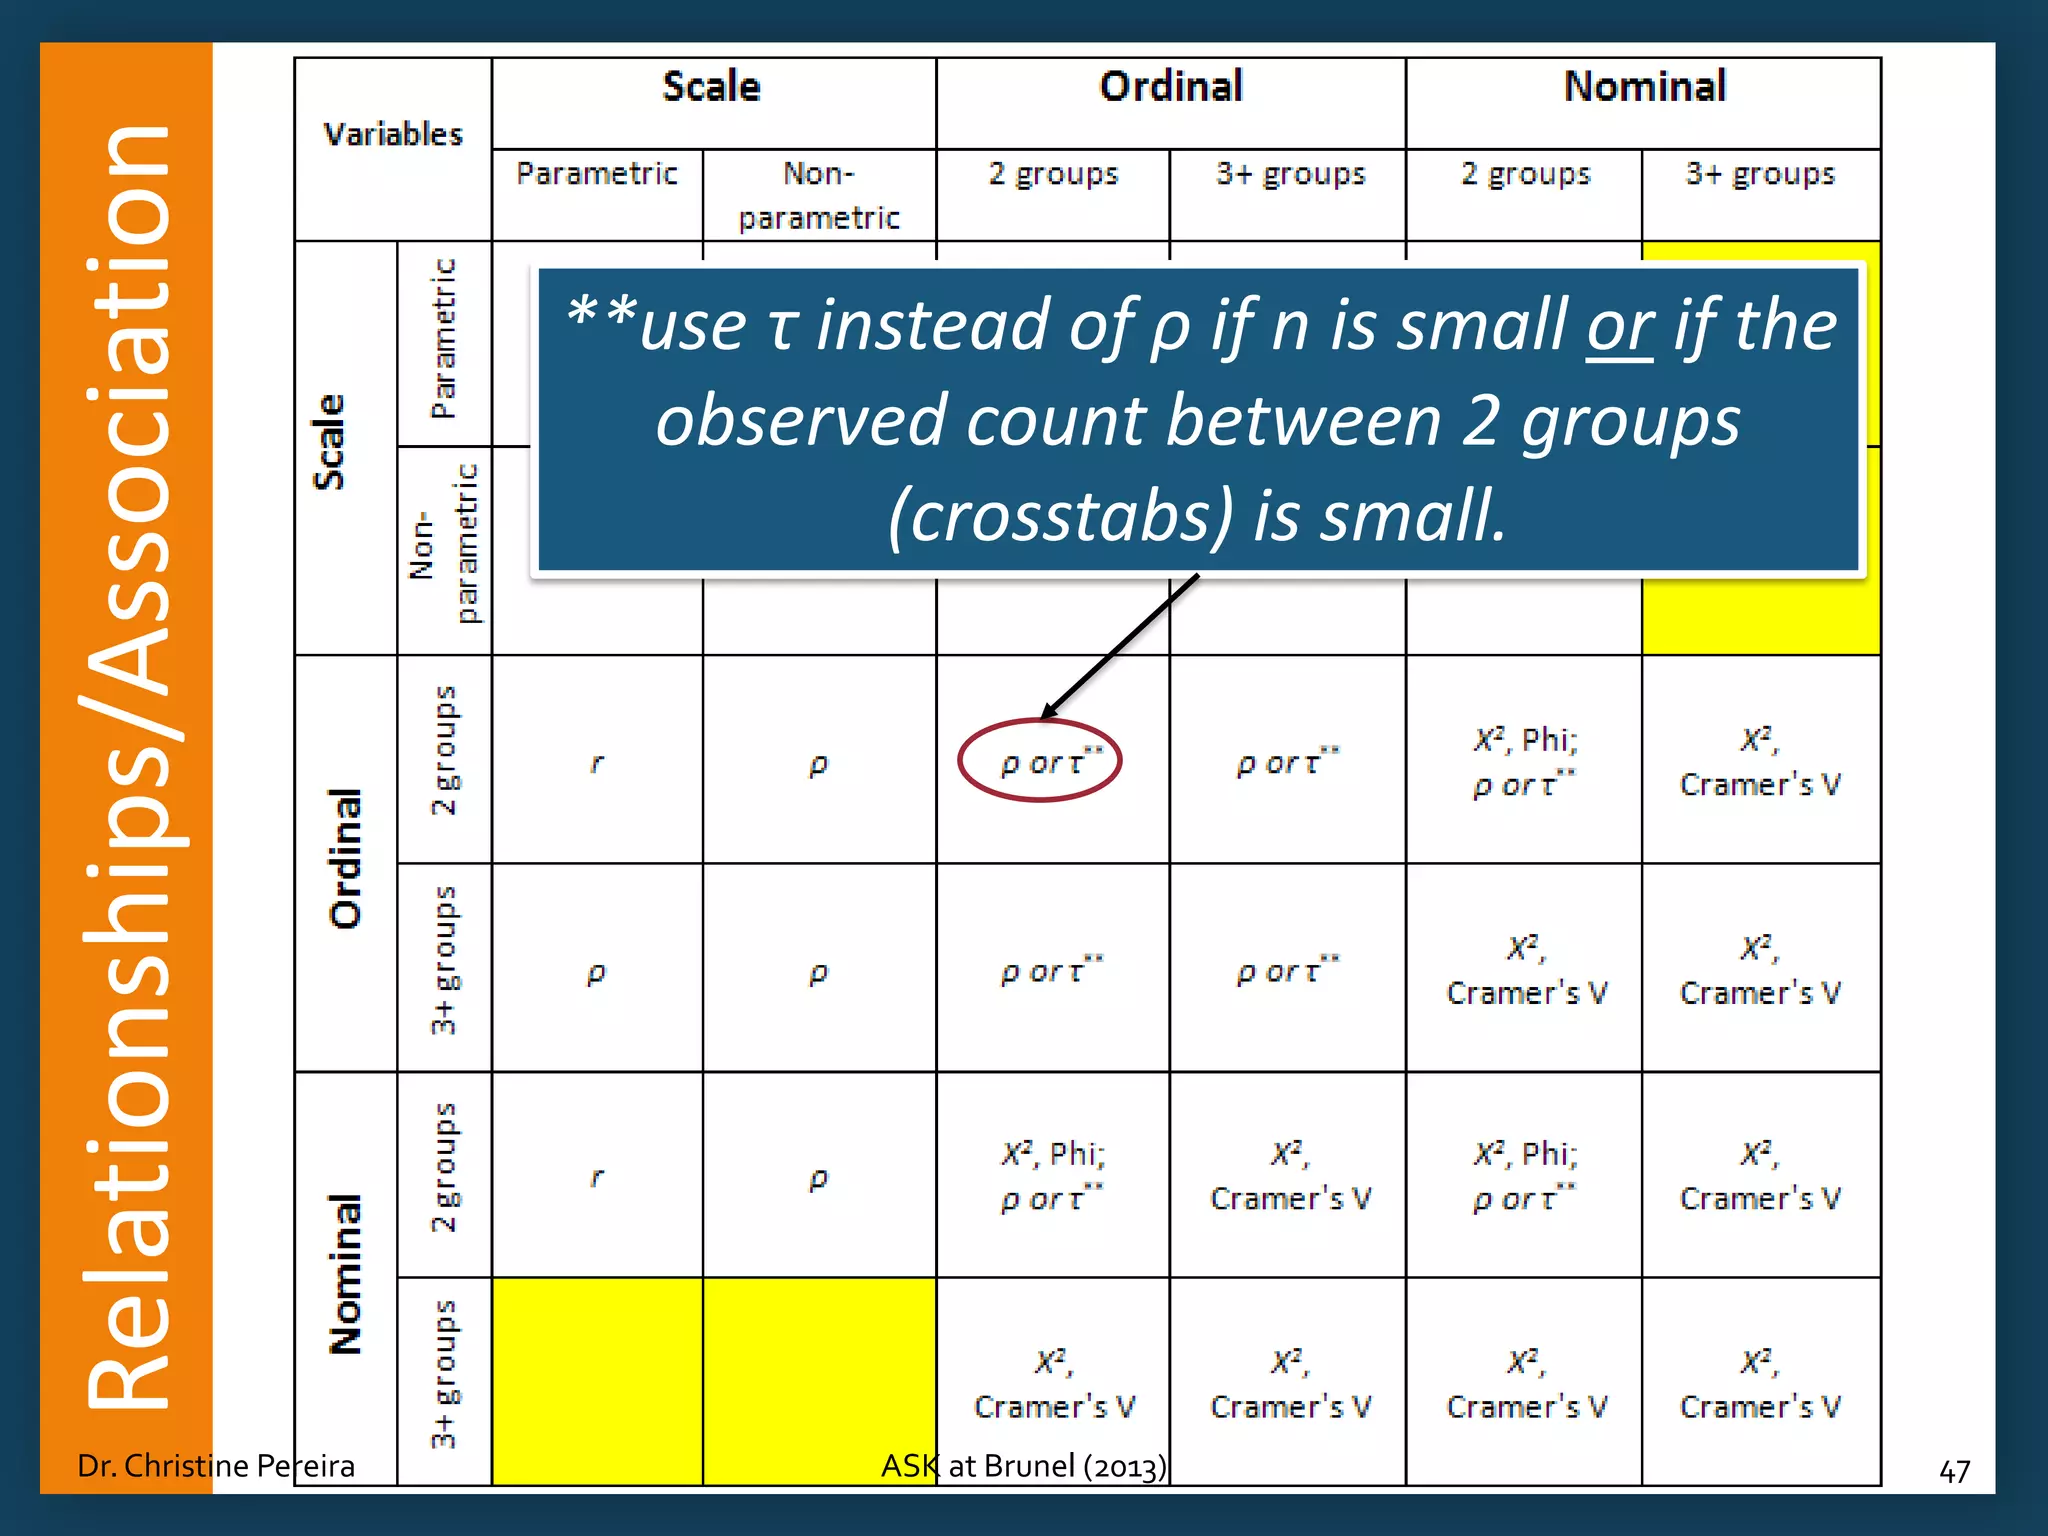
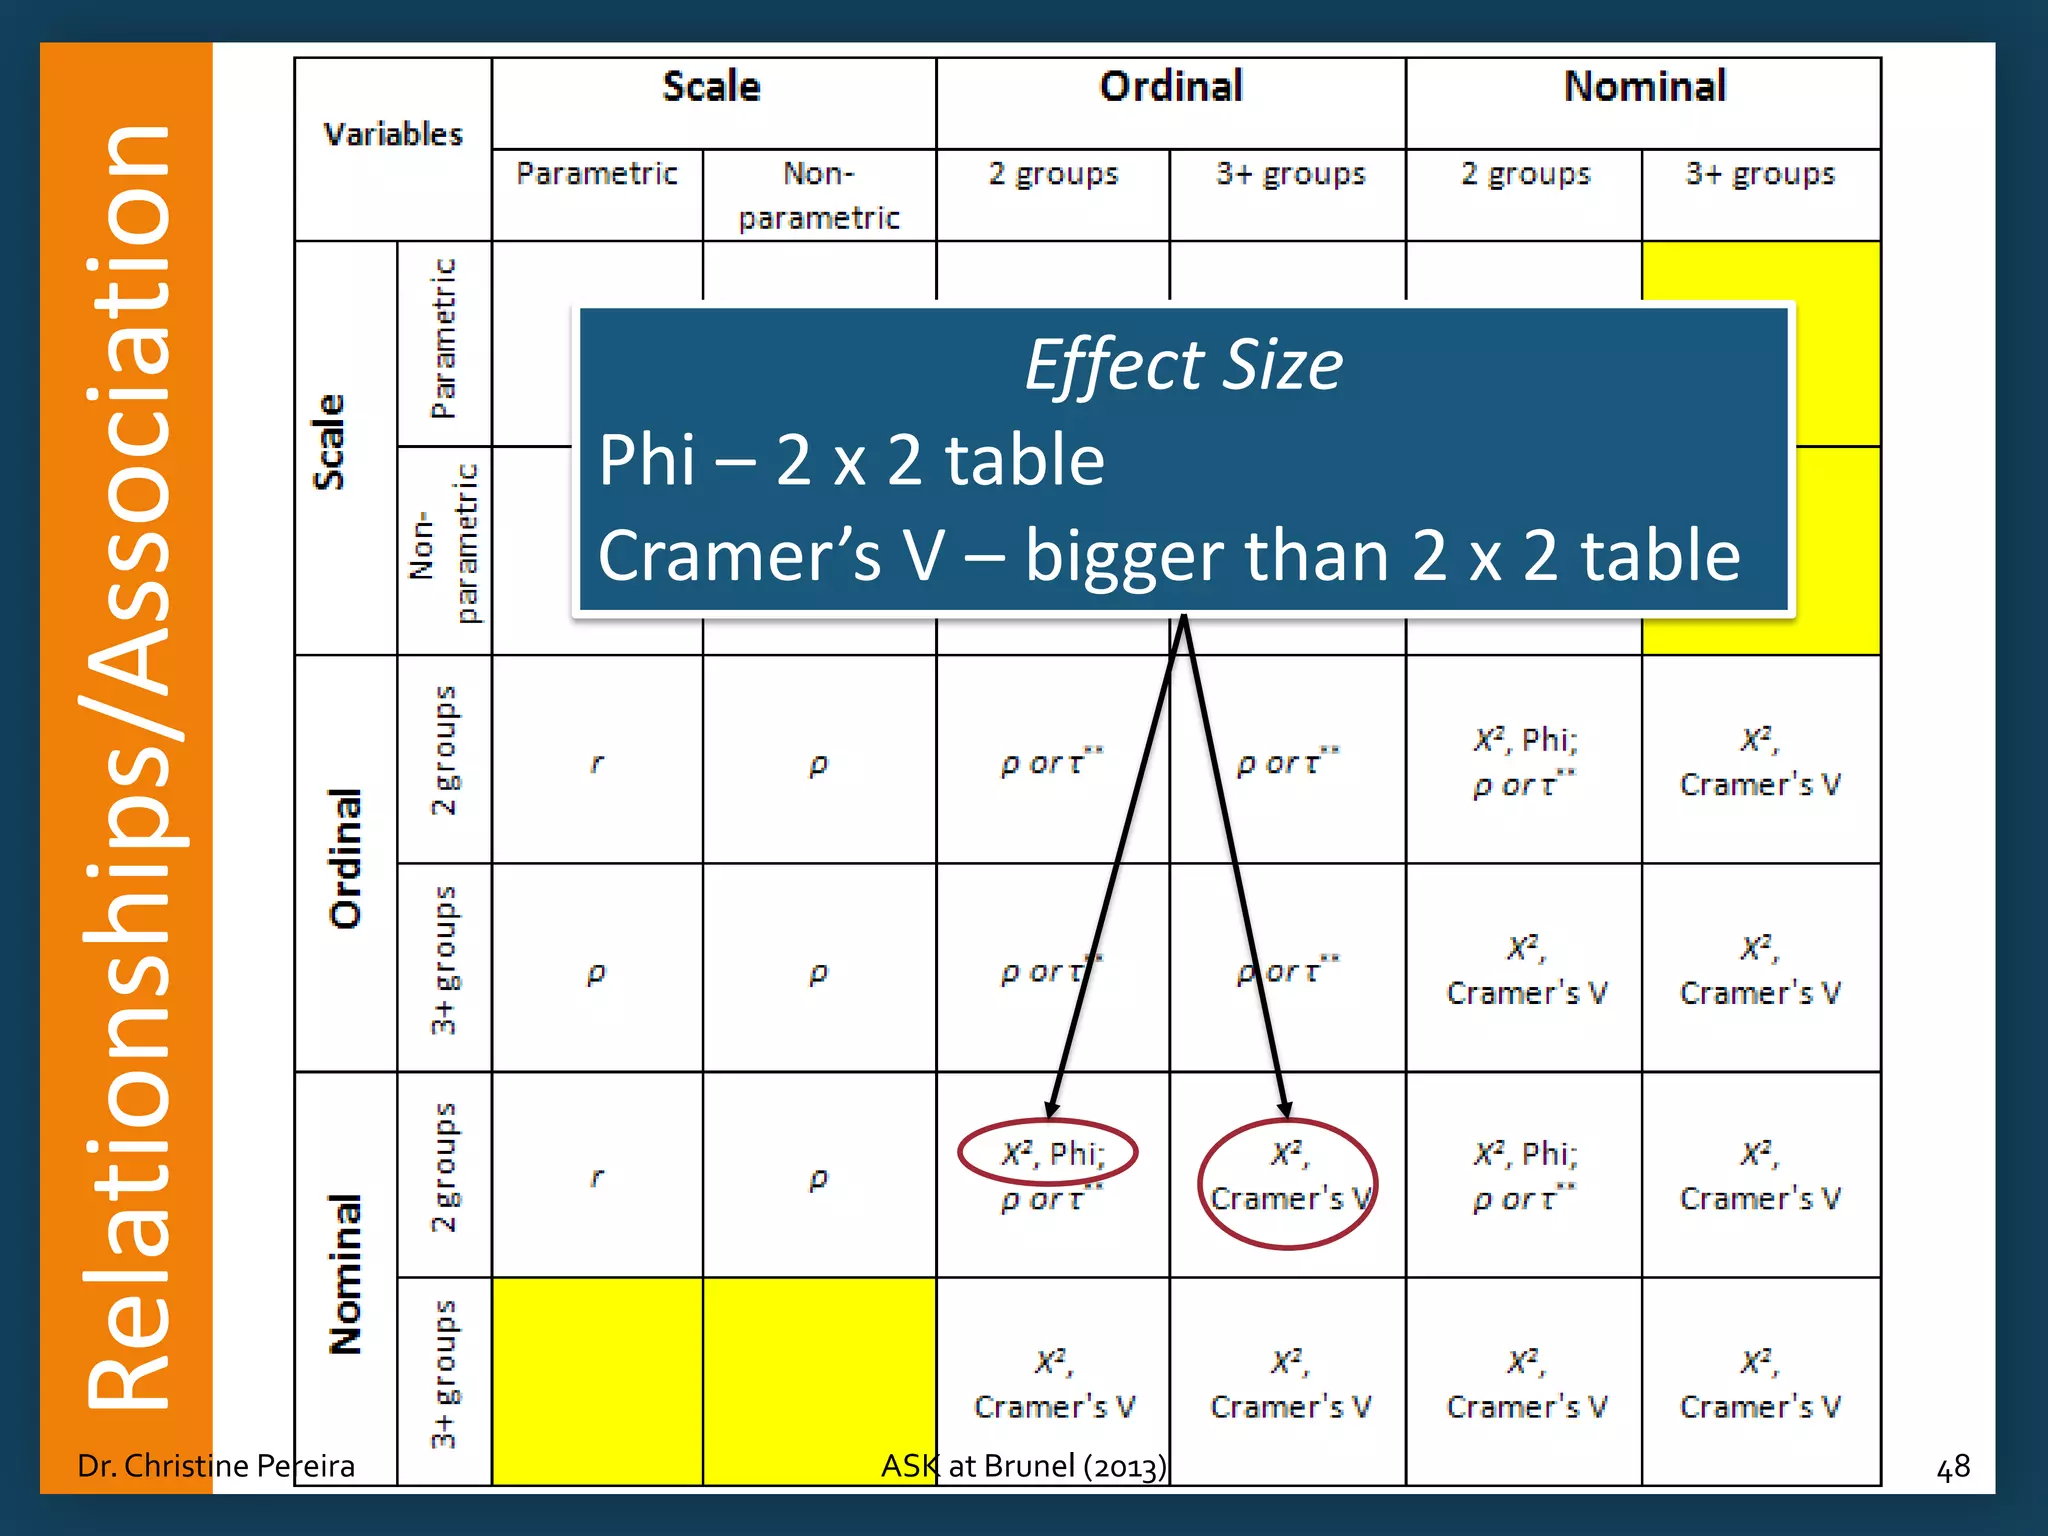
Classification of data types (categorical vs. scale); implication of measurement types for correlation analysis.
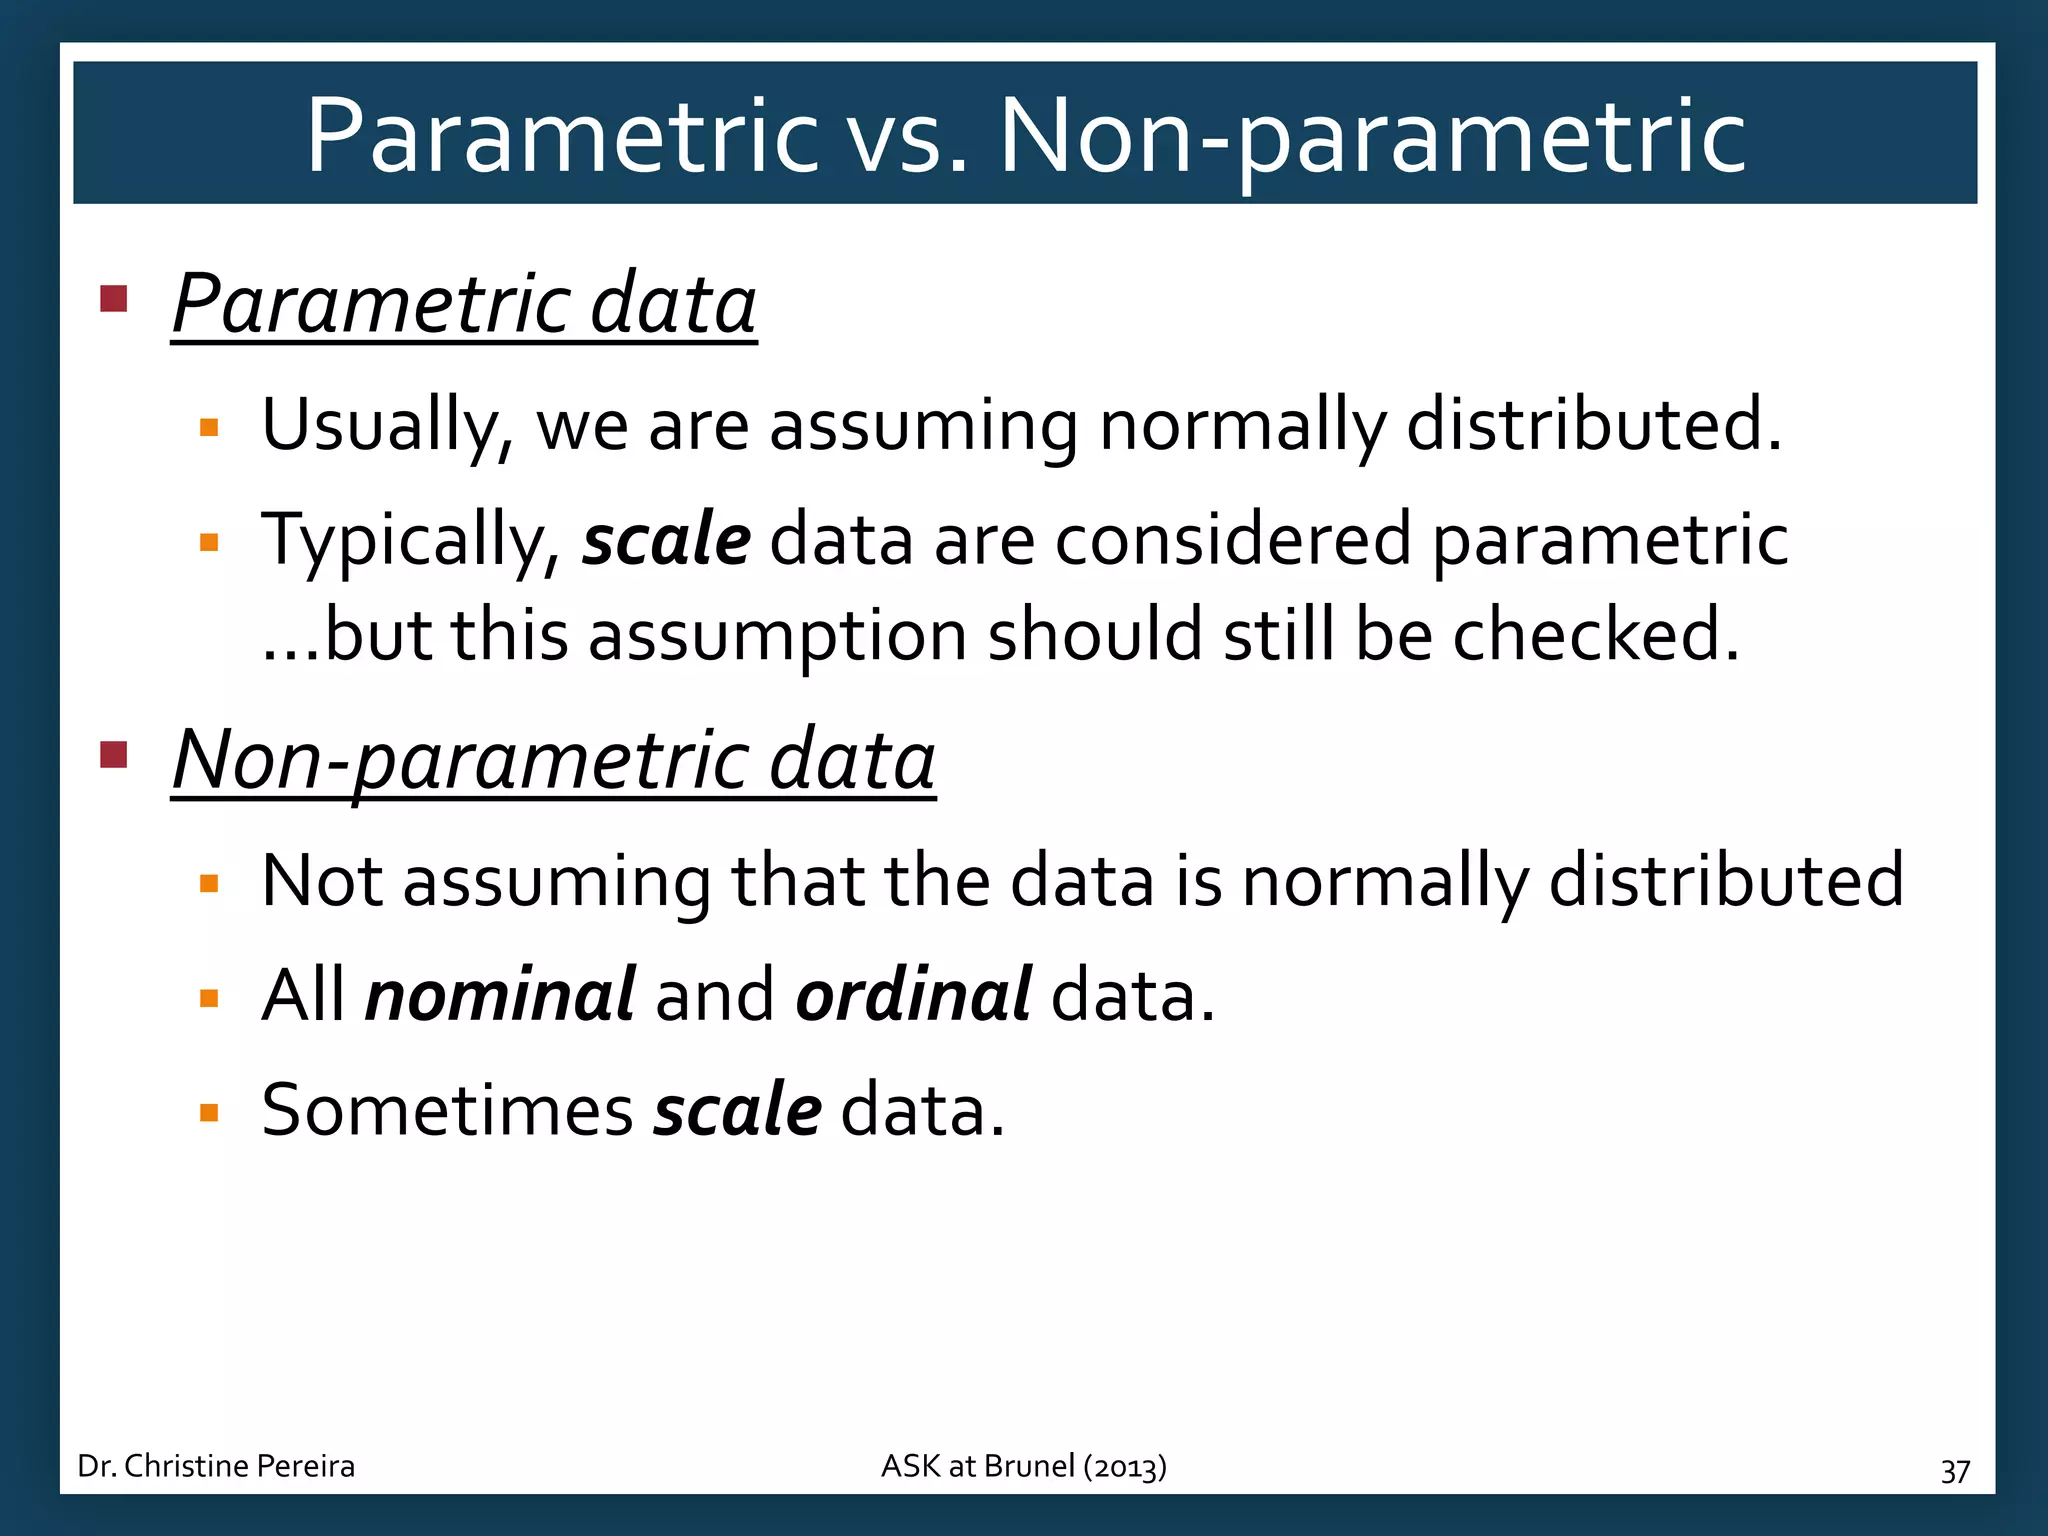
Distinction between parametric and non-parametric data in correlation analysis.
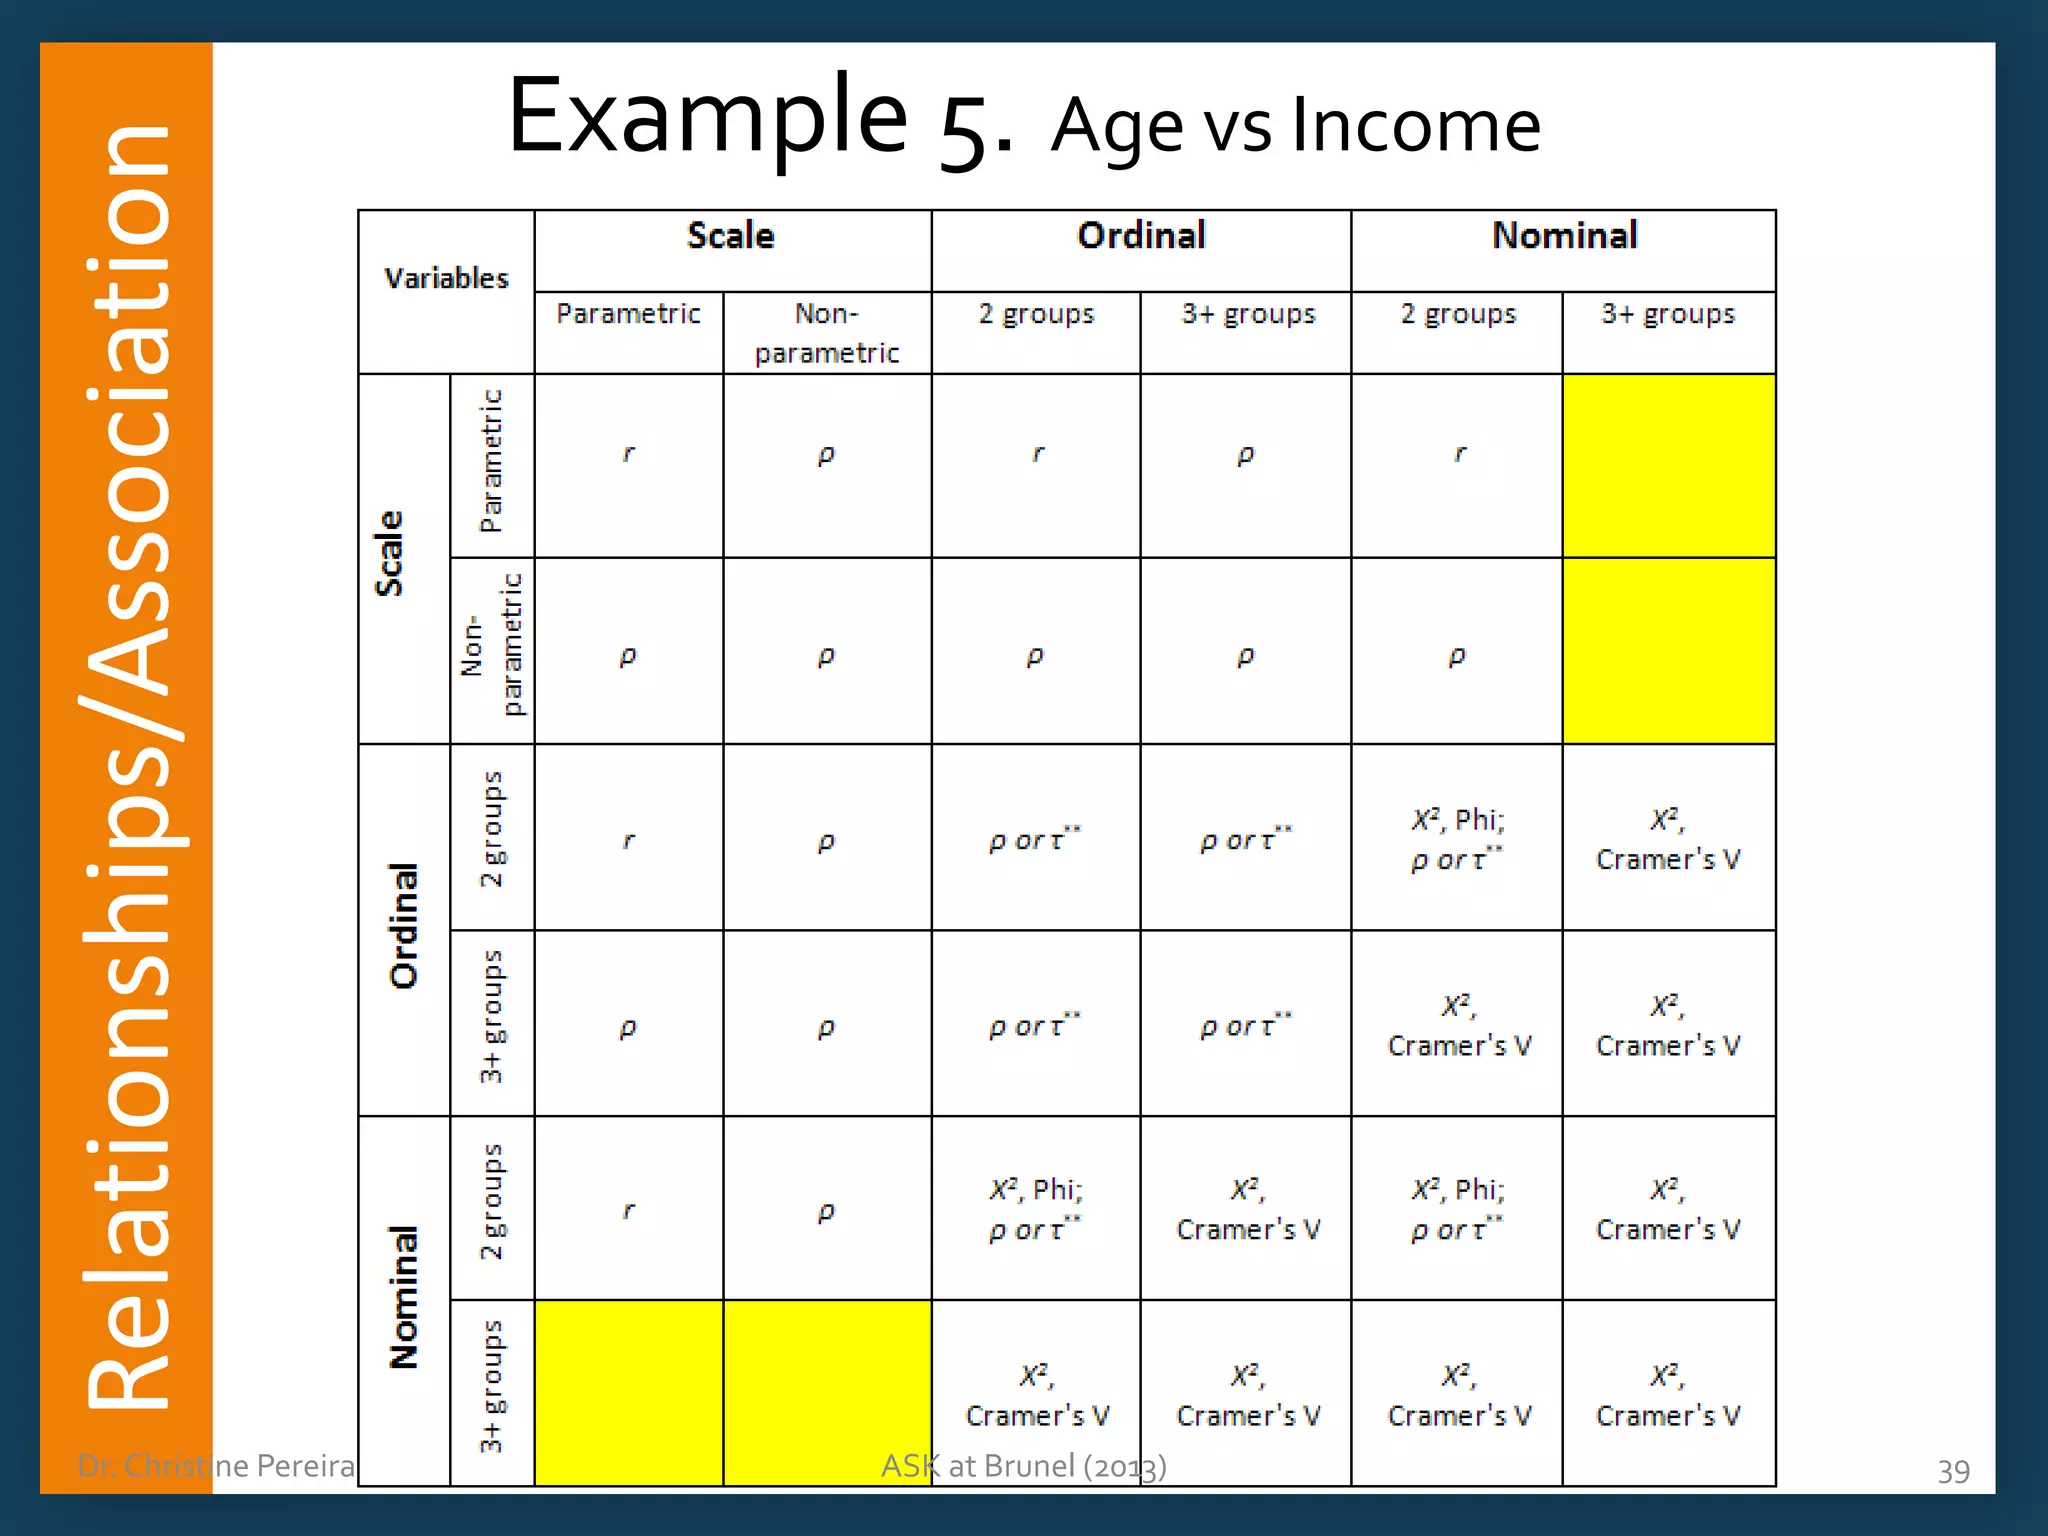
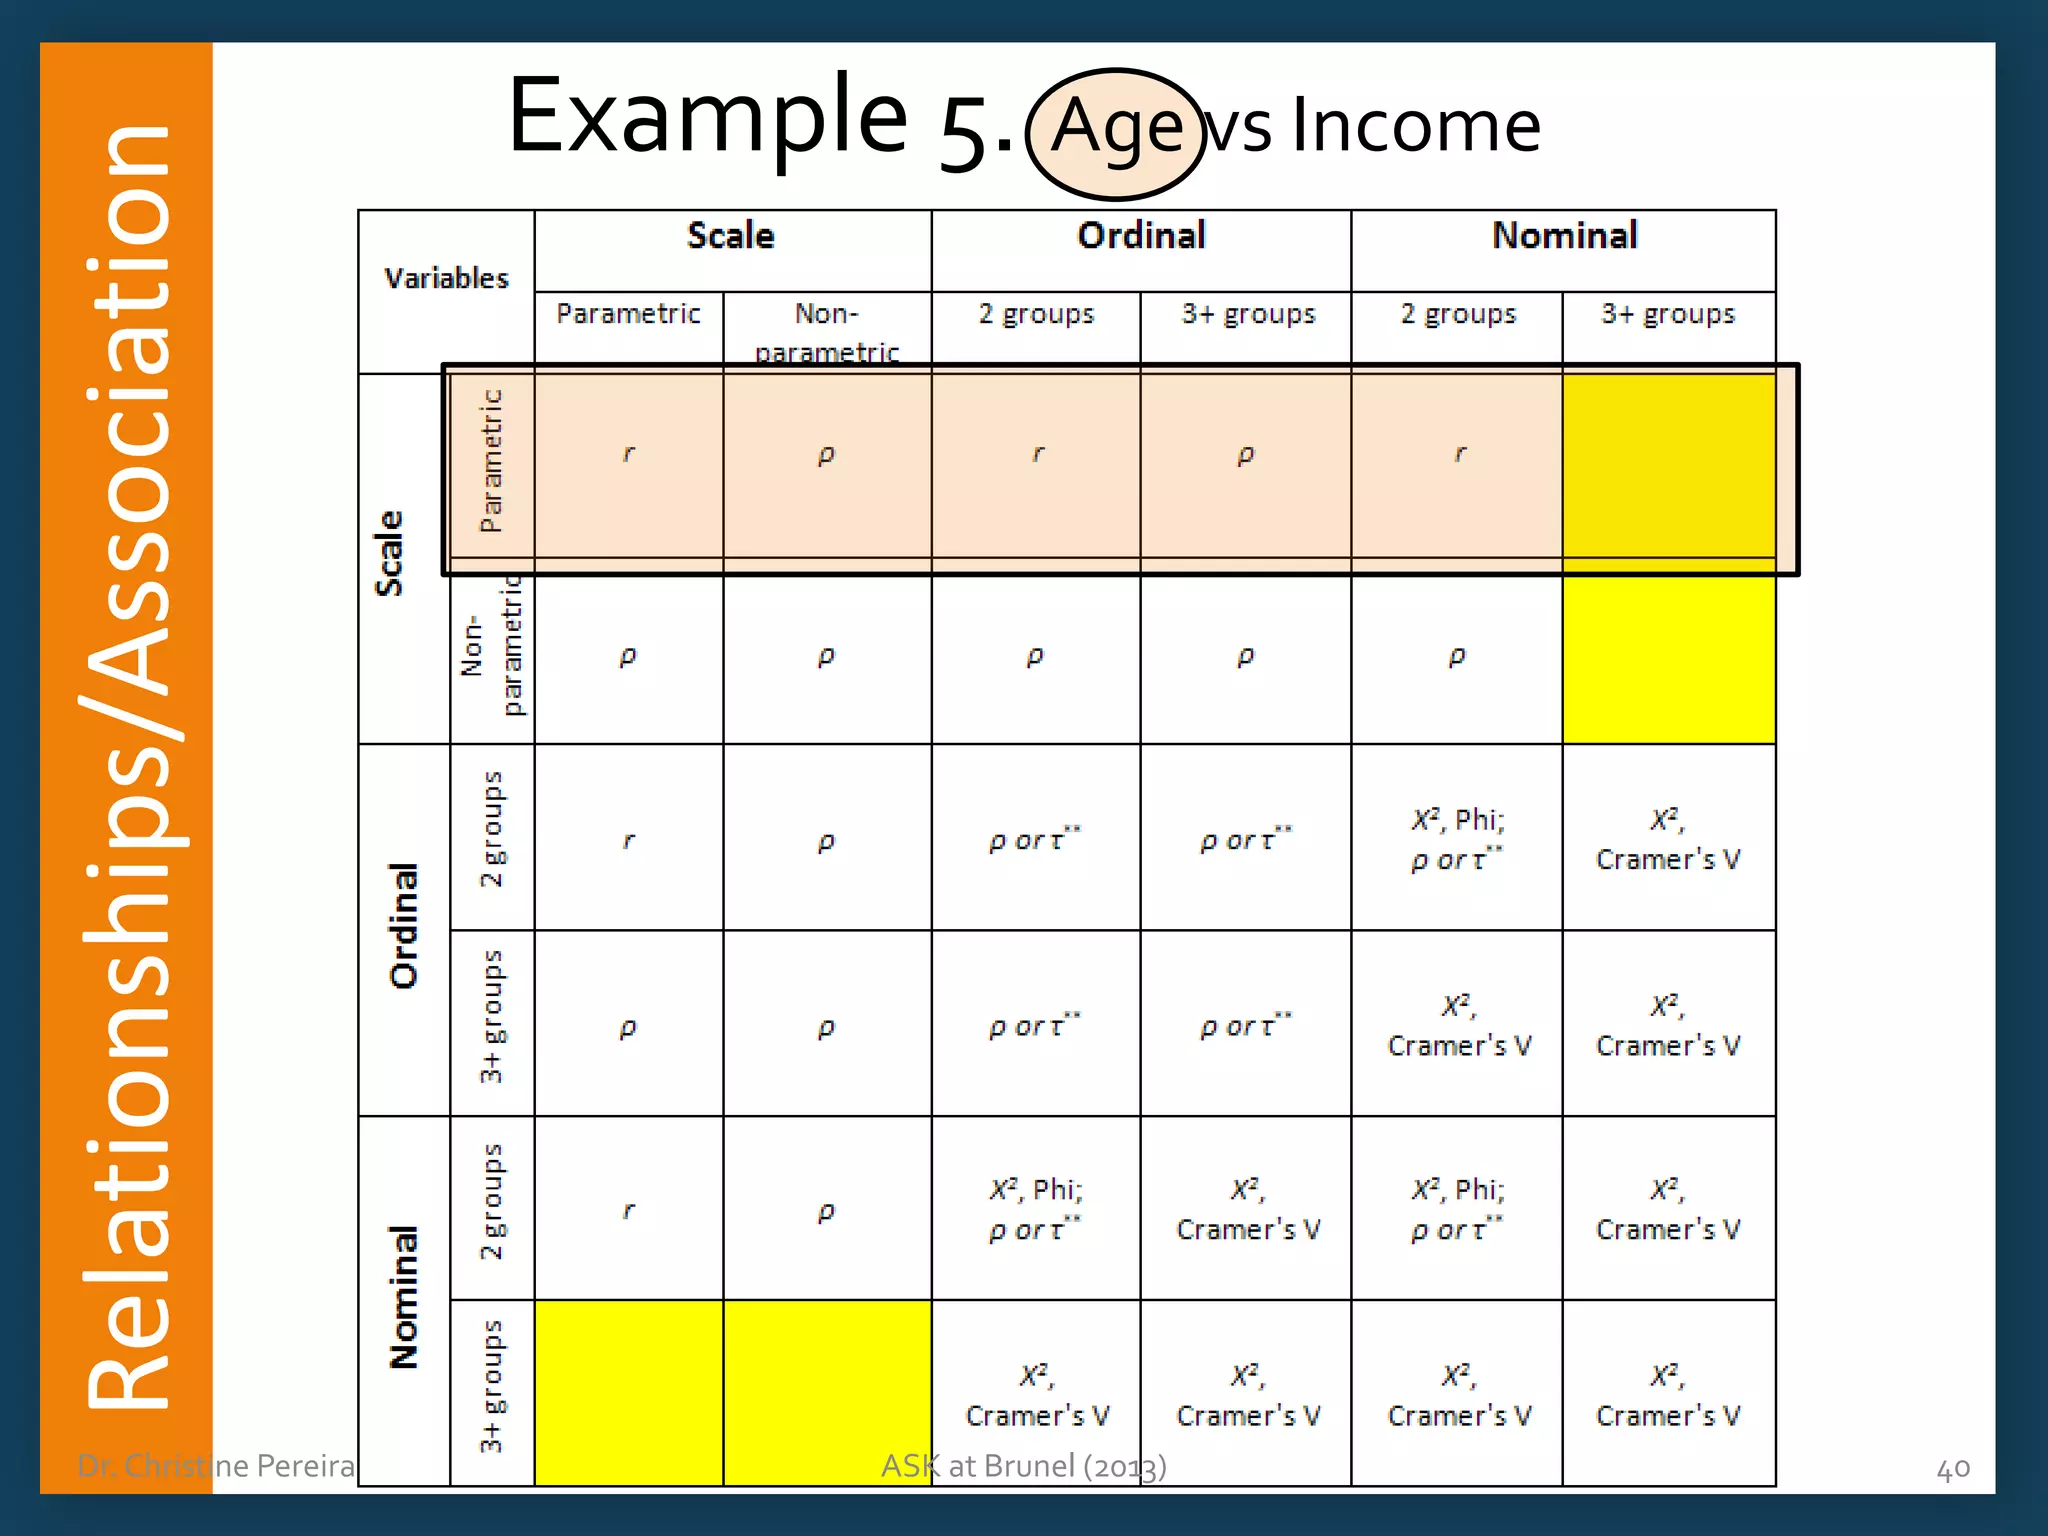
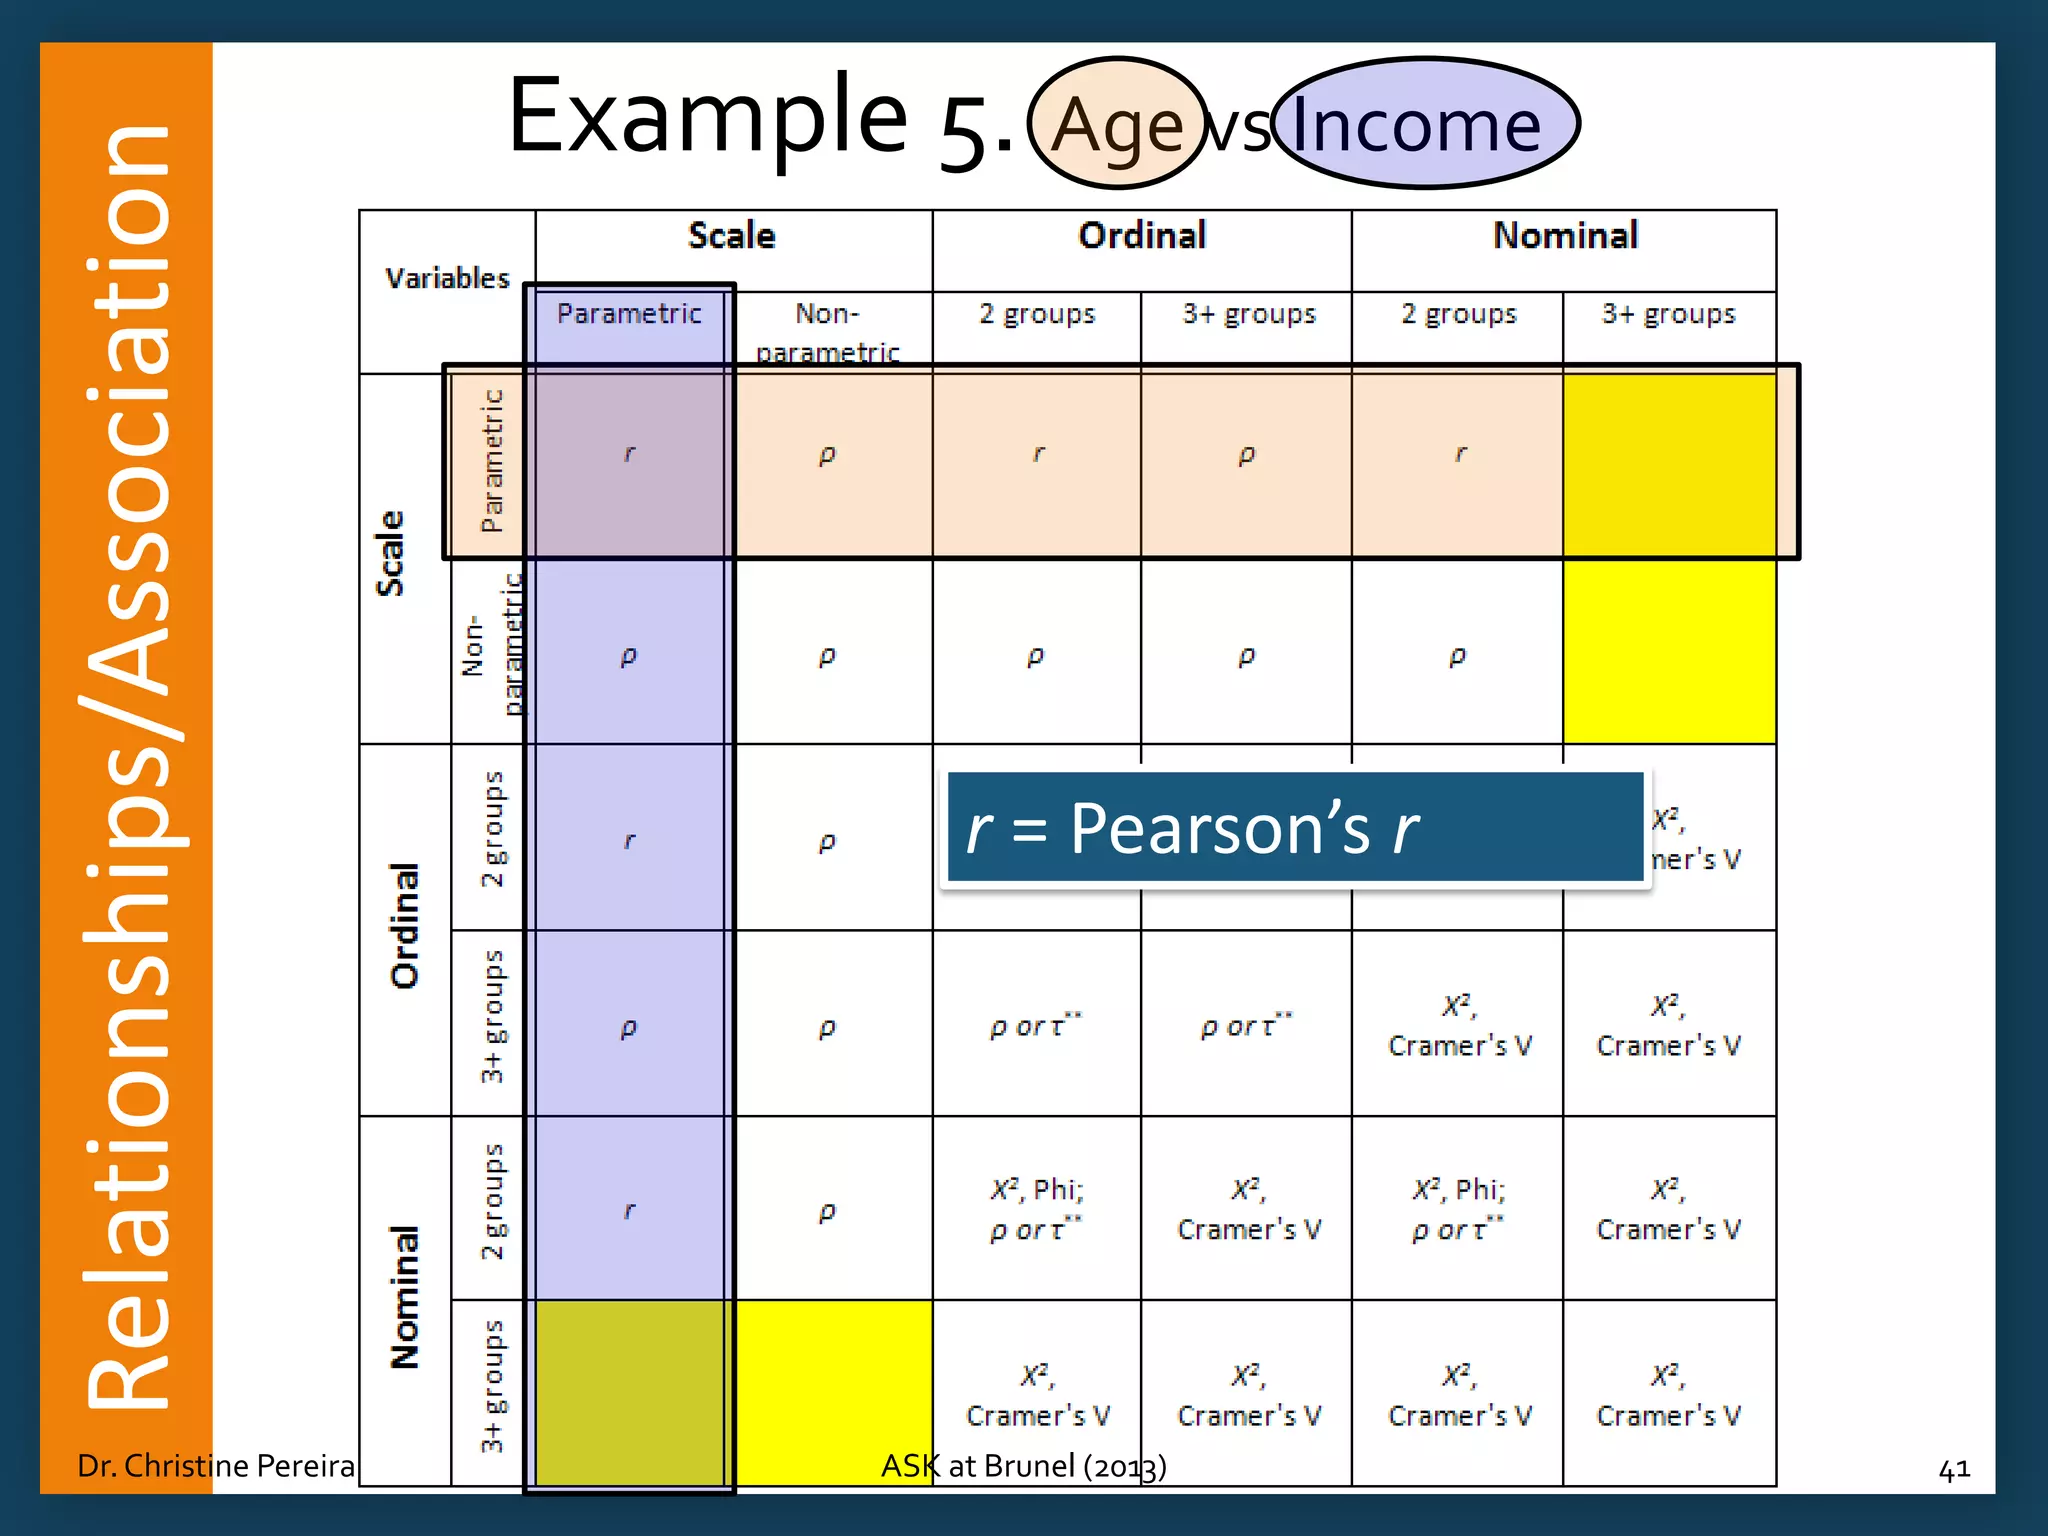
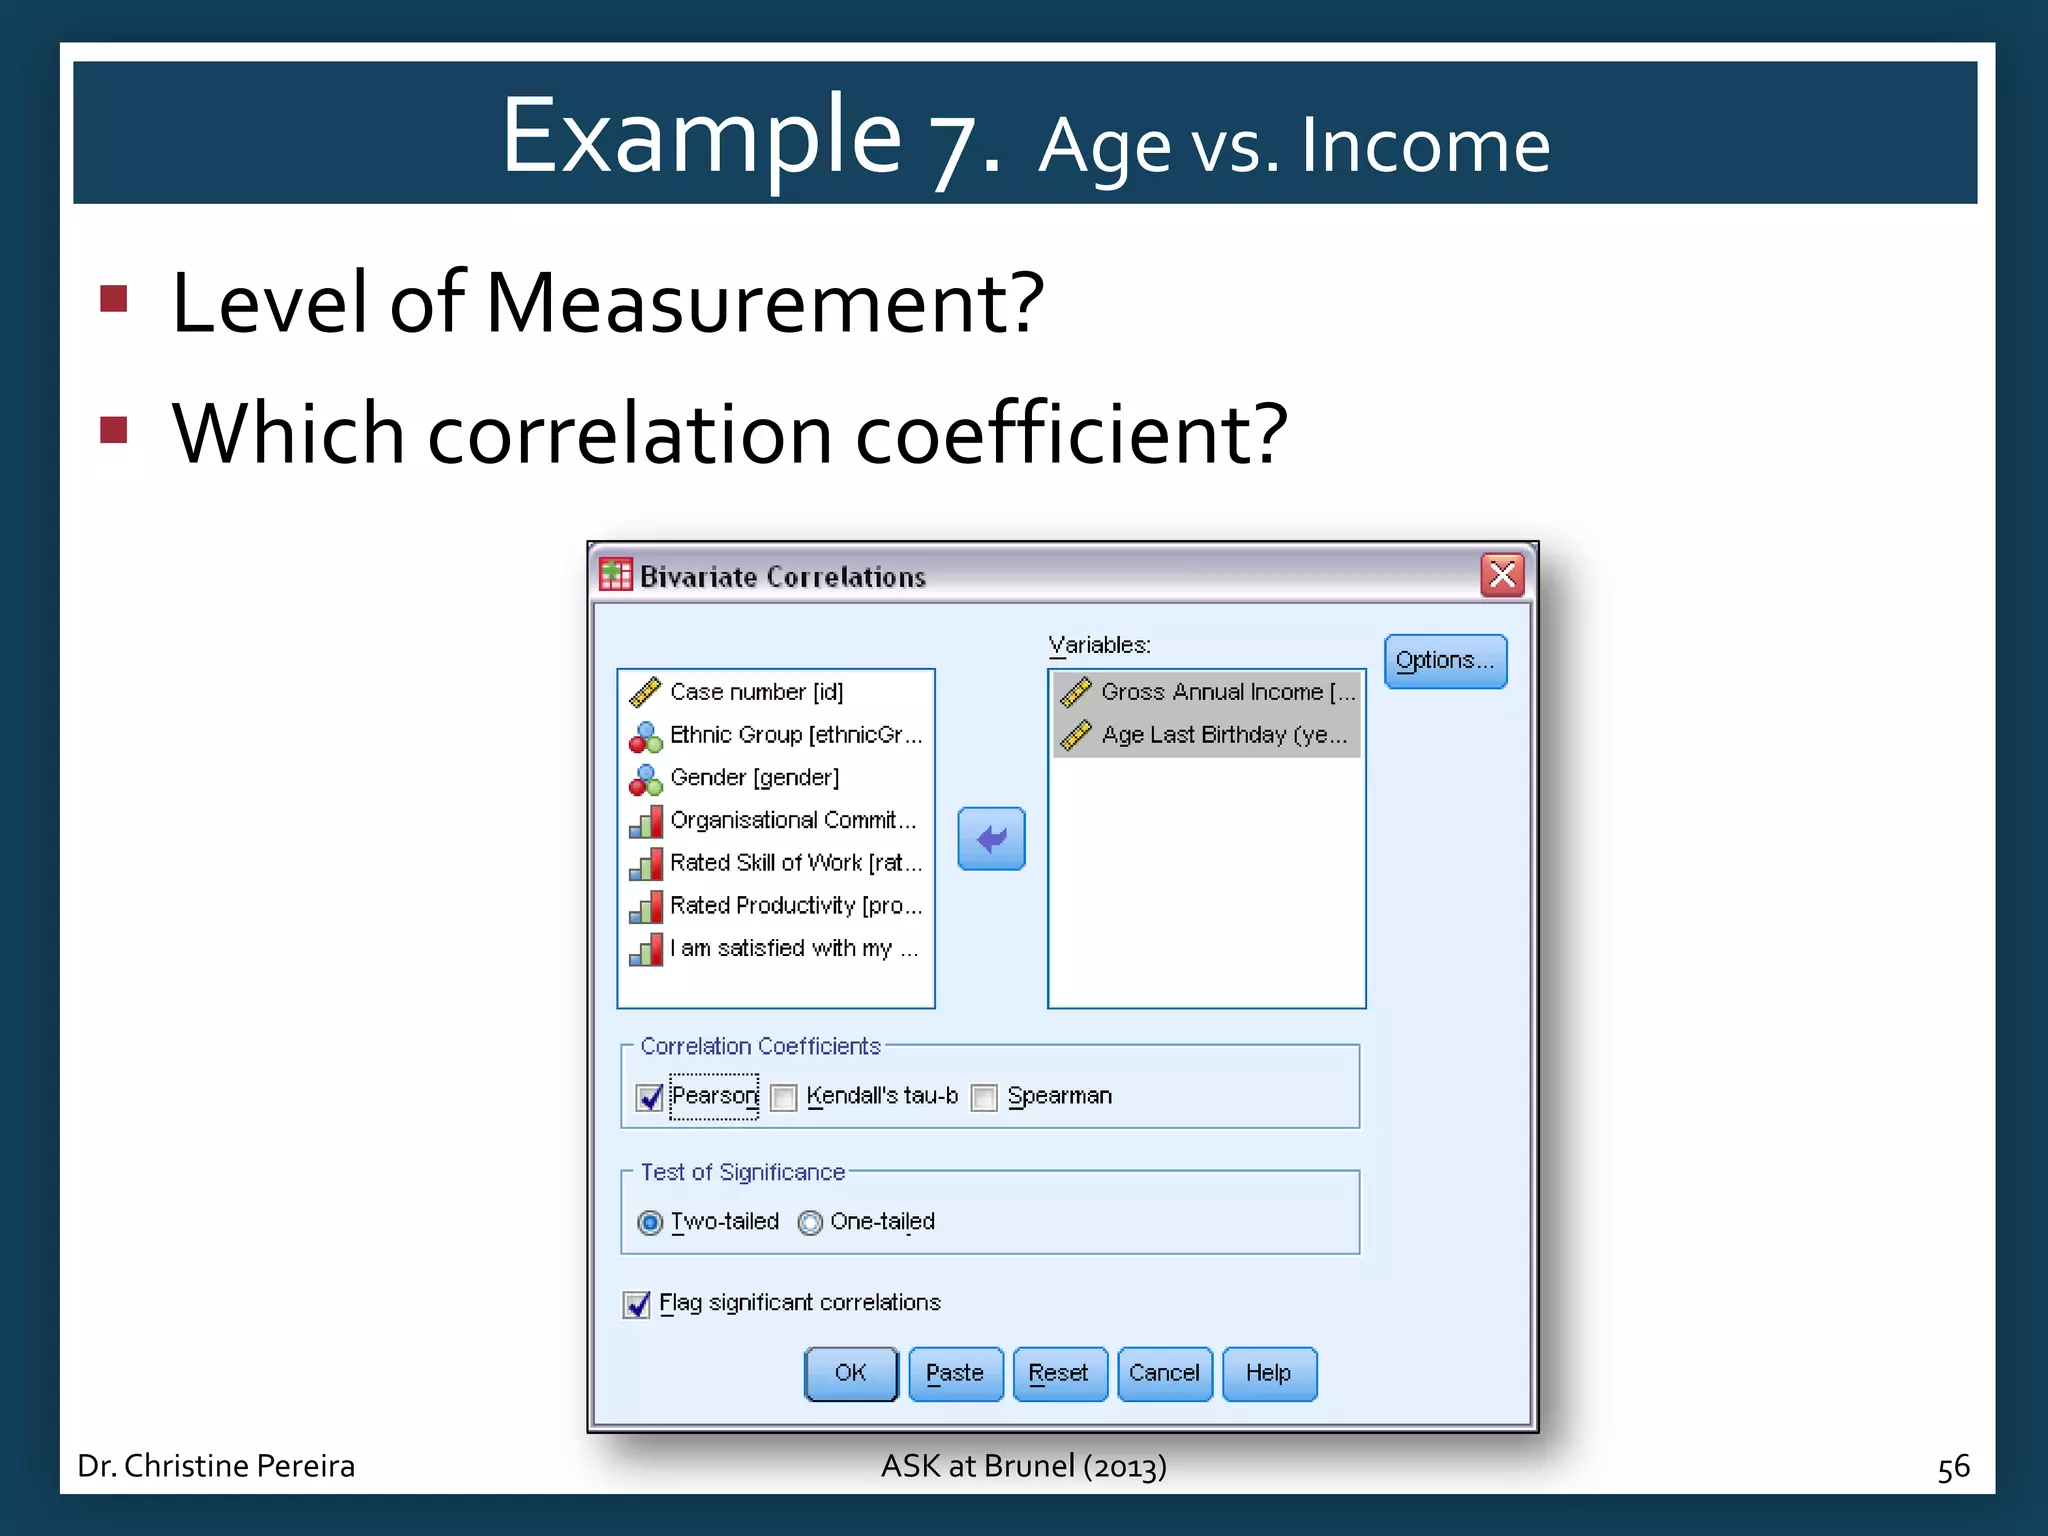
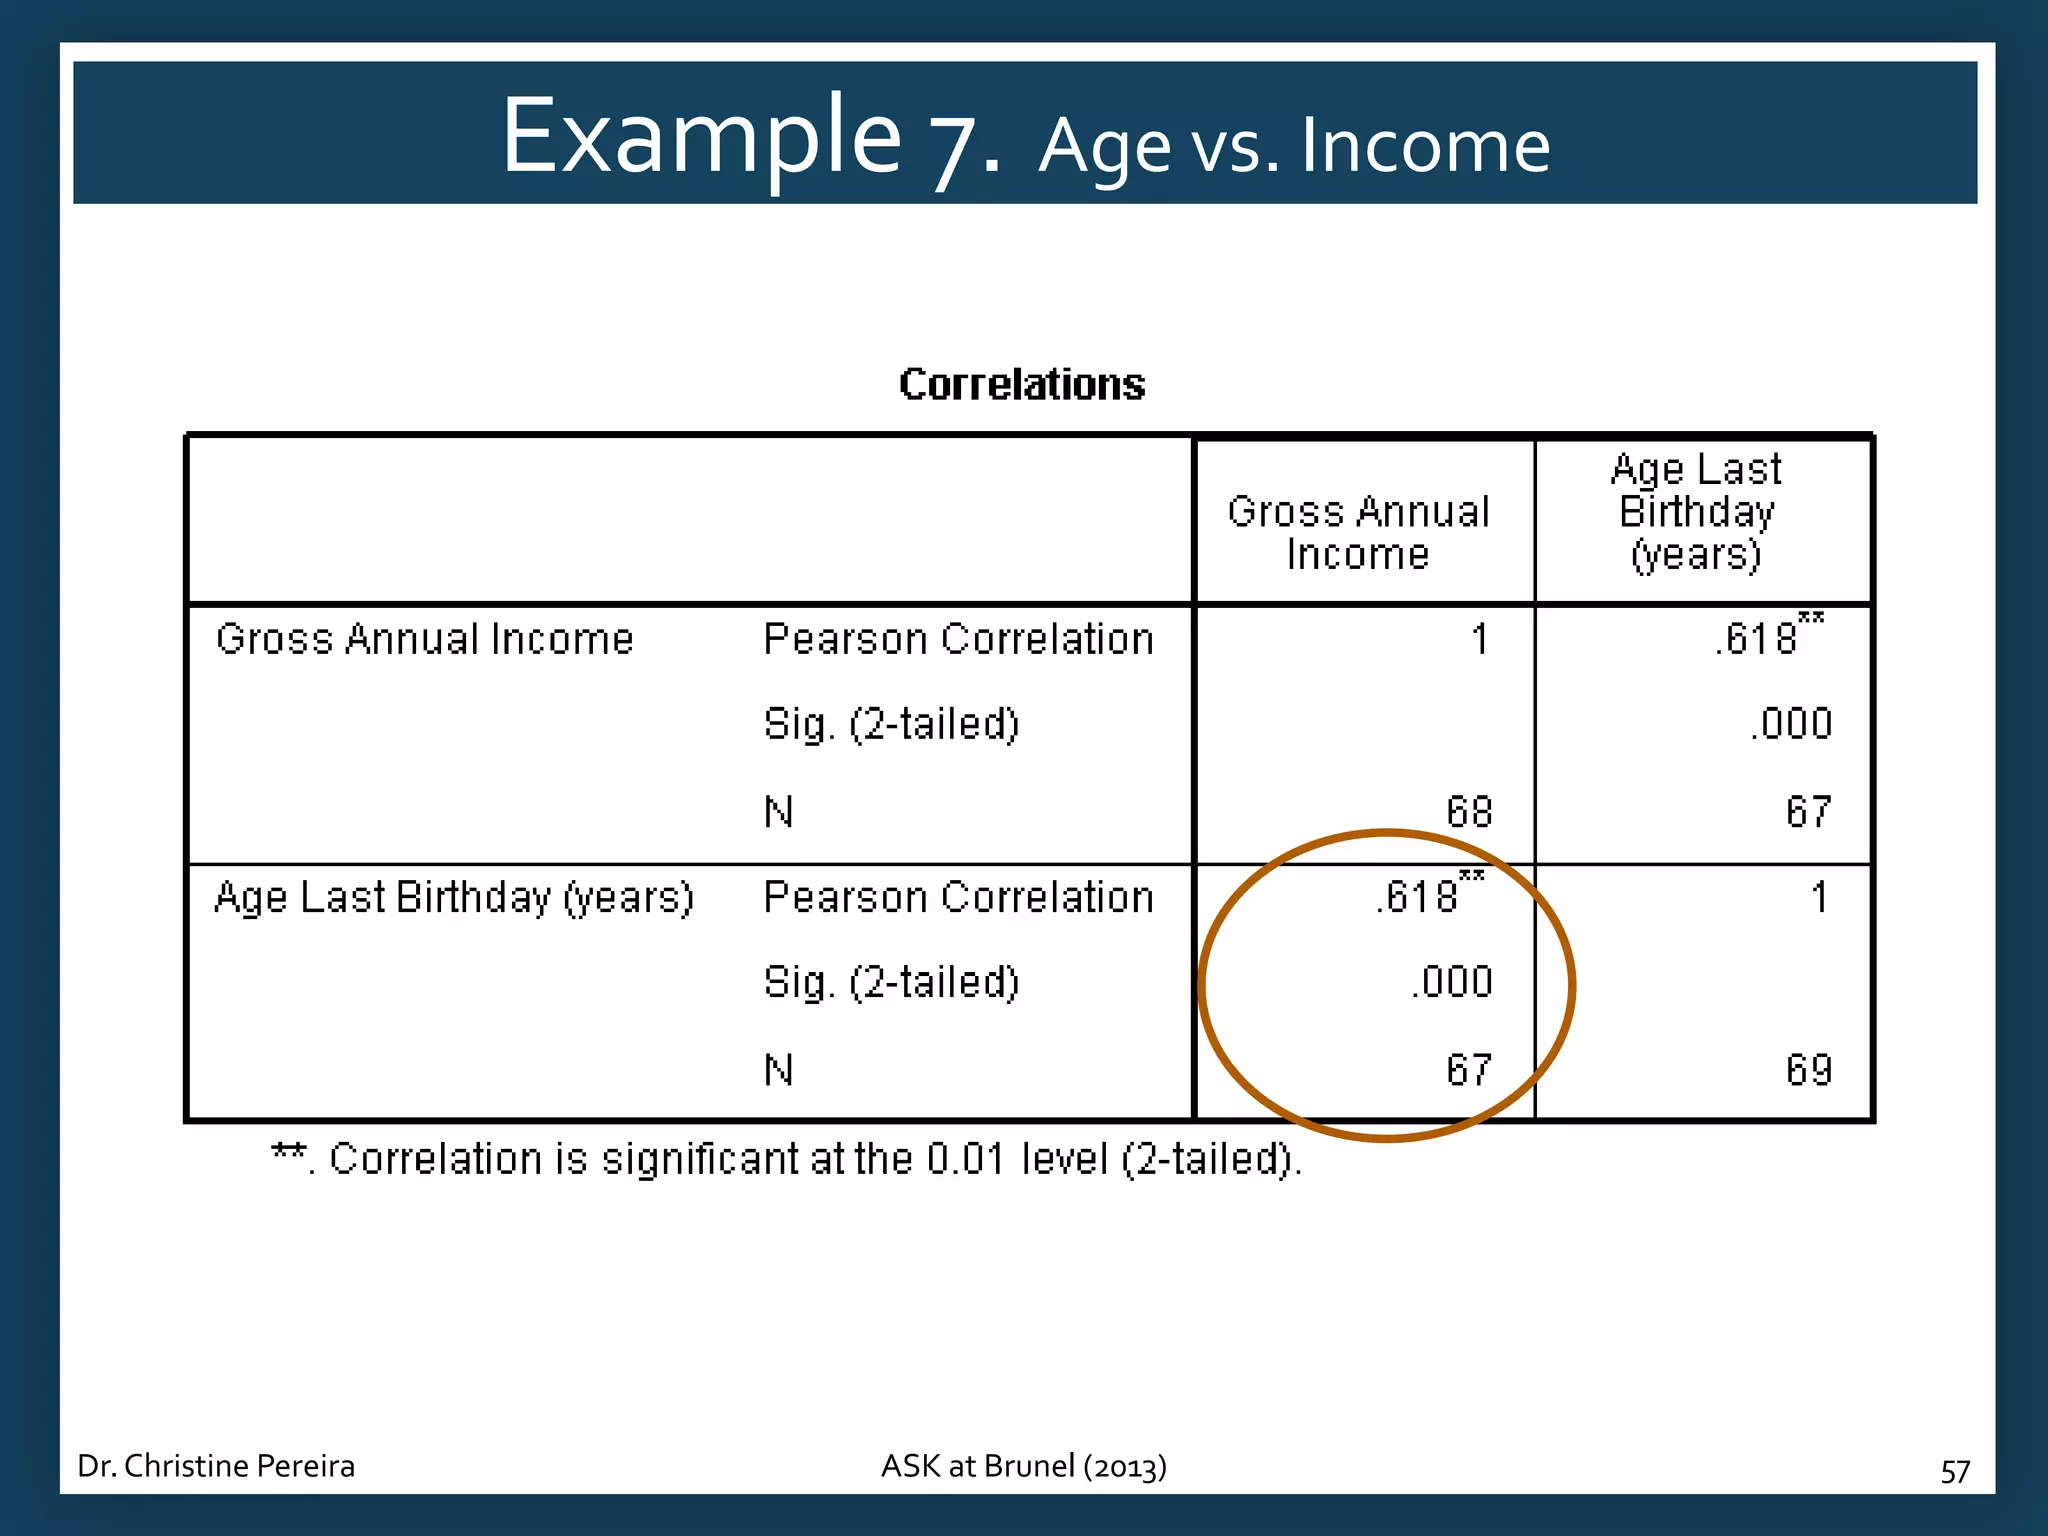
Examples illustrating relationships between age and income using different correlation methods.
Guidance on selecting appropriate correlation coefficients based on data integrity rather than desired outcomes.
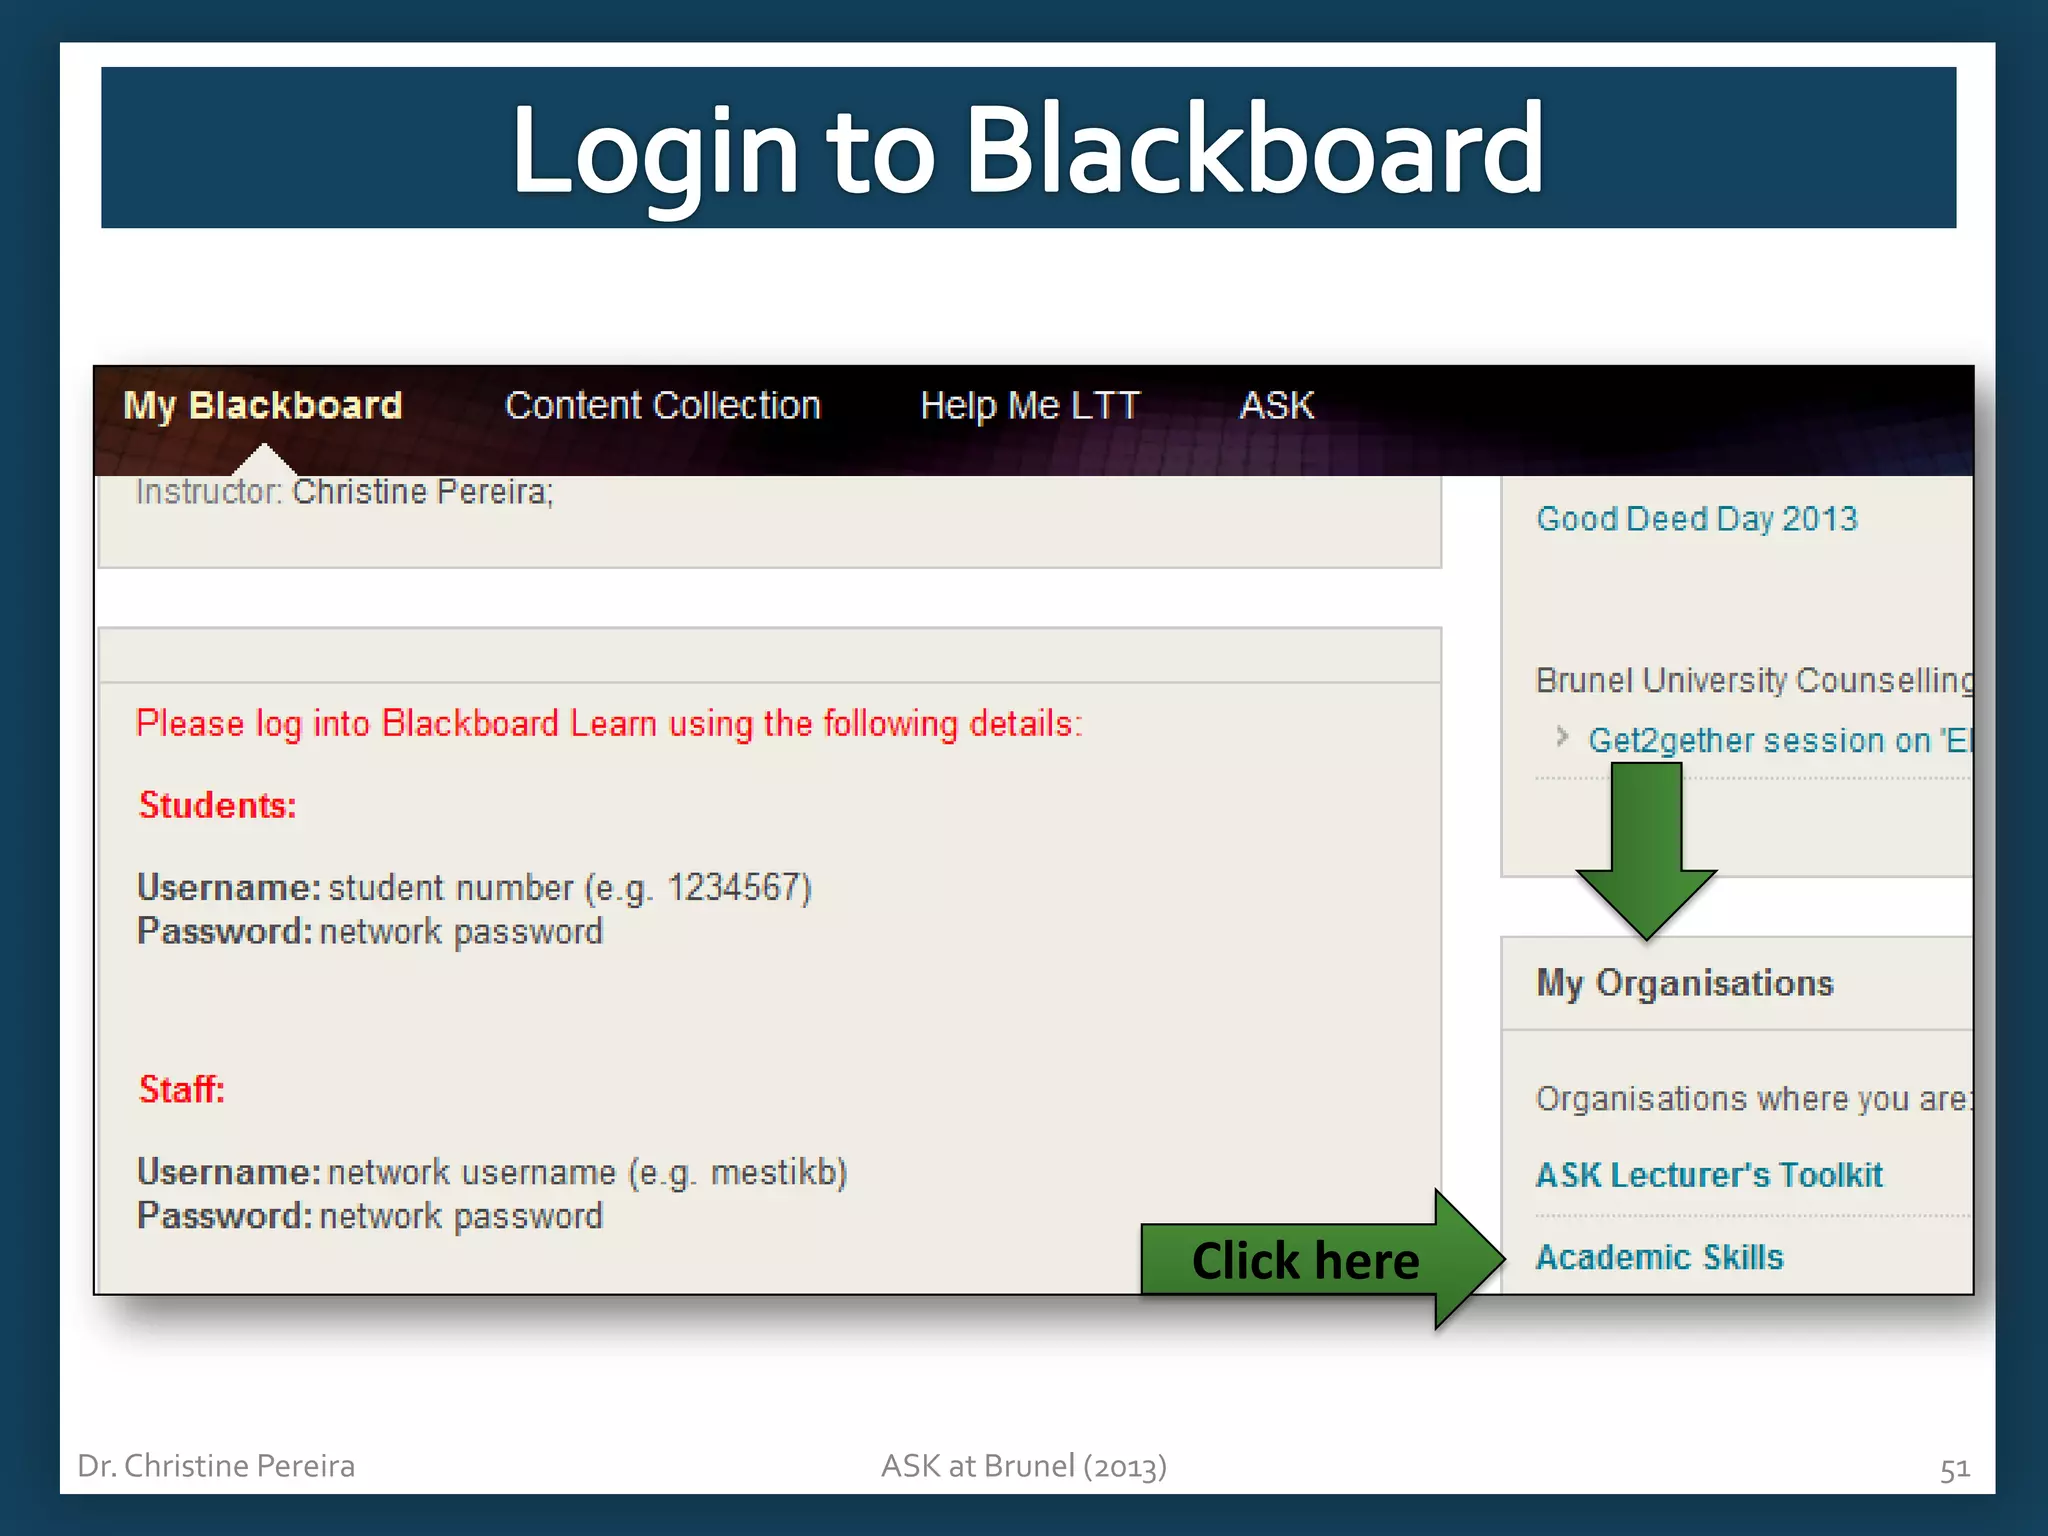
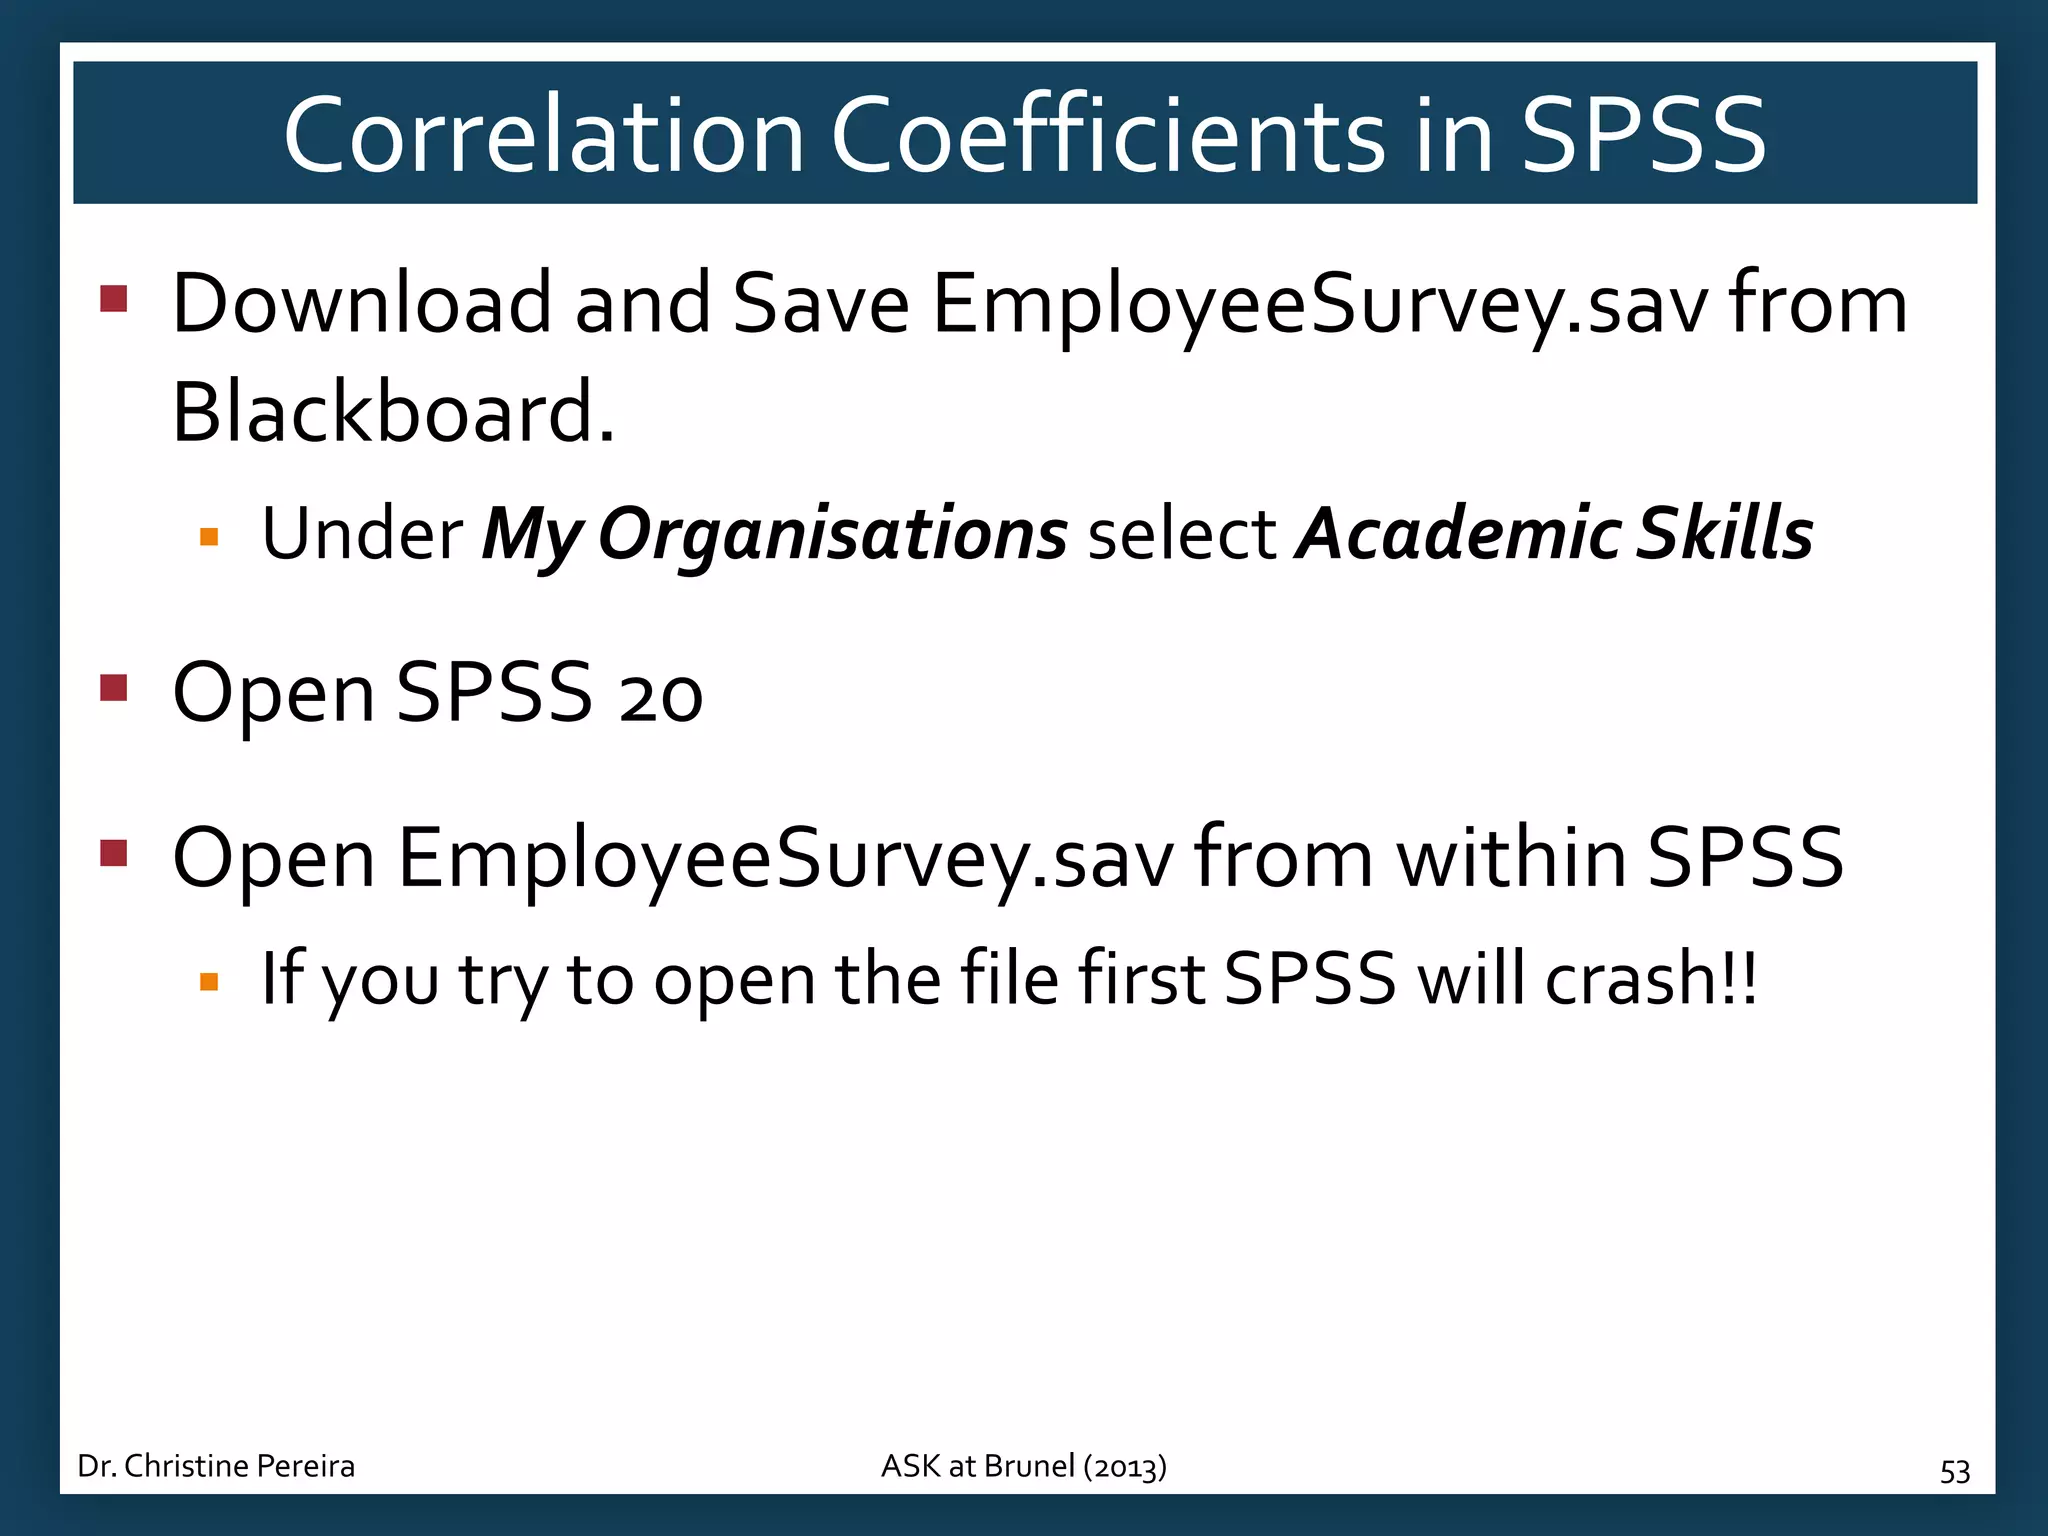
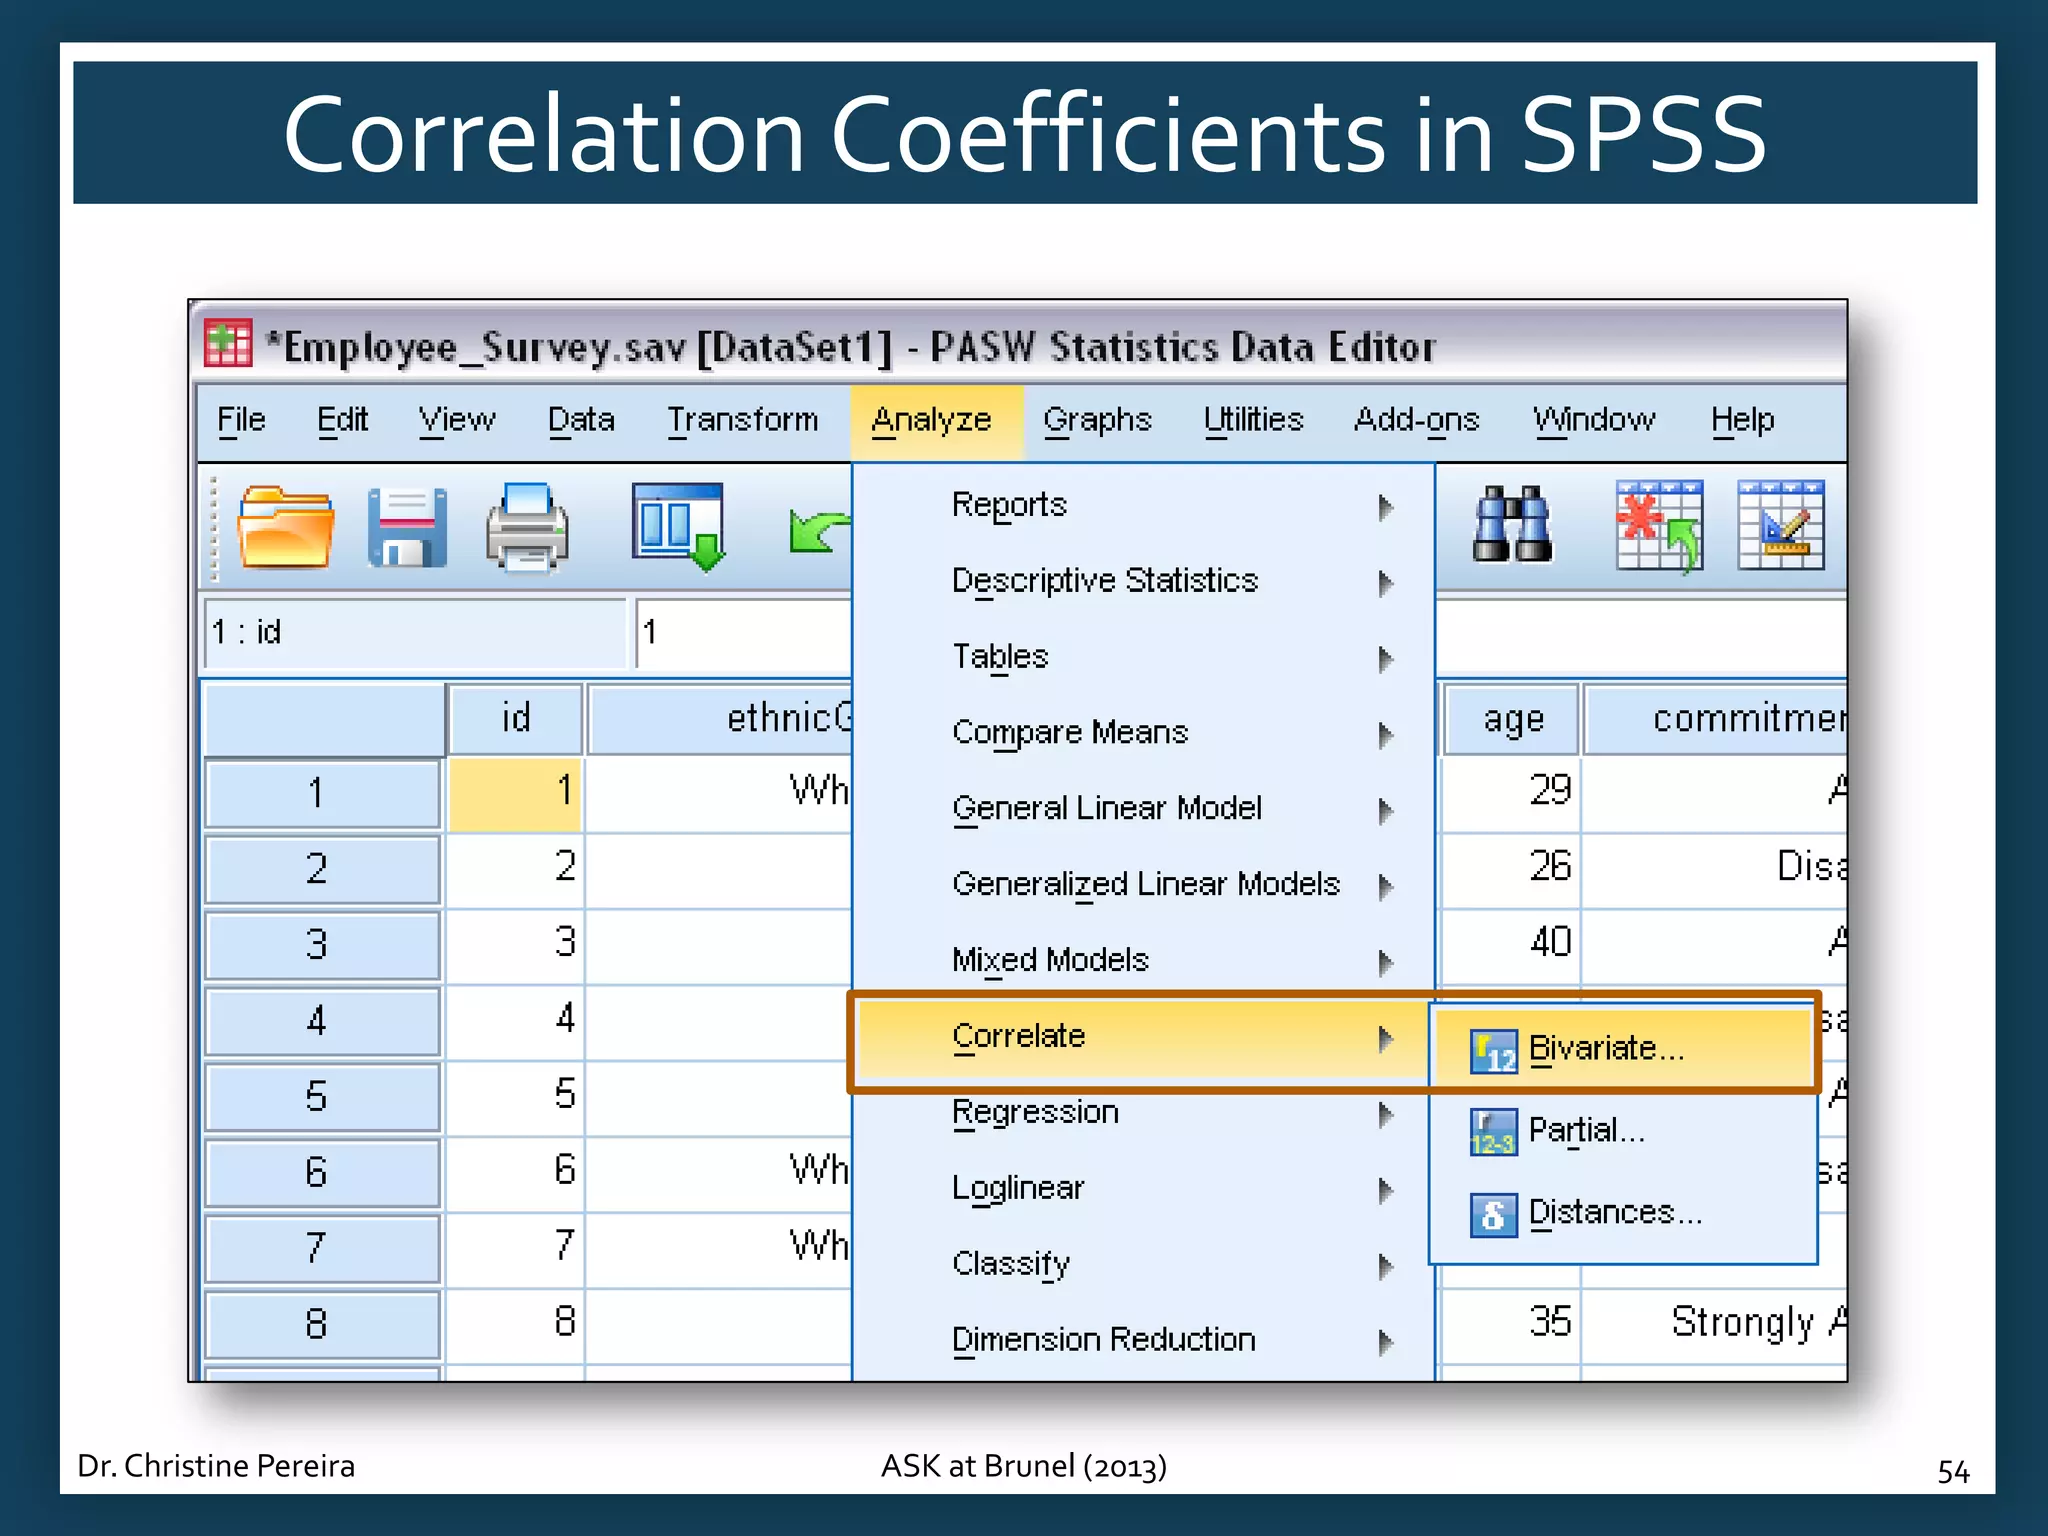
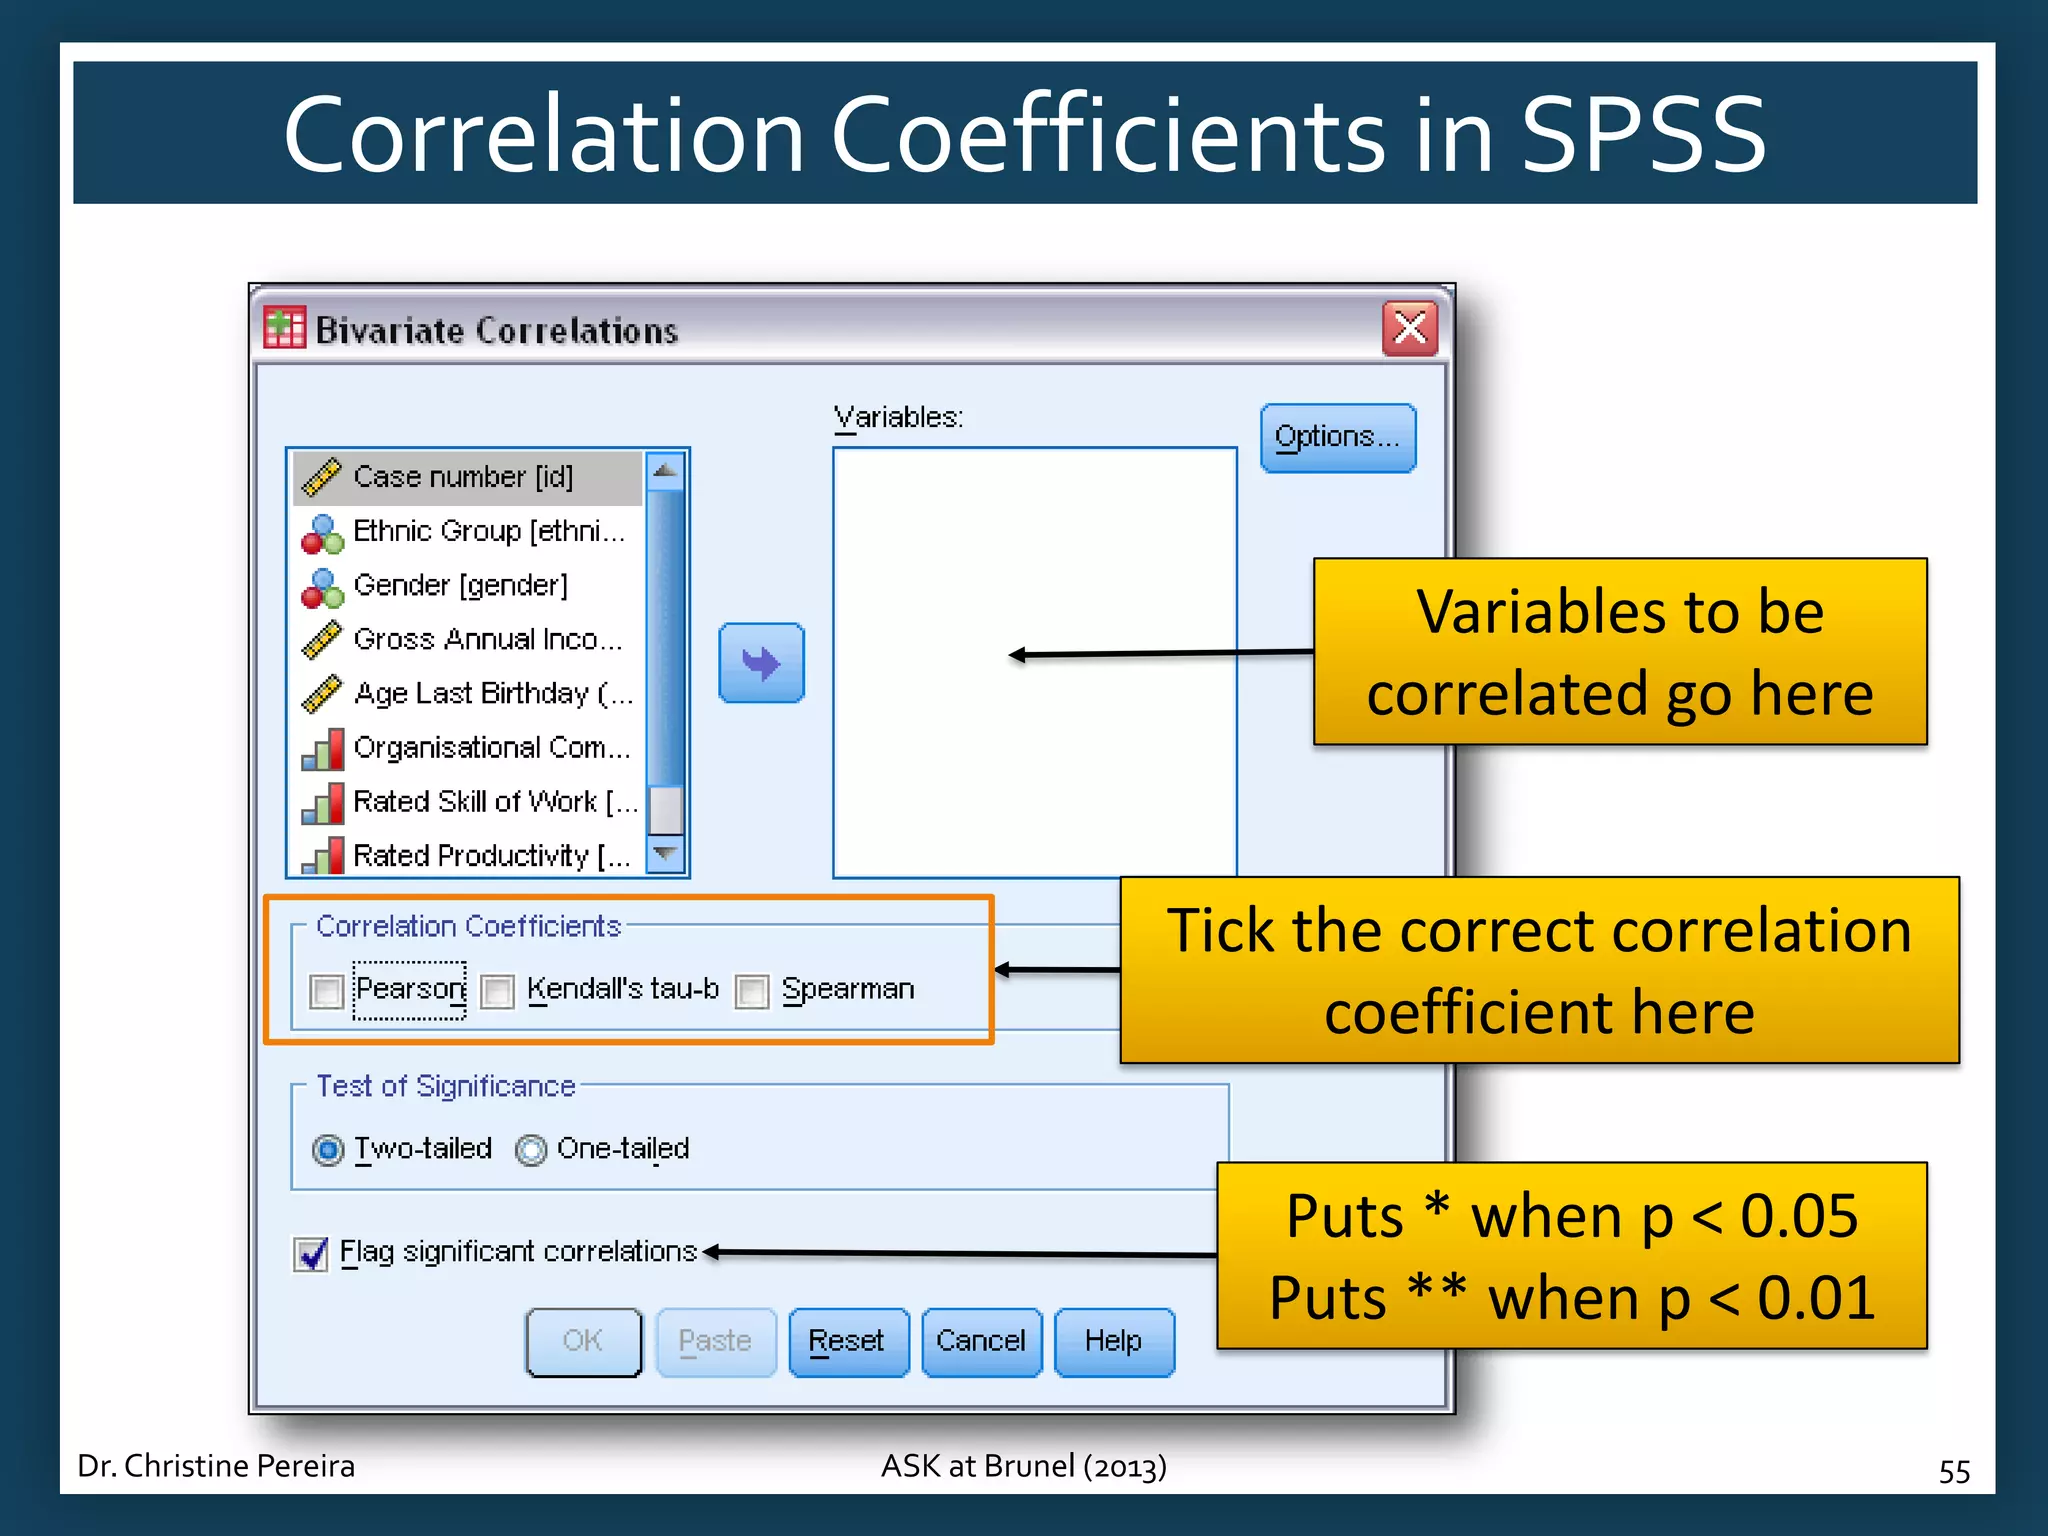
Instructions for performing correlation analysis in SPSS with specific datasets and settings.