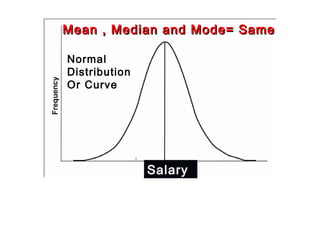
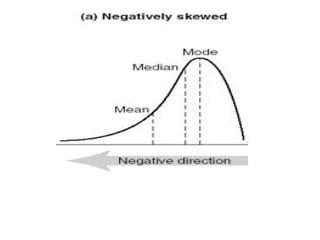
Introduction to Biostatistics
DR. SYED SANOWAR ALI
CENTRAL TENDENCY
The centre of the distribution
Or
The most typical case
Measures of CENTRAL TENDENCY
Given a data set, a measure of the
CENTRAL TENDENCY is a value about which
the observations tend to cluster
In other wordsIn other words a measure of the
CENTRAL TENDENCY is a value around whichCENTRAL TENDENCY is a value around which
a data set is centereda data set is centered
Measures of CENTRAL TENDENCY
The three most common measures are
• Mean
• Median
• Mode
Mean: It is the value that is closest to all
the other values in a distribution.
Mean
= X1 + X2 + -------- Xn or
n
µ = X1 + X2 + -------- XN or
N
∑ = summation
= X bar
µ = mu
N = total number of values in population
n = total number of values in sample
×
× n
x
x
∑
=
N
x∑
=µ
Find the mean of the following five salaries
6000, 10000, 14000, 50000, 10000
• Step 1. Arrange the values in ascending order.
6000, 10000, 10000, 14000, 50000
• Step 2. Add all of the observed values in the distribution.
6000+10000+10000+14000+50000= 90000
• Step 3. Divide the sum by the number of observations.
90000 / 5 = 18000
• Therefore, the mean salary is 18000
n
x
x
∑
=
Properties of Mean
1. One computes the mean by using all the
values of the data.
2. The mean is used in computing other
statistics, such as variance
3. The mean for the data set is unique and not
necessarily one of the data value
4. The mean is affected by extremely high or
low values, called outliers, and may not be
the appropriate to use in these situation
Median is the middle value of a set of
data that has been put into rank order.
The median is also the 50th percentile of
the distribution.
Median
Example A: Odd Number of Observations
Find the median of the following
6000, 10000, 14000, 50000, 10000
• Step 1. Arrange the values in ascending order.
6000, 10000, 10000, 14000, 50000
• Step 2. Find the middle position of the distribution by using
(n + 1) / 2.
Middle position = (5 + 1) / 2 = 6 / 2 = 3
• Therefore, the median will be the value at the third
observation.
• Step 3. Identify the value at the middle position.
Third observation = 10000
Example A: Even Number of Observations
Find the median of the following
6000, 10000, 14000, 50000, 10000, 12000
• Step 1. Arrange the values in ascending order.
6000, 10000, 10000, 12000, 14000, 50000
• Step 2. Find the middle position of the distribution by
using (n + 1) / 2.
Middle position = (6 + 1) / 2 = 7 / 2 = 3.5
• Step 3. Identify the value at the middle position.
The median equals the average of the values of the third
(value = 10000) and fourth (value = 12000 observations:
Median = (10000 + 12000) / 2 = 11000
Properties of Median
1. The median is used when one must find
the center or middle value
2. The median is used when one must determine
whether the data values fall into the upper
half or lower half of the distribution
3. The median is affected less than mean by
extremely high or extremely low values
Mode is the value that occurs most
often in a set of data. It can be
determined simply by tallying the
number of times each value occurs.
Mode
In this case salary 10000 is the value that
occurs most frequently.
The mode is 10000
It should be noted that there can be more
than one mode for a data set
Properties of Mode
1. The mode is used when the most typical
case is desired
2. The mode is the easiest to compute
3. The mode can be used when the data are
nominal such as religious preference,
gender, or political affiliation
4. The mode is not always unique. A data set
can have more than one mode, or the mode
may not exist for a data set
Find the mean of the following incubation periods for
hepatitis A:
27, 31, 15, 30, and 22 days.
• Step 1. Arrange the values in ascending order
distribution.
15, 22, 27, 30, 31
Step 2. Add all of the observed values in the distribution.
15 + 22 + 27 + 30 + 31 = 125
• Step 3. Divide the sum by the number of observations.
125 / 5 = 25.0
• Therefore, the mean incubation period is 25.0 days.
Example B: Even Number of Observations
Suppose a sixth case of hepatitis was reported. hepatitis A:
27, 31, 15, 30, 22 and 29 days.
• Step 1. Arrange the values in ascending order.
15, 22, 27, 29, 30, and 31 days
• Step 2. Find the middle position of the distribution by
using (n + 1) / 2.
Middle location = 6 + 1 / 2 = 7 / 2 = 3½
• Step 3. Identify the value at the middle position.
The median equals the average of the values of the third
(value = 27) and fourth (value = 29) observations:
Median = (27 + 29) / 2 = 28 days
Example B: Find the mode of the following
incubation periods for hepatitis A:
27, 31, 15, 30, and 22 days.
• Step 1. Arrange the values in ascending order.
15, 22, 27, 30, and 31 days
• Step 2. Identify the value that occurs most often.
None
• Note: When no value occurs more than once, the
distribution is said to have no mode.
the number of doses of diphtheria-pertussis- tetanus
(DPT) vaccine each of seventeen 2-year-old children in a
particular village received:
0, 0, 1, 1, 2, 2, 2, 3, 3, 3, 3, 3, 3, 4, 4, 4, 4
Two children received no doses; two children received 1
dose; three received 2 doses; six received 3 doses; and
four received all 4 doses.
Therefore, the mode is 3 doses, because
more children received 3 doses than any
other number of doses.
Which measure of CT should you use ?
The Mean is by far the most common measure of
CT. It uses all of the information in the sample.
This measure is very good when the distribution
is symmetrical.
Mean , Median and Mode
Data:
4000, 4500, 5000, 5500, 6000, 6000, 6500,
7000, 7500 and 8000
Mean = 6000
Median = 6000
Mode = 6000
= Same= Same
Salary
Mean , Median and Mode= SameMean , Median and Mode= Same
Normal
Distribution
Or Curve
Which measure of CT should you use ?
If the distribution is skewed or there are
extreme values the Mean is artificially pulled
towards the extreme value.
Age example: 19, 20, 21, 22, 49
Mean=26.2 yrs.Mean=26.2 yrs.
Mean=49.2Mean=49.2
Marks example 05, 55, 57, 63, 66
Which measure of CT should you use ?
Age : 19, 20, 21, 22, 49 Mean=26.2 yrs.Mean=26.2 yrs.
Right skewed or Positively skewed
Which measure of CT should you use ?
Marks 05, 55, 57, 63,
66
Mean=49.2Mean=49.2
Left skewed or Negatively skewed
Which measure of CT should you use ?
• If the distribution is skewed or there are extreme
values, in such a case Median proves to be better
measure of the CT.
• Median is resistant to extreme observations.
Which measure of CT should you use ?
• Mode is commonly used as a measure of
popularity that reflect CT of Opinion
• Examples:
1. Most preferred pain killer
2. Most preferred model of washing machine
3. Most popular candidate
Most fighting cricket team
• Pakistan=1
• Australia=2
• India=3
• England=4
1, 2, 4, 1, 2, 1, 3, 1, 4, 1,1, 2, 4, 1, 2, 1, 3, 1, 4, 1,
2, 1, 3, 2, 4, 4, 1, 1, 1, 4,2, 1, 3, 2, 4, 4, 1, 1, 1, 4,
3, 1, 1, 4, 2, 1, 1, 2, 1, 2,3, 1, 1, 4, 2, 1, 1, 2, 1, 2,
1, 4, 1, 1, 3, 2, 4, 1, 4, 11, 4, 1, 1, 3, 2, 4, 1, 4, 1
Which measure of CT should you
use ?Mean(2.075)
MODE
19
88
44
99
Median(2) Mode(1)
Measurement of Variation
Measurement of Dispersion
OR
Range
The range is the simplest measure of variation
to find. It is simply the highest value minus the
lowest value.
RANGE = MAXIMUM - MINIMUM
Since the range only uses the largest and
smallest values, it is greatly affected by
extreme values, that is - it is not resistant to
change.
Variance (σ2
)
The Variance is defined as:
The average of the squared differences
from the Mean.
σ2
 = Σ (Xi - x̄)2
 / N-1 (if
sample size ≤ 30)
σ2
 = Σ (Xi - x̄)2
 / N
Standard deviation (σ)
The Standard Deviation is a measure of
how spread out numbers are.
Its symbol is σ (the greek letter sigma)
The formula is easy: it is the square
root of the Variance. 
σ = √σ2
Coefficient of variance
(Cv)
The coefficient of
variation represents the ratio of the
standard deviation to the mean, and it is
a useful statistic for comparing the
degree of variation from one data
series to another, even if the means are
drastically different from each other
Cv = Standard Deviation x 100
Mean

Introduction biostatistics

  • 1.
  • 2.
    CENTRAL TENDENCY The centreof the distribution Or The most typical case
  • 3.
    Measures of CENTRALTENDENCY Given a data set, a measure of the CENTRAL TENDENCY is a value about which the observations tend to cluster In other wordsIn other words a measure of the CENTRAL TENDENCY is a value around whichCENTRAL TENDENCY is a value around which a data set is centereda data set is centered
  • 4.
    Measures of CENTRALTENDENCY The three most common measures are • Mean • Median • Mode
  • 5.
    Mean: It isthe value that is closest to all the other values in a distribution.
  • 6.
    Mean = X1 +X2 + -------- Xn or n µ = X1 + X2 + -------- XN or N ∑ = summation = X bar µ = mu N = total number of values in population n = total number of values in sample × × n x x ∑ = N x∑ =µ
  • 7.
    Find the meanof the following five salaries 6000, 10000, 14000, 50000, 10000 • Step 1. Arrange the values in ascending order. 6000, 10000, 10000, 14000, 50000 • Step 2. Add all of the observed values in the distribution. 6000+10000+10000+14000+50000= 90000 • Step 3. Divide the sum by the number of observations. 90000 / 5 = 18000 • Therefore, the mean salary is 18000 n x x ∑ =
  • 8.
    Properties of Mean 1.One computes the mean by using all the values of the data. 2. The mean is used in computing other statistics, such as variance 3. The mean for the data set is unique and not necessarily one of the data value 4. The mean is affected by extremely high or low values, called outliers, and may not be the appropriate to use in these situation
  • 9.
    Median is themiddle value of a set of data that has been put into rank order. The median is also the 50th percentile of the distribution. Median
  • 10.
    Example A: OddNumber of Observations Find the median of the following 6000, 10000, 14000, 50000, 10000 • Step 1. Arrange the values in ascending order. 6000, 10000, 10000, 14000, 50000 • Step 2. Find the middle position of the distribution by using (n + 1) / 2. Middle position = (5 + 1) / 2 = 6 / 2 = 3 • Therefore, the median will be the value at the third observation. • Step 3. Identify the value at the middle position. Third observation = 10000
  • 11.
    Example A: EvenNumber of Observations Find the median of the following 6000, 10000, 14000, 50000, 10000, 12000 • Step 1. Arrange the values in ascending order. 6000, 10000, 10000, 12000, 14000, 50000 • Step 2. Find the middle position of the distribution by using (n + 1) / 2. Middle position = (6 + 1) / 2 = 7 / 2 = 3.5 • Step 3. Identify the value at the middle position. The median equals the average of the values of the third (value = 10000) and fourth (value = 12000 observations: Median = (10000 + 12000) / 2 = 11000
  • 12.
    Properties of Median 1.The median is used when one must find the center or middle value 2. The median is used when one must determine whether the data values fall into the upper half or lower half of the distribution 3. The median is affected less than mean by extremely high or extremely low values
  • 13.
    Mode is thevalue that occurs most often in a set of data. It can be determined simply by tallying the number of times each value occurs.
  • 14.
    Mode In this casesalary 10000 is the value that occurs most frequently. The mode is 10000 It should be noted that there can be more than one mode for a data set
  • 15.
    Properties of Mode 1.The mode is used when the most typical case is desired 2. The mode is the easiest to compute 3. The mode can be used when the data are nominal such as religious preference, gender, or political affiliation 4. The mode is not always unique. A data set can have more than one mode, or the mode may not exist for a data set
  • 16.
    Find the meanof the following incubation periods for hepatitis A: 27, 31, 15, 30, and 22 days. • Step 1. Arrange the values in ascending order distribution. 15, 22, 27, 30, 31 Step 2. Add all of the observed values in the distribution. 15 + 22 + 27 + 30 + 31 = 125 • Step 3. Divide the sum by the number of observations. 125 / 5 = 25.0 • Therefore, the mean incubation period is 25.0 days.
  • 17.
    Example B: EvenNumber of Observations Suppose a sixth case of hepatitis was reported. hepatitis A: 27, 31, 15, 30, 22 and 29 days. • Step 1. Arrange the values in ascending order. 15, 22, 27, 29, 30, and 31 days • Step 2. Find the middle position of the distribution by using (n + 1) / 2. Middle location = 6 + 1 / 2 = 7 / 2 = 3½ • Step 3. Identify the value at the middle position. The median equals the average of the values of the third (value = 27) and fourth (value = 29) observations: Median = (27 + 29) / 2 = 28 days
  • 18.
    Example B: Findthe mode of the following incubation periods for hepatitis A: 27, 31, 15, 30, and 22 days. • Step 1. Arrange the values in ascending order. 15, 22, 27, 30, and 31 days • Step 2. Identify the value that occurs most often. None • Note: When no value occurs more than once, the distribution is said to have no mode.
  • 19.
    the number ofdoses of diphtheria-pertussis- tetanus (DPT) vaccine each of seventeen 2-year-old children in a particular village received: 0, 0, 1, 1, 2, 2, 2, 3, 3, 3, 3, 3, 3, 4, 4, 4, 4 Two children received no doses; two children received 1 dose; three received 2 doses; six received 3 doses; and four received all 4 doses. Therefore, the mode is 3 doses, because more children received 3 doses than any other number of doses.
  • 20.
    Which measure ofCT should you use ? The Mean is by far the most common measure of CT. It uses all of the information in the sample. This measure is very good when the distribution is symmetrical.
  • 21.
    Mean , Medianand Mode Data: 4000, 4500, 5000, 5500, 6000, 6000, 6500, 7000, 7500 and 8000 Mean = 6000 Median = 6000 Mode = 6000 = Same= Same
  • 22.
    Salary Mean , Medianand Mode= SameMean , Median and Mode= Same Normal Distribution Or Curve
  • 23.
    Which measure ofCT should you use ? If the distribution is skewed or there are extreme values the Mean is artificially pulled towards the extreme value. Age example: 19, 20, 21, 22, 49 Mean=26.2 yrs.Mean=26.2 yrs. Mean=49.2Mean=49.2 Marks example 05, 55, 57, 63, 66
  • 24.
    Which measure ofCT should you use ? Age : 19, 20, 21, 22, 49 Mean=26.2 yrs.Mean=26.2 yrs. Right skewed or Positively skewed
  • 26.
    Which measure ofCT should you use ? Marks 05, 55, 57, 63, 66 Mean=49.2Mean=49.2 Left skewed or Negatively skewed
  • 28.
    Which measure ofCT should you use ? • If the distribution is skewed or there are extreme values, in such a case Median proves to be better measure of the CT. • Median is resistant to extreme observations.
  • 29.
    Which measure ofCT should you use ? • Mode is commonly used as a measure of popularity that reflect CT of Opinion • Examples: 1. Most preferred pain killer 2. Most preferred model of washing machine 3. Most popular candidate
  • 30.
    Most fighting cricketteam • Pakistan=1 • Australia=2 • India=3 • England=4 1, 2, 4, 1, 2, 1, 3, 1, 4, 1,1, 2, 4, 1, 2, 1, 3, 1, 4, 1, 2, 1, 3, 2, 4, 4, 1, 1, 1, 4,2, 1, 3, 2, 4, 4, 1, 1, 1, 4, 3, 1, 1, 4, 2, 1, 1, 2, 1, 2,3, 1, 1, 4, 2, 1, 1, 2, 1, 2, 1, 4, 1, 1, 3, 2, 4, 1, 4, 11, 4, 1, 1, 3, 2, 4, 1, 4, 1 Which measure of CT should you use ?Mean(2.075) MODE 19 88 44 99 Median(2) Mode(1)
  • 31.
  • 32.
    Range The range isthe simplest measure of variation to find. It is simply the highest value minus the lowest value. RANGE = MAXIMUM - MINIMUM Since the range only uses the largest and smallest values, it is greatly affected by extreme values, that is - it is not resistant to change.
  • 33.
    Variance (σ2 ) The Varianceis defined as: The average of the squared differences from the Mean. σ2  = Σ (Xi - x̄)2  / N-1 (if sample size ≤ 30) σ2  = Σ (Xi - x̄)2  / N
  • 34.
    Standard deviation (σ) TheStandard Deviation is a measure of how spread out numbers are. Its symbol is σ (the greek letter sigma) The formula is easy: it is the square root of the Variance.  σ = √σ2
  • 35.
    Coefficient of variance (Cv) The coefficientof variation represents the ratio of the standard deviation to the mean, and it is a useful statistic for comparing the degree of variation from one data series to another, even if the means are drastically different from each other Cv = Standard Deviation x 100 Mean