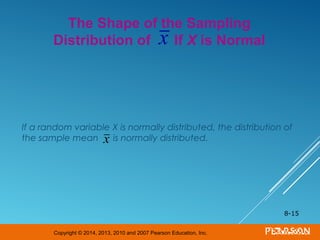
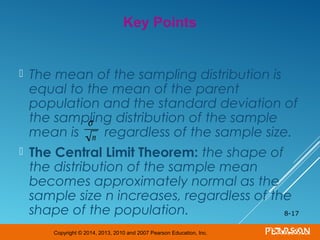
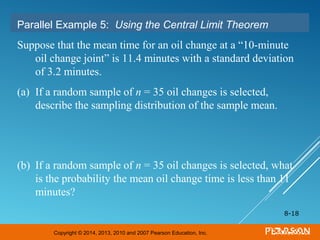
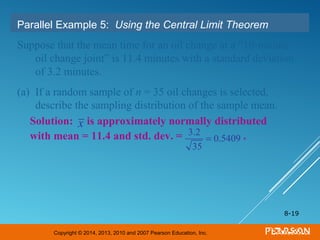
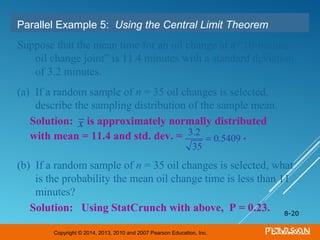
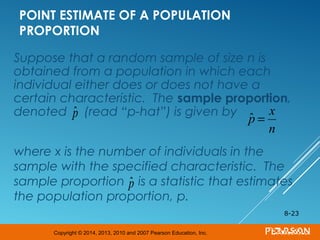
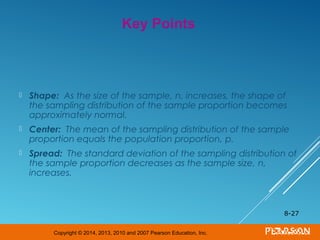
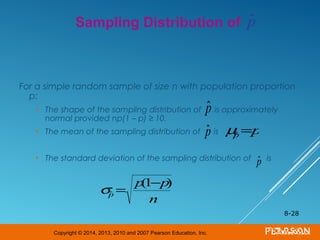
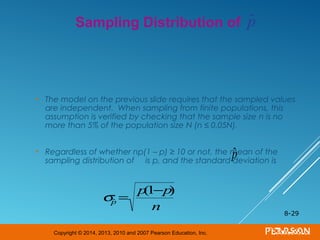
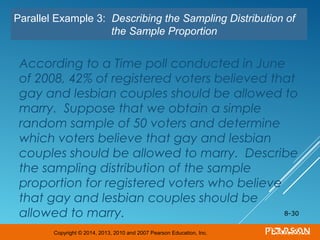
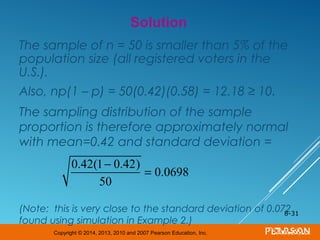
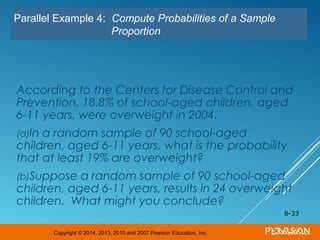
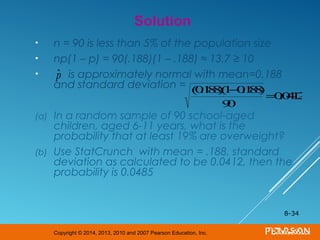
This document discusses sampling distributions and their properties. It begins by describing the distribution of the sample mean for both normal and non-normal populations. As sample size increases, the distribution of the sample mean approaches a normal distribution regardless of the population distribution. The document then discusses the sampling distribution of the sample proportion. For large samples, this distribution is approximately normal with mean equal to the population proportion and standard deviation inversely related to sample size. Examples are provided to illustrate computing sample proportions and probabilities involving sampling distributions.
Basic introduction to sampling distributions with focus on sample means.
Objectives to describe distributions for sample means from normal and nonnormal populations.
Coin collection histogram and simulation to obtain means, leading to sampling distributions.
Discussion on statistics as random variables and their associated probability distributions.Steps to obtain a simple random sample, compute its mean, and repeat the sample process.
Objectives covering normal population effects on sample mean distributions and standard errors.
Explains mean equality in sampling distributions and Central Limit Theorem's effects on the shape.
Practical application example involving oil change times and distribution sampling calculations.
Introduces objectives on how to describe and compute probabilities of sampling distributions.
Describes sample proportion calculations based on survey data on voter approval ratings.
Discusses the characteristics of sampling distribution of proportions, including shape and standard error.
Describes sampling distributions for proportions based on specific poll data regarding marriage.
Example scenarios calculating probabilities relating to overweight children based on sample proportions.