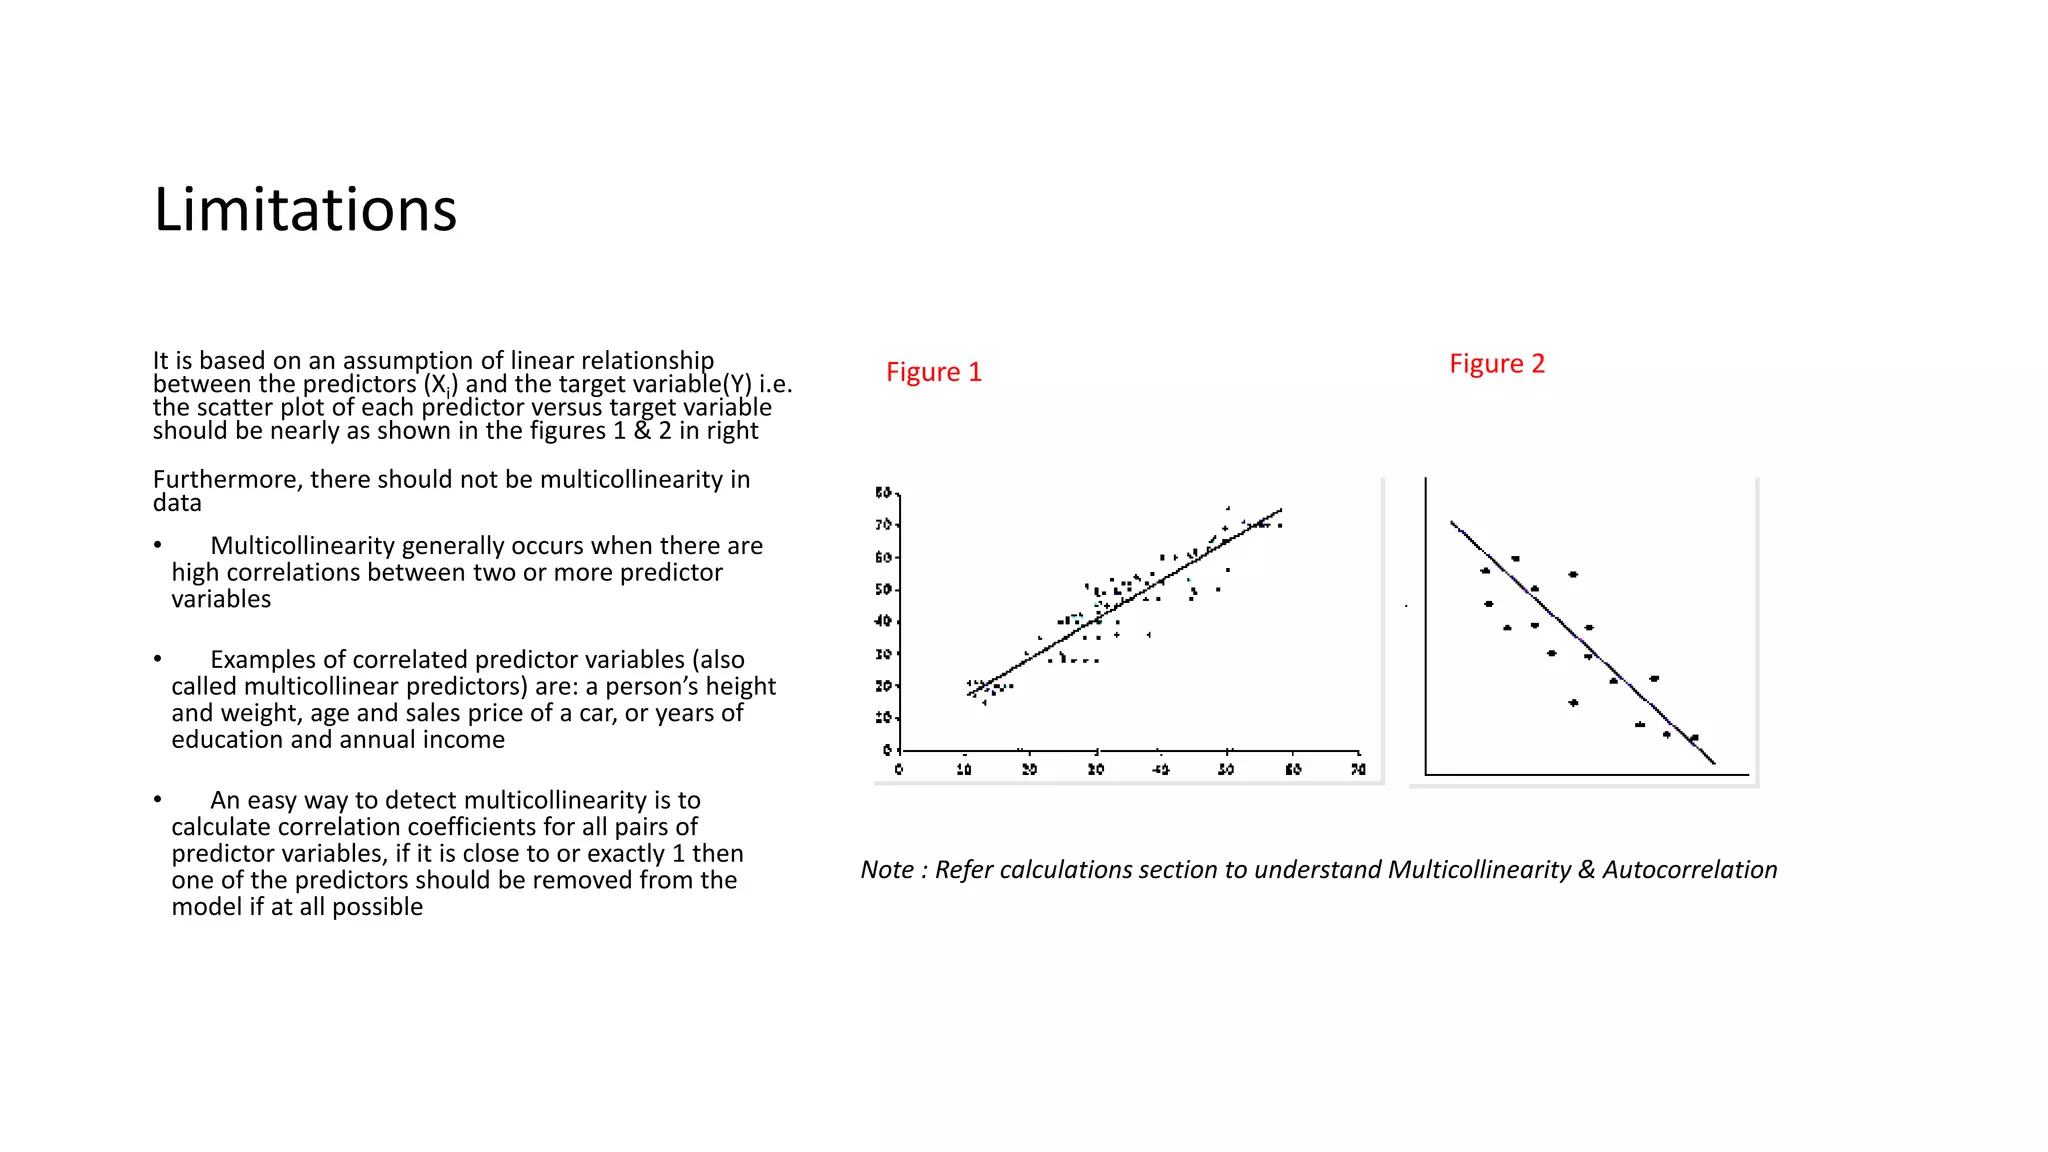
TIME SERIES FORECASTING
AUTOREGRESSIVE INTEGRATED MOVING AVERAGE
WITH EXOGENOUS VARIABLES (ARIMAX)
A Simplistic Explainer Series For Citizen Data Scientists
J o u r n e y T o w a r d s A u g m e n t e d A n a l y t i c s
Introduction with
Example
Introduction
• An Autoregressive Integrated Moving Average with Explanatory Variable (ARIMAX) model
can be viewed as a multiple regression model with one or more autoregressive (AR) terms
and/or one or more moving average (MA) terms
• This method is suitable for forecasting when data is stationary/non stationary, Multivariate
and has any type of data pattern : level/trend /seasonality/cyclicity
• ARIMAX is simply an ARIMA with additional explanatory variables in categorical and/or
numeric format
Example
Let’s take an example of year wise
GDP values of India
As shown in figure below, the plot of
these data suggests that this is non
stationary data with upward trend
Hence, we can choose ARIMAX
algorithm for forecasting GDP as there
would be more than one variable
affecting the GDP
Actual GDP (Trillion)
Years GDP
Y1 0.35
Y2 0.38
Y3 0.39
Y4 0.40
Y5 0.44
Y6 0.50
Y7 0.58
Y8 0.60
Y9 0.64
Y10 0.70
Forecasted GDP (Trillion)
Y11 0.82
Y12 0.94
Y13 1.00
Y14 1.22
Y15 1.42
Standard tuning
parameters
Standard tuning parameters
Model
parameters :
In ARIMA, there are mainly three parameters
to be set to fit the model :
•p: This is the component to apply autoregressive model
on series
•d: This is the component to apply differencing on series :
Basically it converts non stationary data to stationary
( stationary series : the series remains at a fairly constant
level over time)
•q: This is the component to apply moving average model
on series
Model
approach
In ARIMAX, there are two approaches to fitting a
model : Automatic and Manual
When p, d and q are automatically selected by
system than it’s called automatic approach and
when p, d and q are manually input by user than
it’s called manual approach
For better forecasts, automatic approach should
be chosen, as in this approach, model
automatically selects and applies the right
parameters based on the nature of data
Forecast period
For both type of approaches , user has to input
the forecast period value
For example, if user wants to predict the sales
value for 10 periods ahead then this value should
be input as 10
Note : Refer calculations section to understand the
model parameters
Sample UI For
Input/Tuning
Parameters And Output
Sample UI For Selecting Inputs
And Applying Tuning Parameters
Select the variable you would like to Forecast
Year
GDP
Consumer Inflation
Wholesale Inflation
Industrial Index of Production
4
1
In step 3 , user can select more
than one predictor
In step 4 , if user changes the
approach to Manual then this
box should be displayed, with
additional provision to set p ,d ,q
values
Tuning parameters
Approach
Forecast
Period
Automatic
Approach
Forecast
Period
AR(p)
I(d)
MA(q)
Manual
By default this box should be
displayed with default approach
as Automatic. In this case
parameters to fit ARIMAX will be
automatically detected and
applied by algorithm
Select the time stamp
Year
GDP
Consumer Inflation
Wholesale Inflation
Industrial Index of Production
Select the predictors
Year
GDP
Consumer Inflation
Wholesale Inflation
Industrial Index of Production
3
Sample UI For Output
MAPE should not exceed beyond 10 % as it
represents the margin of error in forecasting
Accuracy shows how much accurate the
forecasts are, ideally it should be greater
than or equal to 90% else there is a need to
revise and fine tune the model (apply some
transformations on input data , check if basic
assumptions of ARIMAX are met, etc.)
Actual GDP (Trillion)
Years GDP
Y1 0.35
Y2 0.38
Y3 0.39
Y4 0.40
Y5 0.44
Y6 0.50
Y7 0.58
Y8 0.60
Y9 0.64
Y10 0.70
Forecasted GDP (Trillion)
Y11 0.82
Y12 0.94
Y13 1.00
Y14 1.22
Y15 1.42
Output will be forecasted values based on user specified time period
along with line charts showing actual and forecasted series and
prediction accuracy
Limitations
Limitations
It is based on an assumption of linear relationship
between the predictors (Xi) and the target variable(Y) i.e.
the scatter plot of each predictor versus target variable
should be nearly as shown in the figures 1 & 2 in right
Furthermore, there should not be multicollinearity in
data
• Multicollinearity generally occurs when there are
high correlations between two or more predictor
variables
• Examples of correlated predictor variables (also
called multicollinear predictors) are: a person’s height
and weight, age and sales price of a car, or years of
education and annual income
• An easy way to detect multicollinearity is to
calculate correlation coefficients for all pairs of
predictor variables, if it is close to or exactly 1 then
one of the predictors should be removed from the
model if at all possible
Note : Refer calculations section to understand Multicollinearity & Autocorrelation
Figure 1 Figure 2
Limitations
The Forecast error also known as
“Residuals” should show nearly
constant trend over time i.e. it
should be time independent as
shown in the figure 1 below in
contrast to the increasing/
decreasing trend shown in figure 2
below:
Note : Refer calculations section to understand Multicollinearity & Autocorrelation
Time dependent error ( decreasing with time)Time independent error ( fairly constant over
time & lying within certain range)
Figure 1 Figure 2
Business use case
Business use case
Business benefit:
•For various combination of
GDP/Consumer Inflation and Population
growth rates , company would be able to
forecast its product growth
•Moreover , company can analyze the gap
between targeted and estimated growth
and decide upon the strategy to reduce
this gap and achieve desired results
Business problem :
•A company wants to forecast its product
line growth for next couple of years
based on past 30 years’ yearly data
•The predictor variables in this case
would be as follows:
•Yearly consumer inflation rate
•Yearly GDP data
•Yearly population growth rate
•Data pattern : Input data exhibits non
stationarity , an upward trend pattern
as well as seasonality
Calculations
Calculations - Autoregression (AR)
• In an autoregressive model, which is one of the components in ARIMAX model, we
forecast the variable of interest using a linear combination of past values of the variable
• The term autoregression indicates that it is a regression of the variable against itself
• An autoregressive model of order p, denoted by AR(p) model, can be written as
where ,
c is a constant,
∅ is lag’s coefficient,
𝐞 𝒕 is an error term,
𝐩 is autoregressive model of order
• This is like a multiple regression but with lagged values of yt as predictors
• Order of this component (order of autoregression : AR) is given by parameter p while
fitting the model : ARIMAX (p,d, q)
Lagged values : past values of the variable
Calculations - Integration (I) / Differencing (d)
• The second component of ARIMAX model i.e. I (for "integration") , is
used to replace the series with the difference between their current
values and the previous values (and this differencing process can be
performed more than once as per the requirement )
• For example,
• The equation for first order differencing is 𝒚 𝒕 = 𝒚 𝒕 − 𝒚 𝒕−𝟏
• Hence, for 𝒚 𝒕 =2 and 𝒚 𝒕−𝟏 = 1 ; 𝒚 𝒕 will be 1
• Similarly second order differencing , 𝒚 𝒕 = (𝒚 𝒕 − 𝒚 𝒕−𝟏) −(𝒚 𝒕−𝟏 −
𝒚 𝒕−𝟐)
• Order of this component (order of differencing) is applied by
parameter d while fitting a model : ARIMAX (p,d,q)
Calculations - Moving average (MA)
• A moving average model, the third component in ARIMAX uses past
forecast errors as a series in a model
• A Moving average model of order q, denoted by MA(q) model, can be
written as
where ,
yt is predictor ,
c is a constant,
θ is lag’s coefficient,
𝐞 𝒕 is an error term,
q is moving average order
• Order of this component (order of moving average : MA ) is applied by
parameter q while fitting a model : ARIMAX (p ,d ,q )
Calculations - Exogenous variables (X)
• ARIMAX is the simply an ARIMA model with the inclusion of
exogenous variables (additional explanatory variables/predictors)
• It means you simply add one or more explanatory variables/
regressors to the forecasting equation
• For example, predictors such as Consumer Price Index , Producer Price
Index and Employment Statistics which directly/indirectly impacts the
GDP can be considered as exogenous variables to forecast the GDP
using ARIMAX
Identification of p,d,q values
• Values of p and q are determined based on the autocorrelation(ACF) and partial auto correlation(PACF) plots
and value of d depends on level of stationarity in data
• In PACF plot, number of spikes indicate the order of the autoregression/AR (value of p in ARIMAX(p,d,q))
• For instance, as you can see in the right figure below, there is one spike falling out of range, hence, the order
of AR i.e. value of p would be 1
• In ACF plot, number of spikes indicate the order of the moving average (value of q in ARIMAX(p,d,q))
• For instance , as you can see in the left figure there are five spikes falling out of range, hence, the order of
MA i.e. value of q would be 5
Identification of p,d,q values
 Thus, p, d and q parameters in ARIMAX(p , d , q) are substituted with integer values where p and q take
any values between 0 to 5 and value of d is set between 0 to 2
 For example, ARIMAX(2,1,1) means that you have a second order autoregressive model with a first
order moving average component and series has been differenced once to induce stationarity
 A value of 0 can be used for any of the above mentioned parameters indicating that particular
component (AR/ I/ MA) should not be used. This way, the ARIMAX model can be configured to perform
the function of an ARMAX model, and even a simple AR, I, or MA model depending on the data
Other default parameters
• Below are the other default parameters while taking manual approach of
fitting the model :
• Max Lag : The maximum lag order should be set to 20 (up to which lag you are asking
the model to check ACF and PACF plots to set the p, d and q parameters)
• Include Original Xreg : Value of a boolean flag indicating if the non-lagged predictors
should be included in the model. Default should be set to True
• True: Fit ARIMAX model on data using the matrix of predictors (Xi)
• False : Fit ARIMA model on data excluding the matrix of predictors (Xi)
• Include Intercept : Value of a boolean flag indicating if the model should be fit with
an intercept term. Default should be set to True
• True : The final equation (model) will have a constant term added
• False : The final equation (model) will not have any constant term added
• -> This is an adjustment factor which is constant over time , value of true/false depends on
the underlying business problem
Here intercept is minimum forecasted value considering all Xi=0
Other Default Parameters
Include Intercept :
For instance , below are
the examples of forecasts
with and without
intercept for rainfall
forecasting model :
Multicollinearity & Autocorrelation
• Multicollinearity means correlation between one or more predictors
• Variance Inflation Factor test is used to detect Multicollinearity in data
o For instance , VIF >5 depicts multicollinearity and hence one or more correlated variables
which are not significant for business should be dropped from the analysis
o Alternatively , predictors can be standardized([(x-min(x)/max(x)-min(x)] ) to reduce the
multicollinearity
• Auto correlated residuals mean a linear relationship between consecutive residuals
• To check autocorrelation Durbin–Watson test is conducted
o For instance, at 95% confidence interval, if p value <0.05 , then we conclude that auto
correlation exists in residuals. If p value >0.05 then auto correlation does not exist in residuals
Example
• The automatic approach will select ideal values of
Auto regression(p), differencing(d) and moving
average(q) parameters based on the data pattern
• For instance, if there is non stationarity in data, the
algorithm will apply differencing(d) by applying d=1 in
order to make it stationary
• In case of manual approach, user will select optimum
values of p, d and q parameters, which gives minimum
value for MAPE (Mean absolute percentage error) in
order to get better accuracy. This is a bit iterative
process as there may be many iterations involved till
the desired accuracy is achieved
• After the ARIMAX model is run, it will provide
forecasted values of target variable(GDP) for user
specified periods ahead , let’s say 5 as shown in blue
text in table: Forecasted values
Actual GDP (Trillion)
Years GDP
Y1 0.35
Y2 0.38
Y3 0.39
Y4 0.40
Y5 0.44
Y6 0.50
Y7 0.58
Y8 0.60
Y9 0.64
Y10 0.70
Forecasted GDP (Trillion)
Y11 0.82
Y12 0.94
Y13 1.00
Y14 1.22
Y15 1.42
Model Accuracy
• Along with forecasted values, MAPE and prediction accuracy is displayed so user knows how much accurate the forecasts
are
• How MAPE and Accuracy is calculated is explained below :
• Using this formula , MAPE can be calculated for 5 years ahead forecasts using recent most 5 years’ actual and predicted
data as shown in table below:
MAPE :
Where Yt is the actual, known series value for time period t,
Y^t is the forecast value of the variable Y for time period t
N is number of observations
MAPE = 7%
Hence accuracy = 100-MAPE = 93% , So model is accurate
Years Actual Y Predicted Y^ Abs((Actual - predicted)/actual)*100
Y11 0.5 0.49 2.00
Y12 0.58 0.57 1.72
Y13 0.6 0.61 1.67
Y14 0.64 0.64 0.00
Y15 0.7 0.69 1.43
MAPE = Sum(Y11 to Y15) =07
Accuracy =100-MAPE=93
Want to Learn
More?
Get in touch with us @
support@Smarten.com
And Do Checkout the Learning section
on
Smarten.com
June 2018

What is ARIMAX Forecasting and How is it Used for Enterprise Analysis?

  • 1.
    TIME SERIES FORECASTING AUTOREGRESSIVEINTEGRATED MOVING AVERAGE WITH EXOGENOUS VARIABLES (ARIMAX) A Simplistic Explainer Series For Citizen Data Scientists J o u r n e y T o w a r d s A u g m e n t e d A n a l y t i c s
  • 2.
  • 3.
    Introduction • An AutoregressiveIntegrated Moving Average with Explanatory Variable (ARIMAX) model can be viewed as a multiple regression model with one or more autoregressive (AR) terms and/or one or more moving average (MA) terms • This method is suitable for forecasting when data is stationary/non stationary, Multivariate and has any type of data pattern : level/trend /seasonality/cyclicity • ARIMAX is simply an ARIMA with additional explanatory variables in categorical and/or numeric format
  • 4.
    Example Let’s take anexample of year wise GDP values of India As shown in figure below, the plot of these data suggests that this is non stationary data with upward trend Hence, we can choose ARIMAX algorithm for forecasting GDP as there would be more than one variable affecting the GDP Actual GDP (Trillion) Years GDP Y1 0.35 Y2 0.38 Y3 0.39 Y4 0.40 Y5 0.44 Y6 0.50 Y7 0.58 Y8 0.60 Y9 0.64 Y10 0.70 Forecasted GDP (Trillion) Y11 0.82 Y12 0.94 Y13 1.00 Y14 1.22 Y15 1.42
  • 5.
  • 6.
    Standard tuning parameters Model parameters: In ARIMA, there are mainly three parameters to be set to fit the model : •p: This is the component to apply autoregressive model on series •d: This is the component to apply differencing on series : Basically it converts non stationary data to stationary ( stationary series : the series remains at a fairly constant level over time) •q: This is the component to apply moving average model on series Model approach In ARIMAX, there are two approaches to fitting a model : Automatic and Manual When p, d and q are automatically selected by system than it’s called automatic approach and when p, d and q are manually input by user than it’s called manual approach For better forecasts, automatic approach should be chosen, as in this approach, model automatically selects and applies the right parameters based on the nature of data Forecast period For both type of approaches , user has to input the forecast period value For example, if user wants to predict the sales value for 10 periods ahead then this value should be input as 10 Note : Refer calculations section to understand the model parameters
  • 7.
  • 8.
    Sample UI ForSelecting Inputs And Applying Tuning Parameters Select the variable you would like to Forecast Year GDP Consumer Inflation Wholesale Inflation Industrial Index of Production 4 1 In step 3 , user can select more than one predictor In step 4 , if user changes the approach to Manual then this box should be displayed, with additional provision to set p ,d ,q values Tuning parameters Approach Forecast Period Automatic Approach Forecast Period AR(p) I(d) MA(q) Manual By default this box should be displayed with default approach as Automatic. In this case parameters to fit ARIMAX will be automatically detected and applied by algorithm Select the time stamp Year GDP Consumer Inflation Wholesale Inflation Industrial Index of Production Select the predictors Year GDP Consumer Inflation Wholesale Inflation Industrial Index of Production 3
  • 9.
    Sample UI ForOutput MAPE should not exceed beyond 10 % as it represents the margin of error in forecasting Accuracy shows how much accurate the forecasts are, ideally it should be greater than or equal to 90% else there is a need to revise and fine tune the model (apply some transformations on input data , check if basic assumptions of ARIMAX are met, etc.) Actual GDP (Trillion) Years GDP Y1 0.35 Y2 0.38 Y3 0.39 Y4 0.40 Y5 0.44 Y6 0.50 Y7 0.58 Y8 0.60 Y9 0.64 Y10 0.70 Forecasted GDP (Trillion) Y11 0.82 Y12 0.94 Y13 1.00 Y14 1.22 Y15 1.42 Output will be forecasted values based on user specified time period along with line charts showing actual and forecasted series and prediction accuracy
  • 10.
  • 11.
    Limitations It is basedon an assumption of linear relationship between the predictors (Xi) and the target variable(Y) i.e. the scatter plot of each predictor versus target variable should be nearly as shown in the figures 1 & 2 in right Furthermore, there should not be multicollinearity in data • Multicollinearity generally occurs when there are high correlations between two or more predictor variables • Examples of correlated predictor variables (also called multicollinear predictors) are: a person’s height and weight, age and sales price of a car, or years of education and annual income • An easy way to detect multicollinearity is to calculate correlation coefficients for all pairs of predictor variables, if it is close to or exactly 1 then one of the predictors should be removed from the model if at all possible Note : Refer calculations section to understand Multicollinearity & Autocorrelation Figure 1 Figure 2
  • 12.
    Limitations The Forecast erroralso known as “Residuals” should show nearly constant trend over time i.e. it should be time independent as shown in the figure 1 below in contrast to the increasing/ decreasing trend shown in figure 2 below: Note : Refer calculations section to understand Multicollinearity & Autocorrelation Time dependent error ( decreasing with time)Time independent error ( fairly constant over time & lying within certain range) Figure 1 Figure 2
  • 13.
  • 14.
    Business use case Businessbenefit: •For various combination of GDP/Consumer Inflation and Population growth rates , company would be able to forecast its product growth •Moreover , company can analyze the gap between targeted and estimated growth and decide upon the strategy to reduce this gap and achieve desired results Business problem : •A company wants to forecast its product line growth for next couple of years based on past 30 years’ yearly data •The predictor variables in this case would be as follows: •Yearly consumer inflation rate •Yearly GDP data •Yearly population growth rate •Data pattern : Input data exhibits non stationarity , an upward trend pattern as well as seasonality
  • 15.
  • 16.
    Calculations - Autoregression(AR) • In an autoregressive model, which is one of the components in ARIMAX model, we forecast the variable of interest using a linear combination of past values of the variable • The term autoregression indicates that it is a regression of the variable against itself • An autoregressive model of order p, denoted by AR(p) model, can be written as where , c is a constant, ∅ is lag’s coefficient, 𝐞 𝒕 is an error term, 𝐩 is autoregressive model of order • This is like a multiple regression but with lagged values of yt as predictors • Order of this component (order of autoregression : AR) is given by parameter p while fitting the model : ARIMAX (p,d, q) Lagged values : past values of the variable
  • 17.
    Calculations - Integration(I) / Differencing (d) • The second component of ARIMAX model i.e. I (for "integration") , is used to replace the series with the difference between their current values and the previous values (and this differencing process can be performed more than once as per the requirement ) • For example, • The equation for first order differencing is 𝒚 𝒕 = 𝒚 𝒕 − 𝒚 𝒕−𝟏 • Hence, for 𝒚 𝒕 =2 and 𝒚 𝒕−𝟏 = 1 ; 𝒚 𝒕 will be 1 • Similarly second order differencing , 𝒚 𝒕 = (𝒚 𝒕 − 𝒚 𝒕−𝟏) −(𝒚 𝒕−𝟏 − 𝒚 𝒕−𝟐) • Order of this component (order of differencing) is applied by parameter d while fitting a model : ARIMAX (p,d,q)
  • 18.
    Calculations - Movingaverage (MA) • A moving average model, the third component in ARIMAX uses past forecast errors as a series in a model • A Moving average model of order q, denoted by MA(q) model, can be written as where , yt is predictor , c is a constant, θ is lag’s coefficient, 𝐞 𝒕 is an error term, q is moving average order • Order of this component (order of moving average : MA ) is applied by parameter q while fitting a model : ARIMAX (p ,d ,q )
  • 19.
    Calculations - Exogenousvariables (X) • ARIMAX is the simply an ARIMA model with the inclusion of exogenous variables (additional explanatory variables/predictors) • It means you simply add one or more explanatory variables/ regressors to the forecasting equation • For example, predictors such as Consumer Price Index , Producer Price Index and Employment Statistics which directly/indirectly impacts the GDP can be considered as exogenous variables to forecast the GDP using ARIMAX
  • 20.
    Identification of p,d,qvalues • Values of p and q are determined based on the autocorrelation(ACF) and partial auto correlation(PACF) plots and value of d depends on level of stationarity in data • In PACF plot, number of spikes indicate the order of the autoregression/AR (value of p in ARIMAX(p,d,q)) • For instance, as you can see in the right figure below, there is one spike falling out of range, hence, the order of AR i.e. value of p would be 1 • In ACF plot, number of spikes indicate the order of the moving average (value of q in ARIMAX(p,d,q)) • For instance , as you can see in the left figure there are five spikes falling out of range, hence, the order of MA i.e. value of q would be 5
  • 21.
    Identification of p,d,qvalues  Thus, p, d and q parameters in ARIMAX(p , d , q) are substituted with integer values where p and q take any values between 0 to 5 and value of d is set between 0 to 2  For example, ARIMAX(2,1,1) means that you have a second order autoregressive model with a first order moving average component and series has been differenced once to induce stationarity  A value of 0 can be used for any of the above mentioned parameters indicating that particular component (AR/ I/ MA) should not be used. This way, the ARIMAX model can be configured to perform the function of an ARMAX model, and even a simple AR, I, or MA model depending on the data
  • 22.
    Other default parameters •Below are the other default parameters while taking manual approach of fitting the model : • Max Lag : The maximum lag order should be set to 20 (up to which lag you are asking the model to check ACF and PACF plots to set the p, d and q parameters) • Include Original Xreg : Value of a boolean flag indicating if the non-lagged predictors should be included in the model. Default should be set to True • True: Fit ARIMAX model on data using the matrix of predictors (Xi) • False : Fit ARIMA model on data excluding the matrix of predictors (Xi) • Include Intercept : Value of a boolean flag indicating if the model should be fit with an intercept term. Default should be set to True • True : The final equation (model) will have a constant term added • False : The final equation (model) will not have any constant term added • -> This is an adjustment factor which is constant over time , value of true/false depends on the underlying business problem Here intercept is minimum forecasted value considering all Xi=0
  • 23.
    Other Default Parameters IncludeIntercept : For instance , below are the examples of forecasts with and without intercept for rainfall forecasting model :
  • 24.
    Multicollinearity & Autocorrelation •Multicollinearity means correlation between one or more predictors • Variance Inflation Factor test is used to detect Multicollinearity in data o For instance , VIF >5 depicts multicollinearity and hence one or more correlated variables which are not significant for business should be dropped from the analysis o Alternatively , predictors can be standardized([(x-min(x)/max(x)-min(x)] ) to reduce the multicollinearity • Auto correlated residuals mean a linear relationship between consecutive residuals • To check autocorrelation Durbin–Watson test is conducted o For instance, at 95% confidence interval, if p value <0.05 , then we conclude that auto correlation exists in residuals. If p value >0.05 then auto correlation does not exist in residuals
  • 25.
    Example • The automaticapproach will select ideal values of Auto regression(p), differencing(d) and moving average(q) parameters based on the data pattern • For instance, if there is non stationarity in data, the algorithm will apply differencing(d) by applying d=1 in order to make it stationary • In case of manual approach, user will select optimum values of p, d and q parameters, which gives minimum value for MAPE (Mean absolute percentage error) in order to get better accuracy. This is a bit iterative process as there may be many iterations involved till the desired accuracy is achieved • After the ARIMAX model is run, it will provide forecasted values of target variable(GDP) for user specified periods ahead , let’s say 5 as shown in blue text in table: Forecasted values Actual GDP (Trillion) Years GDP Y1 0.35 Y2 0.38 Y3 0.39 Y4 0.40 Y5 0.44 Y6 0.50 Y7 0.58 Y8 0.60 Y9 0.64 Y10 0.70 Forecasted GDP (Trillion) Y11 0.82 Y12 0.94 Y13 1.00 Y14 1.22 Y15 1.42
  • 26.
    Model Accuracy • Alongwith forecasted values, MAPE and prediction accuracy is displayed so user knows how much accurate the forecasts are • How MAPE and Accuracy is calculated is explained below : • Using this formula , MAPE can be calculated for 5 years ahead forecasts using recent most 5 years’ actual and predicted data as shown in table below: MAPE : Where Yt is the actual, known series value for time period t, Y^t is the forecast value of the variable Y for time period t N is number of observations MAPE = 7% Hence accuracy = 100-MAPE = 93% , So model is accurate Years Actual Y Predicted Y^ Abs((Actual - predicted)/actual)*100 Y11 0.5 0.49 2.00 Y12 0.58 0.57 1.72 Y13 0.6 0.61 1.67 Y14 0.64 0.64 0.00 Y15 0.7 0.69 1.43 MAPE = Sum(Y11 to Y15) =07 Accuracy =100-MAPE=93
  • 27.
    Want to Learn More? Getin touch with us @ support@Smarten.com And Do Checkout the Learning section on Smarten.com June 2018