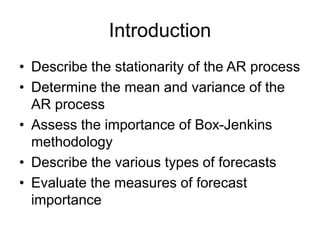
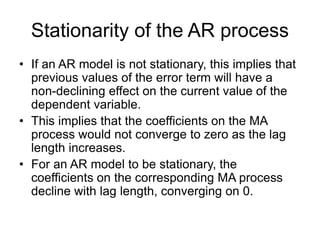
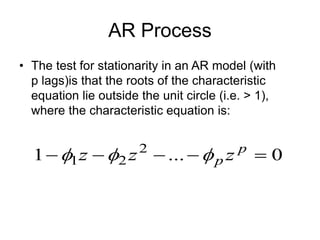
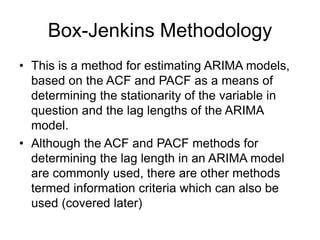
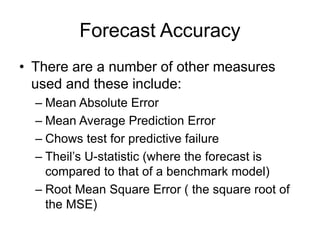
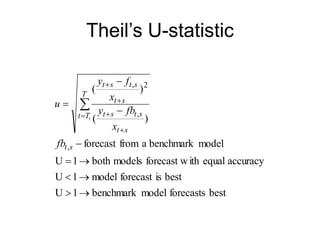
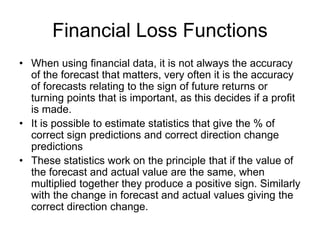
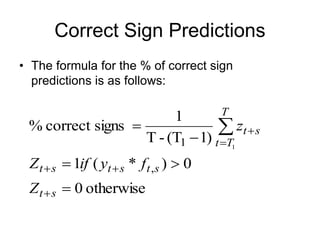
SlideShare a Scribd company logo
1 of 30
ARIMA Modelling and
Forecasting
Introduction
• Describe the stationarity of the AR process
• Determine the mean and variance of the
AR process
• Assess the importance of Box-Jenkins
methodology
• Describe the various types of forecasts
• Evaluate the measures of forecast
importance
Stationarity of the AR process
• If an AR model is not stationary, this implies that
previous values of the error term will have a
non-declining effect on the current value of the
dependent variable.
• This implies that the coefficients on the MA
process would not converge to zero as the lag
length increases.
• For an AR model to be stationary, the
coefficients on the corresponding MA process
decline with lag length, converging on 0.
AR Process
• The test for stationarity in an AR model (with
p lags)is that the roots of the characteristic
equation lie outside the unit circle (i.e. > 1),
where the characteristic equation is:
0
...
1 2
2
1 



 p
p z
z
z 


Unit Root
• When testing for stationarity for any
variable, we describe it as testing for a
‘unit root’, this is based on this same idea.
• The most basic AR model is the AR(1)
model, on which most tests for stationarity
are based, such as the Dickey-Fuller test
(covered later)
Unit Root Test
equation)
stic
characteri
(
0
)
1
(
)
1
(
1







 
z
u
y
L
u
Ly
y
u
y
y
t
t
t
t
t
t
t
t
Unit Root Test
• With the AR(1) model, the characteristic
equation of (1-z)= 0, suggests that it has a root
of z = 1. This lies on the unit circle, rather than
outside it, so we conclude that it is non-
stationary.
• As we increase the lags in the AR model, so the
potential number of roots increases, so for 2
lags, we have a quadratic equation producing 2
roots, for the model to be stationary, they both
need to lie outside the unit circle.
AR Process
• The (unconditional mean) for an AR(1)
process, with a constant (μ) is given by:
1
1
1
1
)
(
)
1
(









 
t
t
t
t
y
E
AR
u
y
y
AR Process
• The (unconditional) variance for an AR
process of order 1 (excluding the constant)
is:
1
)
1
(
)
var(
1
2
1
2






t
y
Box-Jenkins Methodology
• This is a method for estimating ARIMA models,
based on the ACF and PACF as a means of
determining the stationarity of the variable in
question and the lag lengths of the ARIMA
model.
• Although the ACF and PACF methods for
determining the lag length in an ARIMA model
are commonly used, there are other methods
termed information criteria which can also be
used (covered later)
Box-Jenkins
• The Box-Jenkins approach typically
comprises four parts:
- Identification of the model
- Estimation, usually OLS
-Diagnostic checking (mostly for
autocorrelation)
- Forecasting
ACF and PACF
•
•
• Autocorrelation Partial Correlation AC PAC Q-Stat Prob
•
•
• . |*. | . |*. | 1 0.093 0.093 0.7580 0.384
• .*| . | .*| . | 2 -0.073 -0.082 1.2307 0.540
• . | . | . | . | 3 -0.023 -0.008 1.2772 0.735
• .*| . | .*| . | 4 -0.106 -0.111 2.3010 0.681
• . | . | . | . | 5 -0.003 0.016 2.3017 0.806
• . |*. | . |*. | 6 0.140 0.124 4.1334 0.659
• . |*. | . |*. | 7 0.162 0.141 6.6260 0.469
• .*| . | .*| . | 8 -0.103 -0.128 7.6356 0.470
• . | . | . | . | 9 -0.047 -0.003 7.8513 0.549
• .*| . | .*| . | 10 -0.124 -0.117 9.3624 0.498
• . | . | . |*. | 11 0.028 0.088 9.4434 0.581
• . |** | . |*. | 12 0.217 0.166 14.231 0.286
•
•
•
Identification
• Identification of the most appropriate model is
the most important part of the process, where it
becomes as much ‘art’ as ‘science’.
• The first step is to determine if the variable is
stationary, this can be done with the
correlogram. If it is not stationary it needs to be
first-differenced. (it may need to be differenced
again to induce stationarity)
• The next stage is to determine the p and q in the
ARIMA (p, I, q) model (the I refers to how many
times the data needs to be differenced to
produce a stationary series)
Identification
• To determine the appropriate lag structure in the
AR part of the model, the PACF or Partial
correlogram is used, where the number of non-
zero points of the PACF determine where the AR
lags need to be included.
• To determine the MA lag structure, the ACF or
correlogram is used, again the non-zero points
suggest where the lags should be included.
• Seasonal dummy variables may also need to be
included if the data exhibits seasonal effects.
Diagnostic Checks
• With this approach we only test for
autocorrelation usually, using the Q or Ljung-Box
statistic.
• If there is evidence of autocorrelation, we need
to go back to the identification stage and
respecify the model, by adding more lags.
• A criticism of this approach is that it fails to
identify if the model is too big or over-
parameterised, it only tells us if it is too small.
ARIMA Example
• Following the Box-Jenkins methodology, the
following ARIMA(2,1,1) model was produced:
21
.
3
)
2
(
,
12
.
0
R
(0.01)
(0.1)
(0.2)
(0.1)
1
.
0
3
.
0
6
.
0
7
.
0
ˆ
2
1
2
1








 


LB
u
y
y
y t
t
t
t
Parsimonious Model
• The aim of this type of modelling is to produce a
model that is parsimonious, or as small as
possible, whilst passing the diagnostic checks.
• A parsimonious model is desirable because
including irrelevant lags in the model increases
the coefficient standard errors and therefore
reduces the t-statistics.
• Models that incorporate large numbers of lags,
tend not to forecast well, as they fit data specific
features, explaining much of the noise or
random features in the data.
Forecasting
• One of the most important tests of how
well a model performs is how well it
forecasts.
• One of the most useful models for
forecasting is the ARIMA model.
• To produce dynamic forecasts the model
needs to include lags of either the
variables or error terms.
Types of Forecast
• Forecasts can be either in-sample or out-
of-sample forecasts.
• In general the out-of sample forecasts are
a better test of how well the model works,
as the forecast uses data not included in
the estimation of the model.
• To conduct out-of-sample forecasts, we
need to leave some observations at the
end of our sample for this purpose
Types of Forecasts
• A one-step-ahead is a forecast for the next
observation only.
• A multi-step-ahead forecast is for 1,2,3,…s steps
ahead.
• A recursive window for the forecast means that
the initial estimation date is fixed but the
additional observations are added one by one to
the estimation time span.
• A rolling window is where the estimation time
period is fixed but the start and end dates
successively increase by 1.
Conditional Forecasting
• A conditional expectation is one that is taken for
time t + 1, conditional upon or given all information
available up to and including time t (this is
important later). It is written as:
t
y
E
t
t
t
at time
n
informatio
all
)
|
( 1




Measuring Forecast Accuracy
• To determine how accurate a forecast is, the
simplest method is to plot the forecast against
the actual values as a direct comparison
• In addition it may be worthwhile to compare the
turning points, this is particularly important in
finance.
• There are a number of methods to determine
accuracy of the forecast, often more than one is
included in a set of results.
Tests of Forecast Accuracy
• Tests of forecast accuracy are based on the difference
between the forecast of the variables value at time t and
the actual value at time t. The closer the two are together
and the smaller the forecast error, the better the forecast.
• There are a variety of statistics measuring this accuracy,
mostly based on an average of the errors between the
actual and forecast values at time t.
• However these statistics provide little information in
isolation, as they are unbounded from above and their
value depends on the units of the variables being
forecast.
Mean Squared Error (MSE)
• The MSE statistic can be defined as:
t
y
t
f
T
T
f
y
T
T
MSE
s
t
s
t
T
T
t
s
t
s
t
at time
value
actual
the
at time
made
forecasts
ahead
-
step
-
s
n
observatio
forecast
sample
-
of
-
out
first
size
sample
total
)
(
)
1
(
1
,
1
2
,
1 1












MSE Example
Steps
Ahead
Forecast Actual Squared
Error
1 0.1 0.15 0.0025
2 0.25 0.20 0.0025
3 0.5 0.40 0.01
005
.
0
3
/
)
01
.
0
0025
.
0
0025
.
0
( 



MSE
Forecast Accuracy
• There are a number of other measures
used and these include:
– Mean Absolute Error
– Mean Average Prediction Error
– Chows test for predictive failure
– Theil’s U-statistic (where the forecast is
compared to that of a benchmark model)
– Root Mean Square Error ( the square root of
the MSE)
Theil’s U-statistic
best
forecasts
model
benchmark
1
U
best
is
forecast
model
1
U
accuracy
equal
ith
forecast w
models
both
1
U
model
benchmark
a
from
forecast
)
(
)
(
,
,
2
,
1









 





s
t
T
T
t
s
t
s
t
s
t
s
t
s
t
s
t
fb
x
fb
y
x
f
y
u
Financial Loss Functions
• When using financial data, it is not always the accuracy
of the forecast that matters, very often it is the accuracy
of forecasts relating to the sign of future returns or
turning points that is important, as this decides if a profit
is made.
• It is possible to estimate statistics that give the % of
correct sign predictions and correct direction change
predictions
• These statistics work on the principle that if the value of
the forecast and actual value are the same, when
multiplied together they produce a positive sign. Similarly
with the change in forecast and actual values giving the
correct direction change.
Correct Sign Predictions
• The formula for the % of correct sign
predictions is as follows:
otherwise
0
0
)
*
(
1
)
1
(T
-
T
1
signs
correct
%
,
1 1











s
t
s
t
s
t
s
t
T
T
t
s
t
Z
f
y
if
Z
z
Conclusion
• When using AR models, whether the series is
stationary of not determine how stable it is.
• Box-Jenkins methodology is part art and part
science.
• Forecasting of time series is an important
measure of how well a model works
• There are many measures of how accurate a
forecast is, usually a number are calculated to
determine if the forecast is acceptable, although
all have faults.

More Related Content

Similar to ARIMA Model for analysis of time series data.ppt

Forecasting%20Economic%20Series%20using%20ARMA
Forecasting%20Economic%20Series%20using%20ARMAForecasting%20Economic%20Series%20using%20ARMA
Forecasting%20Economic%20Series%20using%20ARMANagendra Belvadi
 
14. Statistical Process Control.pptx
14. Statistical Process Control.pptx14. Statistical Process Control.pptx
14. Statistical Process Control.pptxSarthakGupta856447
 
The Treatment of Uncertainty in Models
The Treatment of Uncertainty in ModelsThe Treatment of Uncertainty in Models
The Treatment of Uncertainty in ModelsIES / IAQM
 
4 26 2013 1 IME 674 Quality Assurance Reliability EXAM TERM PROJECT INFO...
4 26 2013 1 IME 674  Quality Assurance   Reliability EXAM   TERM PROJECT INFO...4 26 2013 1 IME 674  Quality Assurance   Reliability EXAM   TERM PROJECT INFO...
4 26 2013 1 IME 674 Quality Assurance Reliability EXAM TERM PROJECT INFO...Robin Beregovska
 
Time series and panel data in econometrics
Time series and panel data in econometricsTime series and panel data in econometrics
Time series and panel data in econometricsTorajInteaash2
 
Incheon National University - EATED SRA
Incheon National University - EATED SRAIncheon National University - EATED SRA
Incheon National University - EATED SRAssuser58d6dc2
 
Different Models Used In Time Series - InsideAIML
Different Models Used In Time Series - InsideAIMLDifferent Models Used In Time Series - InsideAIML
Different Models Used In Time Series - InsideAIMLVijaySharma802
 
02trainingmaterialformsa (1) 111030062223-phpapp02
02trainingmaterialformsa (1) 111030062223-phpapp0202trainingmaterialformsa (1) 111030062223-phpapp02
02trainingmaterialformsa (1) 111030062223-phpapp02Junelly Grace Catalan-Tecson
 
Process Capability - Cp, Cpk. Pp, Ppk
Process Capability - Cp, Cpk. Pp, Ppk Process Capability - Cp, Cpk. Pp, Ppk
Process Capability - Cp, Cpk. Pp, Ppk J. García - Verdugo
 
HPLC APPLICATION RECENT DEVELOPMENT STATIONARY PHASE MATERIAL Dr suman presen...
HPLC APPLICATION RECENT DEVELOPMENT STATIONARY PHASE MATERIAL Dr suman presen...HPLC APPLICATION RECENT DEVELOPMENT STATIONARY PHASE MATERIAL Dr suman presen...
HPLC APPLICATION RECENT DEVELOPMENT STATIONARY PHASE MATERIAL Dr suman presen...Dr. Suman Pattanayak
 

Similar to ARIMA Model for analysis of time series data.ppt (20)

Control charts
Control chartsControl charts
Control charts
 
Qc tools
Qc toolsQc tools
Qc tools
 
Qc tools
Qc toolsQc tools
Qc tools
 
Forecasting%20Economic%20Series%20using%20ARMA
Forecasting%20Economic%20Series%20using%20ARMAForecasting%20Economic%20Series%20using%20ARMA
Forecasting%20Economic%20Series%20using%20ARMA
 
14. Statistical Process Control.pptx
14. Statistical Process Control.pptx14. Statistical Process Control.pptx
14. Statistical Process Control.pptx
 
The Treatment of Uncertainty in Models
The Treatment of Uncertainty in ModelsThe Treatment of Uncertainty in Models
The Treatment of Uncertainty in Models
 
crossvalidation.pptx
crossvalidation.pptxcrossvalidation.pptx
crossvalidation.pptx
 
4 26 2013 1 IME 674 Quality Assurance Reliability EXAM TERM PROJECT INFO...
4 26 2013 1 IME 674  Quality Assurance   Reliability EXAM   TERM PROJECT INFO...4 26 2013 1 IME 674  Quality Assurance   Reliability EXAM   TERM PROJECT INFO...
4 26 2013 1 IME 674 Quality Assurance Reliability EXAM TERM PROJECT INFO...
 
Spc
SpcSpc
Spc
 
Time series and panel data in econometrics
Time series and panel data in econometricsTime series and panel data in econometrics
Time series and panel data in econometrics
 
7 QC - NEW.ppt
7 QC - NEW.ppt7 QC - NEW.ppt
7 QC - NEW.ppt
 
Incheon National University - EATED SRA
Incheon National University - EATED SRAIncheon National University - EATED SRA
Incheon National University - EATED SRA
 
Spc training
Spc training Spc training
Spc training
 
TESCO Evaluation of Non-Normal Meter Data
TESCO Evaluation of Non-Normal Meter DataTESCO Evaluation of Non-Normal Meter Data
TESCO Evaluation of Non-Normal Meter Data
 
Different Models Used In Time Series - InsideAIML
Different Models Used In Time Series - InsideAIMLDifferent Models Used In Time Series - InsideAIML
Different Models Used In Time Series - InsideAIML
 
02trainingmaterialformsa (1) 111030062223-phpapp02
02trainingmaterialformsa (1) 111030062223-phpapp0202trainingmaterialformsa (1) 111030062223-phpapp02
02trainingmaterialformsa (1) 111030062223-phpapp02
 
Forecasting Examples
Forecasting ExamplesForecasting Examples
Forecasting Examples
 
Process Capability - Cp, Cpk. Pp, Ppk
Process Capability - Cp, Cpk. Pp, Ppk Process Capability - Cp, Cpk. Pp, Ppk
Process Capability - Cp, Cpk. Pp, Ppk
 
Reliability Seminar ppt
Reliability Seminar pptReliability Seminar ppt
Reliability Seminar ppt
 
HPLC APPLICATION RECENT DEVELOPMENT STATIONARY PHASE MATERIAL Dr suman presen...
HPLC APPLICATION RECENT DEVELOPMENT STATIONARY PHASE MATERIAL Dr suman presen...HPLC APPLICATION RECENT DEVELOPMENT STATIONARY PHASE MATERIAL Dr suman presen...
HPLC APPLICATION RECENT DEVELOPMENT STATIONARY PHASE MATERIAL Dr suman presen...
 

Recently uploaded

THE ROLE OF PHARMACOGNOSY IN TRADITIONAL AND MODERN SYSTEM OF MEDICINE.pptx
THE ROLE OF PHARMACOGNOSY IN TRADITIONAL AND MODERN SYSTEM OF MEDICINE.pptxTHE ROLE OF PHARMACOGNOSY IN TRADITIONAL AND MODERN SYSTEM OF MEDICINE.pptx
THE ROLE OF PHARMACOGNOSY IN TRADITIONAL AND MODERN SYSTEM OF MEDICINE.pptxNandakishor Bhaurao Deshmukh
 
Call Girls In Nihal Vihar Delhi ❤️8860477959 Looking Escorts In 24/7 Delhi NCR
Call Girls In Nihal Vihar Delhi ❤️8860477959 Looking Escorts In 24/7 Delhi NCRCall Girls In Nihal Vihar Delhi ❤️8860477959 Looking Escorts In 24/7 Delhi NCR
Call Girls In Nihal Vihar Delhi ❤️8860477959 Looking Escorts In 24/7 Delhi NCRlizamodels9
 
Neurodevelopmental disorders according to the dsm 5 tr
Neurodevelopmental disorders according to the dsm 5 trNeurodevelopmental disorders according to the dsm 5 tr
Neurodevelopmental disorders according to the dsm 5 trssuser06f238
 
TOTAL CHOLESTEROL (lipid profile test).pptx
TOTAL CHOLESTEROL (lipid profile test).pptxTOTAL CHOLESTEROL (lipid profile test).pptx
TOTAL CHOLESTEROL (lipid profile test).pptxdharshini369nike
 
Call Girls in Mayapuri Delhi 💯Call Us 🔝9953322196🔝 💯Escort.
Call Girls in Mayapuri Delhi 💯Call Us 🔝9953322196🔝 💯Escort.Call Girls in Mayapuri Delhi 💯Call Us 🔝9953322196🔝 💯Escort.
Call Girls in Mayapuri Delhi 💯Call Us 🔝9953322196🔝 💯Escort.aasikanpl
 
Call Girls in Munirka Delhi 💯Call Us 🔝9953322196🔝 💯Escort.
Call Girls in Munirka Delhi 💯Call Us 🔝9953322196🔝 💯Escort.Call Girls in Munirka Delhi 💯Call Us 🔝9953322196🔝 💯Escort.
Call Girls in Munirka Delhi 💯Call Us 🔝9953322196🔝 💯Escort.aasikanpl
 
Temporomandibular joint Muscles of Mastication
Temporomandibular joint Muscles of MasticationTemporomandibular joint Muscles of Mastication
Temporomandibular joint Muscles of Masticationvidulajaib
 
Call Us ≽ 9953322196 ≼ Call Girls In Mukherjee Nagar(Delhi) |
Call Us ≽ 9953322196 ≼ Call Girls In Mukherjee Nagar(Delhi) |Call Us ≽ 9953322196 ≼ Call Girls In Mukherjee Nagar(Delhi) |
Call Us ≽ 9953322196 ≼ Call Girls In Mukherjee Nagar(Delhi) |aasikanpl
 
Solution chemistry, Moral and Normal solutions
Solution chemistry, Moral and Normal solutionsSolution chemistry, Moral and Normal solutions
Solution chemistry, Moral and Normal solutionsHajira Mahmood
 
zoogeography of pakistan.pptx fauna of Pakistan
zoogeography of pakistan.pptx fauna of Pakistanzoogeography of pakistan.pptx fauna of Pakistan
zoogeography of pakistan.pptx fauna of Pakistanzohaibmir069
 
SOLUBLE PATTERN RECOGNITION RECEPTORS.pptx
SOLUBLE PATTERN RECOGNITION RECEPTORS.pptxSOLUBLE PATTERN RECOGNITION RECEPTORS.pptx
SOLUBLE PATTERN RECOGNITION RECEPTORS.pptxkessiyaTpeter
 
Analytical Profile of Coleus Forskohlii | Forskolin .pdf
Analytical Profile of Coleus Forskohlii | Forskolin .pdfAnalytical Profile of Coleus Forskohlii | Forskolin .pdf
Analytical Profile of Coleus Forskohlii | Forskolin .pdfSwapnil Therkar
 
Best Call Girls In Sector 29 Gurgaon❤️8860477959 EscorTs Service In 24/7 Delh...
Best Call Girls In Sector 29 Gurgaon❤️8860477959 EscorTs Service In 24/7 Delh...Best Call Girls In Sector 29 Gurgaon❤️8860477959 EscorTs Service In 24/7 Delh...
Best Call Girls In Sector 29 Gurgaon❤️8860477959 EscorTs Service In 24/7 Delh...lizamodels9
 
Bentham & Hooker's Classification. along with the merits and demerits of the ...
Bentham & Hooker's Classification. along with the merits and demerits of the ...Bentham & Hooker's Classification. along with the merits and demerits of the ...
Bentham & Hooker's Classification. along with the merits and demerits of the ...Nistarini College, Purulia (W.B) India
 
Recombinant DNA technology( Transgenic plant and animal)
Recombinant DNA technology( Transgenic plant and animal)Recombinant DNA technology( Transgenic plant and animal)
Recombinant DNA technology( Transgenic plant and animal)DHURKADEVIBASKAR
 
Harmful and Useful Microorganisms Presentation
Harmful and Useful Microorganisms PresentationHarmful and Useful Microorganisms Presentation
Harmful and Useful Microorganisms Presentationtahreemzahra82
 
Heredity: Inheritance and Variation of Traits
Heredity: Inheritance and Variation of TraitsHeredity: Inheritance and Variation of Traits
Heredity: Inheritance and Variation of TraitsCharlene Llagas
 
Evidences of Evolution General Biology 2
Evidences of Evolution General Biology 2Evidences of Evolution General Biology 2
Evidences of Evolution General Biology 2John Carlo Rollon
 
Is RISC-V ready for HPC workload? Maybe?
Is RISC-V ready for HPC workload? Maybe?Is RISC-V ready for HPC workload? Maybe?
Is RISC-V ready for HPC workload? Maybe?Patrick Diehl
 

Recently uploaded (20)

THE ROLE OF PHARMACOGNOSY IN TRADITIONAL AND MODERN SYSTEM OF MEDICINE.pptx
THE ROLE OF PHARMACOGNOSY IN TRADITIONAL AND MODERN SYSTEM OF MEDICINE.pptxTHE ROLE OF PHARMACOGNOSY IN TRADITIONAL AND MODERN SYSTEM OF MEDICINE.pptx
THE ROLE OF PHARMACOGNOSY IN TRADITIONAL AND MODERN SYSTEM OF MEDICINE.pptx
 
Call Girls In Nihal Vihar Delhi ❤️8860477959 Looking Escorts In 24/7 Delhi NCR
Call Girls In Nihal Vihar Delhi ❤️8860477959 Looking Escorts In 24/7 Delhi NCRCall Girls In Nihal Vihar Delhi ❤️8860477959 Looking Escorts In 24/7 Delhi NCR
Call Girls In Nihal Vihar Delhi ❤️8860477959 Looking Escorts In 24/7 Delhi NCR
 
Neurodevelopmental disorders according to the dsm 5 tr
Neurodevelopmental disorders according to the dsm 5 trNeurodevelopmental disorders according to the dsm 5 tr
Neurodevelopmental disorders according to the dsm 5 tr
 
TOTAL CHOLESTEROL (lipid profile test).pptx
TOTAL CHOLESTEROL (lipid profile test).pptxTOTAL CHOLESTEROL (lipid profile test).pptx
TOTAL CHOLESTEROL (lipid profile test).pptx
 
Call Girls in Mayapuri Delhi 💯Call Us 🔝9953322196🔝 💯Escort.
Call Girls in Mayapuri Delhi 💯Call Us 🔝9953322196🔝 💯Escort.Call Girls in Mayapuri Delhi 💯Call Us 🔝9953322196🔝 💯Escort.
Call Girls in Mayapuri Delhi 💯Call Us 🔝9953322196🔝 💯Escort.
 
Call Girls in Munirka Delhi 💯Call Us 🔝9953322196🔝 💯Escort.
Call Girls in Munirka Delhi 💯Call Us 🔝9953322196🔝 💯Escort.Call Girls in Munirka Delhi 💯Call Us 🔝9953322196🔝 💯Escort.
Call Girls in Munirka Delhi 💯Call Us 🔝9953322196🔝 💯Escort.
 
Temporomandibular joint Muscles of Mastication
Temporomandibular joint Muscles of MasticationTemporomandibular joint Muscles of Mastication
Temporomandibular joint Muscles of Mastication
 
Call Us ≽ 9953322196 ≼ Call Girls In Mukherjee Nagar(Delhi) |
Call Us ≽ 9953322196 ≼ Call Girls In Mukherjee Nagar(Delhi) |Call Us ≽ 9953322196 ≼ Call Girls In Mukherjee Nagar(Delhi) |
Call Us ≽ 9953322196 ≼ Call Girls In Mukherjee Nagar(Delhi) |
 
Solution chemistry, Moral and Normal solutions
Solution chemistry, Moral and Normal solutionsSolution chemistry, Moral and Normal solutions
Solution chemistry, Moral and Normal solutions
 
zoogeography of pakistan.pptx fauna of Pakistan
zoogeography of pakistan.pptx fauna of Pakistanzoogeography of pakistan.pptx fauna of Pakistan
zoogeography of pakistan.pptx fauna of Pakistan
 
SOLUBLE PATTERN RECOGNITION RECEPTORS.pptx
SOLUBLE PATTERN RECOGNITION RECEPTORS.pptxSOLUBLE PATTERN RECOGNITION RECEPTORS.pptx
SOLUBLE PATTERN RECOGNITION RECEPTORS.pptx
 
Volatile Oils Pharmacognosy And Phytochemistry -I
Volatile Oils Pharmacognosy And Phytochemistry -IVolatile Oils Pharmacognosy And Phytochemistry -I
Volatile Oils Pharmacognosy And Phytochemistry -I
 
Analytical Profile of Coleus Forskohlii | Forskolin .pdf
Analytical Profile of Coleus Forskohlii | Forskolin .pdfAnalytical Profile of Coleus Forskohlii | Forskolin .pdf
Analytical Profile of Coleus Forskohlii | Forskolin .pdf
 
Best Call Girls In Sector 29 Gurgaon❤️8860477959 EscorTs Service In 24/7 Delh...
Best Call Girls In Sector 29 Gurgaon❤️8860477959 EscorTs Service In 24/7 Delh...Best Call Girls In Sector 29 Gurgaon❤️8860477959 EscorTs Service In 24/7 Delh...
Best Call Girls In Sector 29 Gurgaon❤️8860477959 EscorTs Service In 24/7 Delh...
 
Bentham & Hooker's Classification. along with the merits and demerits of the ...
Bentham & Hooker's Classification. along with the merits and demerits of the ...Bentham & Hooker's Classification. along with the merits and demerits of the ...
Bentham & Hooker's Classification. along with the merits and demerits of the ...
 
Recombinant DNA technology( Transgenic plant and animal)
Recombinant DNA technology( Transgenic plant and animal)Recombinant DNA technology( Transgenic plant and animal)
Recombinant DNA technology( Transgenic plant and animal)
 
Harmful and Useful Microorganisms Presentation
Harmful and Useful Microorganisms PresentationHarmful and Useful Microorganisms Presentation
Harmful and Useful Microorganisms Presentation
 
Heredity: Inheritance and Variation of Traits
Heredity: Inheritance and Variation of TraitsHeredity: Inheritance and Variation of Traits
Heredity: Inheritance and Variation of Traits
 
Evidences of Evolution General Biology 2
Evidences of Evolution General Biology 2Evidences of Evolution General Biology 2
Evidences of Evolution General Biology 2
 
Is RISC-V ready for HPC workload? Maybe?
Is RISC-V ready for HPC workload? Maybe?Is RISC-V ready for HPC workload? Maybe?
Is RISC-V ready for HPC workload? Maybe?
 

ARIMA Model for analysis of time series data.ppt

  • 2. Introduction • Describe the stationarity of the AR process • Determine the mean and variance of the AR process • Assess the importance of Box-Jenkins methodology • Describe the various types of forecasts • Evaluate the measures of forecast importance
  • 3. Stationarity of the AR process • If an AR model is not stationary, this implies that previous values of the error term will have a non-declining effect on the current value of the dependent variable. • This implies that the coefficients on the MA process would not converge to zero as the lag length increases. • For an AR model to be stationary, the coefficients on the corresponding MA process decline with lag length, converging on 0.
  • 4. AR Process • The test for stationarity in an AR model (with p lags)is that the roots of the characteristic equation lie outside the unit circle (i.e. > 1), where the characteristic equation is: 0 ... 1 2 2 1      p p z z z   
  • 5. Unit Root • When testing for stationarity for any variable, we describe it as testing for a ‘unit root’, this is based on this same idea. • The most basic AR model is the AR(1) model, on which most tests for stationarity are based, such as the Dickey-Fuller test (covered later)
  • 7. Unit Root Test • With the AR(1) model, the characteristic equation of (1-z)= 0, suggests that it has a root of z = 1. This lies on the unit circle, rather than outside it, so we conclude that it is non- stationary. • As we increase the lags in the AR model, so the potential number of roots increases, so for 2 lags, we have a quadratic equation producing 2 roots, for the model to be stationary, they both need to lie outside the unit circle.
  • 8. AR Process • The (unconditional mean) for an AR(1) process, with a constant (μ) is given by: 1 1 1 1 ) ( ) 1 (            t t t t y E AR u y y
  • 9. AR Process • The (unconditional) variance for an AR process of order 1 (excluding the constant) is: 1 ) 1 ( ) var( 1 2 1 2       t y
  • 10. Box-Jenkins Methodology • This is a method for estimating ARIMA models, based on the ACF and PACF as a means of determining the stationarity of the variable in question and the lag lengths of the ARIMA model. • Although the ACF and PACF methods for determining the lag length in an ARIMA model are commonly used, there are other methods termed information criteria which can also be used (covered later)
  • 11. Box-Jenkins • The Box-Jenkins approach typically comprises four parts: - Identification of the model - Estimation, usually OLS -Diagnostic checking (mostly for autocorrelation) - Forecasting
  • 12. ACF and PACF • • • Autocorrelation Partial Correlation AC PAC Q-Stat Prob • • • . |*. | . |*. | 1 0.093 0.093 0.7580 0.384 • .*| . | .*| . | 2 -0.073 -0.082 1.2307 0.540 • . | . | . | . | 3 -0.023 -0.008 1.2772 0.735 • .*| . | .*| . | 4 -0.106 -0.111 2.3010 0.681 • . | . | . | . | 5 -0.003 0.016 2.3017 0.806 • . |*. | . |*. | 6 0.140 0.124 4.1334 0.659 • . |*. | . |*. | 7 0.162 0.141 6.6260 0.469 • .*| . | .*| . | 8 -0.103 -0.128 7.6356 0.470 • . | . | . | . | 9 -0.047 -0.003 7.8513 0.549 • .*| . | .*| . | 10 -0.124 -0.117 9.3624 0.498 • . | . | . |*. | 11 0.028 0.088 9.4434 0.581 • . |** | . |*. | 12 0.217 0.166 14.231 0.286 • • •
  • 13. Identification • Identification of the most appropriate model is the most important part of the process, where it becomes as much ‘art’ as ‘science’. • The first step is to determine if the variable is stationary, this can be done with the correlogram. If it is not stationary it needs to be first-differenced. (it may need to be differenced again to induce stationarity) • The next stage is to determine the p and q in the ARIMA (p, I, q) model (the I refers to how many times the data needs to be differenced to produce a stationary series)
  • 14. Identification • To determine the appropriate lag structure in the AR part of the model, the PACF or Partial correlogram is used, where the number of non- zero points of the PACF determine where the AR lags need to be included. • To determine the MA lag structure, the ACF or correlogram is used, again the non-zero points suggest where the lags should be included. • Seasonal dummy variables may also need to be included if the data exhibits seasonal effects.
  • 15. Diagnostic Checks • With this approach we only test for autocorrelation usually, using the Q or Ljung-Box statistic. • If there is evidence of autocorrelation, we need to go back to the identification stage and respecify the model, by adding more lags. • A criticism of this approach is that it fails to identify if the model is too big or over- parameterised, it only tells us if it is too small.
  • 16. ARIMA Example • Following the Box-Jenkins methodology, the following ARIMA(2,1,1) model was produced: 21 . 3 ) 2 ( , 12 . 0 R (0.01) (0.1) (0.2) (0.1) 1 . 0 3 . 0 6 . 0 7 . 0 ˆ 2 1 2 1             LB u y y y t t t t
  • 17. Parsimonious Model • The aim of this type of modelling is to produce a model that is parsimonious, or as small as possible, whilst passing the diagnostic checks. • A parsimonious model is desirable because including irrelevant lags in the model increases the coefficient standard errors and therefore reduces the t-statistics. • Models that incorporate large numbers of lags, tend not to forecast well, as they fit data specific features, explaining much of the noise or random features in the data.
  • 18. Forecasting • One of the most important tests of how well a model performs is how well it forecasts. • One of the most useful models for forecasting is the ARIMA model. • To produce dynamic forecasts the model needs to include lags of either the variables or error terms.
  • 19. Types of Forecast • Forecasts can be either in-sample or out- of-sample forecasts. • In general the out-of sample forecasts are a better test of how well the model works, as the forecast uses data not included in the estimation of the model. • To conduct out-of-sample forecasts, we need to leave some observations at the end of our sample for this purpose
  • 20. Types of Forecasts • A one-step-ahead is a forecast for the next observation only. • A multi-step-ahead forecast is for 1,2,3,…s steps ahead. • A recursive window for the forecast means that the initial estimation date is fixed but the additional observations are added one by one to the estimation time span. • A rolling window is where the estimation time period is fixed but the start and end dates successively increase by 1.
  • 21. Conditional Forecasting • A conditional expectation is one that is taken for time t + 1, conditional upon or given all information available up to and including time t (this is important later). It is written as: t y E t t t at time n informatio all ) | ( 1    
  • 22. Measuring Forecast Accuracy • To determine how accurate a forecast is, the simplest method is to plot the forecast against the actual values as a direct comparison • In addition it may be worthwhile to compare the turning points, this is particularly important in finance. • There are a number of methods to determine accuracy of the forecast, often more than one is included in a set of results.
  • 23. Tests of Forecast Accuracy • Tests of forecast accuracy are based on the difference between the forecast of the variables value at time t and the actual value at time t. The closer the two are together and the smaller the forecast error, the better the forecast. • There are a variety of statistics measuring this accuracy, mostly based on an average of the errors between the actual and forecast values at time t. • However these statistics provide little information in isolation, as they are unbounded from above and their value depends on the units of the variables being forecast.
  • 24. Mean Squared Error (MSE) • The MSE statistic can be defined as: t y t f T T f y T T MSE s t s t T T t s t s t at time value actual the at time made forecasts ahead - step - s n observatio forecast sample - of - out first size sample total ) ( ) 1 ( 1 , 1 2 , 1 1            
  • 25. MSE Example Steps Ahead Forecast Actual Squared Error 1 0.1 0.15 0.0025 2 0.25 0.20 0.0025 3 0.5 0.40 0.01 005 . 0 3 / ) 01 . 0 0025 . 0 0025 . 0 (     MSE
  • 26. Forecast Accuracy • There are a number of other measures used and these include: – Mean Absolute Error – Mean Average Prediction Error – Chows test for predictive failure – Theil’s U-statistic (where the forecast is compared to that of a benchmark model) – Root Mean Square Error ( the square root of the MSE)
  • 28. Financial Loss Functions • When using financial data, it is not always the accuracy of the forecast that matters, very often it is the accuracy of forecasts relating to the sign of future returns or turning points that is important, as this decides if a profit is made. • It is possible to estimate statistics that give the % of correct sign predictions and correct direction change predictions • These statistics work on the principle that if the value of the forecast and actual value are the same, when multiplied together they produce a positive sign. Similarly with the change in forecast and actual values giving the correct direction change.
  • 29. Correct Sign Predictions • The formula for the % of correct sign predictions is as follows: otherwise 0 0 ) * ( 1 ) 1 (T - T 1 signs correct % , 1 1            s t s t s t s t T T t s t Z f y if Z z
  • 30. Conclusion • When using AR models, whether the series is stationary of not determine how stable it is. • Box-Jenkins methodology is part art and part science. • Forecasting of time series is an important measure of how well a model works • There are many measures of how accurate a forecast is, usually a number are calculated to determine if the forecast is acceptable, although all have faults.