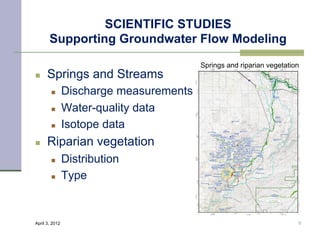
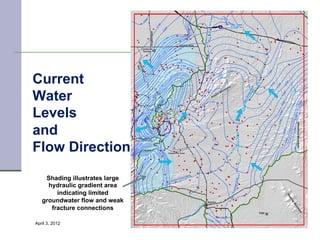
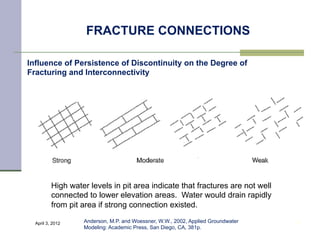
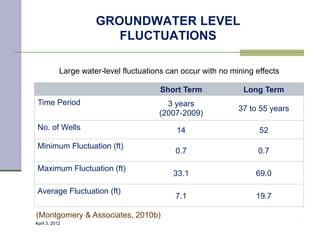
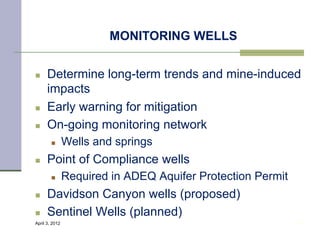
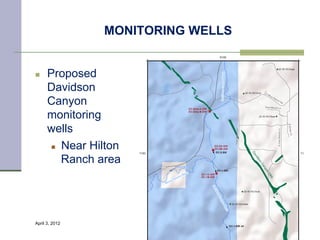
Rosemont Groundwater


         Presented to
   Well Protection Program
    Informational Meeting


         April 3, 2012
Presenter

n    Grady O’Brien, Engineering Analytics, Inc.
n    Professional Geologist / Hydrogeologist
n    U.S. Geological Survey – 14 years
        n      Denver and Tucson
n    Groundwater Consulting – 9 years
        n      Rosemont groundwater modeling project lead for
                Tetra Tech
n    University of Wyoming / Colorado School of Mines
n    Project focus in desert southwest – AZ, NV, UT


April 3, 2012                                                    2
Discussion Outline

n    Rosemont Project Groundwater Related Highlights
n    Supporting Scientific Studies and Data
n    Understanding the Groundwater Flow System
        n      Bedrock / Fractures / Geologic Structures

n    How the Open Pit Effects the Groundwater System
n    Will my well go dry?


April 3, 2012                                               3
ROSEMONT SITE LOCATION


                                  4


April 3, 2012
WELL PROTECTION AREAS


April 3, 2012                           5
ROSEMONT PROJECT
                       Hydrologic Highlights

n    Open pit mine
        n      2,000+ feet deep
        n      ~ 1 mile in diameter
n    Pit dewatering for 22 year life of mine
n    Open pit is major feature that will impact
      groundwater levels
n    Terminal Pit-lake predicted after mining


April 3, 2012                                      6
SCIENTIFIC STUDIES
       Supporting Groundwater Flow Modeling

                                  3-D hydrogeologic model
n    Extensive data
      available
        n      Many data types
        n      Coverage across
                region
n    Best available data
      used


April 3, 2012                                               7
SCIENTIFIC STUDIES
       Supporting Groundwater Flow Modeling

n    Geology                              Wells used for model calibration

        n      Site and regional scales
        n      3-dimensional model
n    Wells
        n      730+ water-levels for
                model calibration
        n      Lithology / geology
        n      Water quality
n    Aquifer Tests
April 3, 2012                                                           8
SCIENTIFIC STUDIES
       Supporting Groundwater Flow Modeling
                                         Springs and riparian vegetation
n    Springs and Streams
        n      Discharge measurements
        n      Water-quality data
        n      Isotope data
n    Riparian vegetation
        n      Distribution
        n      Type


April 3, 2012                                                          9
SCIENTIFIC STUDIES
                     Montgomery & Associates

n    Geology / Hydrogeologic Units
n    Aquifer tests / Hydraulic properties
        n      Short-term and Long-term tests
        n      Regional data
n    Riparian vegetation evapotranspiration (ET)
n    Water levels and water quality
n    Spring flows and water quality
n    Groundwater flow models
April 3, 2012                                       10
SCIENTIFIC STUDIES
                            Tetra Tech

        n      Site Water Management
        n      Infiltration analysis
        n      Infiltration, seepage, fate, and transport
                modeling
        n      Storm-water runoff
        n      Davidson Canyon conceptual model
        n      3-dimensional hydrogeologic model
        n      Groundwater flow model
April 3, 2012                                                11
SCIENTIFIC STUDIES
                    Other Contributing Sources

n    Arizona Geological Survey
        n      Geologic mapping
n    Pima Association of Governments
        n      Cienega Creek and Davidson Canyon
        n      Groundwater flow model
n    U.S. Geological Survey
        n Stream flows
       n  San Pedro and Tucson basin flow models

n    Several recharge analyses
April 3, 2012                                       12
GROUNDWATER FLOW MODELS


n    Two regional groundwater
      flow models
n    Simulate different geologic
      conditions to provide wider
      range of impacts
        n      Davidson Canyon Fault Zone
        n      Davidson Canyon Dike
        n      Backbone Fault / Flat Fault

n    Extensive third-party peer
      review approved models
April 3, 2012                                 13
GROUNDWATER FLOW SYSTEM

n    Fractured bedrock
n    Alluvium – limited layer on top of bedrock
n    Major geologic structures
        n      Faults (Backbone, Flat, Davidson Canyon)
        n      Davidson Canyon dike

n    High water levels near the proposed open pit
n    Groundwater flow paths
        n      From pit area flow is predominately down Davidson Canyon
        n      From upper Cienega Creek basin, flow is into lower Cienega
                Creek

April 3, 2012                                                            14
Current
Water
Levels
and
Flow Direction

    Shading illustrates large
     hydraulic gradient area
        indicating limited
   groundwater flow and weak
      fracture connections

April 3, 2012                   15
FRACTURED BEDROCK


n    Very low bedrock permeability
n    Low water storage in fractures
n    Groundwater flows in fractures
n    Connections between fractures
        n      How far do fracture connections extend?
        n      Aquifer testing and water levels indicate that
                pit area is not well connected to other areas


April 3, 2012                                                    16
FRACTURE CONNECTIONS

Influence of Persistence of Discontinuity on the Degree of
Fracturing and Interconnectivity


          High water levels in pit area indicate that fractures are not well
          connected to lower elevation areas. Water would drain rapidly
          from pit area if strong connection existed.

  April 3, 2012    Anderson, M.P. and Woessner, W.W., 2002, Applied Groundwater   17
                   Modeling: Academic Press, San Diego, CA, 381p.
WELLS MUST INTERSECT
              FRACTURES TO PRODUCE WATER


         This is why neighbors may have different results with nearby wells.
                                                                             18
If water April 3, 2012
         producing fractures were common, everyone would have high producing wells.
FRACTURE CONNECTIONS BETWEEN
              the PIT and YOUR WELL

n    “What if there is a fracture between the pit
      and…”
n    Evidence supports lack of fracture connection
        n      High water-levels in pit area – water not flowing
                ‘downhill’ because fractures are limited
        n      Varying productivity with on-site wells show
                limited fracture connectivity across the site
        n      No high discharge perennial springs in area
n    Conclusion is weak fracture connection
April 3, 2012                                                  19
FRACTURE CONNECTIONS BETWEEN
              the PIT and YOUR WELL

n    “The pit will suck in all of the groundwater…”
n    In the long term, consumptive use of the pit
      lake is predicted to be 100 to 230 gpm
        n      Equivalent to a few water-supply wells
        n      This water is “captured” from across the region
n    Evaporation on the pit-lake surface is
      “consuming” groundwater, but it is limited
n    Not physically possible to remove all of the
      groundwater
April 3, 2012                                                     20
WILL MY WELL GO DRY?

n       Water levels will decrease
         dramatically in the immediate pit area
n       Water-level drawdown diminishes
         rapidly away from pit area
n       Which wells will go dry depends on
         site specific hydrogeologic conditions,
         well location, and well depth

                                         Geologic map illustrating complex
      April 3, 2012                      geology that influences drawdown
                                                                      21

                                         propagation
DEWATERED PIT


n    Conceptual
      cross
      section
      through the
      pit (with
      vertical
      exaggeration)


April 3, 2012                         22
TERMINAL PIT LAKE
                         HYDRAULIC SINK


n    Conceptual
      cross
      section of
      the pit lake
      after
      mining
      ends (with
      vertical
      exaggeration)


April 3, 2012                             23
PREDICTED WATER LEVELS

n     Montgomery and
       Associates flow
       model
      Water levels and flow
      directions 1,000 years after
      mining ends.

      Flow directions similar to
      pre-mining with exception of
      pit-lake capture zone

      With cross section location
      lines used on following slides
April 3, 2012                          24
PREDICTED WATER LEVELS
           Section X-X’


Drawdown decreases rapidly away from pit
Water flow flows water table, not land-surface elevation
April 3, 2012                                              25
PREDICTED WATER LEVELS
           Section Y-Y’


Drawdown decreases rapidly away from pit
April 3, 2012                                              26
Water flow flows water table, not land-surface elevation
PREDICTED WATER LEVELS
                 Section Z-Z’


Drawdown decreases rapidly away from pit
    April 3, 2012                                          27
Water flow flows water table, not land-surface elevation
WELL PROTECTION AREAS


                                                 Explanation
                                                               Detailed Map Area

                                                       !       Well Location

                                                               Extent of Ultimate Pit

                                                               Davidson Canyon Dike

                                                               Proposed Tailings and
                                                               Waste Rock Facilities

                                                               Davidson Canyon
                                                               Watershed Boundary


                                                 Surface Hydrogeology
                                                 Qal   Quaternary and Recent Alluvium
                                                 QTg Late Tertiary Alluvium
                                                 QTg1 QTg1
                                                 QTg2 QTg2
                                                 Tsp   Tsp
                                                 Tgr   Late Cretaceous/Tertiary Intrusives
                                                 Kv    Upper Cretaceous Volcanics
                                                 Ksd   Lower Cretaceous Bisbee Group
                                                  Pz   Cambrian and Paleozoic Formations
                                                 PCc PreCambrian Granodiorite and Schist

                         0   1           2   3

April 3, 2012                    Miles                                                       28
HILTON RANCH AREA

                                                         Explanation
                                                         Wells
                                                               !   Groundwater Site Inventory
                                                               !   55 Wells
                                                               !   Model Targets

                                                                     Davidson Canyon Dike

                                                                     Davidson Canyon
                                                                     Watershed Boundary


                                           Davidson Canyon Dike
                                           may limit drawdown in
                                           this area


April 3, 2012                                                                               29
                            0   1,500          3,000   4,500

                                        Feet
SINGING VALLEY NORTH AREA

                                                       Explanation
                                                       Wells
                                                               !         Groundwater Site Inventory
                                                               !         55 Wells
                                                               !         Model Targets

                                                                          Extent of Ultimate Pit
                                                                          Davidson Canyon
                                                                          Watershed Boundary
                                                                          Proposed Tailings and
                                                                          Waste Rock Facilities


                                                        Surface Hydrogeology
                                                          Qal      Quaternary and Recent Alluvium
                                                          QTg Late Tertiary Alluvium
                                                         QTg1 QTg1
                                                         QTg2 QTg2
                                                          Tsp      Tsp

                                                          Kv       Upper Cretaceous Volcanics
                                                          Ksd      Lower Cretaceous Bisbee Group
                                                         PCc PreCambrian Granodiorite and Schist


                            0   1,500          3,000   4,500
April 3, 2012                                                                                         30
                                        Feet
HELVETIA AREA

                                        Explanation
                                        Wells
                                                  !      Groundwater Site Inventory
                                                  !      55 Wells
                                                  !      Model Targets

                                                               Extent of Ultimate Pit
                                                               Davidson Canyon
                                                               Watershed Boundary
                                                               Proposed Tailings and
                                                               Waste Rock Facilities


                                               Surface Hydrogeology
                                                 Qal   Quaternary and Recent Alluvium
                                                QTg Late Tertiary Alluvium

                                                QTg2 QTg2

                                                 Tgr   Late Cretaceous/Tertiary Intrusives

                                                 Ksd   Lower Cretaceous Bisbee Group

                                                 Pz    Cambrian and Paleozoic Formations
                                                PCc PreCambrian Granodiorite and Schist


April 3, 2012               0   1,500          3,000   4,500
                                                                                             31
                                        Feet
PREDICTED GROUNDWATER
                   LEVEL DRAWDOWN

Drawdown contours are composite, worst
case from M&A and Tetra Tech flow models

Areas within 10-foot drawdown prediction
after 150 years are included in Well
Protection Program


April 3, 2012                              32
GROUNDWATER LEVEL
                         FLUCTUATIONS

            Large water-level fluctuations can occur with no mining effects

                                        Short Term              Long Term
 Time Period                              3 years
                                                               37 to 55 years
                                        (2007-2009)
 No. of Wells                                14                      52
 Minimum Fluctuation (ft)
                                             0.7                     0.7

 Maximum Fluctuation (ft)
                                            33.1                    69.0

 Average Fluctuation (ft)
                                             7.1                    19.7

(Montgomery & Associates, 2010b)
April 3, 2012                                                                   33
MONITORING WELLS


n    Determine long-term trends and mine-induced
      impacts
n    Early warning for mitigation
n    On-going monitoring network
        n      Wells and springs
n    Point of Compliance wells
        n      Required in ADEQ Aquifer Protection Permit
n    Davidson Canyon wells (proposed)
n    Sentinel Wells (planned)
April 3, 2012                                                34
MONITORING WELLS


n    Proposed
      Davidson
      Canyon
      monitoring
      wells
       n  Near Hilton

           Ranch area


April 3, 2012                        35
MONITORING WELLS


n    Homeowner wells
        n      Rosemont is seeking volunteer homeowners
        n      Document water levels so that mining impacts
                can be determined
        n      Start prior to mining
        n      Simplify potential future claim process
        n      Minimal disturbance to homeowner


April 3, 2012                                              36
CONCLUSIONS

n    Different groundwater models result in similar predictions
       n    Provides confidence that predictions are reasonable
n    Rate and direction of drawdown propagation will vary
       n    Different areas will have different impacts
n    Away from the immediate pit area predicted drawdown is
      within the range of natural fluctuations
       n    Beneficial for homeowner’s to obtain history of water-
             level changes by volunteering to allow measurements
             in their wells


 April 3, 2012                                                 37

Well Protection Program - Groundwater Modeling Presentation

  • 1.
    Rosemont Groundwater Presented to Well Protection Program Informational Meeting April 3, 2012
  • 2.
    Presenter n  Grady O’Brien, Engineering Analytics, Inc. n  Professional Geologist / Hydrogeologist n  U.S. Geological Survey – 14 years n  Denver and Tucson n  Groundwater Consulting – 9 years n  Rosemont groundwater modeling project lead for Tetra Tech n  University of Wyoming / Colorado School of Mines n  Project focus in desert southwest – AZ, NV, UT April 3, 2012 2
  • 3.
    Discussion Outline n  Rosemont Project Groundwater Related Highlights n  Supporting Scientific Studies and Data n  Understanding the Groundwater Flow System n  Bedrock / Fractures / Geologic Structures n  How the Open Pit Effects the Groundwater System n  Will my well go dry? April 3, 2012 3
  • 4.
    ROSEMONT SITE LOCATION 4 April 3, 2012
  • 5.
  • 6.
    ROSEMONT PROJECT Hydrologic Highlights n  Open pit mine n  2,000+ feet deep n  ~ 1 mile in diameter n  Pit dewatering for 22 year life of mine n  Open pit is major feature that will impact groundwater levels n  Terminal Pit-lake predicted after mining April 3, 2012 6
  • 7.
    SCIENTIFIC STUDIES Supporting Groundwater Flow Modeling 3-D hydrogeologic model n  Extensive data available n  Many data types n  Coverage across region n  Best available data used April 3, 2012 7
  • 8.
    SCIENTIFIC STUDIES Supporting Groundwater Flow Modeling n  Geology Wells used for model calibration n  Site and regional scales n  3-dimensional model n  Wells n  730+ water-levels for model calibration n  Lithology / geology n  Water quality n  Aquifer Tests April 3, 2012 8
  • 9.
    SCIENTIFIC STUDIES Supporting Groundwater Flow Modeling Springs and riparian vegetation n  Springs and Streams n  Discharge measurements n  Water-quality data n  Isotope data n  Riparian vegetation n  Distribution n  Type April 3, 2012 9
  • 10.
    SCIENTIFIC STUDIES Montgomery & Associates n  Geology / Hydrogeologic Units n  Aquifer tests / Hydraulic properties n  Short-term and Long-term tests n  Regional data n  Riparian vegetation evapotranspiration (ET) n  Water levels and water quality n  Spring flows and water quality n  Groundwater flow models April 3, 2012 10
  • 11.
    SCIENTIFIC STUDIES Tetra Tech n  Site Water Management n  Infiltration analysis n  Infiltration, seepage, fate, and transport modeling n  Storm-water runoff n  Davidson Canyon conceptual model n  3-dimensional hydrogeologic model n  Groundwater flow model April 3, 2012 11
  • 12.
    SCIENTIFIC STUDIES Other Contributing Sources n  Arizona Geological Survey n  Geologic mapping n  Pima Association of Governments n  Cienega Creek and Davidson Canyon n  Groundwater flow model n  U.S. Geological Survey n Stream flows n  San Pedro and Tucson basin flow models n  Several recharge analyses April 3, 2012 12
  • 13.
    GROUNDWATER FLOW MODELS n  Two regional groundwater flow models n  Simulate different geologic conditions to provide wider range of impacts n  Davidson Canyon Fault Zone n  Davidson Canyon Dike n  Backbone Fault / Flat Fault n  Extensive third-party peer review approved models April 3, 2012 13
  • 14.
    GROUNDWATER FLOW SYSTEM n  Fractured bedrock n  Alluvium – limited layer on top of bedrock n  Major geologic structures n  Faults (Backbone, Flat, Davidson Canyon) n  Davidson Canyon dike n  High water levels near the proposed open pit n  Groundwater flow paths n  From pit area flow is predominately down Davidson Canyon n  From upper Cienega Creek basin, flow is into lower Cienega Creek April 3, 2012 14
  • 15.
    Current Water Levels and Flow Direction Shading illustrates large hydraulic gradient area indicating limited groundwater flow and weak fracture connections April 3, 2012 15
  • 16.
    FRACTURED BEDROCK n  Very low bedrock permeability n  Low water storage in fractures n  Groundwater flows in fractures n  Connections between fractures n  How far do fracture connections extend? n  Aquifer testing and water levels indicate that pit area is not well connected to other areas April 3, 2012 16
  • 17.
    FRACTURE CONNECTIONS Influence ofPersistence of Discontinuity on the Degree of Fracturing and Interconnectivity High water levels in pit area indicate that fractures are not well connected to lower elevation areas. Water would drain rapidly from pit area if strong connection existed. April 3, 2012 Anderson, M.P. and Woessner, W.W., 2002, Applied Groundwater 17 Modeling: Academic Press, San Diego, CA, 381p.
  • 18.
    WELLS MUST INTERSECT FRACTURES TO PRODUCE WATER This is why neighbors may have different results with nearby wells. 18 If water April 3, 2012 producing fractures were common, everyone would have high producing wells.
  • 19.
    FRACTURE CONNECTIONS BETWEEN the PIT and YOUR WELL n  “What if there is a fracture between the pit and…” n  Evidence supports lack of fracture connection n  High water-levels in pit area – water not flowing ‘downhill’ because fractures are limited n  Varying productivity with on-site wells show limited fracture connectivity across the site n  No high discharge perennial springs in area n  Conclusion is weak fracture connection April 3, 2012 19
  • 20.
    FRACTURE CONNECTIONS BETWEEN the PIT and YOUR WELL n  “The pit will suck in all of the groundwater…” n  In the long term, consumptive use of the pit lake is predicted to be 100 to 230 gpm n  Equivalent to a few water-supply wells n  This water is “captured” from across the region n  Evaporation on the pit-lake surface is “consuming” groundwater, but it is limited n  Not physically possible to remove all of the groundwater April 3, 2012 20
  • 21.
    WILL MY WELLGO DRY? n  Water levels will decrease dramatically in the immediate pit area n  Water-level drawdown diminishes rapidly away from pit area n  Which wells will go dry depends on site specific hydrogeologic conditions, well location, and well depth Geologic map illustrating complex April 3, 2012 geology that influences drawdown 21 propagation
  • 22.
    DEWATERED PIT n  Conceptual cross section through the pit (with vertical exaggeration) April 3, 2012 22
  • 23.
    TERMINAL PIT LAKE HYDRAULIC SINK n  Conceptual cross section of the pit lake after mining ends (with vertical exaggeration) April 3, 2012 23
  • 24.
    PREDICTED WATER LEVELS n  Montgomery and Associates flow model Water levels and flow directions 1,000 years after mining ends. Flow directions similar to pre-mining with exception of pit-lake capture zone With cross section location lines used on following slides April 3, 2012 24
  • 25.
    PREDICTED WATER LEVELS Section X-X’ Drawdown decreases rapidly away from pit Water flow flows water table, not land-surface elevation April 3, 2012 25
  • 26.
    PREDICTED WATER LEVELS Section Y-Y’ Drawdown decreases rapidly away from pit April 3, 2012 26 Water flow flows water table, not land-surface elevation
  • 27.
    PREDICTED WATER LEVELS Section Z-Z’ Drawdown decreases rapidly away from pit April 3, 2012 27 Water flow flows water table, not land-surface elevation
  • 28.
    WELL PROTECTION AREAS Explanation Detailed Map Area ! Well Location Extent of Ultimate Pit Davidson Canyon Dike Proposed Tailings and Waste Rock Facilities Davidson Canyon Watershed Boundary Surface Hydrogeology Qal Quaternary and Recent Alluvium QTg Late Tertiary Alluvium QTg1 QTg1 QTg2 QTg2 Tsp Tsp Tgr Late Cretaceous/Tertiary Intrusives Kv Upper Cretaceous Volcanics Ksd Lower Cretaceous Bisbee Group Pz Cambrian and Paleozoic Formations PCc PreCambrian Granodiorite and Schist 0 1 2 3 April 3, 2012 Miles 28
  • 29.
    HILTON RANCH AREA Explanation Wells ! Groundwater Site Inventory ! 55 Wells ! Model Targets Davidson Canyon Dike Davidson Canyon Watershed Boundary Davidson Canyon Dike may limit drawdown in this area April 3, 2012 29 0 1,500 3,000 4,500 Feet
  • 30.
    SINGING VALLEY NORTHAREA Explanation Wells ! Groundwater Site Inventory ! 55 Wells ! Model Targets Extent of Ultimate Pit Davidson Canyon Watershed Boundary Proposed Tailings and Waste Rock Facilities Surface Hydrogeology Qal Quaternary and Recent Alluvium QTg Late Tertiary Alluvium QTg1 QTg1 QTg2 QTg2 Tsp Tsp Kv Upper Cretaceous Volcanics Ksd Lower Cretaceous Bisbee Group PCc PreCambrian Granodiorite and Schist 0 1,500 3,000 4,500 April 3, 2012 30 Feet
  • 31.
    HELVETIA AREA Explanation Wells ! Groundwater Site Inventory ! 55 Wells ! Model Targets Extent of Ultimate Pit Davidson Canyon Watershed Boundary Proposed Tailings and Waste Rock Facilities Surface Hydrogeology Qal Quaternary and Recent Alluvium QTg Late Tertiary Alluvium QTg2 QTg2 Tgr Late Cretaceous/Tertiary Intrusives Ksd Lower Cretaceous Bisbee Group Pz Cambrian and Paleozoic Formations PCc PreCambrian Granodiorite and Schist April 3, 2012 0 1,500 3,000 4,500 31 Feet
  • 32.
    PREDICTED GROUNDWATER LEVEL DRAWDOWN Drawdown contours are composite, worst case from M&A and Tetra Tech flow models Areas within 10-foot drawdown prediction after 150 years are included in Well Protection Program April 3, 2012 32
  • 33.
    GROUNDWATER LEVEL FLUCTUATIONS Large water-level fluctuations can occur with no mining effects Short Term Long Term Time Period 3 years 37 to 55 years (2007-2009) No. of Wells 14 52 Minimum Fluctuation (ft) 0.7 0.7 Maximum Fluctuation (ft) 33.1 69.0 Average Fluctuation (ft) 7.1 19.7 (Montgomery & Associates, 2010b) April 3, 2012 33
  • 34.
    MONITORING WELLS n  Determine long-term trends and mine-induced impacts n  Early warning for mitigation n  On-going monitoring network n  Wells and springs n  Point of Compliance wells n  Required in ADEQ Aquifer Protection Permit n  Davidson Canyon wells (proposed) n  Sentinel Wells (planned) April 3, 2012 34
  • 35.
    MONITORING WELLS n  Proposed Davidson Canyon monitoring wells n  Near Hilton Ranch area April 3, 2012 35
  • 36.
    MONITORING WELLS n  Homeowner wells n  Rosemont is seeking volunteer homeowners n  Document water levels so that mining impacts can be determined n  Start prior to mining n  Simplify potential future claim process n  Minimal disturbance to homeowner April 3, 2012 36
  • 37.
    CONCLUSIONS n  Different groundwater models result in similar predictions n  Provides confidence that predictions are reasonable n  Rate and direction of drawdown propagation will vary n  Different areas will have different impacts n  Away from the immediate pit area predicted drawdown is within the range of natural fluctuations n  Beneficial for homeowner’s to obtain history of water- level changes by volunteering to allow measurements in their wells April 3, 2012 37