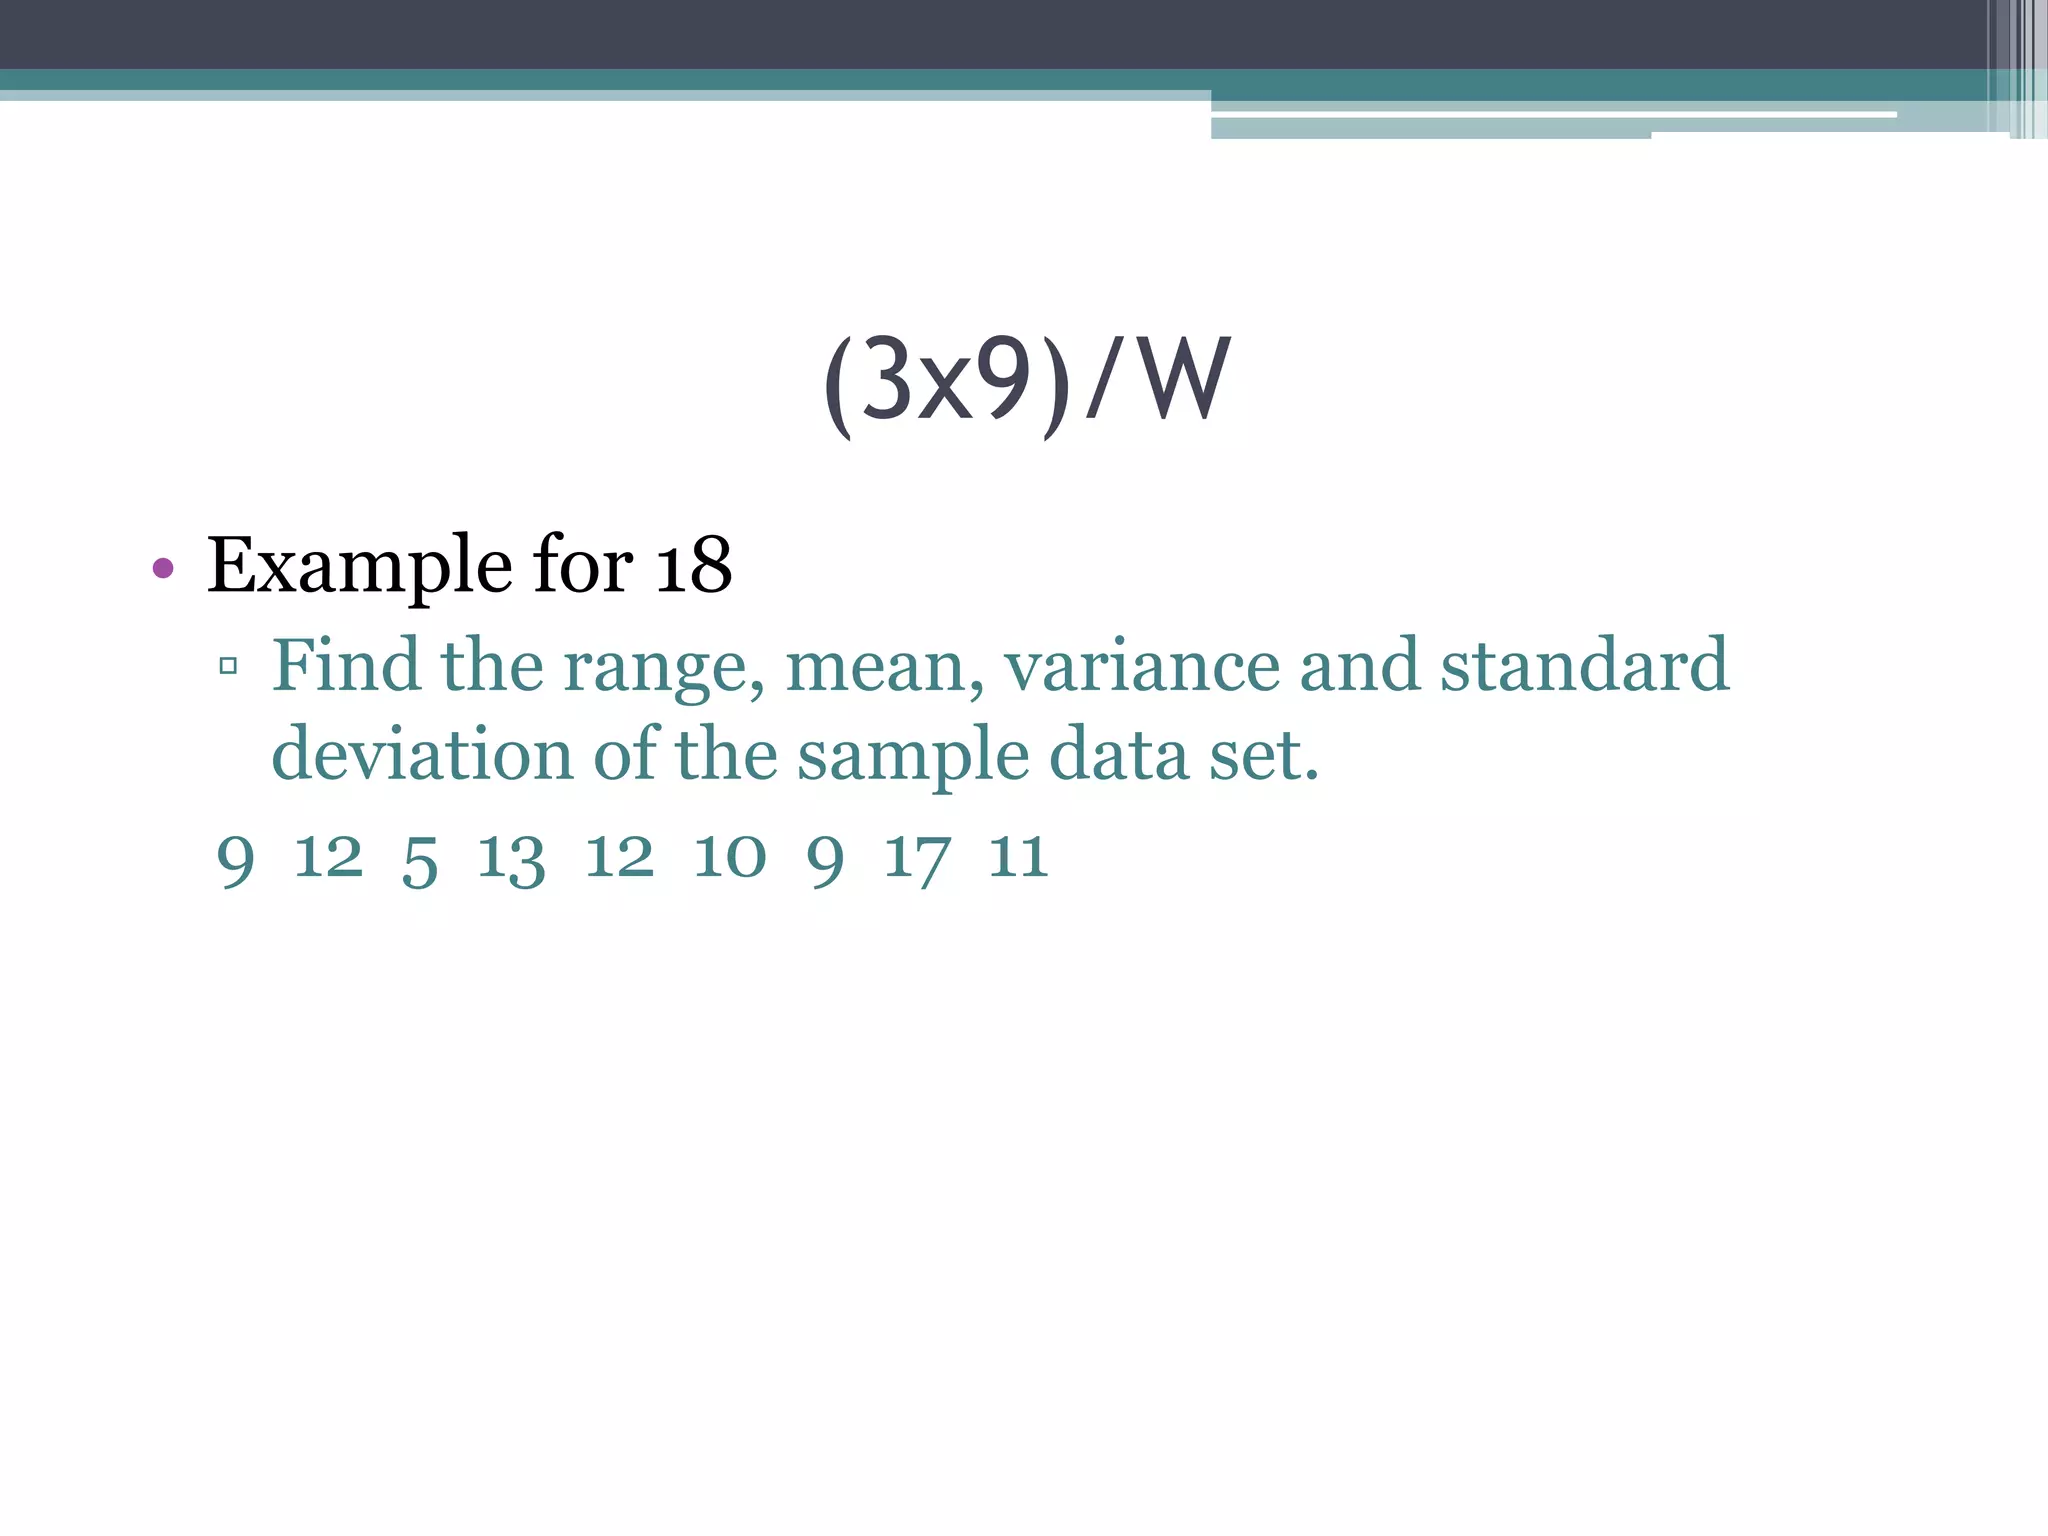
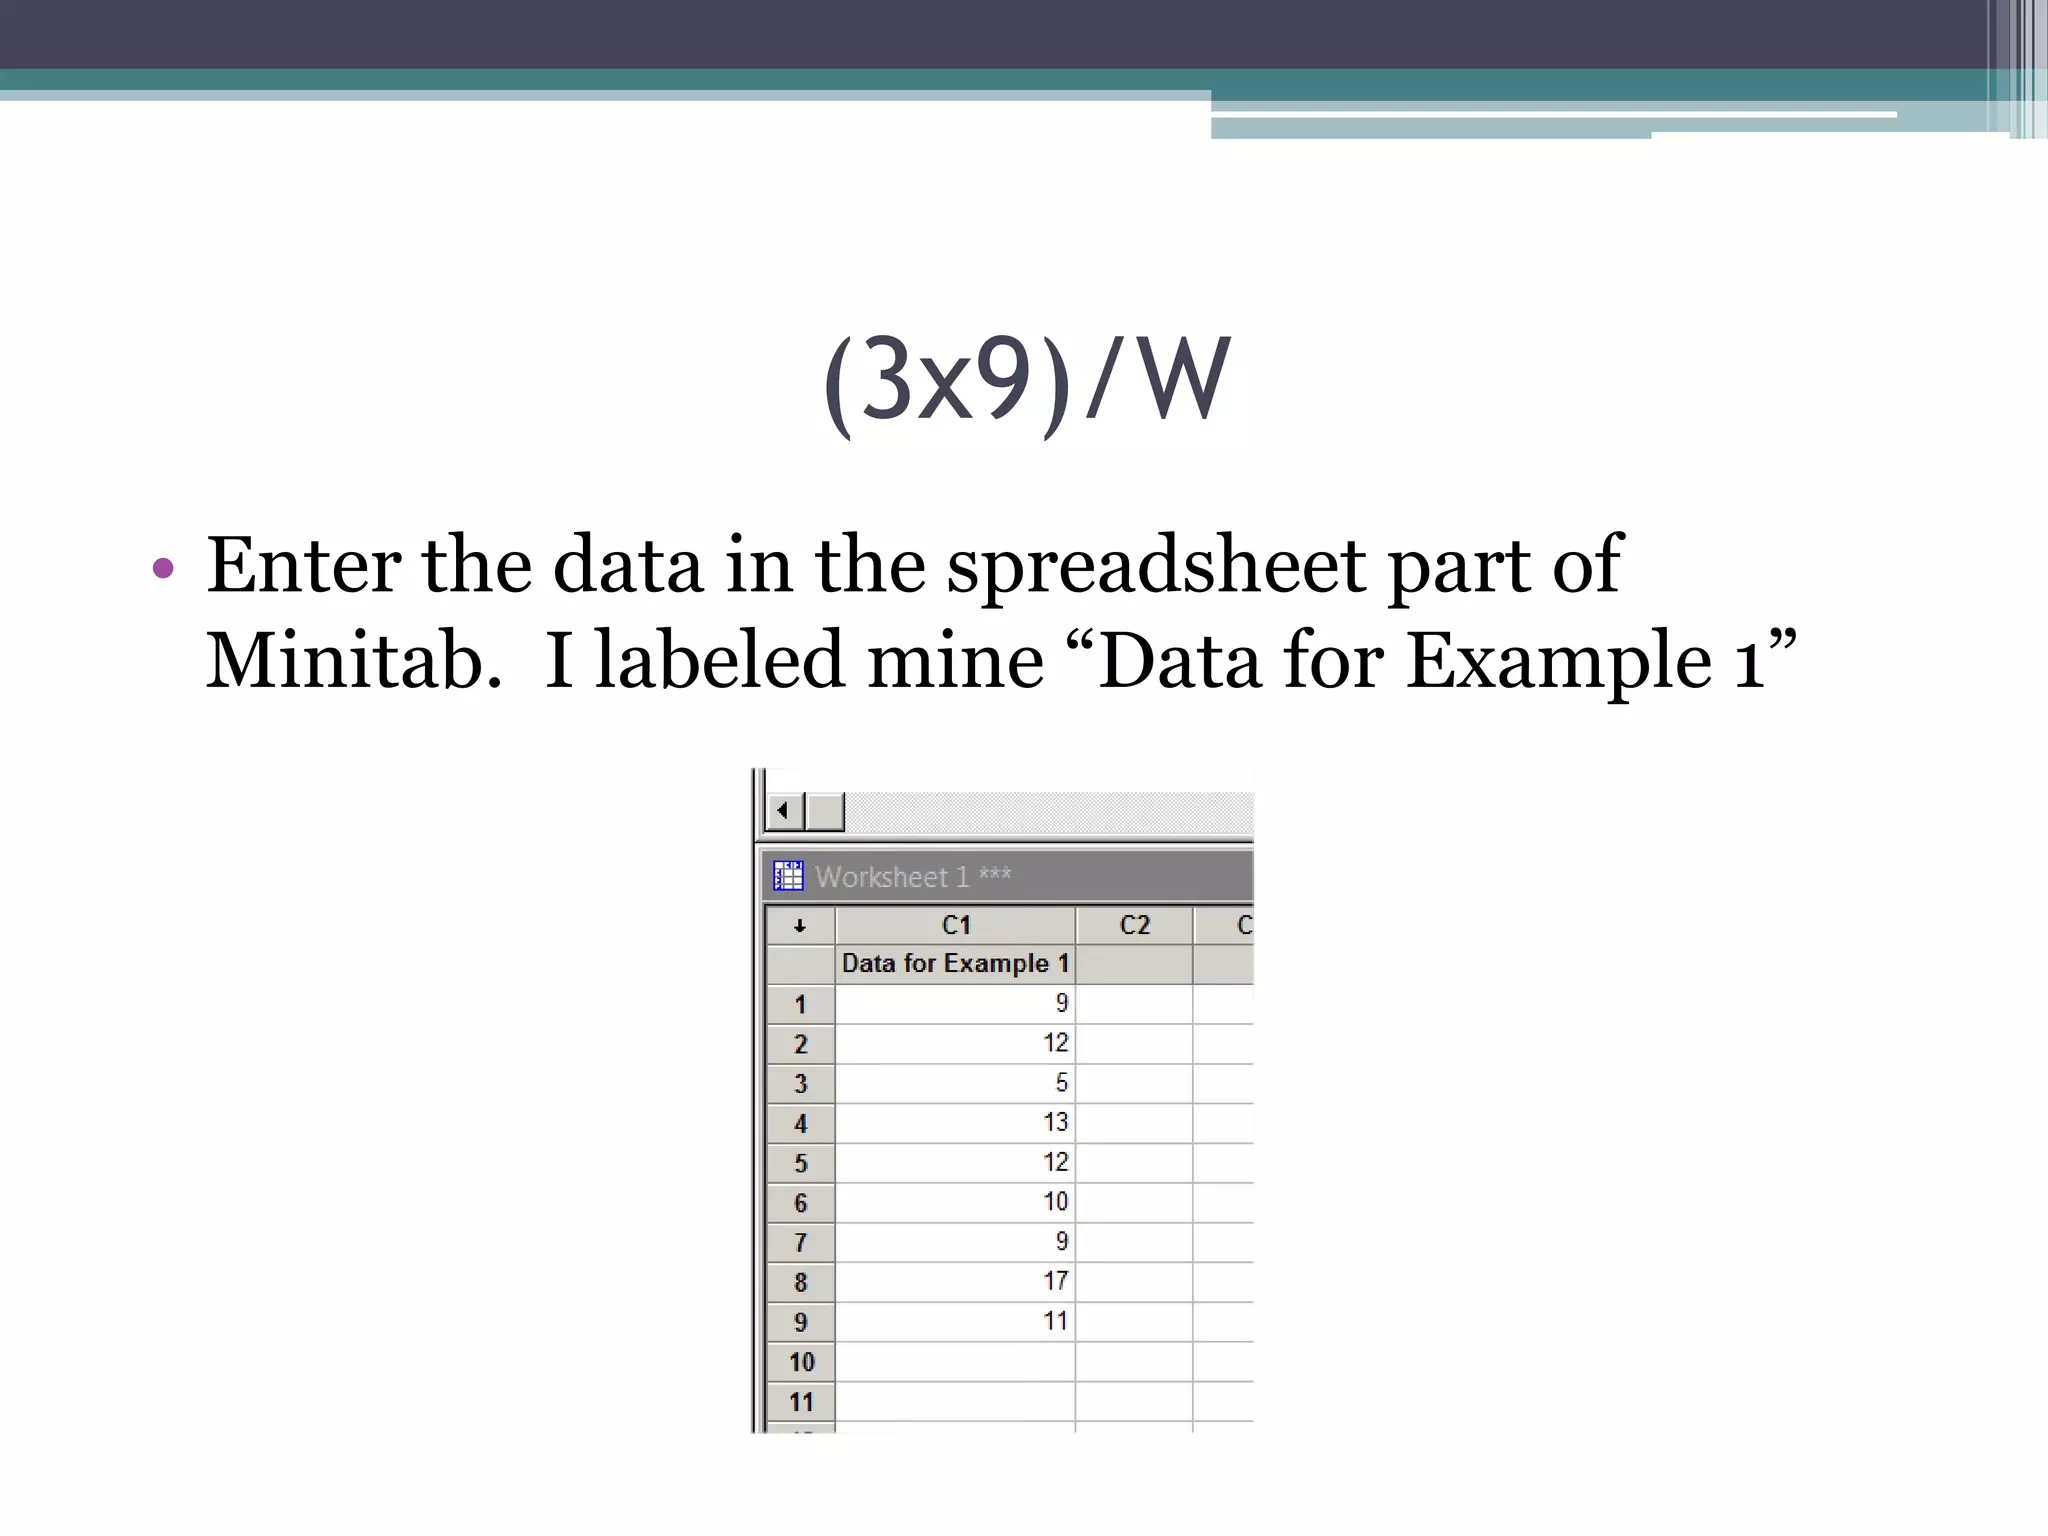
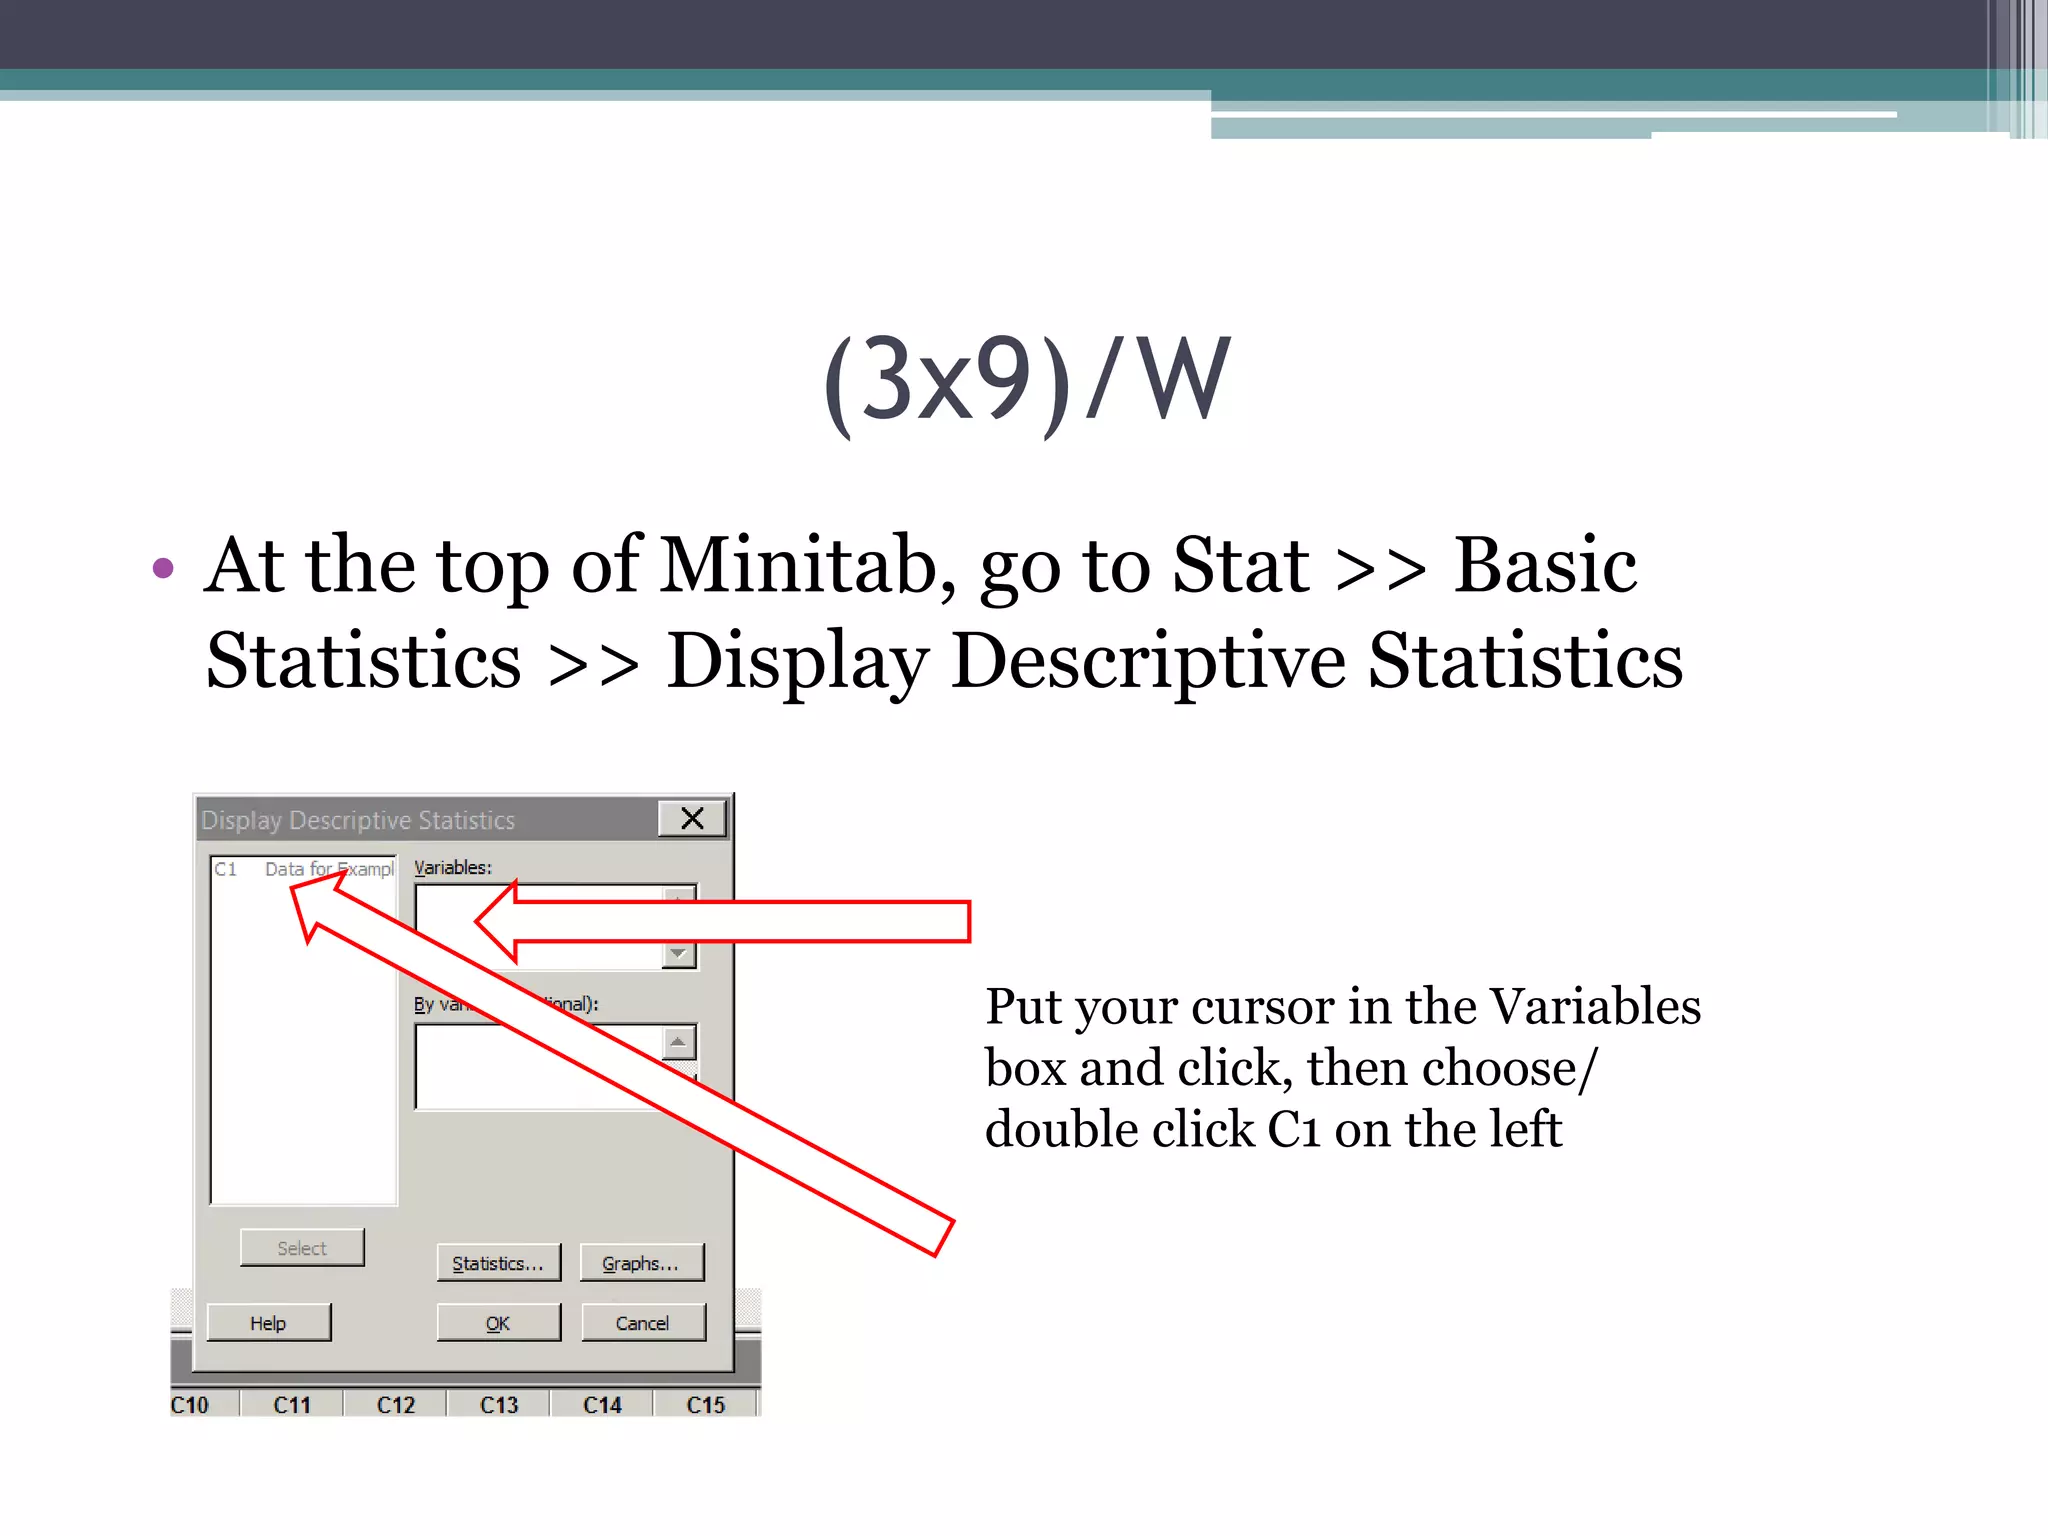
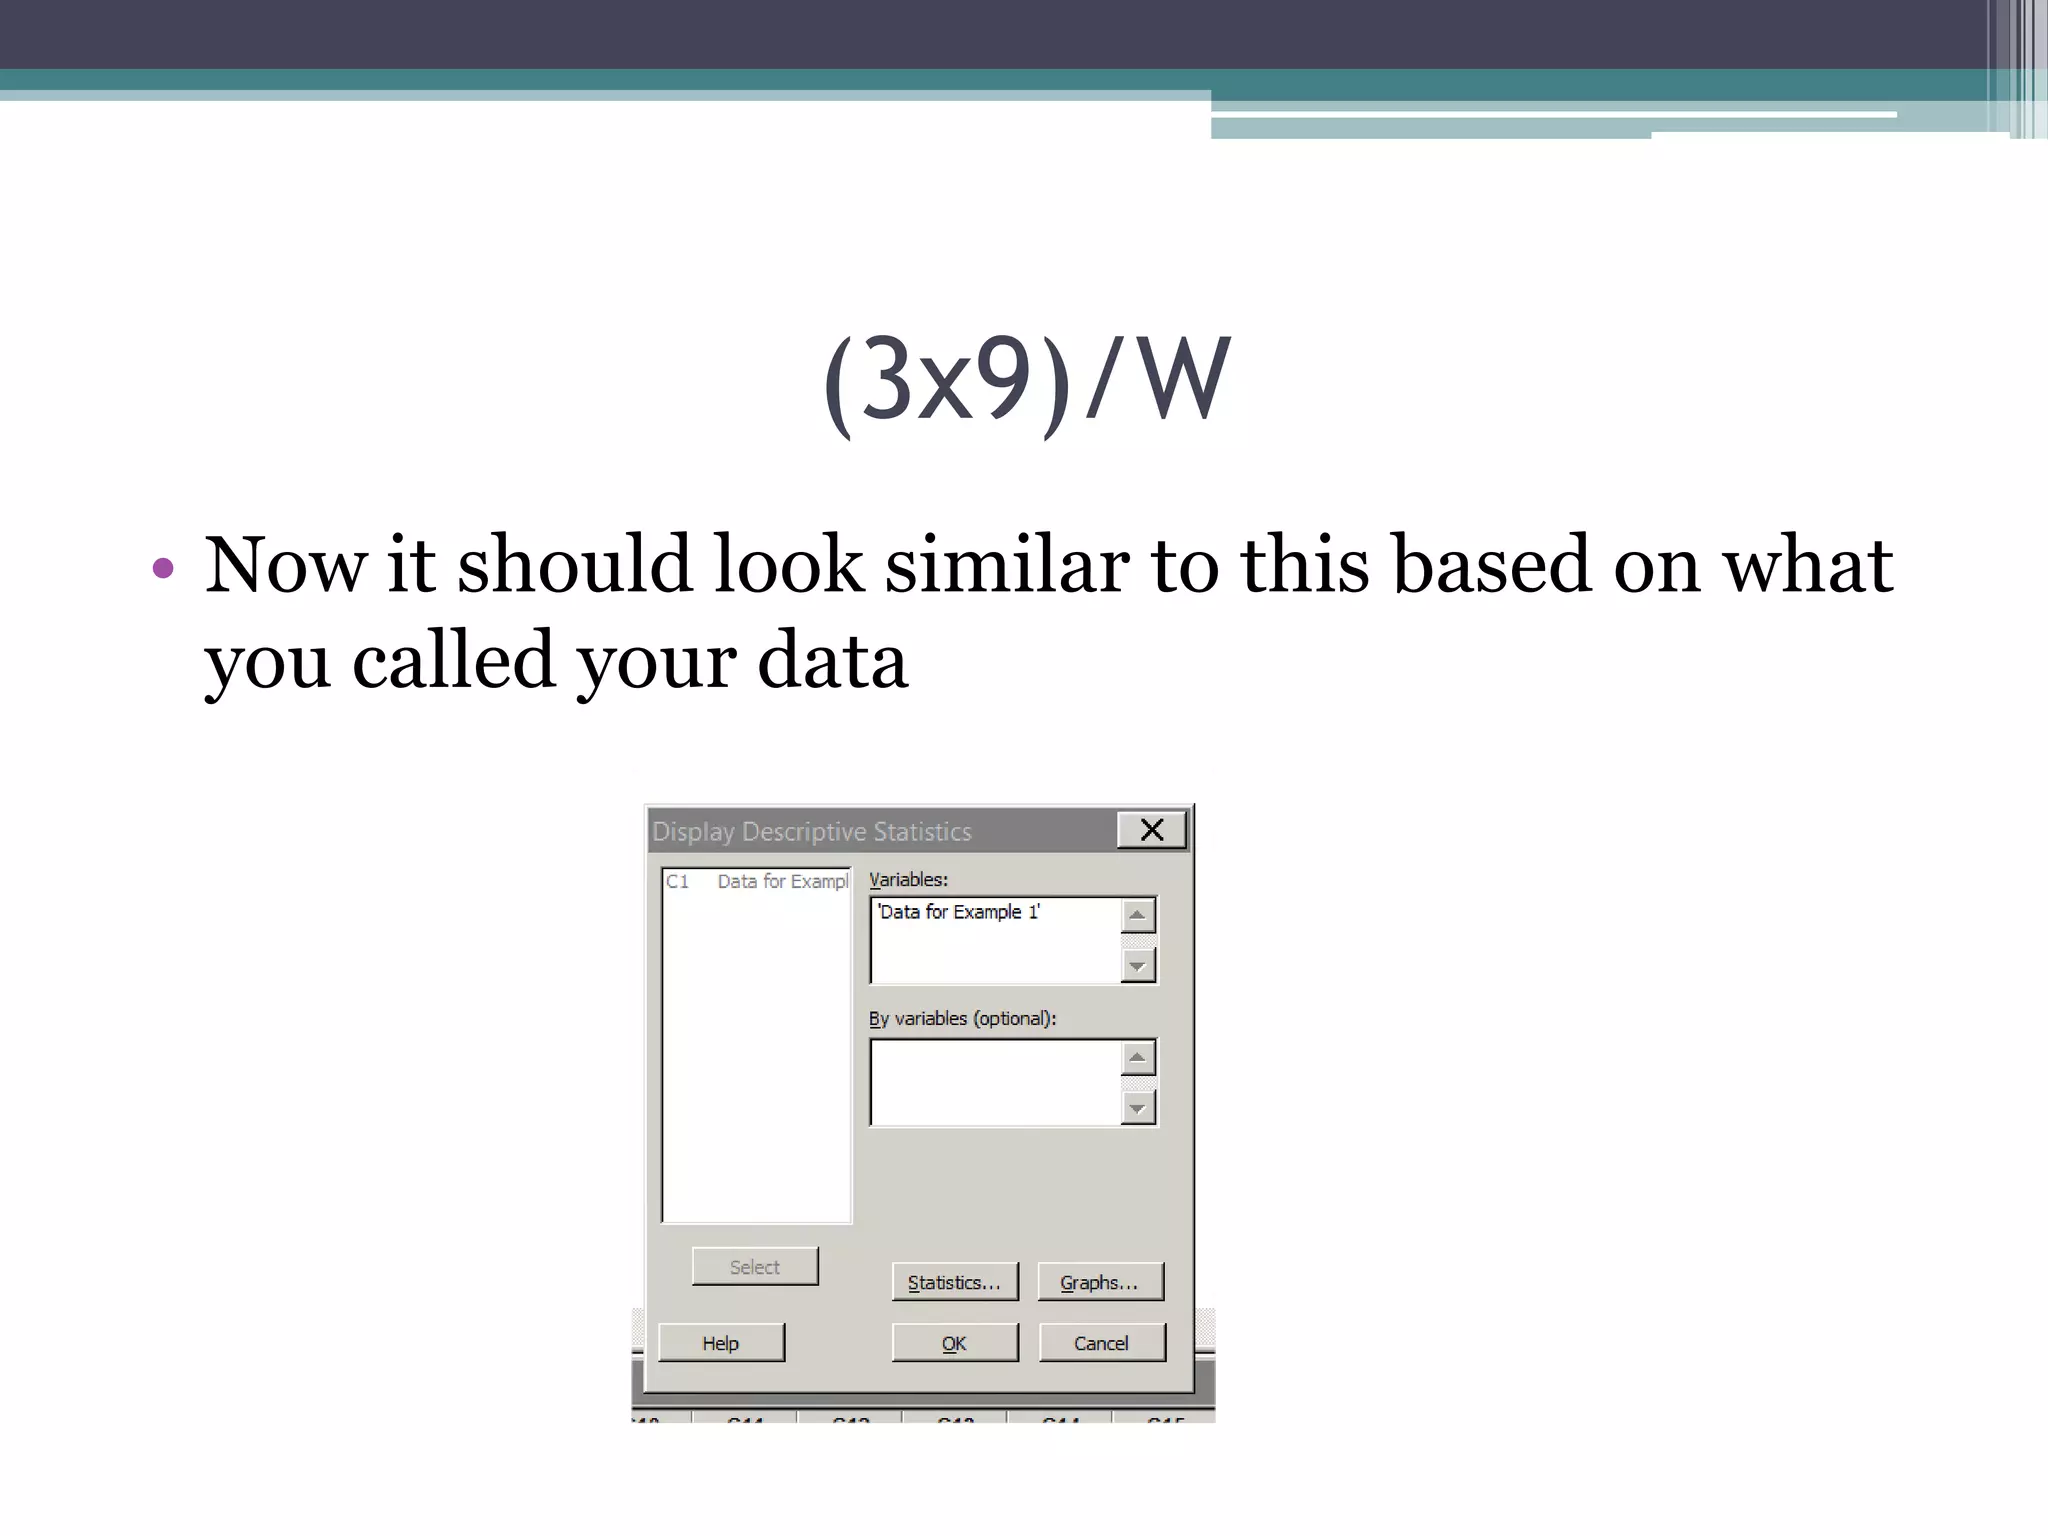
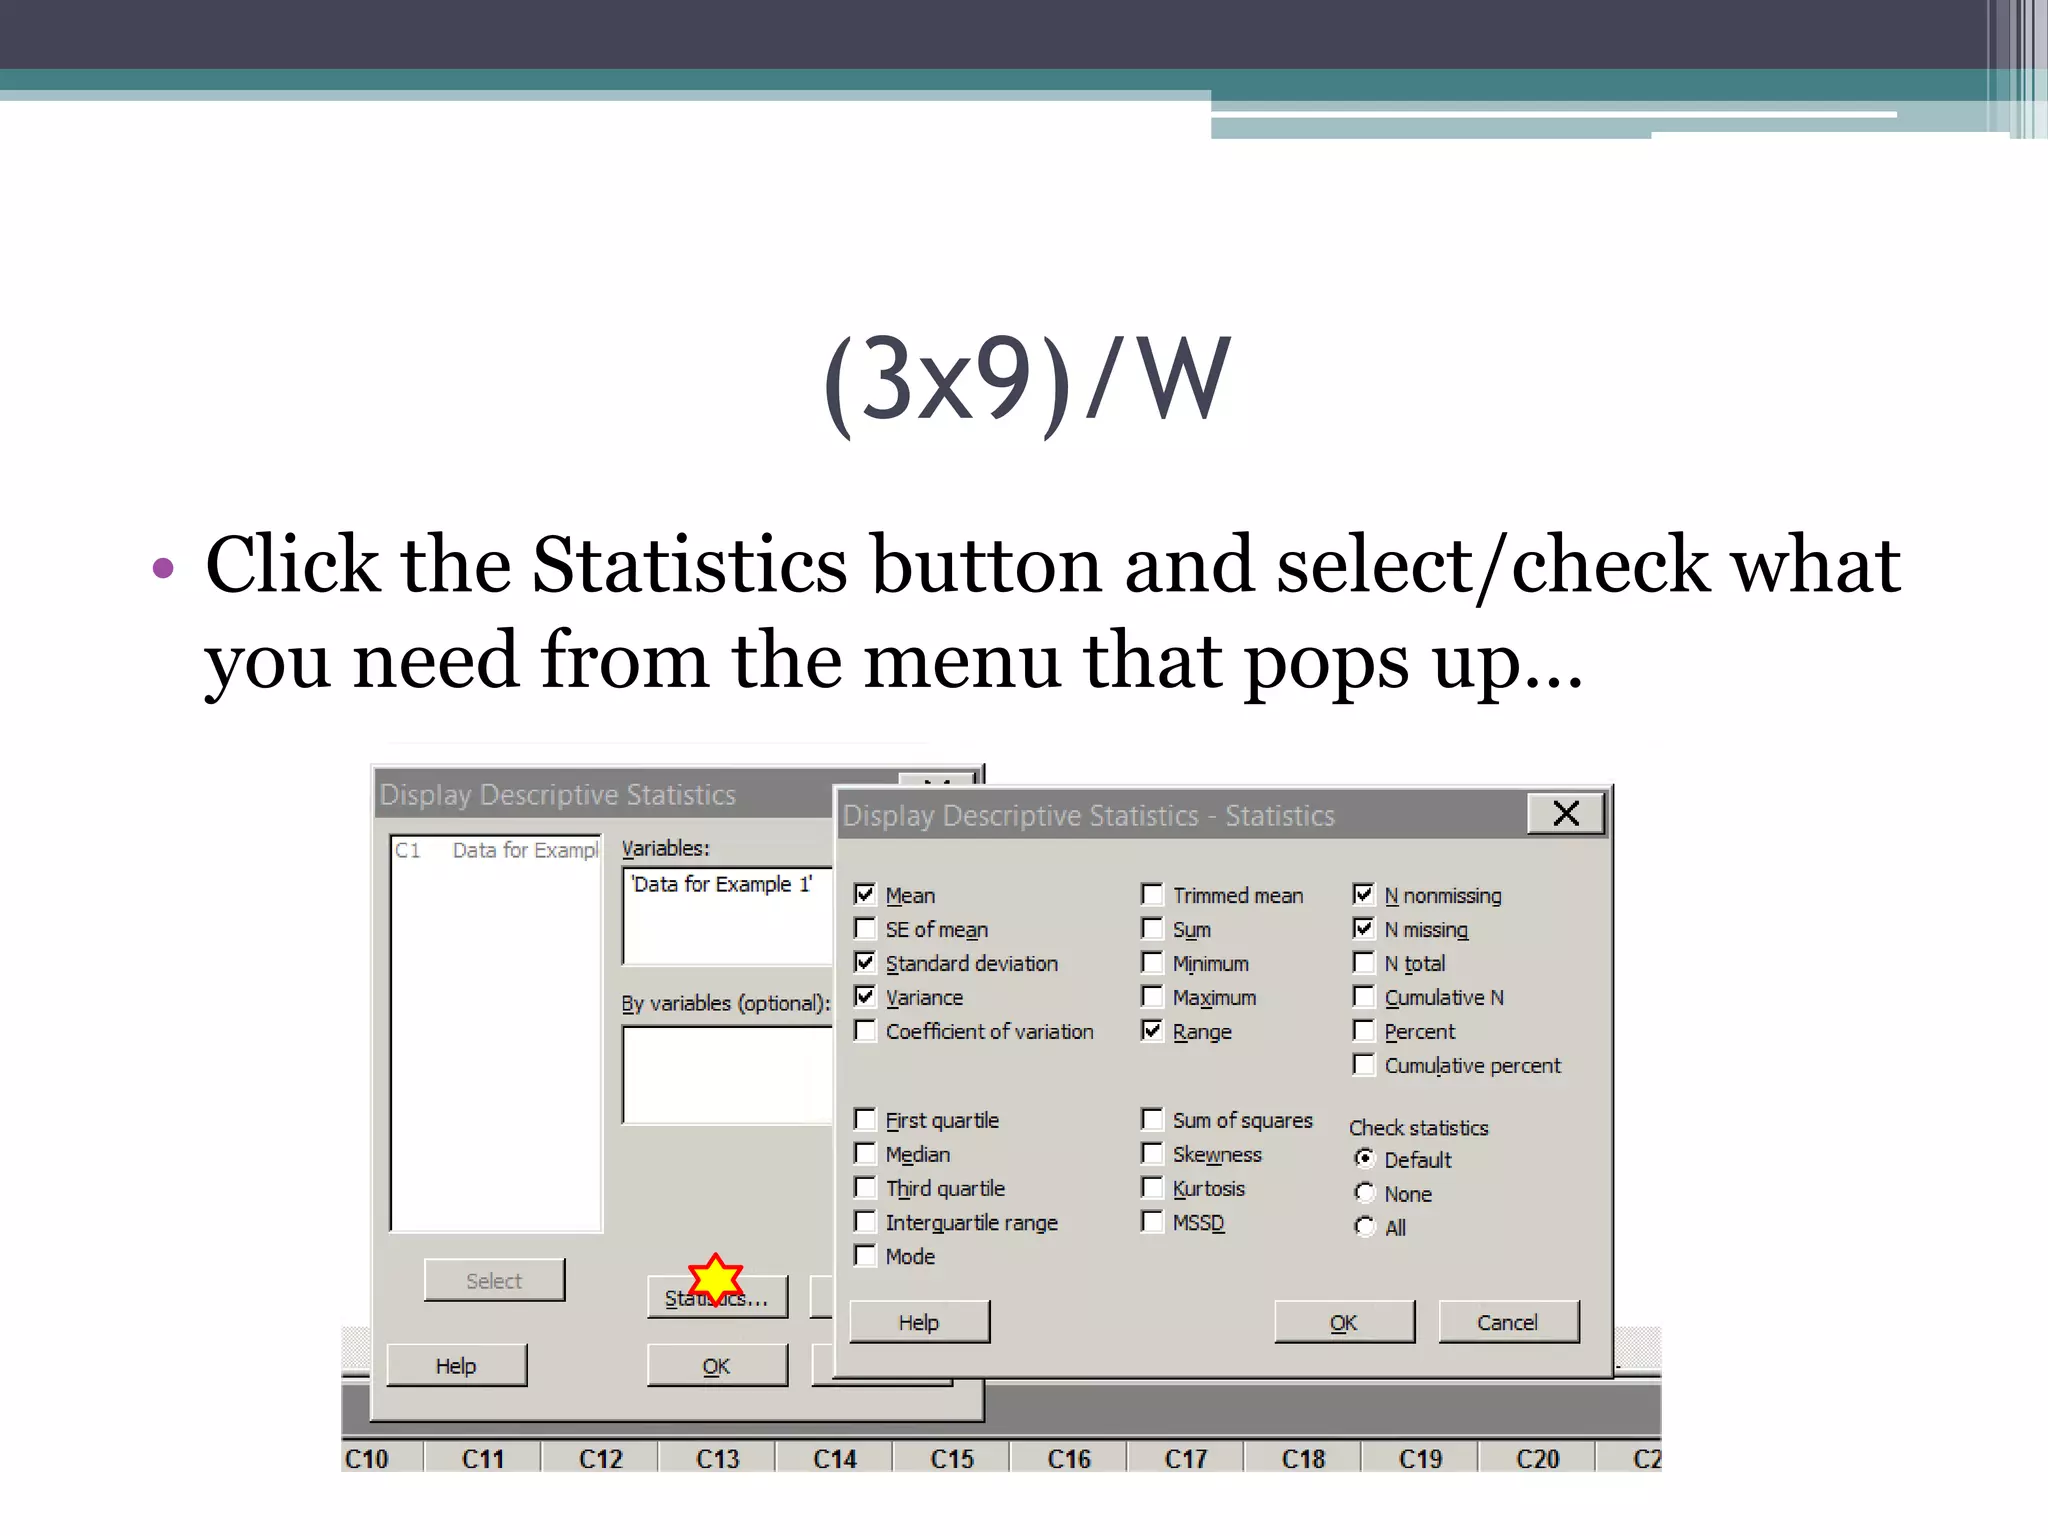
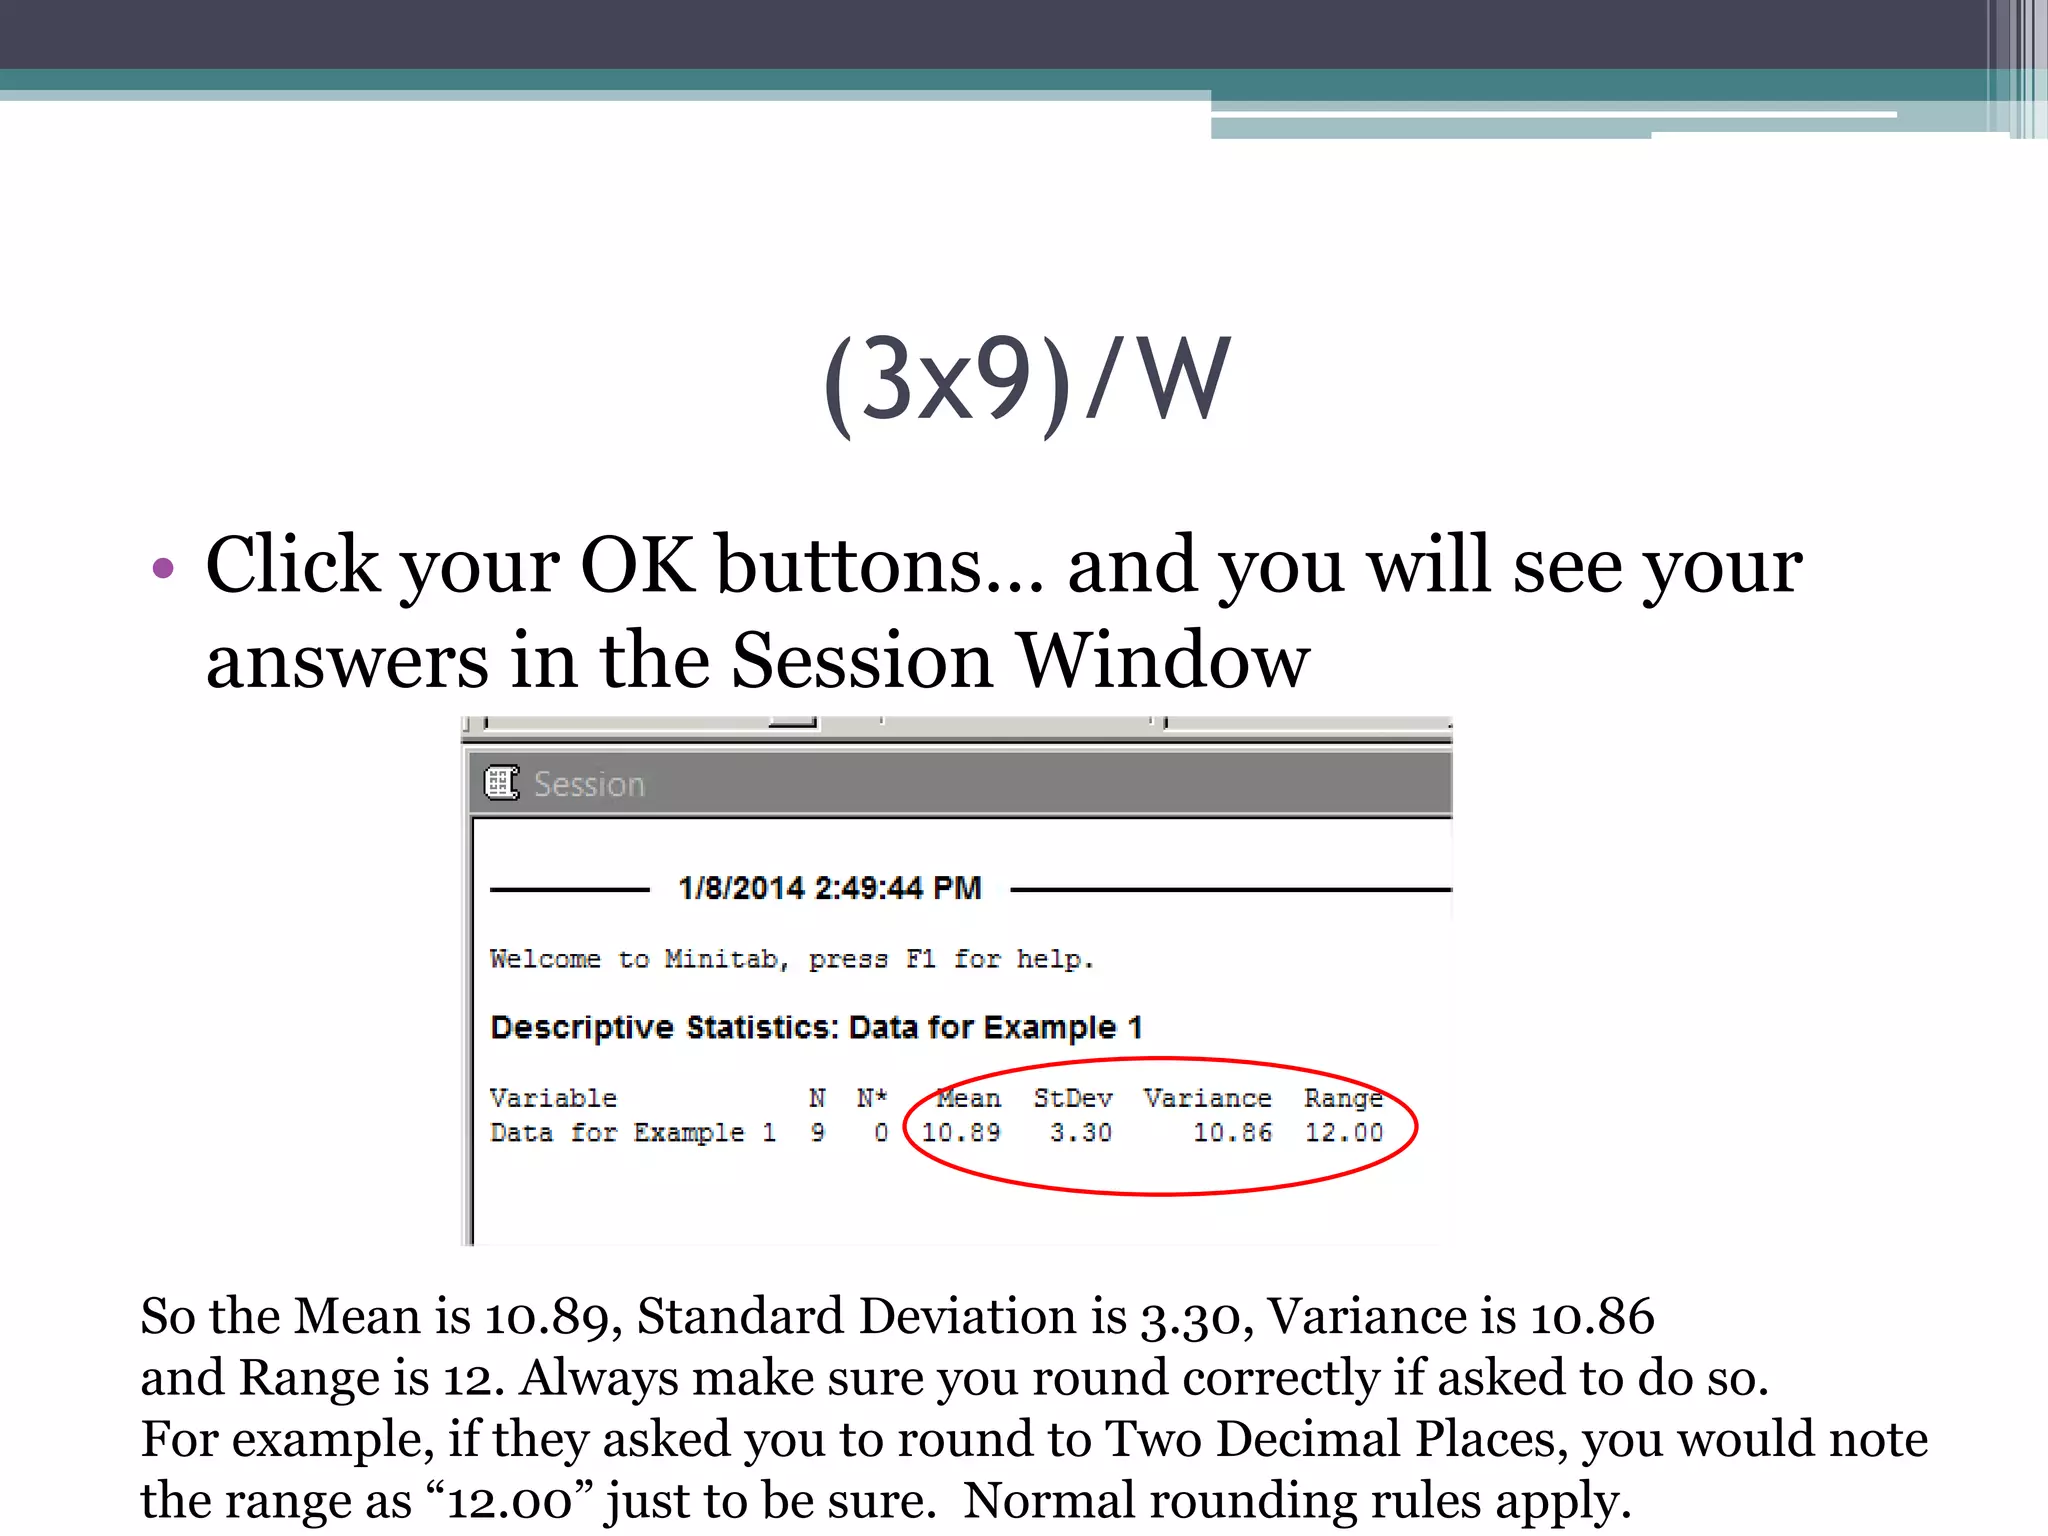
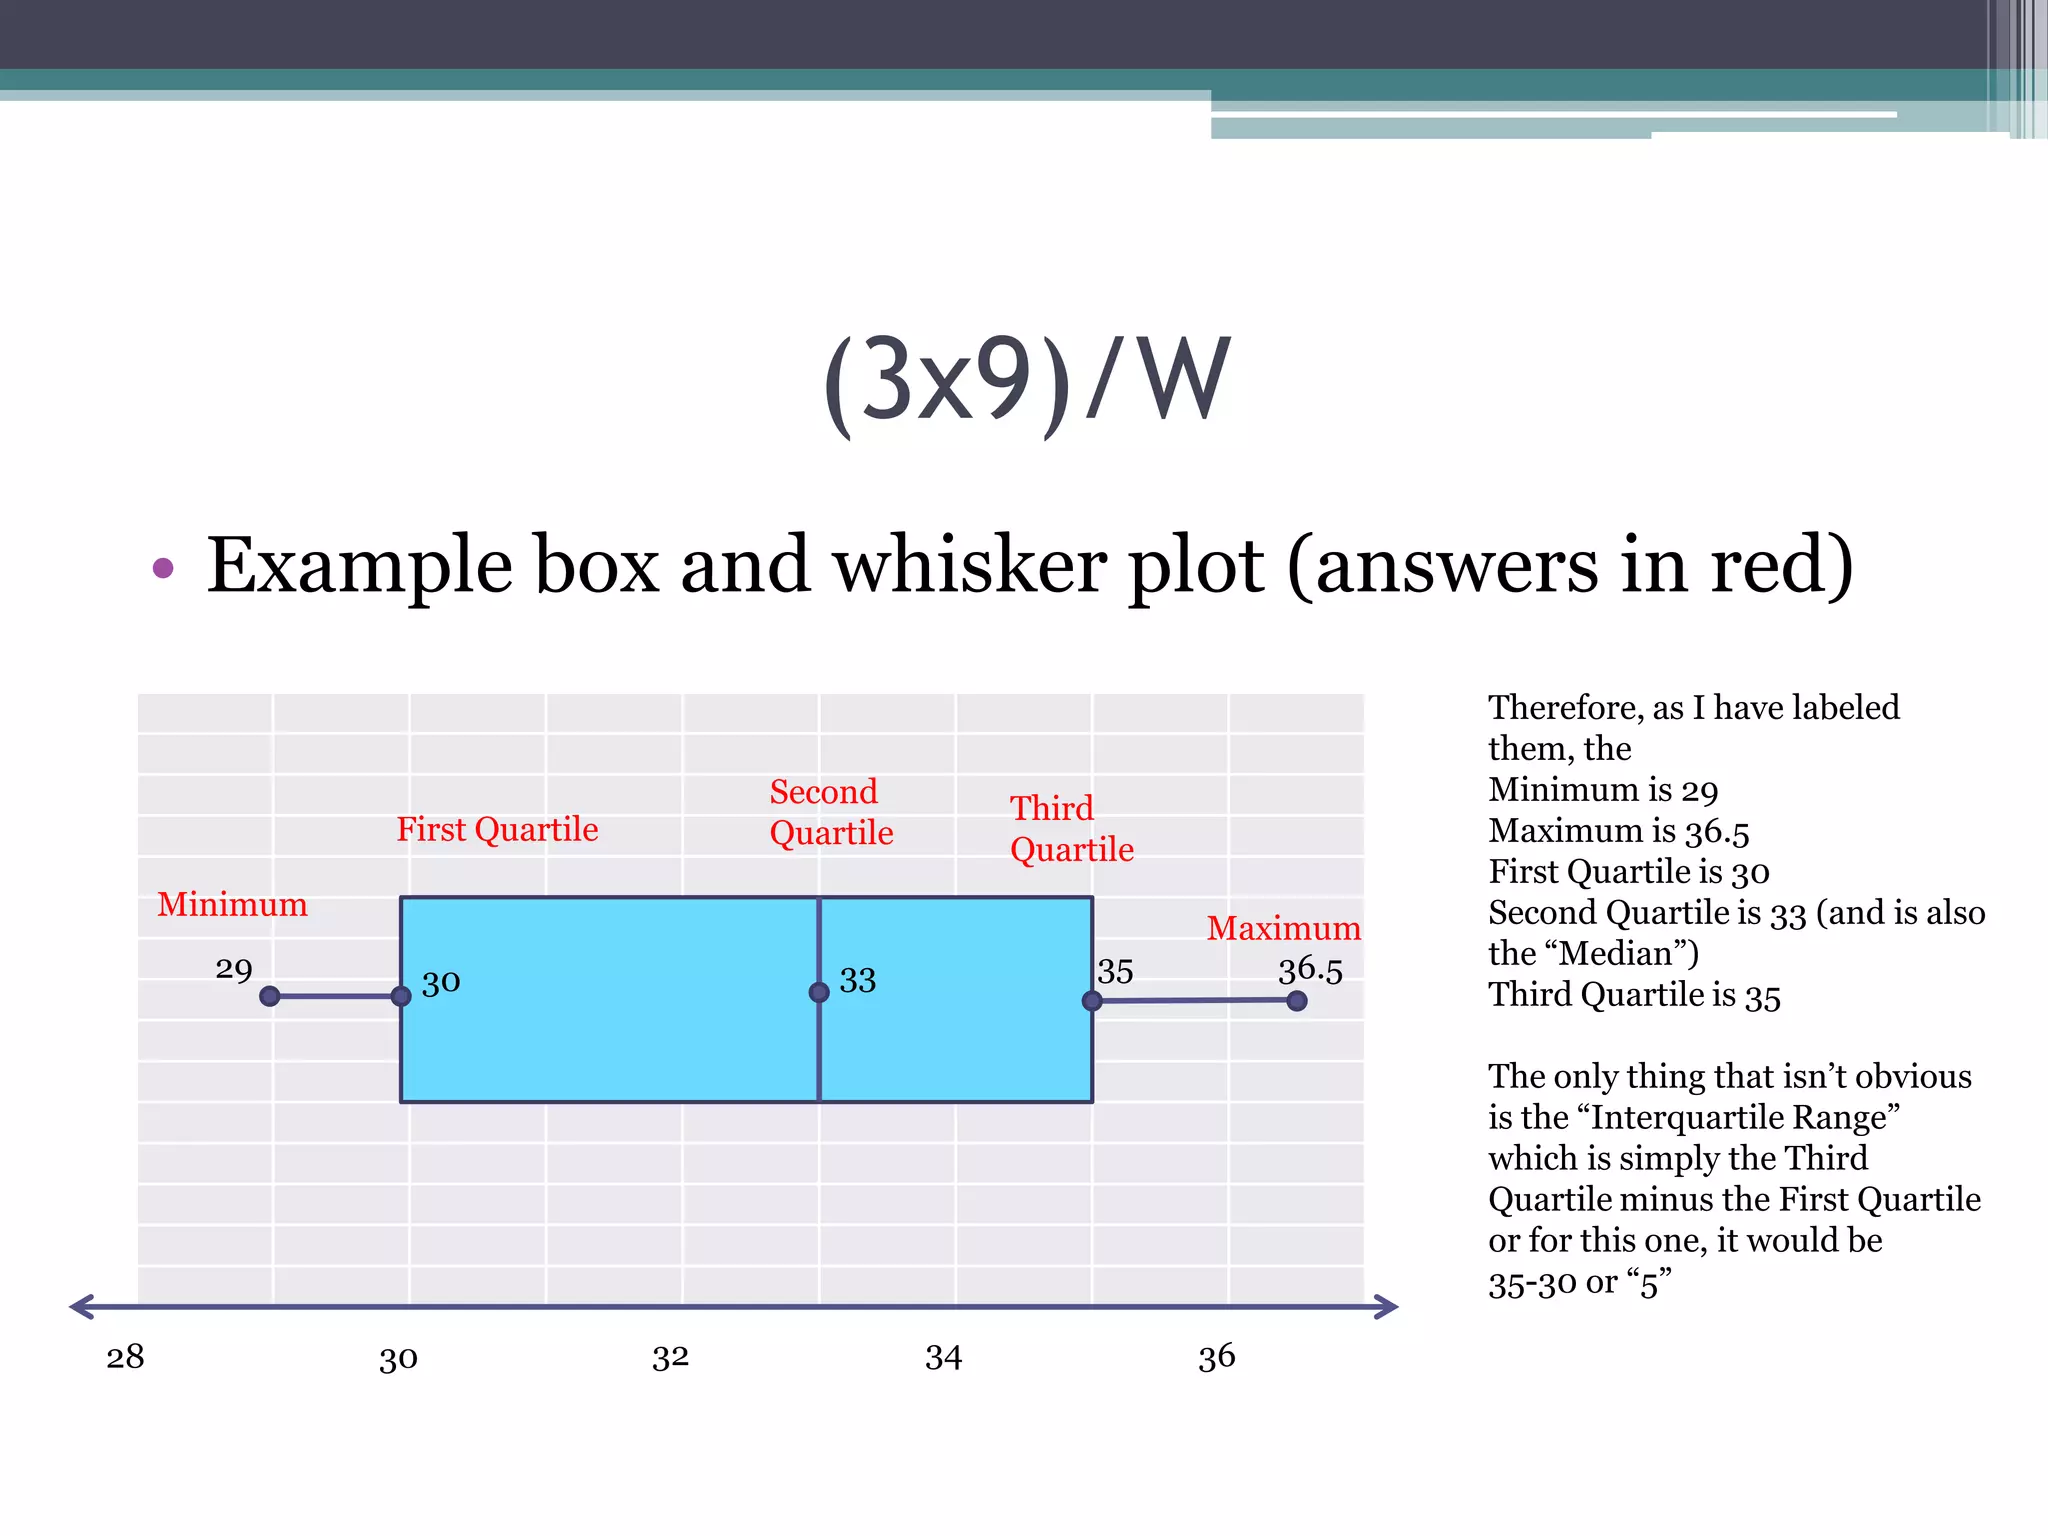
Week 1 3 Extra Homework
Examples (3x9)/W
MA 221
Statistics for Decision Making
Professor Brent Heard
Not to be copied or linked to
without my permission
(3x9)/W
• As noted, this term I will post three additional
homework examples by 9 PM (Mountain Time)
on Wednesday evening in the Statcave.
• (3x9)/W just means “3 by 9 PM on Wednesday.”
• This week, I will do problems similar to number
18, 22 and 24.
(3x9)/W
• Number 18 is a basic “Find the range, mean,
variance and standard deviation” type problem.
I will show you how to do one in Minitab easily.
• Please note that I change the numbers so I don’t
give the exact homework problem.
(3x9)/W
• Example for 18
▫ Find the range, mean, variance and standard
deviation of the sample data set.
9 12 5 13 12 10 9 17 11
(3x9)/W
• First go to Minitab (I access Minitab by going to
the iLab link under Course Home and then
follow the “Go to Citrix” link.)
• This term there seems to be a little different look
to it, but I still found Minitab in the Apps easily.
(3x9)/W
• Enter the data in the spreadsheet part of
Minitab. I labeled mine “Data for Example 1”
(3x9)/W
• At the top of Minitab, go to Stat >> Basic
Statistics >> Display Descriptive Statistics

Put your cursor in the Variables
box and click, then choose/
double click C1 on the left
(3x9)/W
• Now it should look similar to this based on what
you called your data
(3x9)/W
• Click the Statistics button and select/check what
you need from the menu that pops up…
(3x9)/W
• Click your OK buttons… and you will see your
answers in the Session Window

So the Mean is 10.89, Standard Deviation is 3.30, Variance is 10.86
and Range is 12. Always make sure you round correctly if asked to do so.
For example, if they asked you to round to Two Decimal Places, you would note
the range as “12.00” just to be sure. Normal rounding rules apply.
(3x9)/W
• Number 22 is a box and whisker plot type
problem and is actually very easy.
• By looking at a box and whisker plot, you are
asked to identify (a) the minimum, (b) the
maximum, (c) the first quartile, (d) the second
quartile, (e) the third quartile and (f) the
interquartile range.
(3x9)/W
• Example box and whisker plot (answers in red)
Second
Quartile

First Quartile

Third
Quartile

Minimum
29

35

33

30

Maximum
36.5

Therefore, as I have labeled
them, the
Minimum is 29
Maximum is 36.5
First Quartile is 30
Second Quartile is 33 (and is also
the “Median”)
Third Quartile is 35
The only thing that isn’t obvious
is the “Interquartile Range”
which is simply the Third
Quartile minus the First Quartile
or for this one, it would be
35-30 or “5”

28

30

32

34

36
(3x9)/W
• Number 24 is a histogram where we are
matching z scores to a place on the histogram.
• Don’t let this one worry you, it’s actually very
intuitive and easy.
• Let’s look at an example.
(3x9)/W
• Let’s say they want us to identify points A, B and
C with z scores. Our choices are:

z=0
z = -1.88
z = 3.20
Answers next page
16

21

26

31

36

41

46
(3x9)/W
• Let’s say they want us to identify points A, B and
C with z scores. Our choices are:

z=0
Why?
Think about it…
A z score of zero means you are right on
the mean. Look where B is and the
shape of the histogram. It looks very
symmetrical, thus the mean would be
toward the middle.
16

21

26

31

36

41

46
(3x9)/W
• Let’s say they want us to identify points A, B and
C with z scores. Our choices are:

z = -1.88
Why?
Think about it…
A negative z score means you are that
many standard deviations “below” the
mean. So with this close to symmetric
histogram, it would be on the “left” side.

16

21

26

31

36

41

46
(3x9)/W
• Let’s say they want us to identify points A, B and
C with z scores. Our choices are:

z = 3.20
Why?
Think about it…
Positive z scores are that many
standard deviations “above” the mean.
So it has to be on the right side.

16

21

26

31

36

41

46
(3x9)/W
• Last question, “Are there any z scores that are
unusual?”
• YES, the z score of 3.20 would be considered
unusual because it is more than two standard
deviations away from the mean.
• z scores less than -2.00 (for example -2.02, -3.11,
etc.) or greater than 2.00 (for example 2.14, 2.01,
4.19, etc.) are “MORE than two standard deviations
away from the mean)
(3x9)/W
• Hope you enjoyed this…
• More examples next week….

Week 1 Statistics for Decision (3x9 on Wednesday)

  • 1.
    Week 1 3Extra Homework Examples (3x9)/W MA 221 Statistics for Decision Making Professor Brent Heard Not to be copied or linked to without my permission
  • 2.
    (3x9)/W • As noted,this term I will post three additional homework examples by 9 PM (Mountain Time) on Wednesday evening in the Statcave. • (3x9)/W just means “3 by 9 PM on Wednesday.” • This week, I will do problems similar to number 18, 22 and 24.
  • 3.
    (3x9)/W • Number 18is a basic “Find the range, mean, variance and standard deviation” type problem. I will show you how to do one in Minitab easily. • Please note that I change the numbers so I don’t give the exact homework problem.
  • 4.
    (3x9)/W • Example for18 ▫ Find the range, mean, variance and standard deviation of the sample data set. 9 12 5 13 12 10 9 17 11
  • 5.
    (3x9)/W • First goto Minitab (I access Minitab by going to the iLab link under Course Home and then follow the “Go to Citrix” link.) • This term there seems to be a little different look to it, but I still found Minitab in the Apps easily.
  • 6.
    (3x9)/W • Enter thedata in the spreadsheet part of Minitab. I labeled mine “Data for Example 1”
  • 7.
    (3x9)/W • At thetop of Minitab, go to Stat >> Basic Statistics >> Display Descriptive Statistics Put your cursor in the Variables box and click, then choose/ double click C1 on the left
  • 8.
    (3x9)/W • Now itshould look similar to this based on what you called your data
  • 9.
    (3x9)/W • Click theStatistics button and select/check what you need from the menu that pops up…
  • 10.
    (3x9)/W • Click yourOK buttons… and you will see your answers in the Session Window So the Mean is 10.89, Standard Deviation is 3.30, Variance is 10.86 and Range is 12. Always make sure you round correctly if asked to do so. For example, if they asked you to round to Two Decimal Places, you would note the range as “12.00” just to be sure. Normal rounding rules apply.
  • 11.
    (3x9)/W • Number 22is a box and whisker plot type problem and is actually very easy. • By looking at a box and whisker plot, you are asked to identify (a) the minimum, (b) the maximum, (c) the first quartile, (d) the second quartile, (e) the third quartile and (f) the interquartile range.
  • 12.
    (3x9)/W • Example boxand whisker plot (answers in red) Second Quartile First Quartile Third Quartile Minimum 29 35 33 30 Maximum 36.5 Therefore, as I have labeled them, the Minimum is 29 Maximum is 36.5 First Quartile is 30 Second Quartile is 33 (and is also the “Median”) Third Quartile is 35 The only thing that isn’t obvious is the “Interquartile Range” which is simply the Third Quartile minus the First Quartile or for this one, it would be 35-30 or “5” 28 30 32 34 36
  • 13.
    (3x9)/W • Number 24is a histogram where we are matching z scores to a place on the histogram. • Don’t let this one worry you, it’s actually very intuitive and easy. • Let’s look at an example.
  • 14.
    (3x9)/W • Let’s saythey want us to identify points A, B and C with z scores. Our choices are: z=0 z = -1.88 z = 3.20 Answers next page 16 21 26 31 36 41 46
  • 15.
    (3x9)/W • Let’s saythey want us to identify points A, B and C with z scores. Our choices are: z=0 Why? Think about it… A z score of zero means you are right on the mean. Look where B is and the shape of the histogram. It looks very symmetrical, thus the mean would be toward the middle. 16 21 26 31 36 41 46
  • 16.
    (3x9)/W • Let’s saythey want us to identify points A, B and C with z scores. Our choices are: z = -1.88 Why? Think about it… A negative z score means you are that many standard deviations “below” the mean. So with this close to symmetric histogram, it would be on the “left” side. 16 21 26 31 36 41 46
  • 17.
    (3x9)/W • Let’s saythey want us to identify points A, B and C with z scores. Our choices are: z = 3.20 Why? Think about it… Positive z scores are that many standard deviations “above” the mean. So it has to be on the right side. 16 21 26 31 36 41 46
  • 18.
    (3x9)/W • Last question,“Are there any z scores that are unusual?” • YES, the z score of 3.20 would be considered unusual because it is more than two standard deviations away from the mean. • z scores less than -2.00 (for example -2.02, -3.11, etc.) or greater than 2.00 (for example 2.14, 2.01, 4.19, etc.) are “MORE than two standard deviations away from the mean)
  • 19.
    (3x9)/W • Hope youenjoyed this… • More examples next week….