Downloaded 119 times

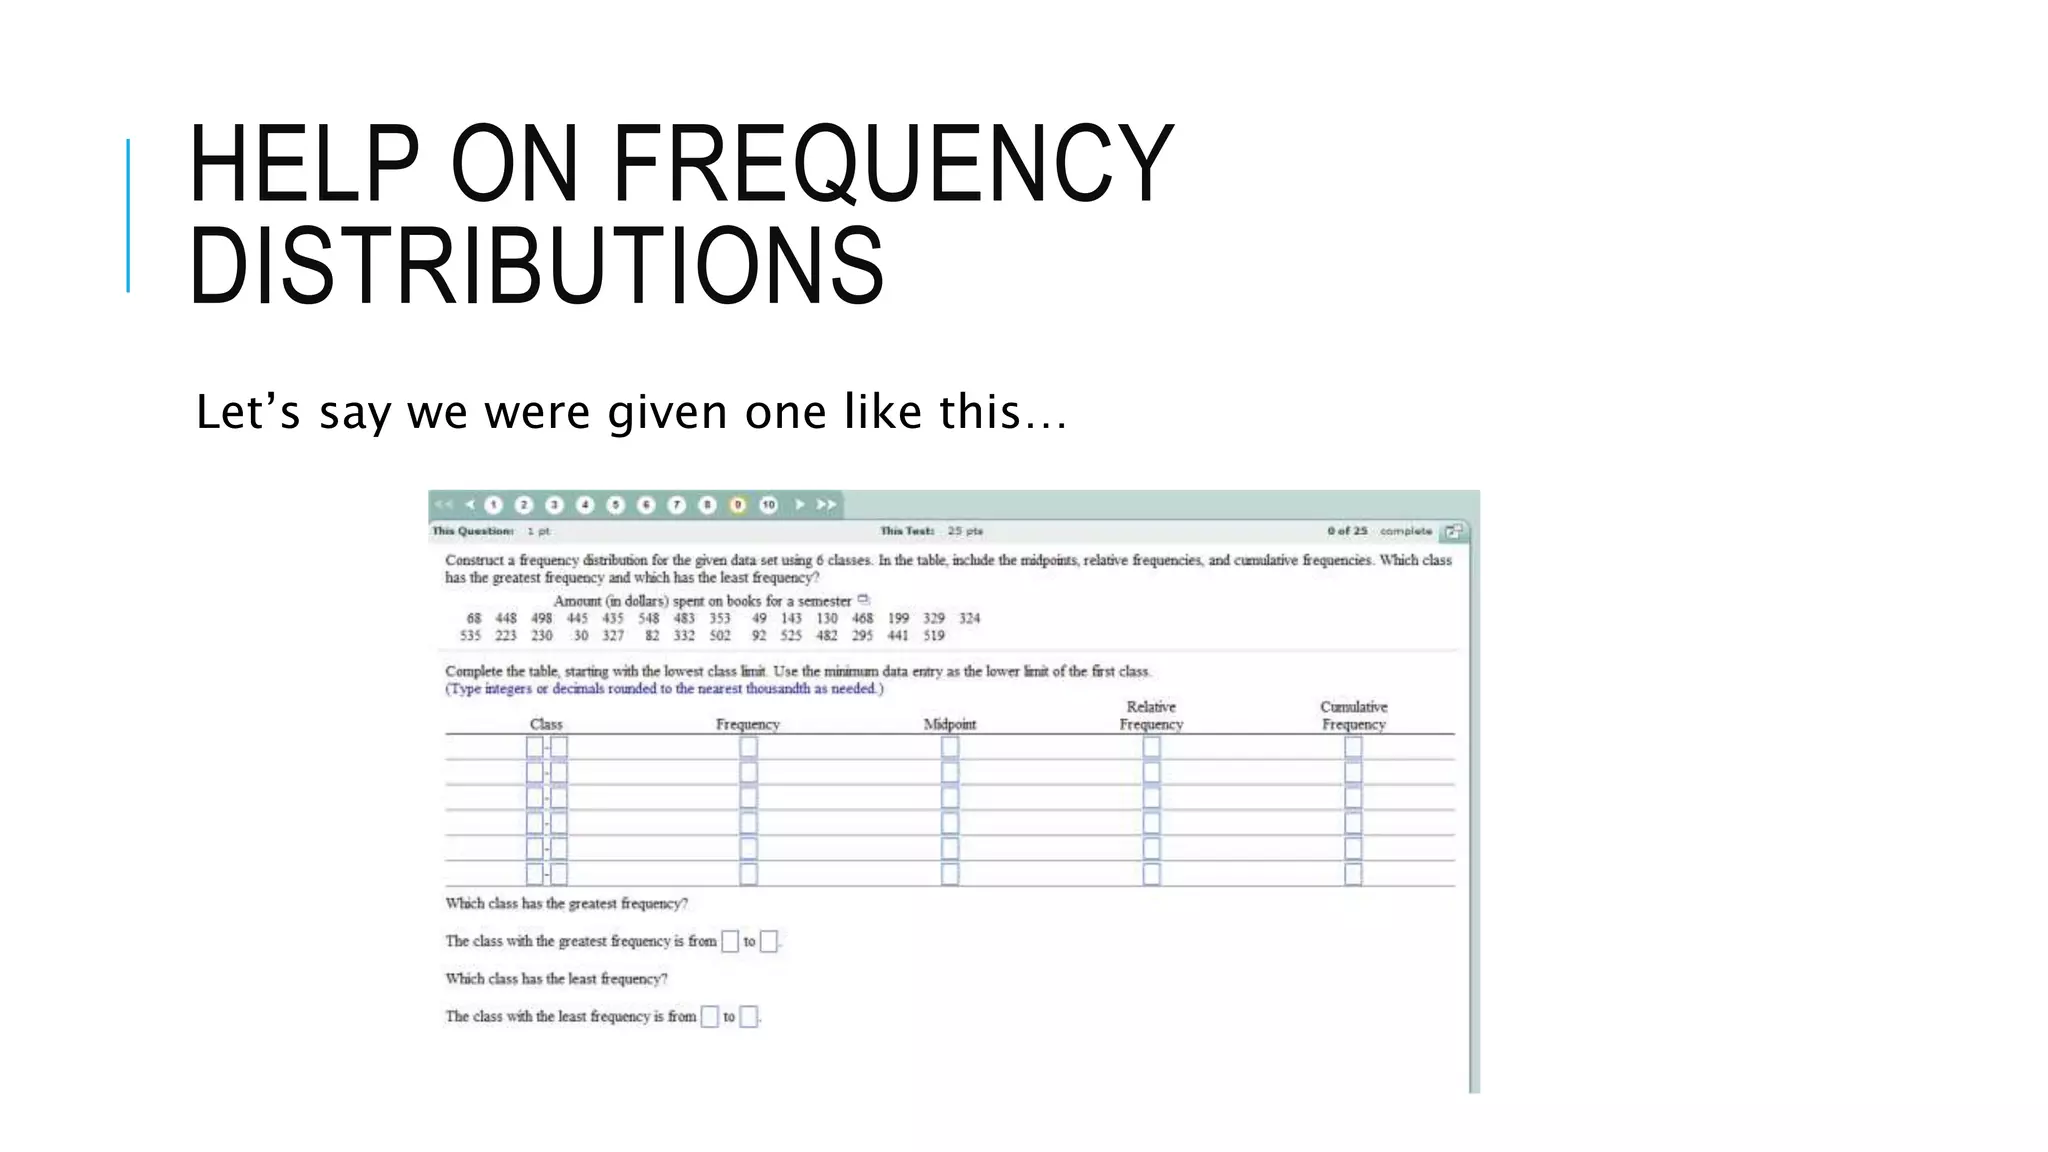
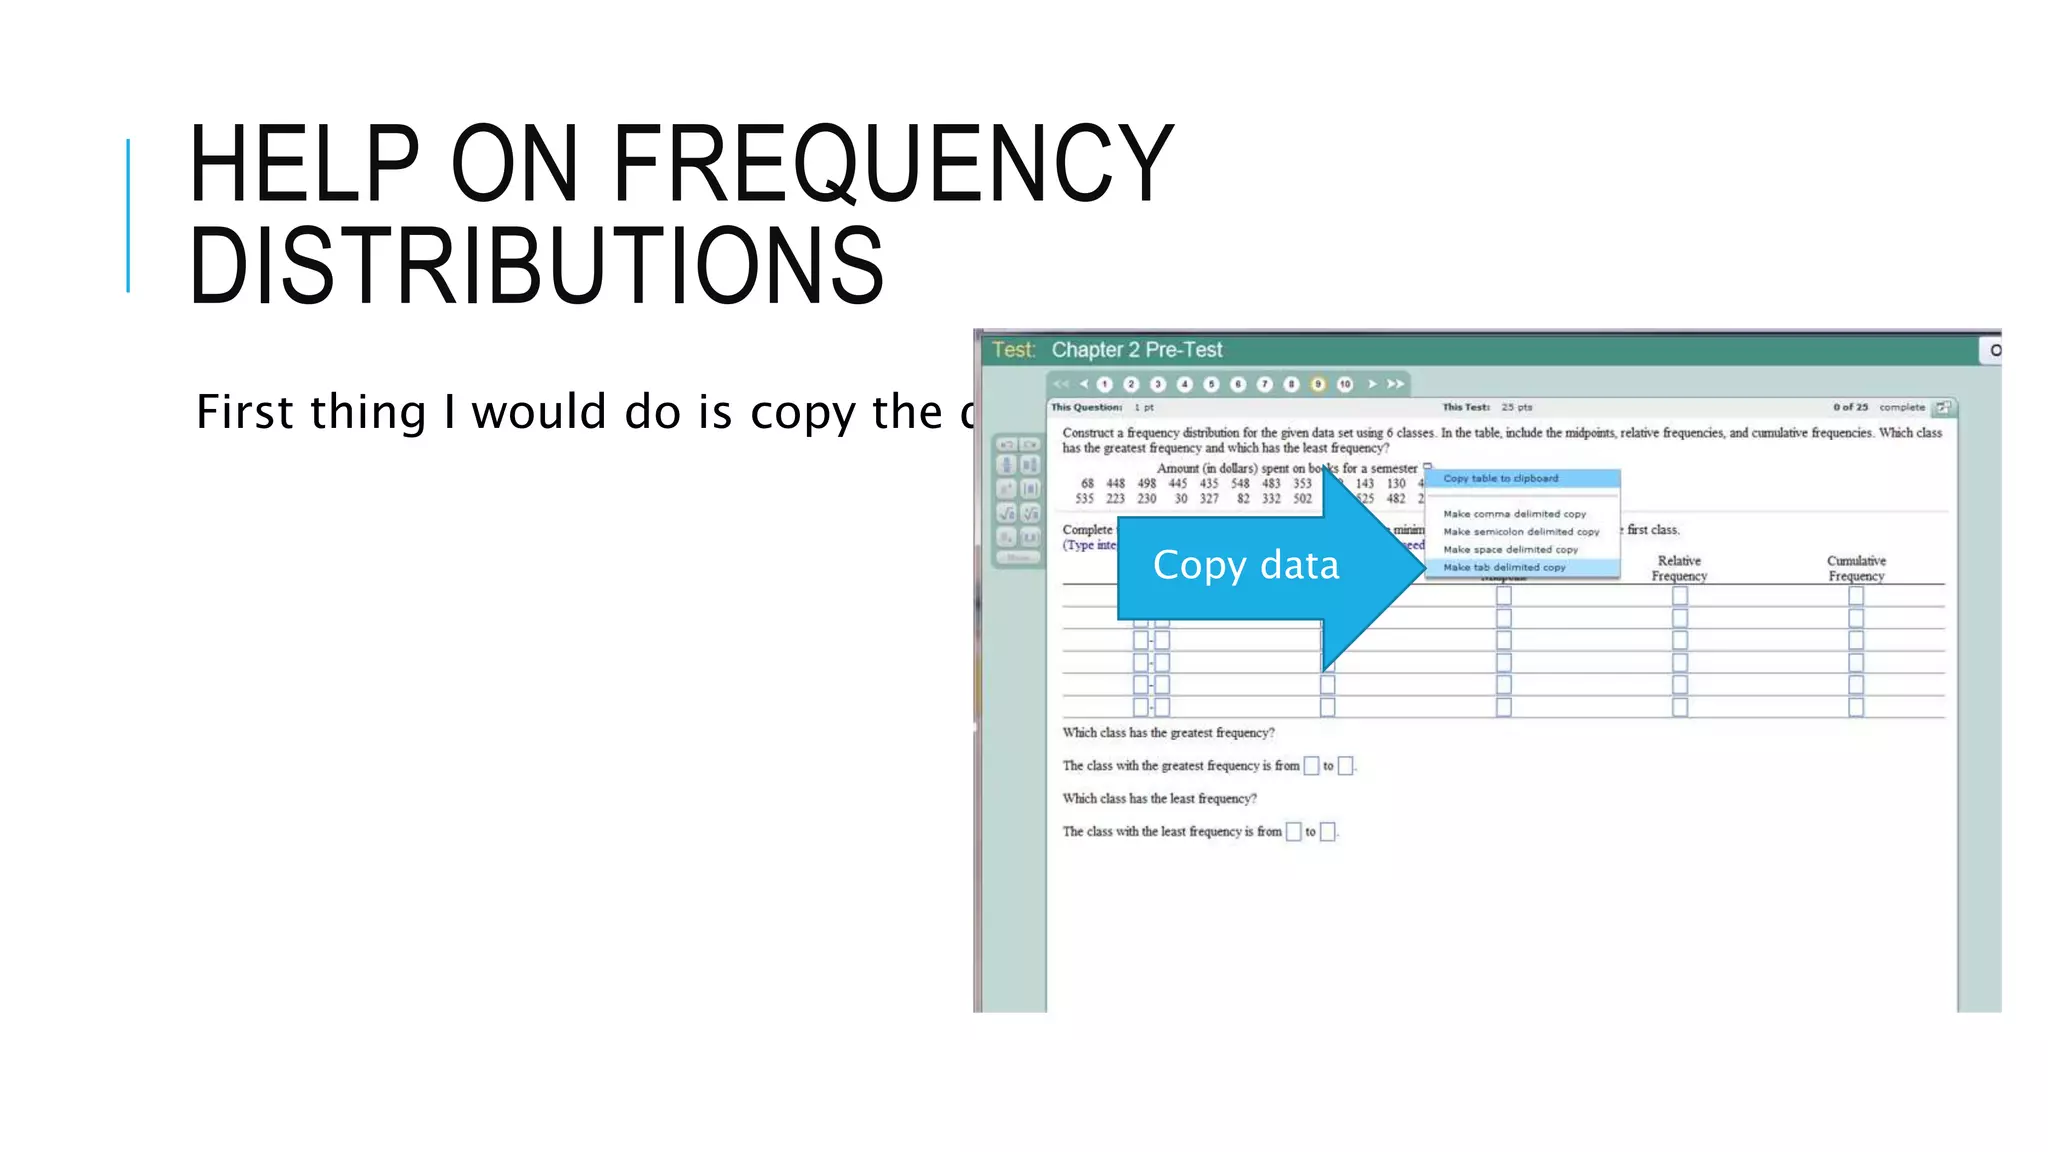
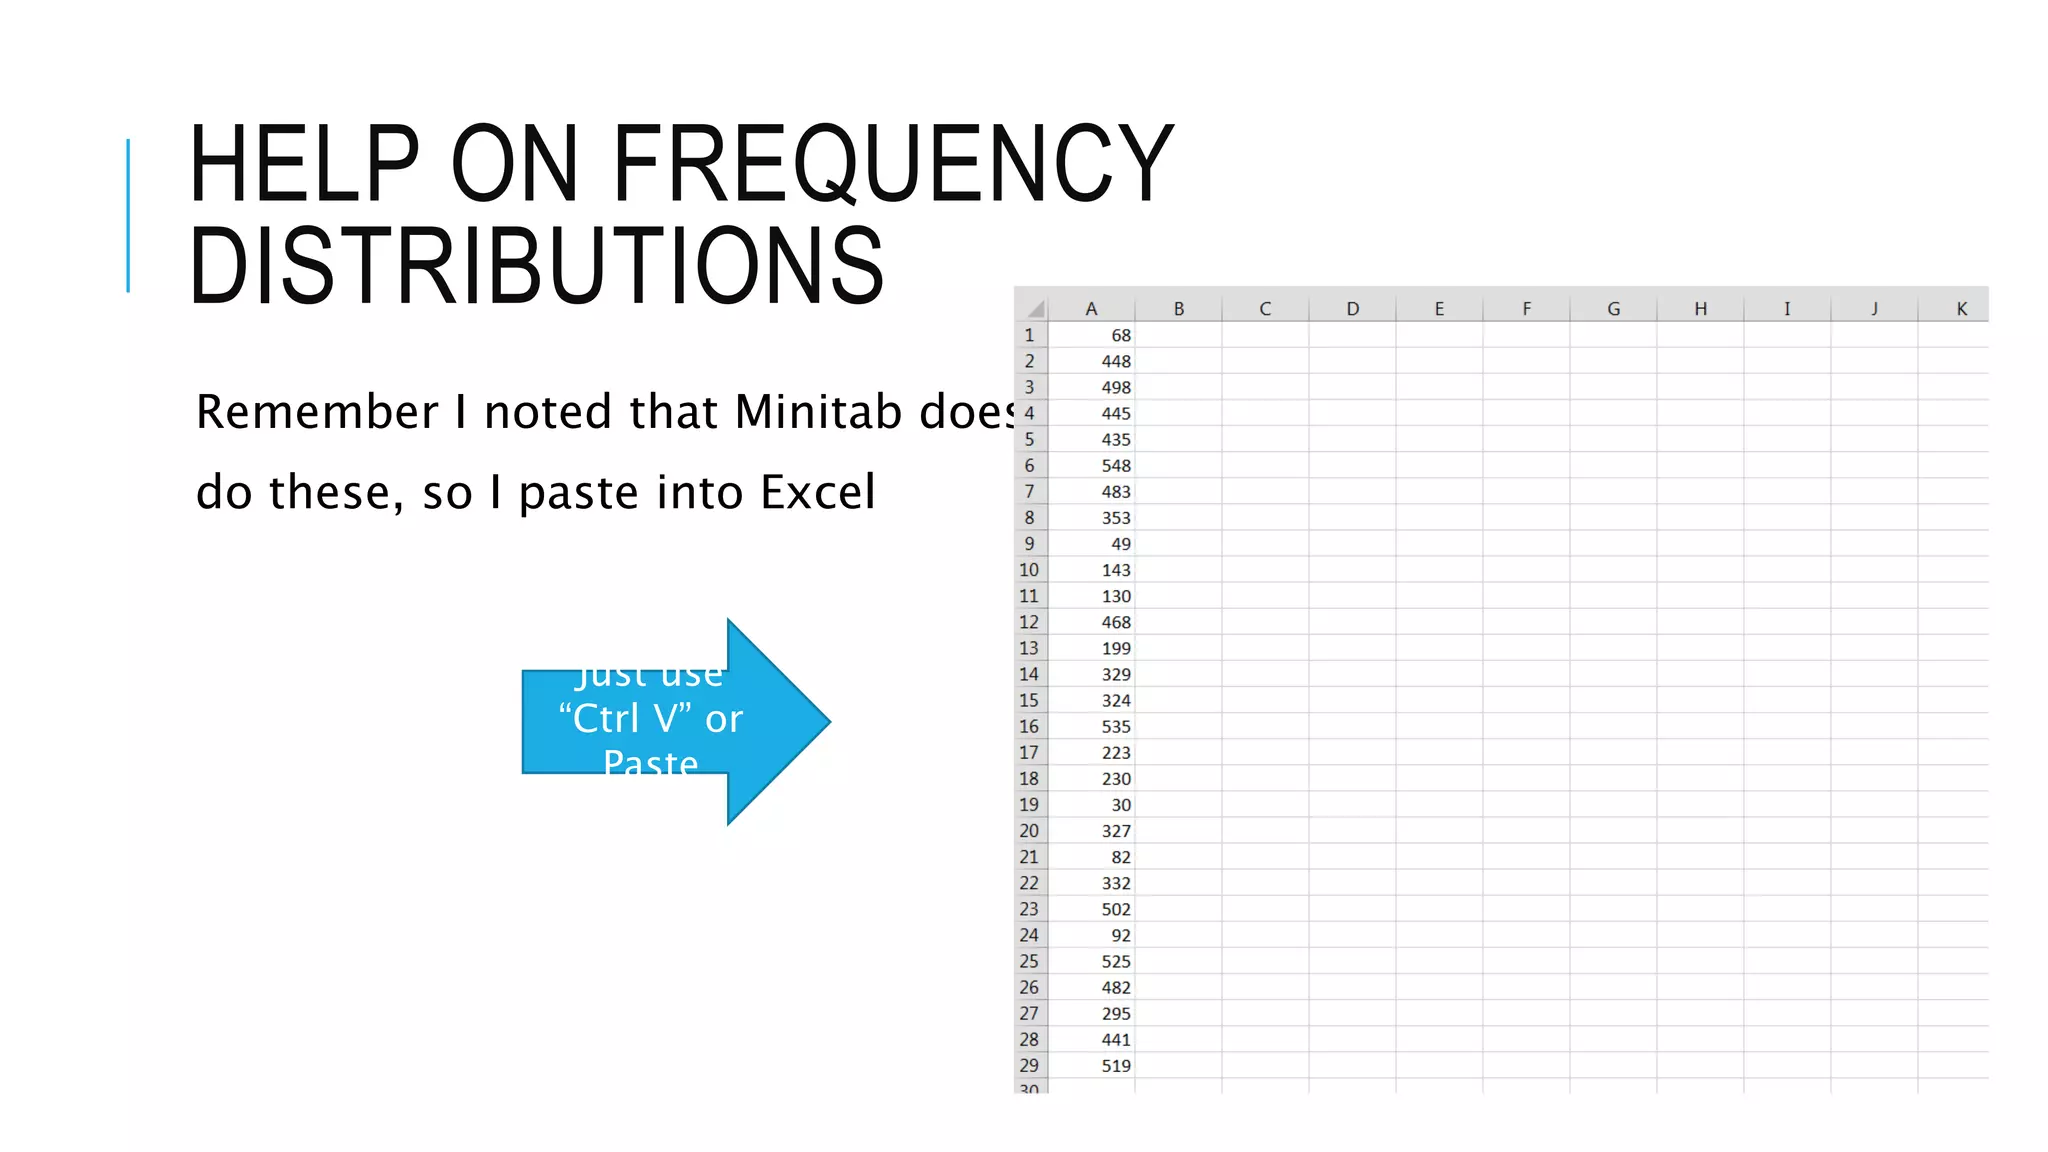
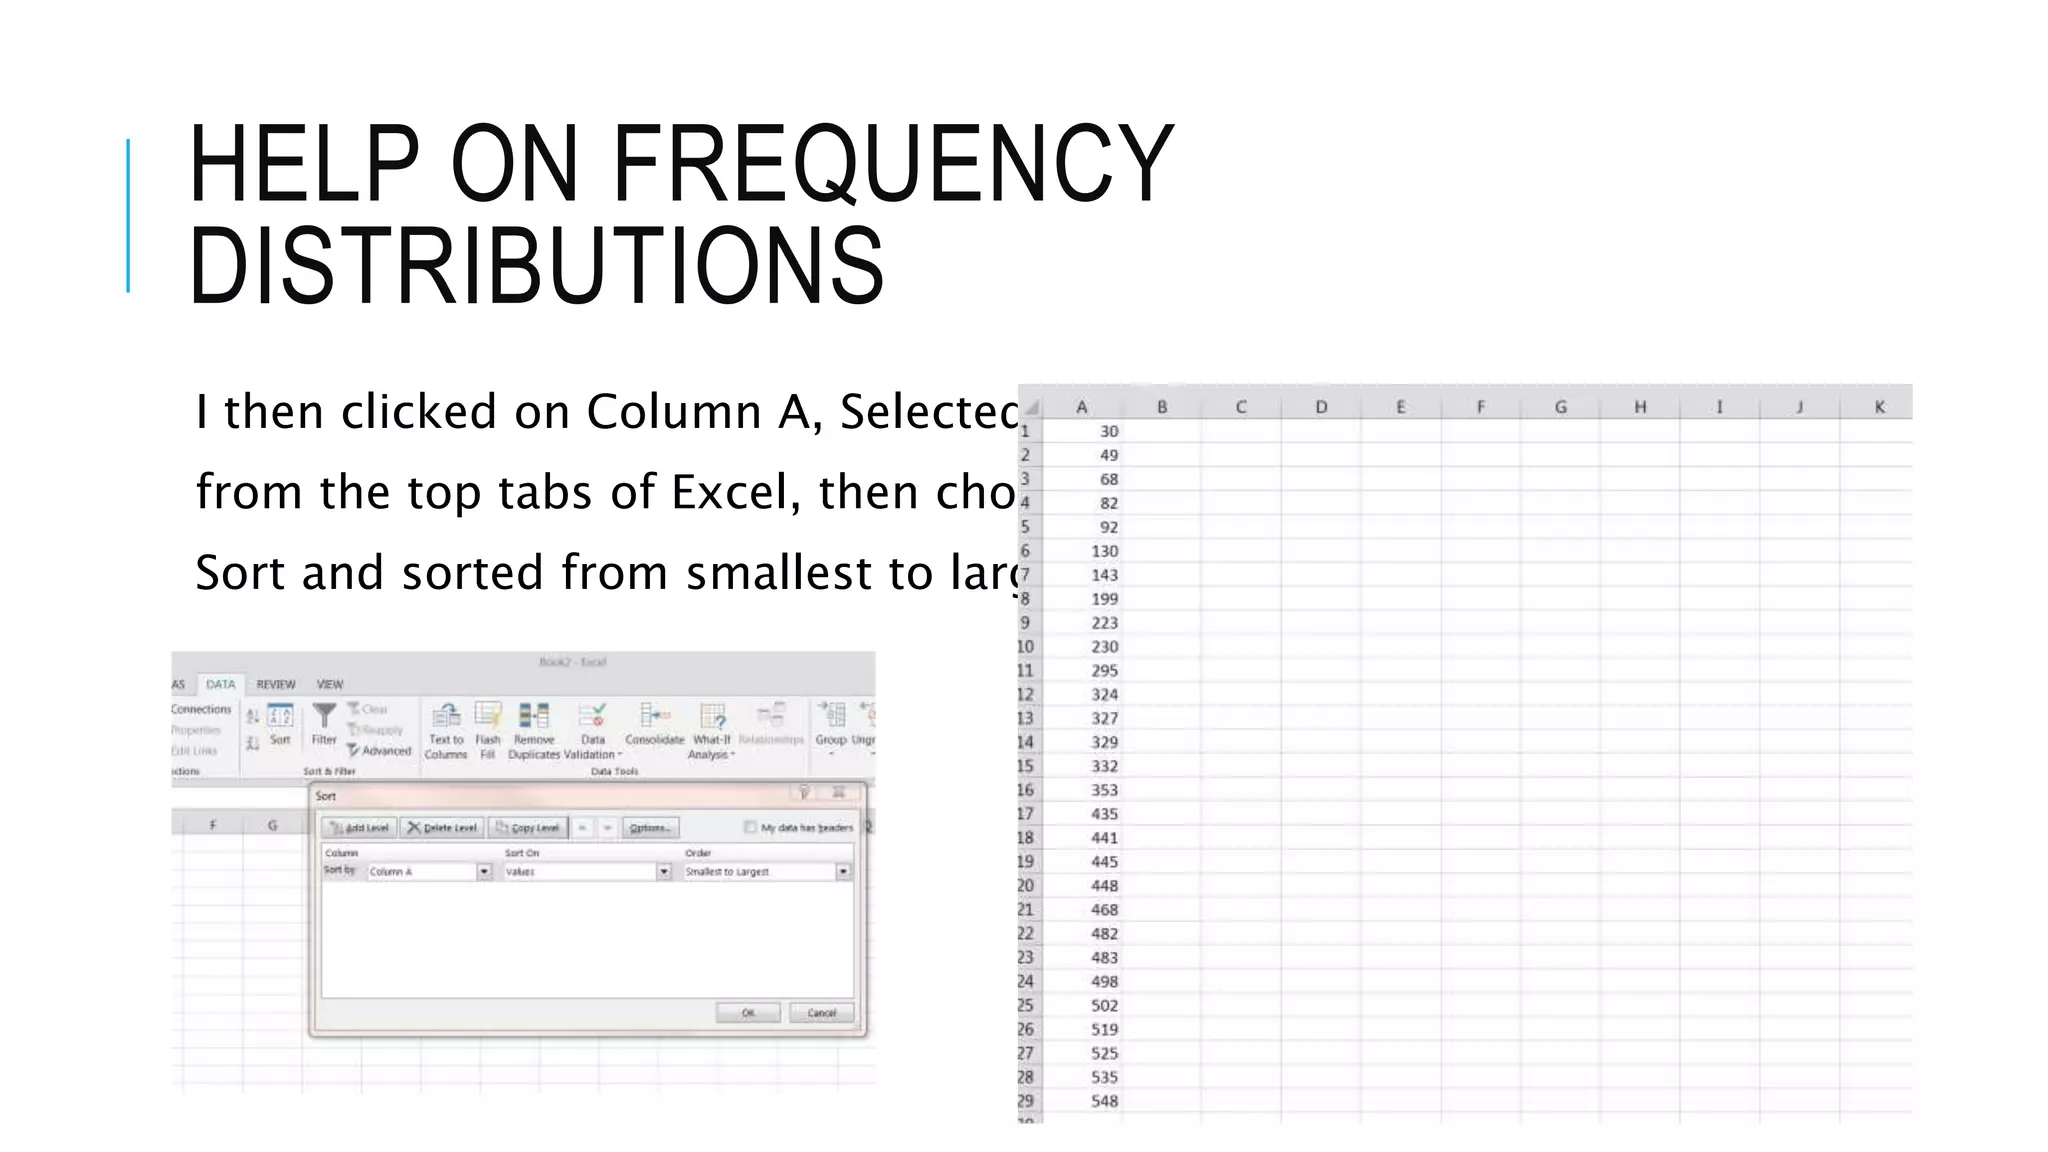
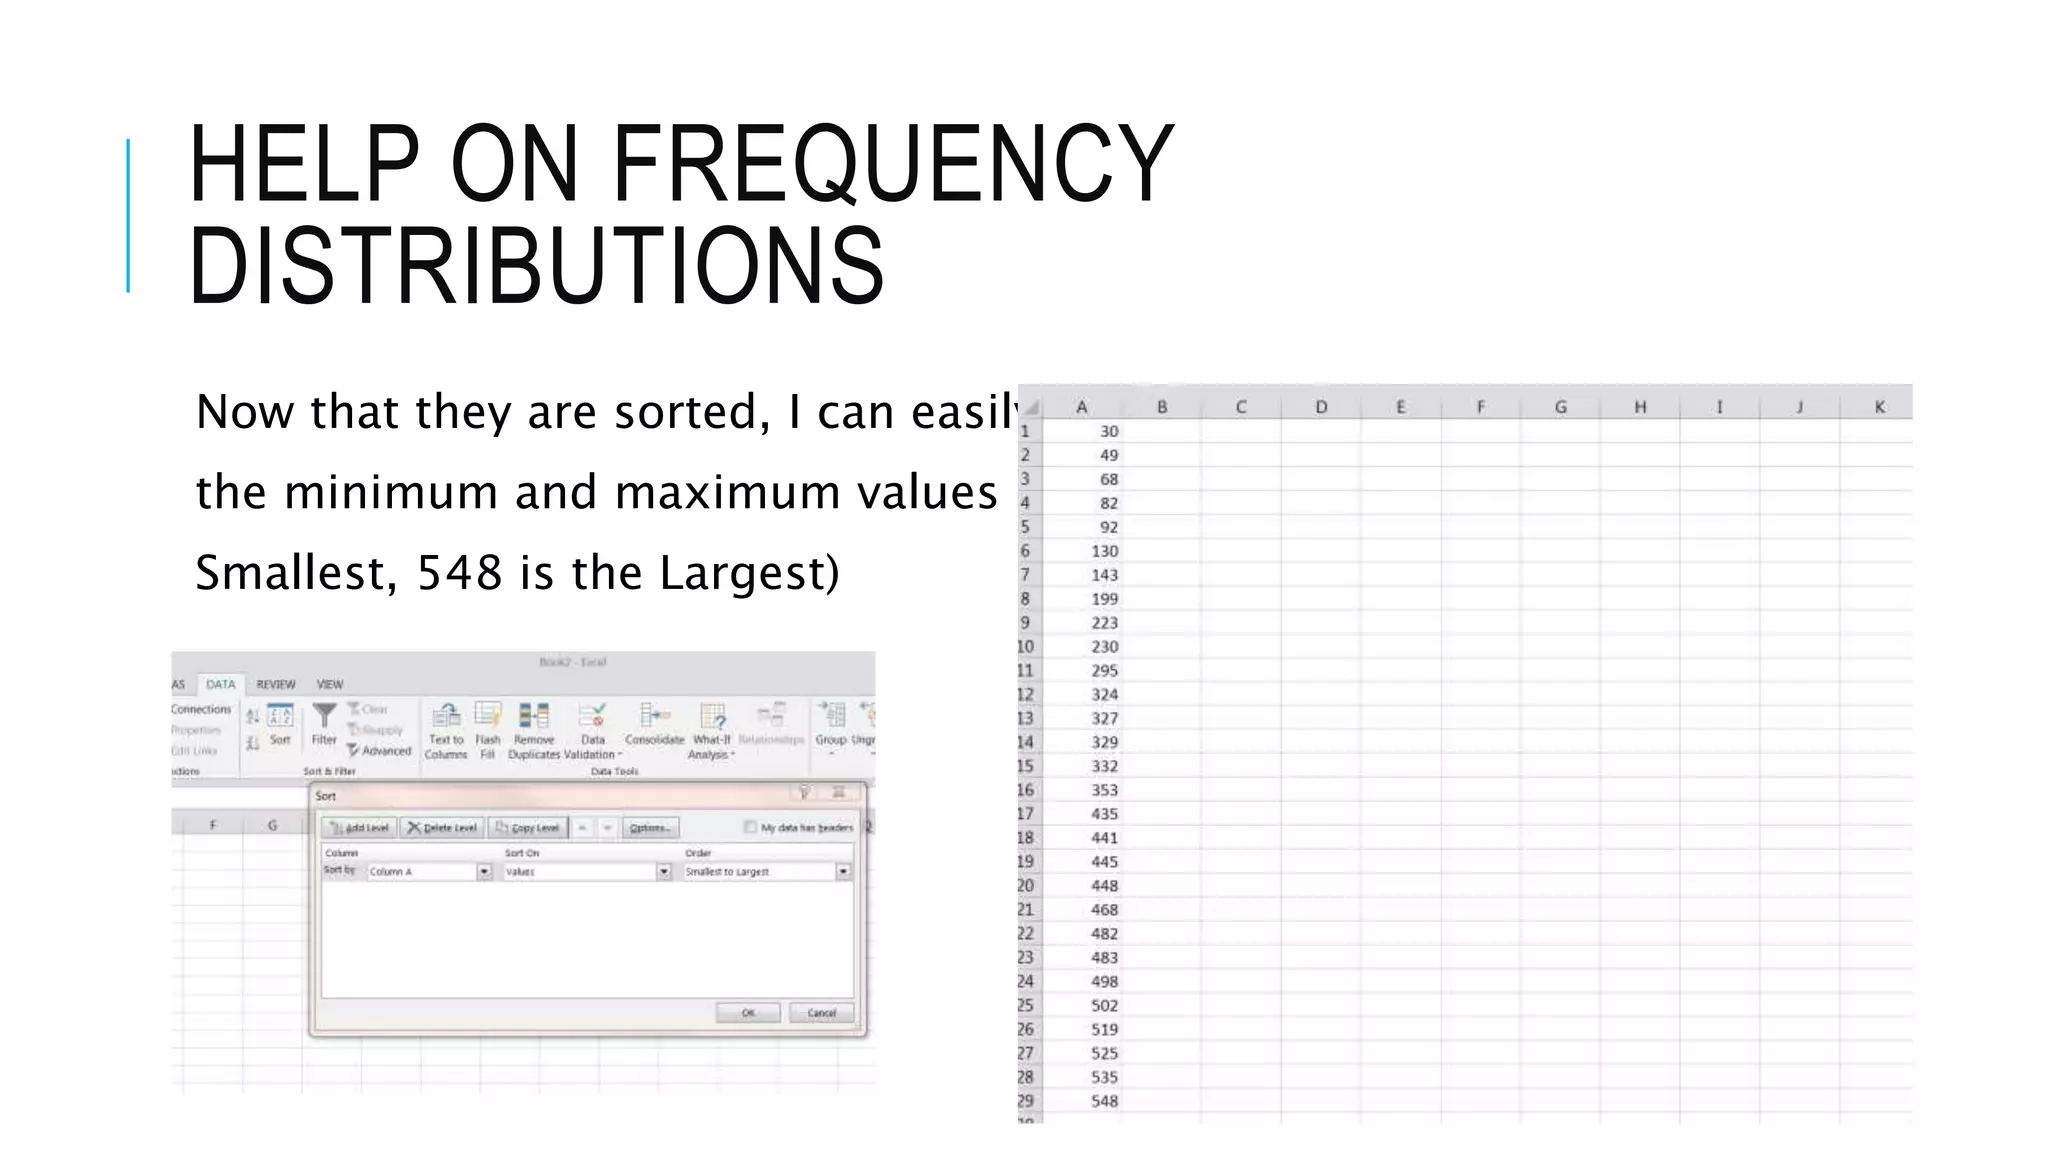
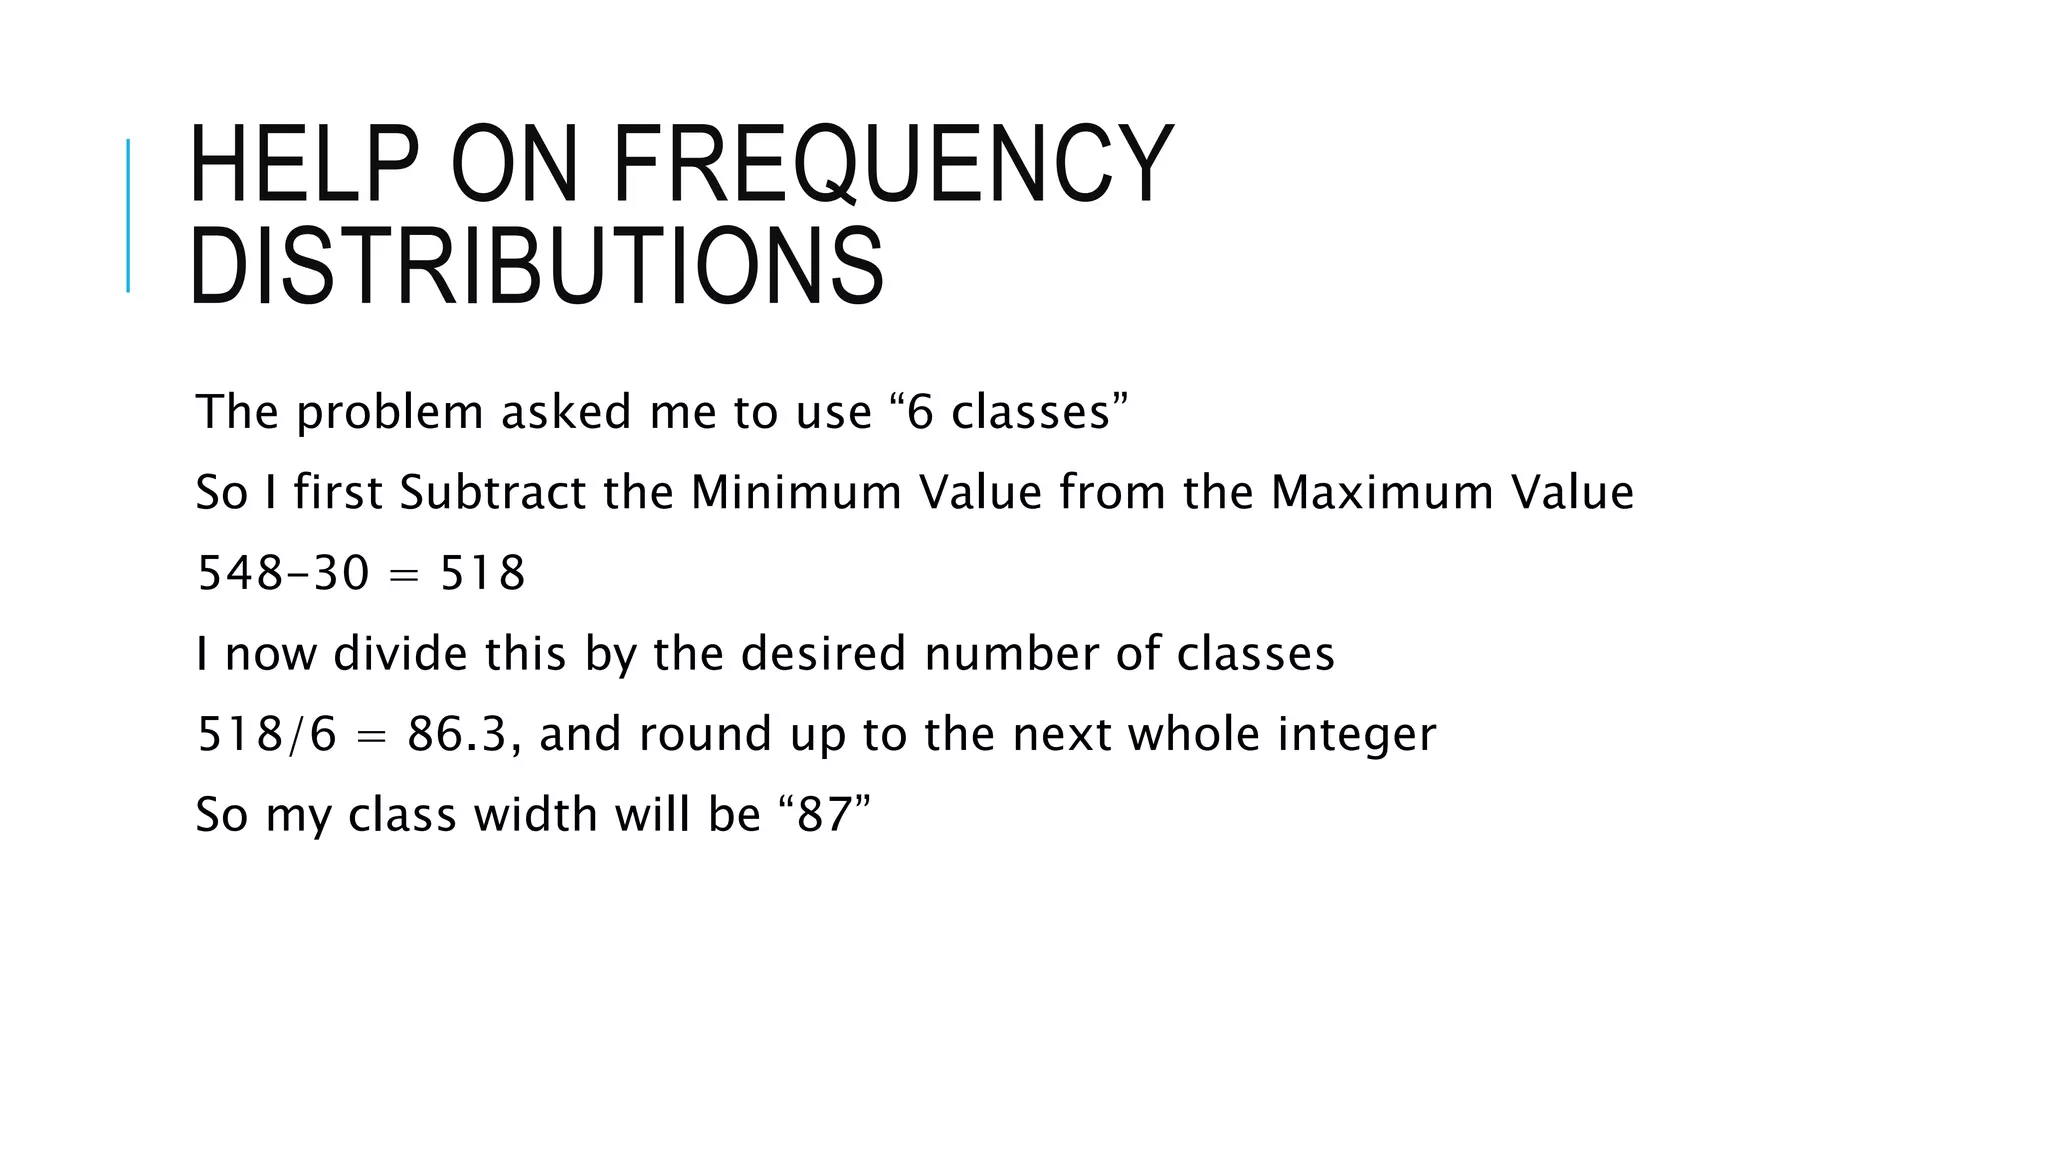
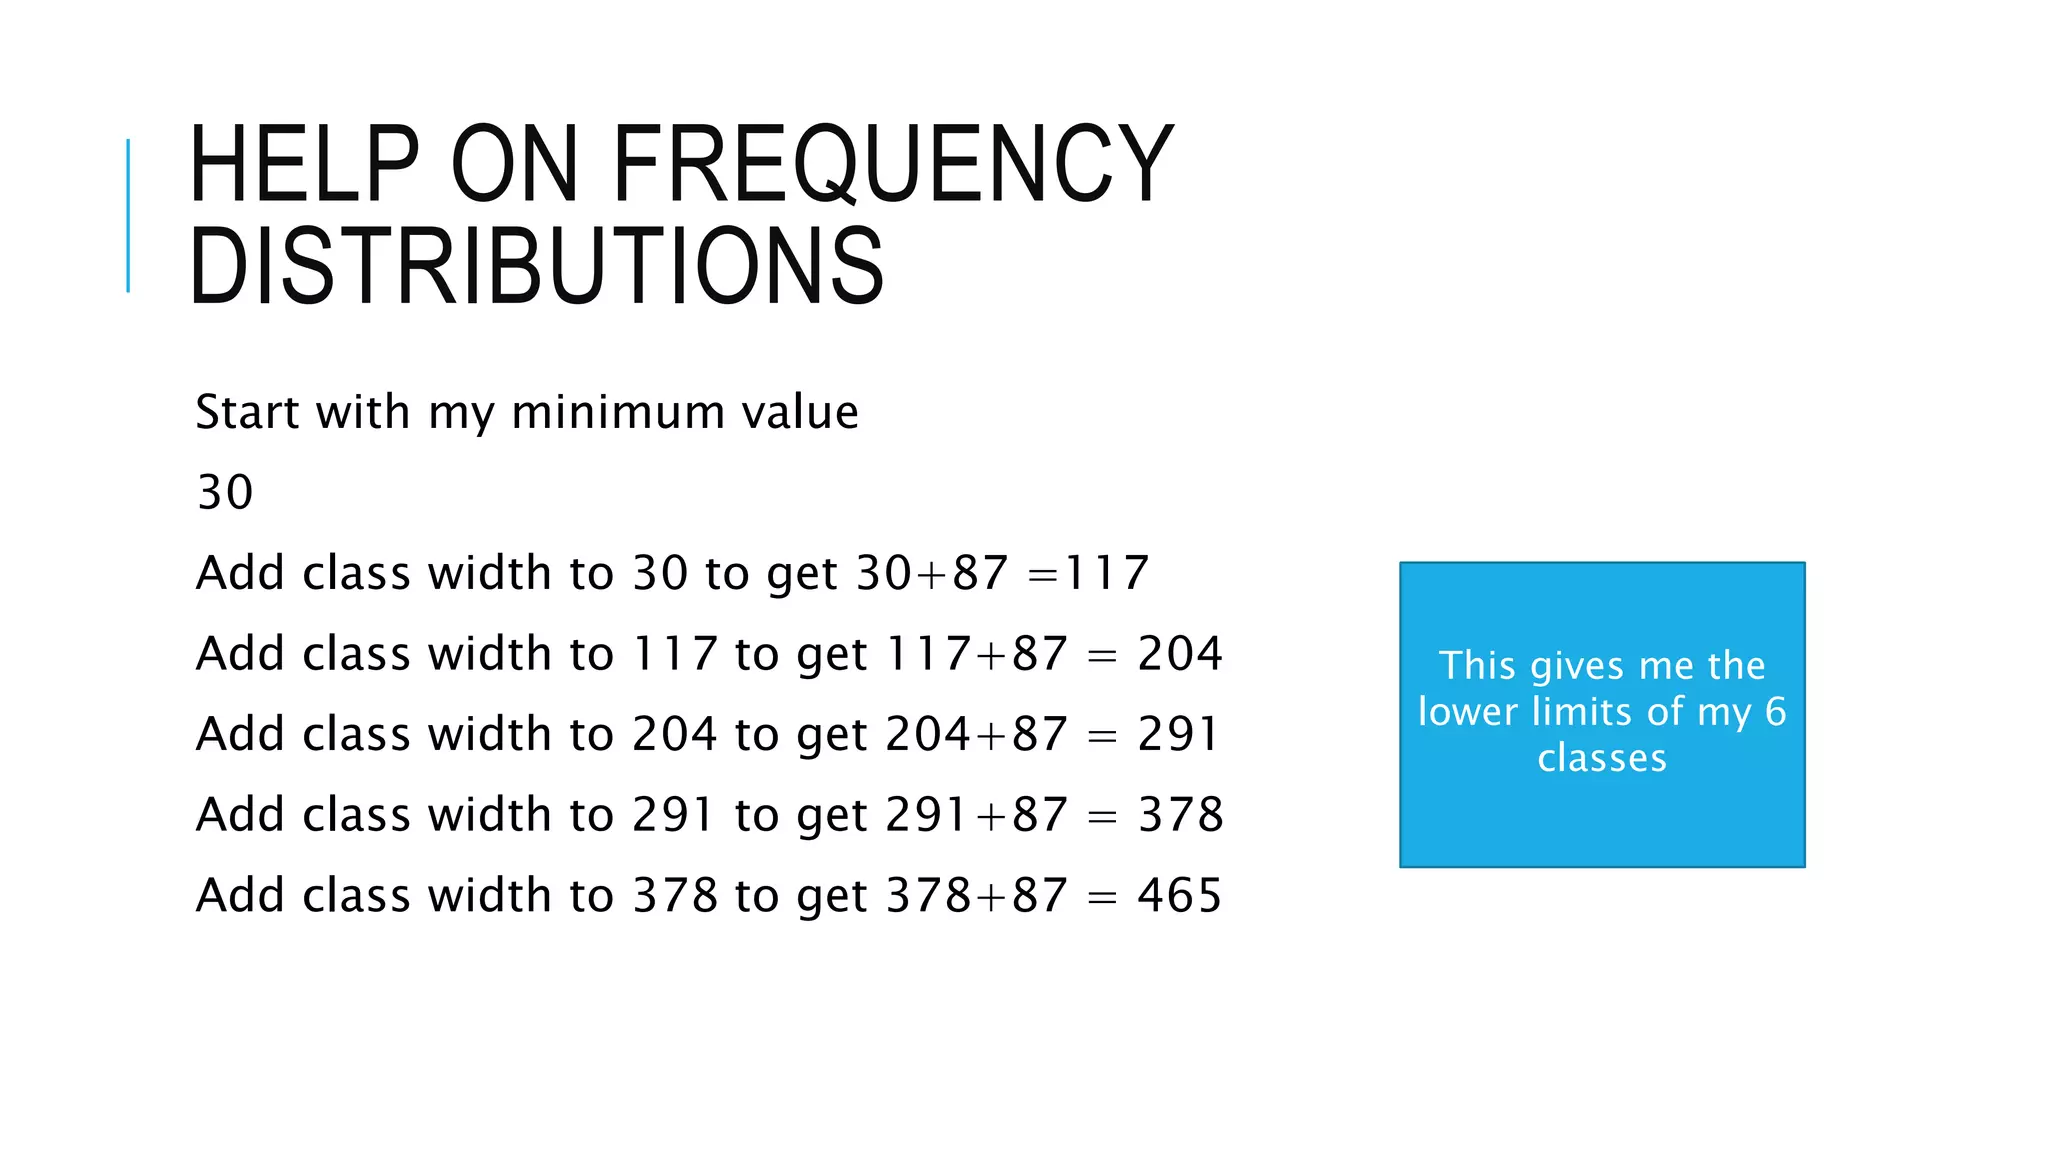
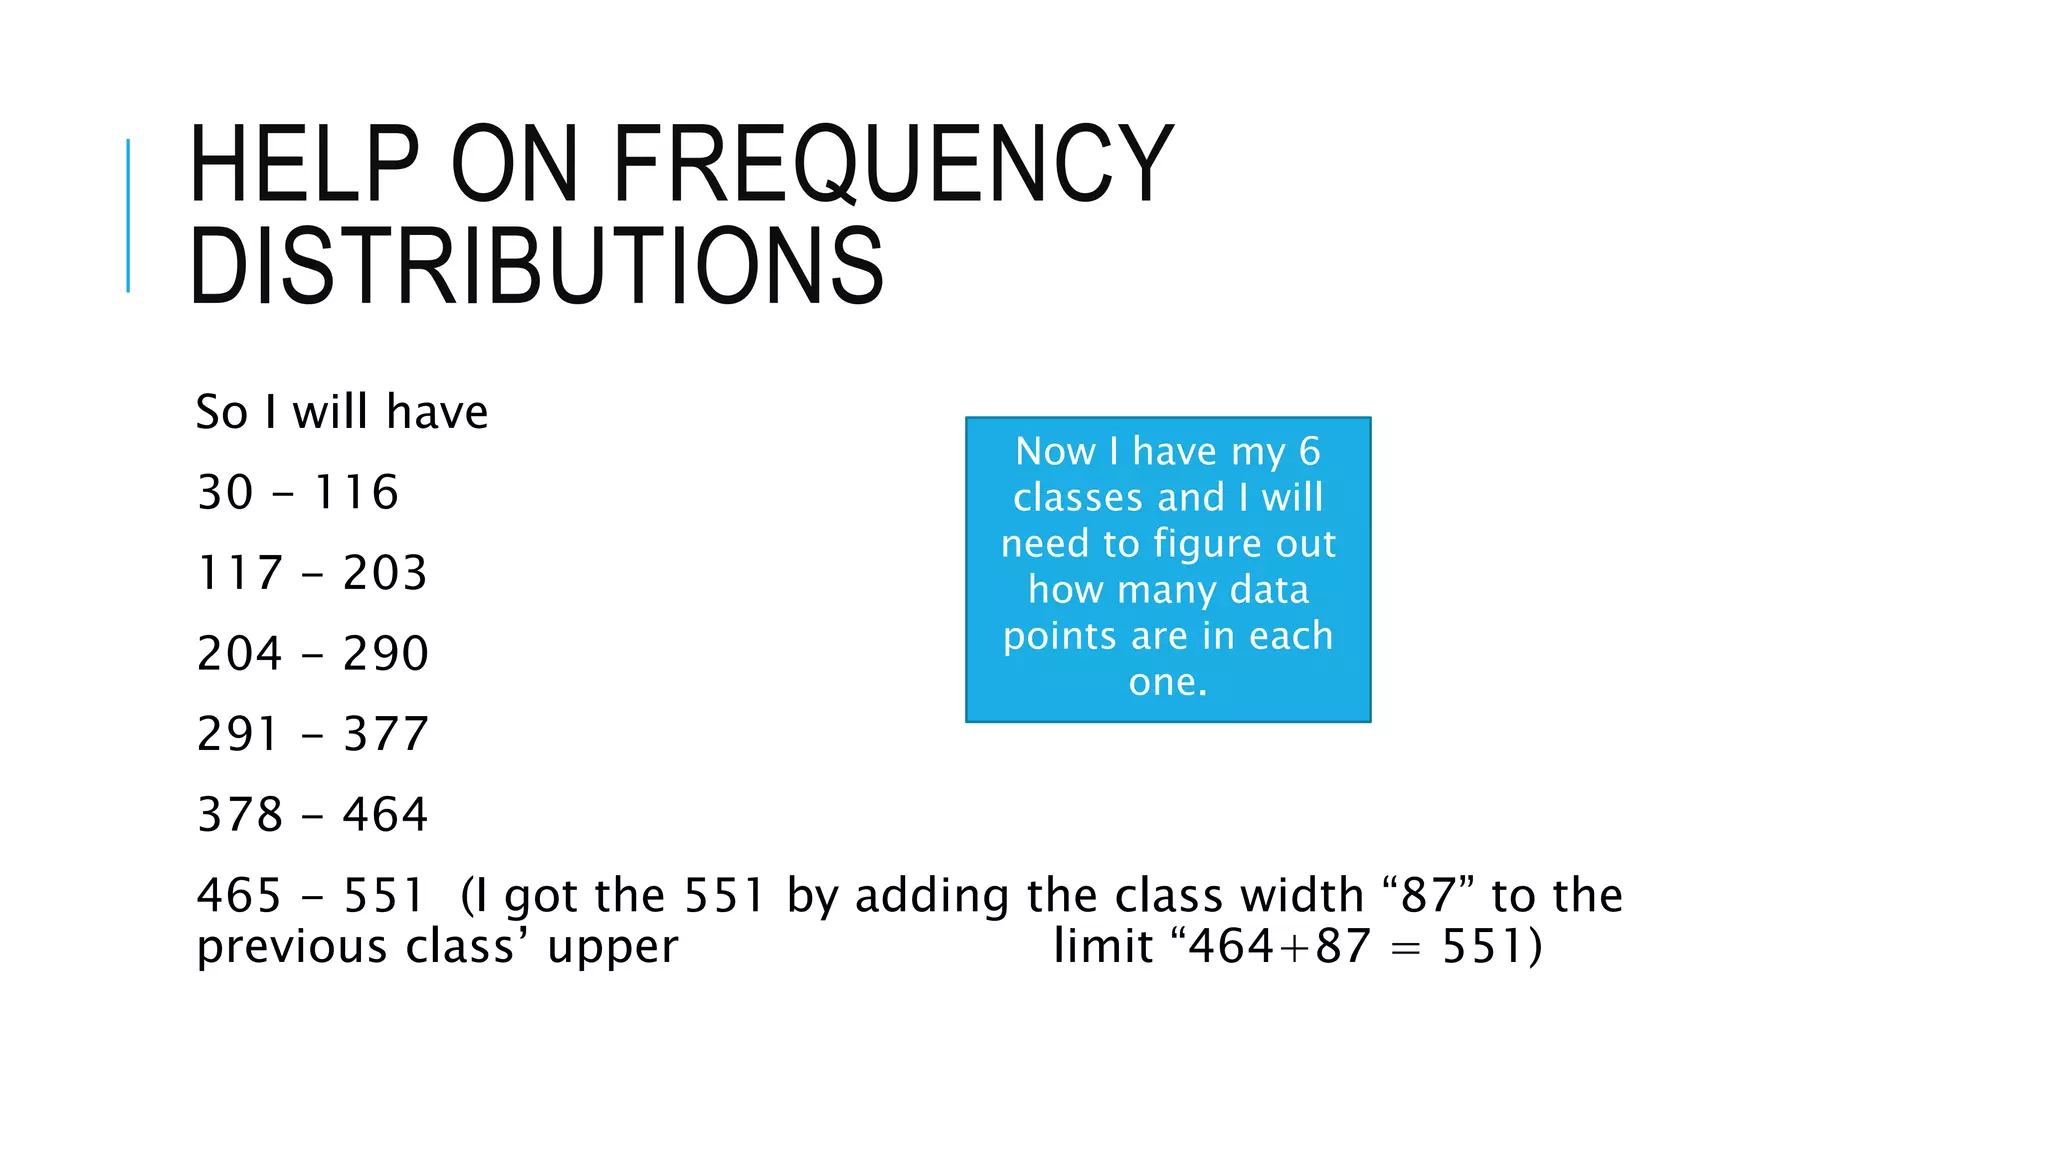
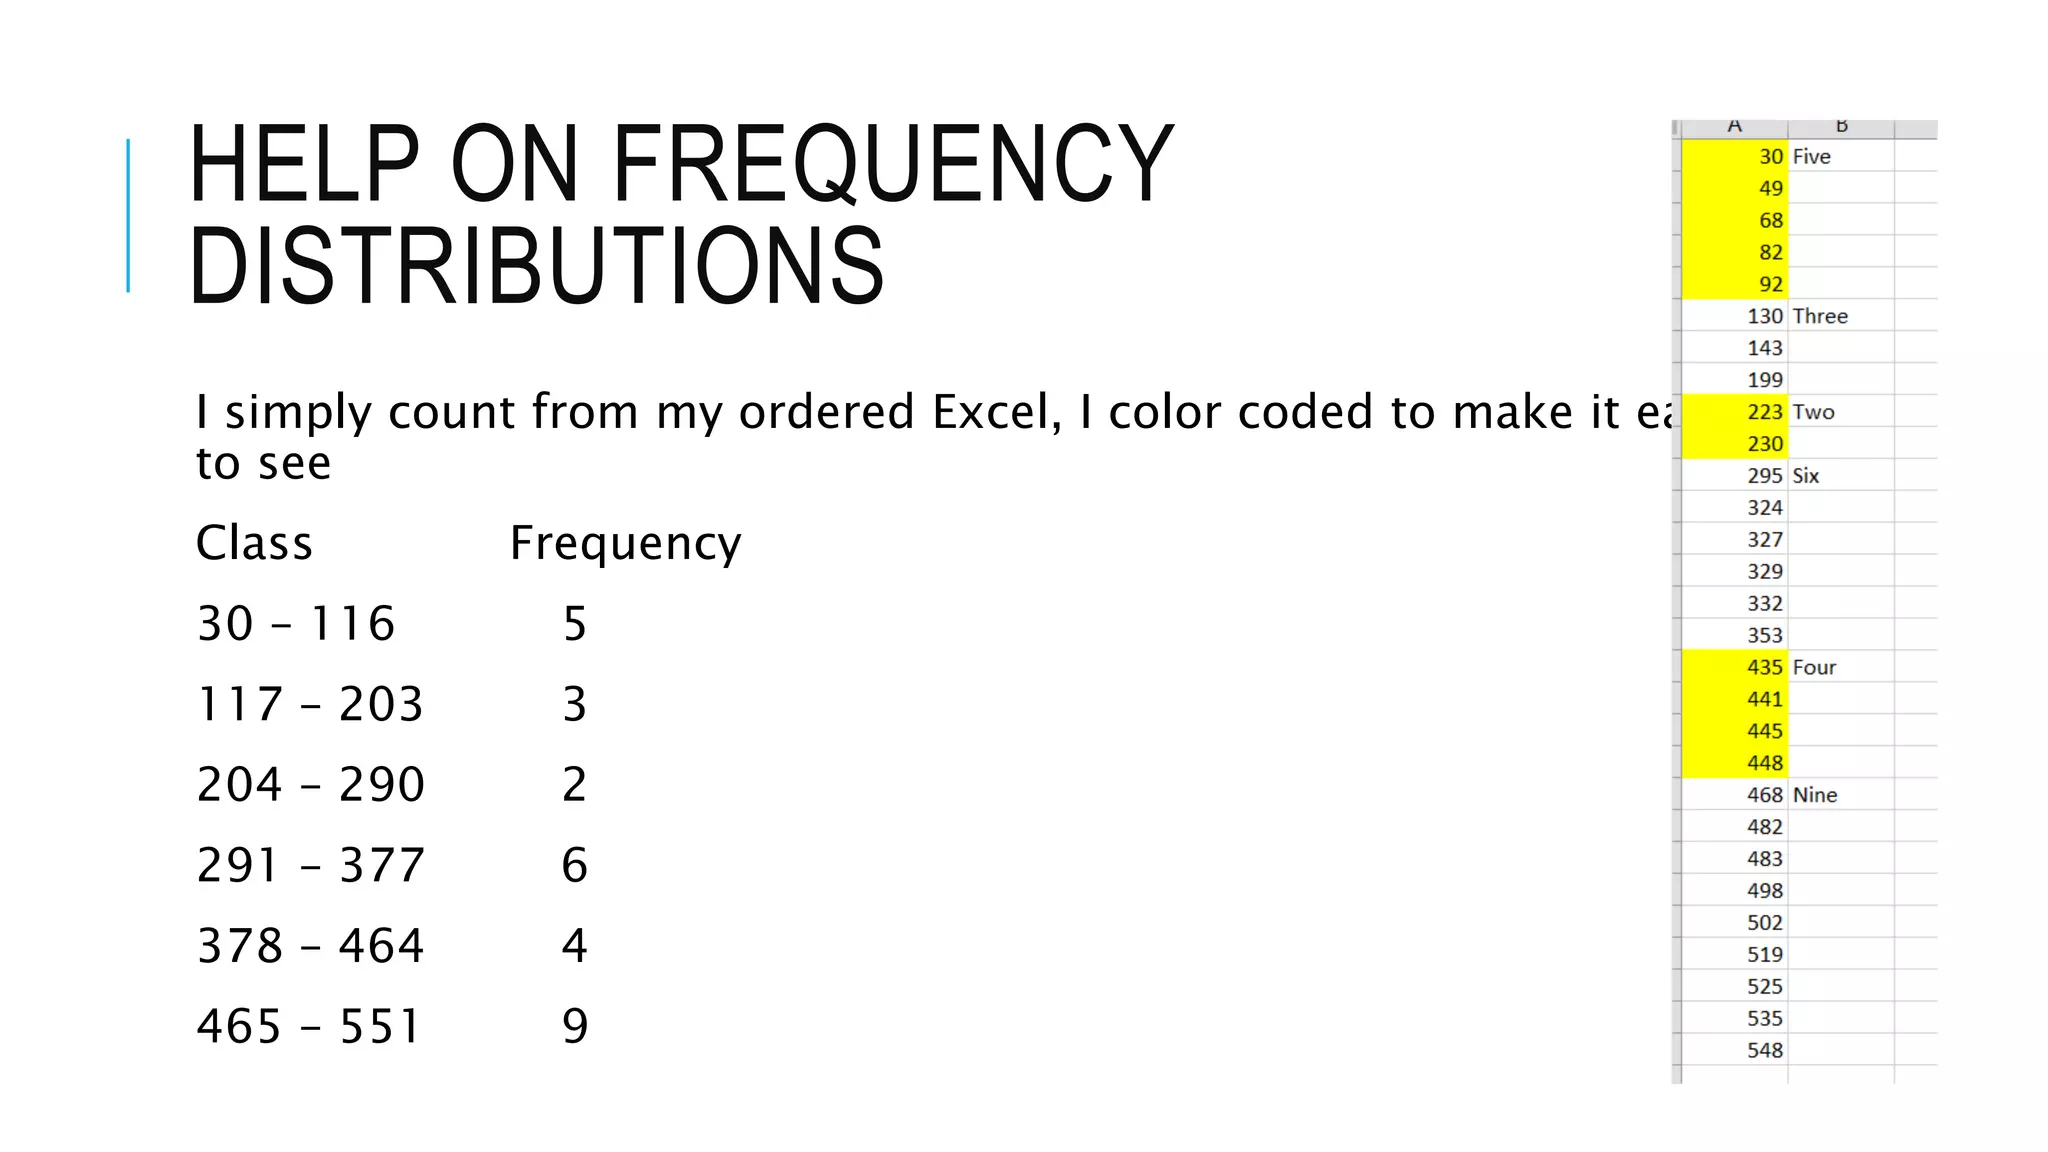

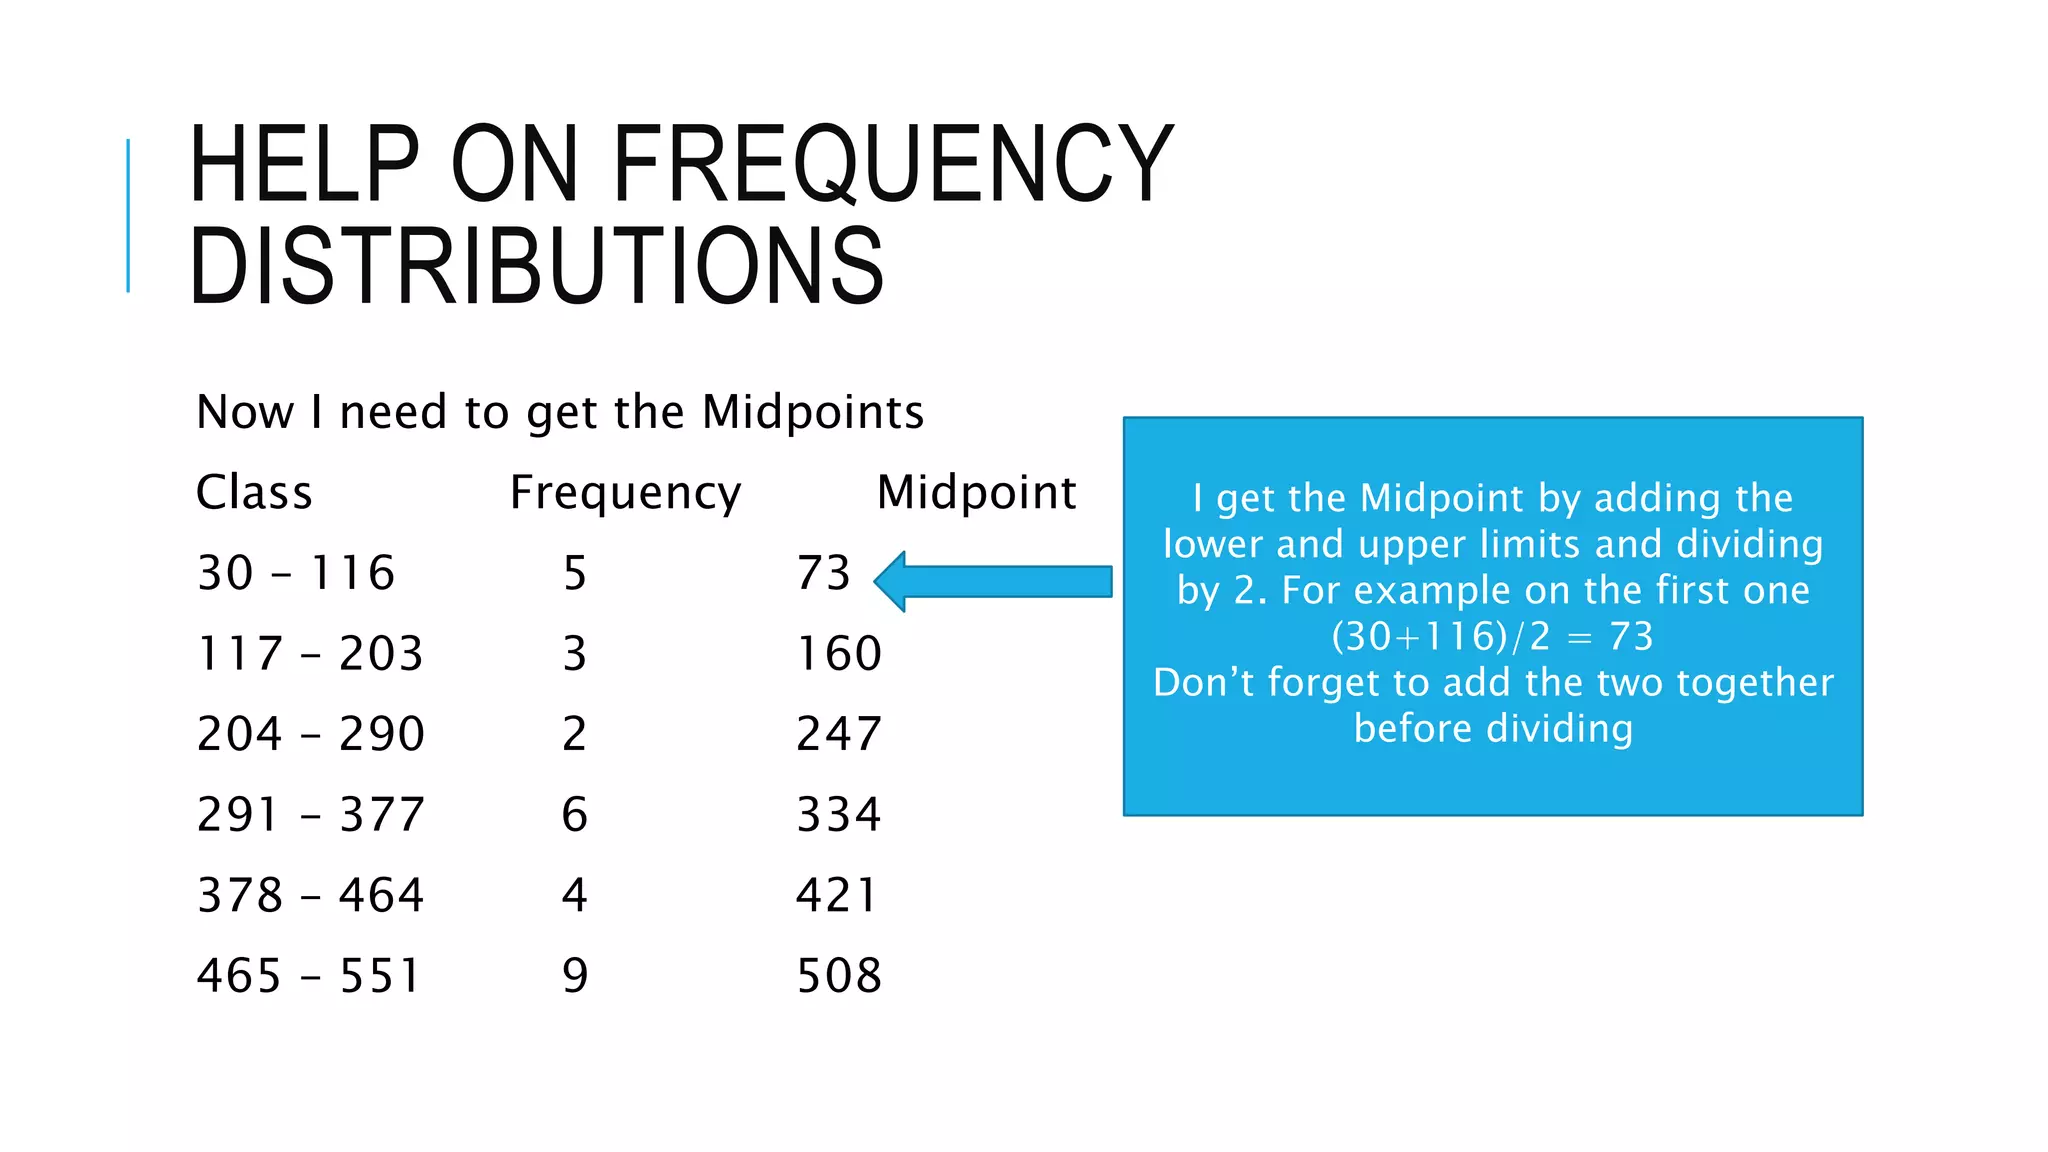
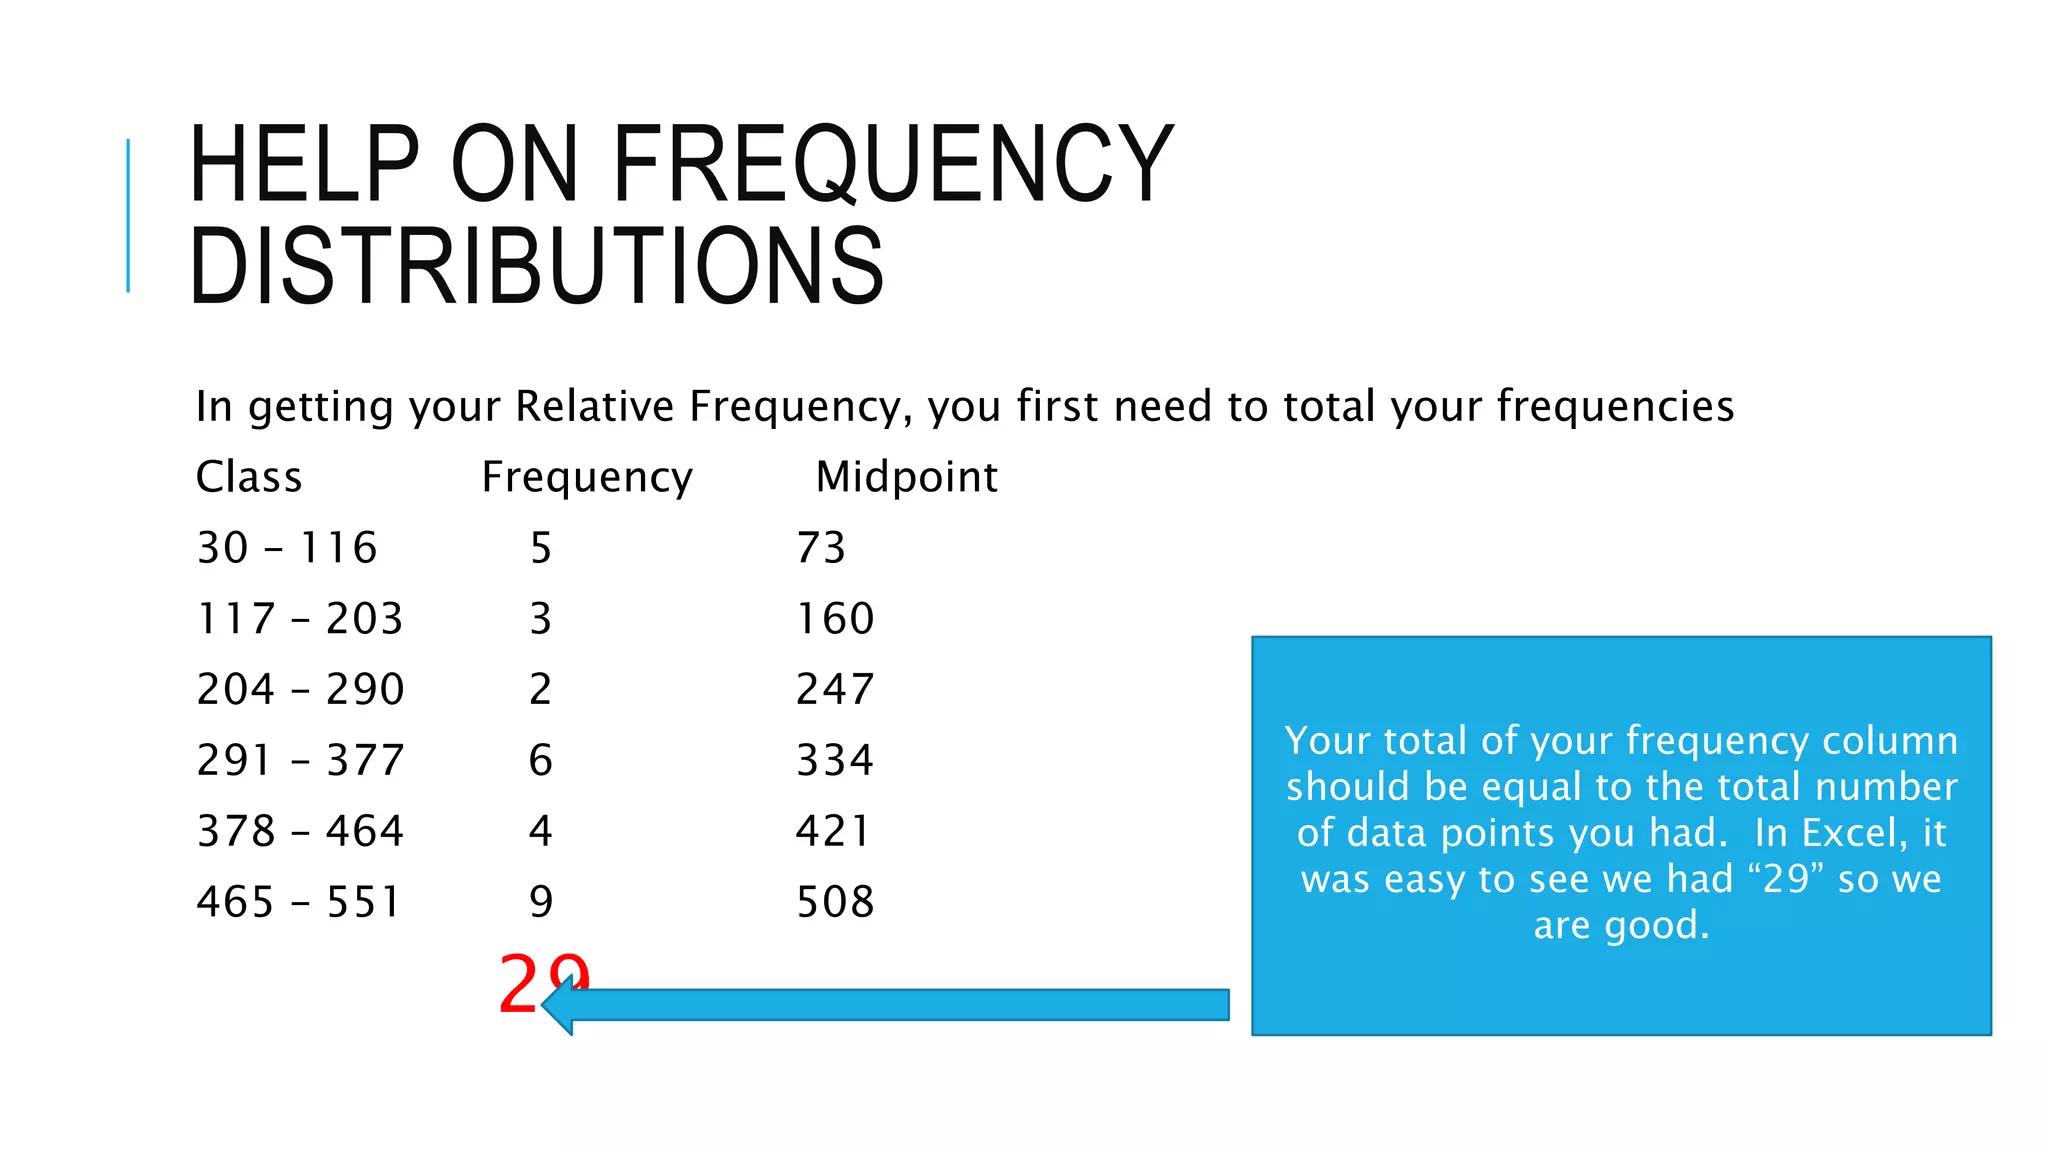
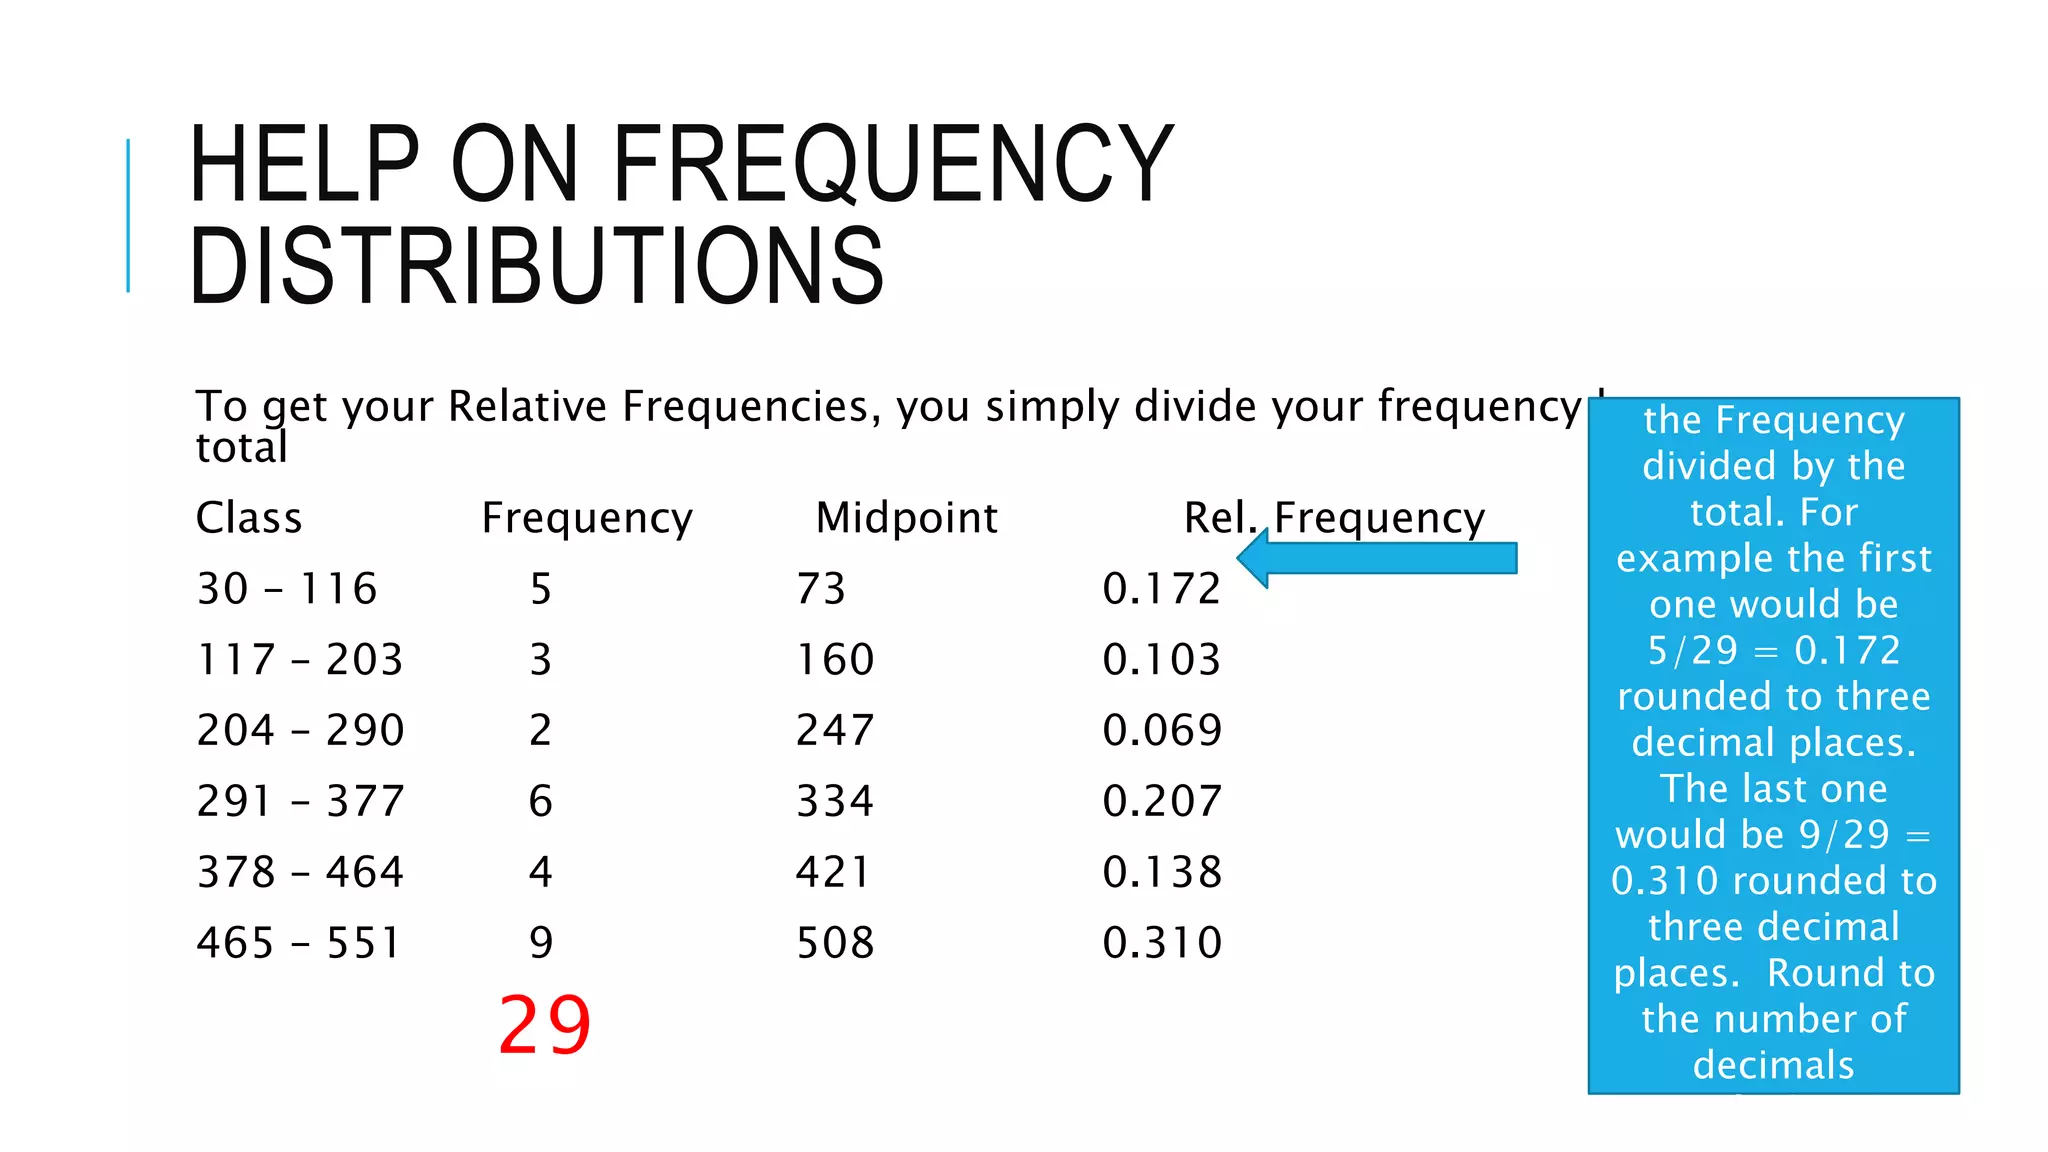
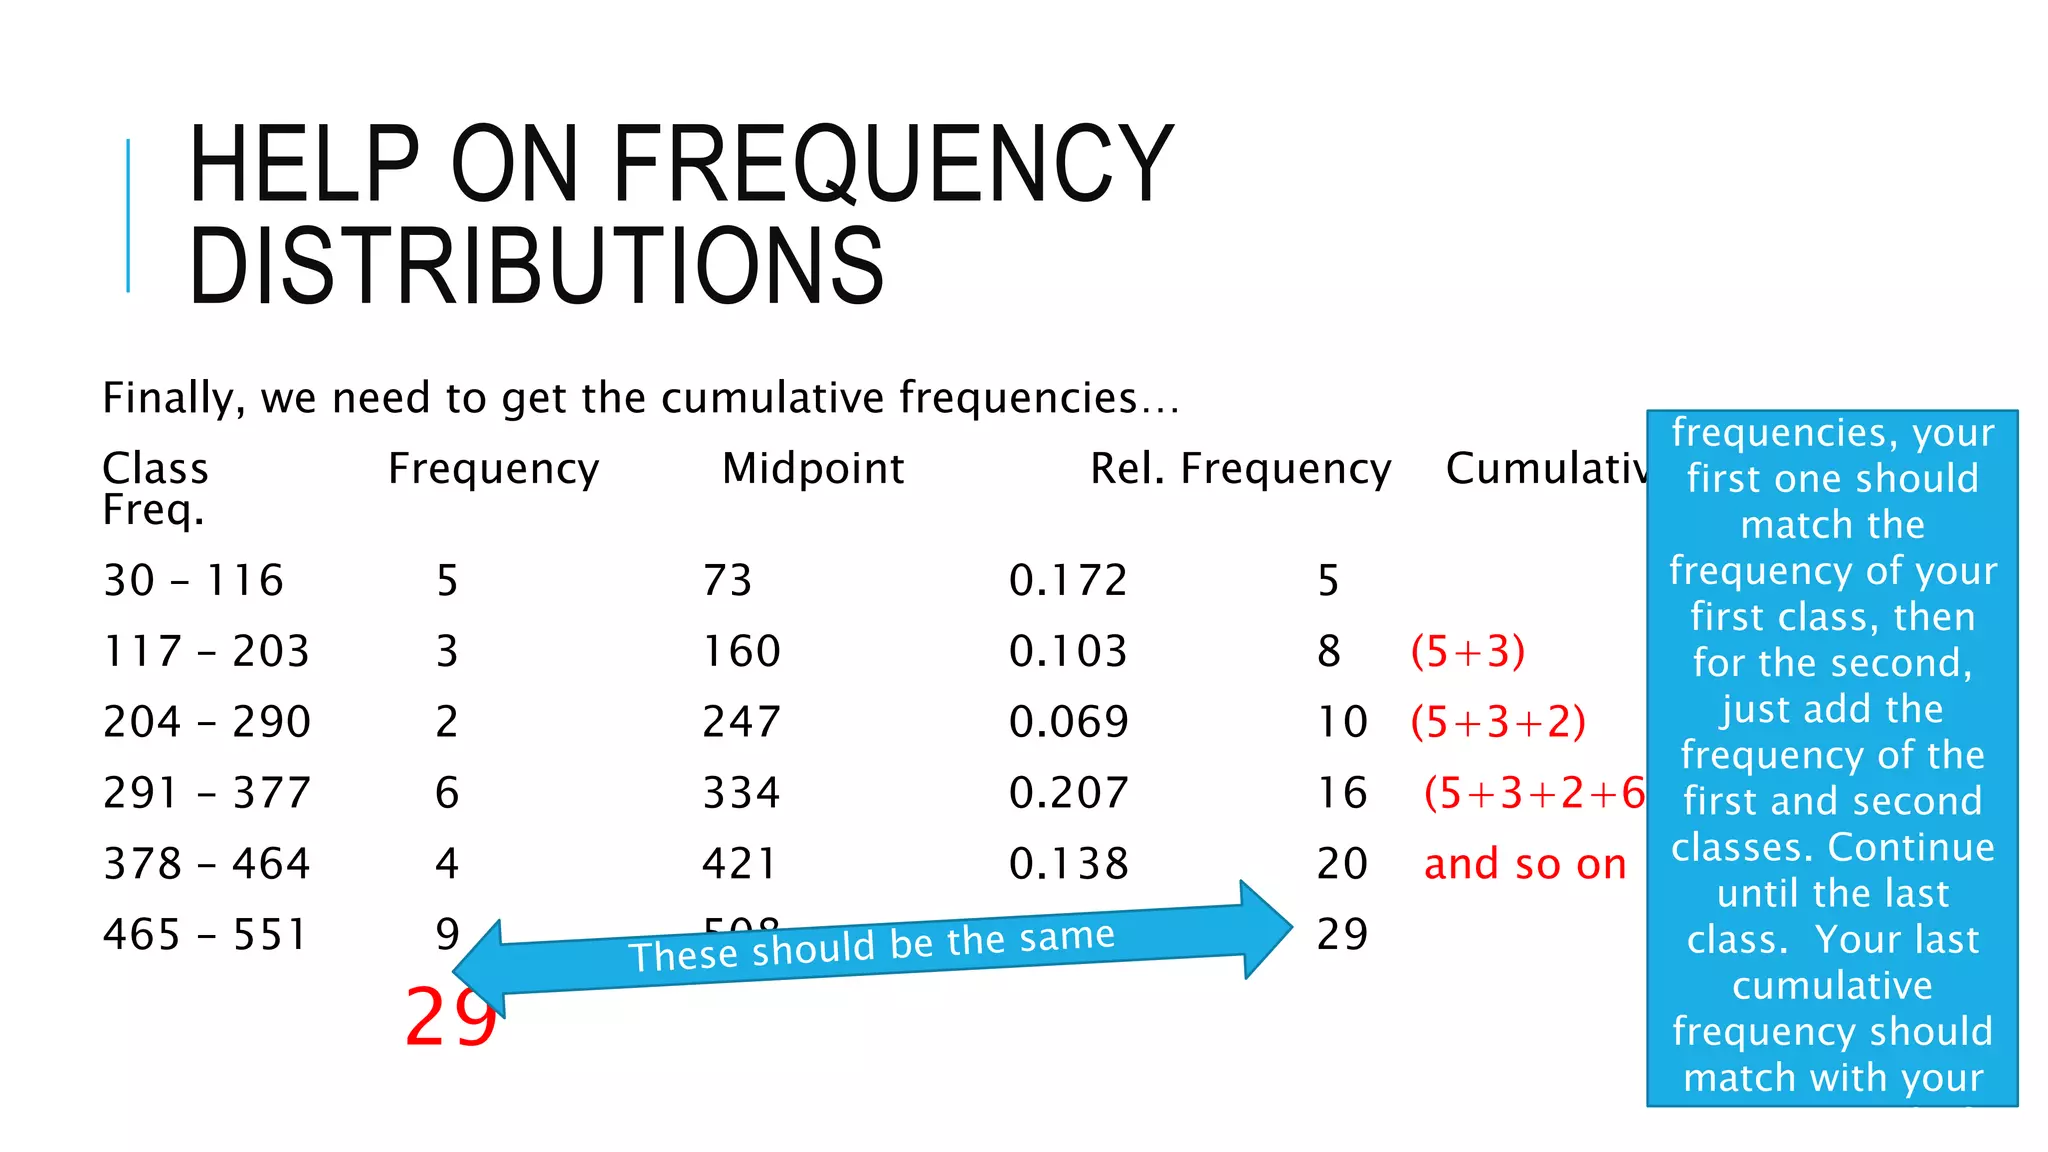
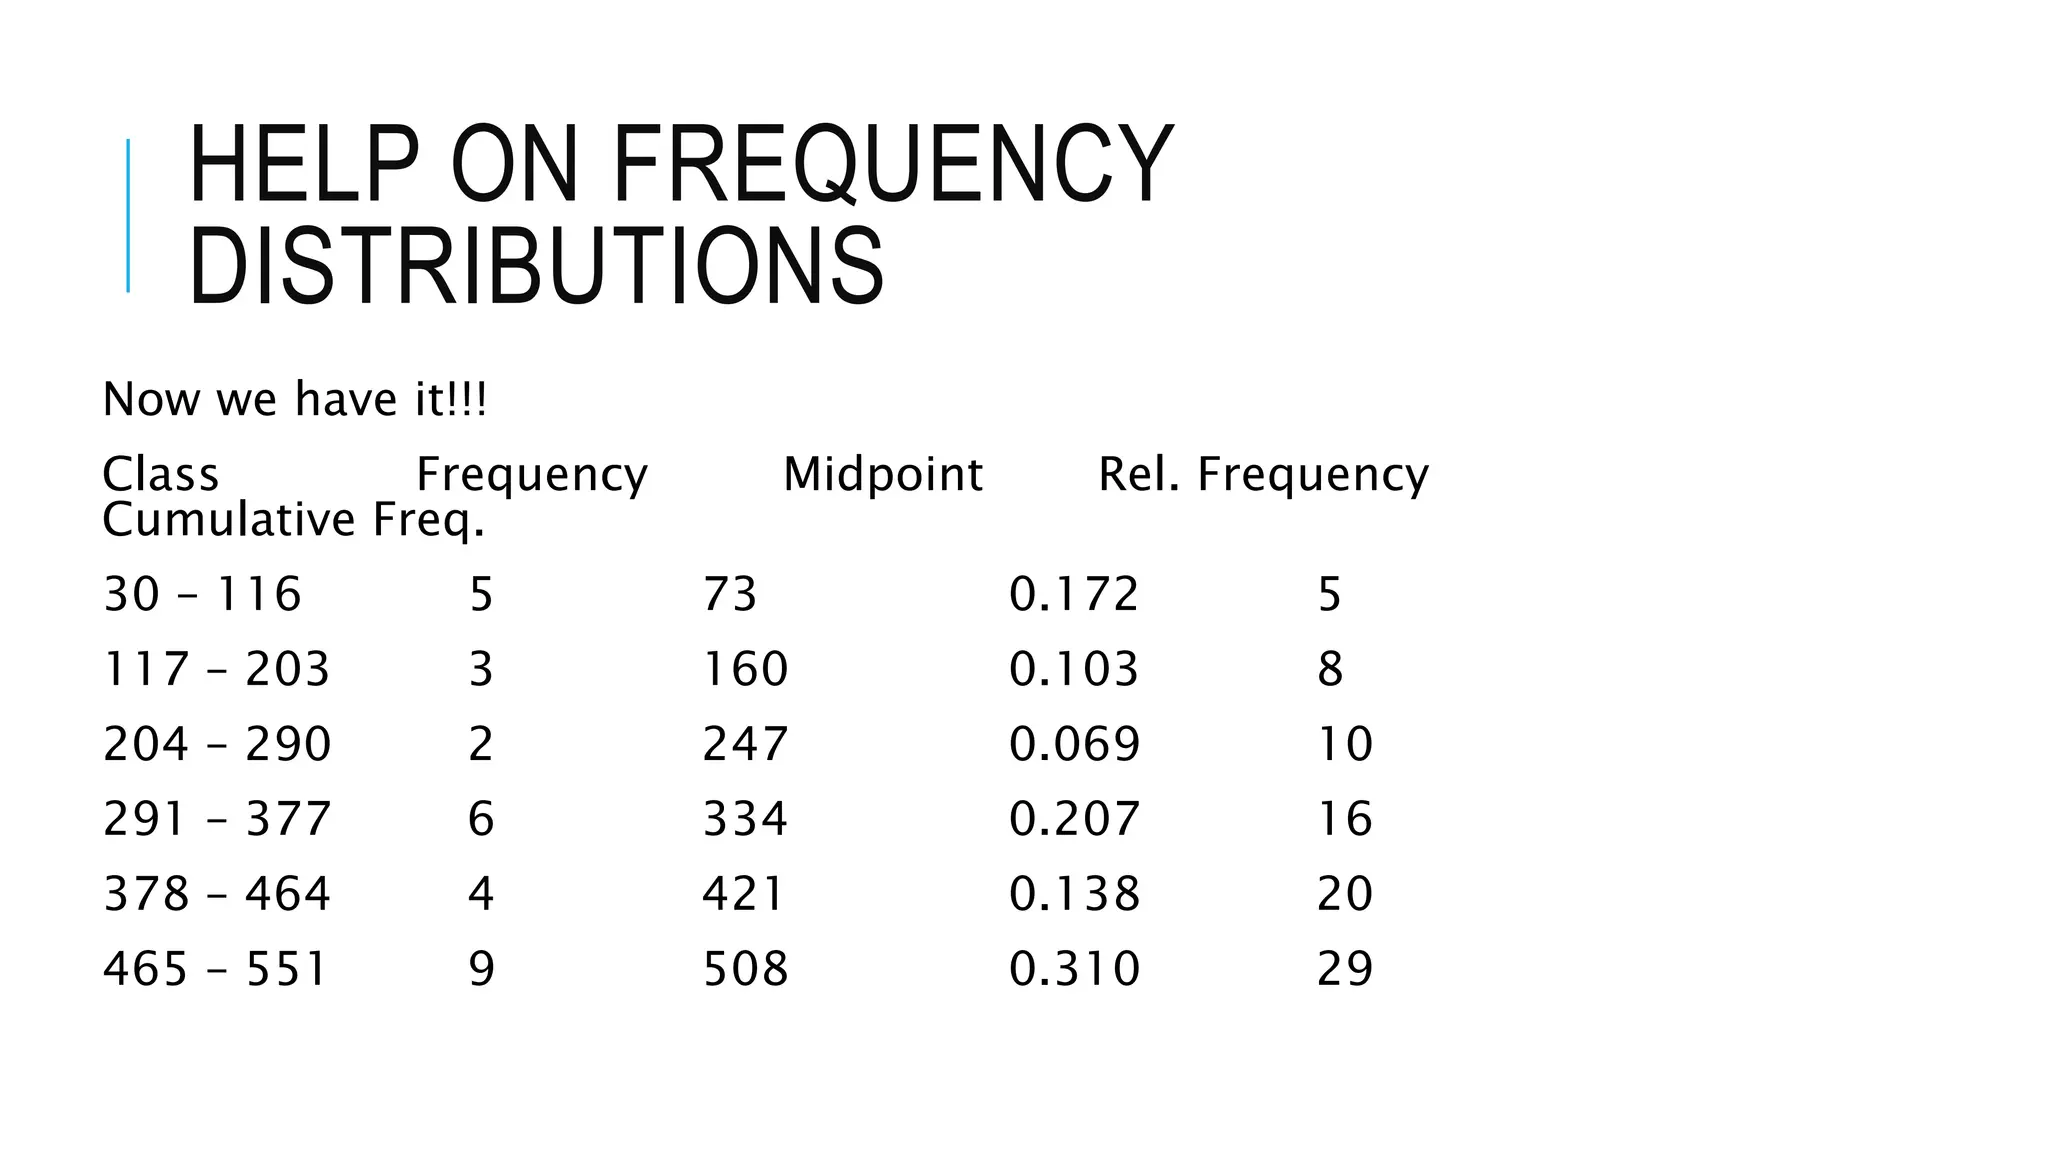
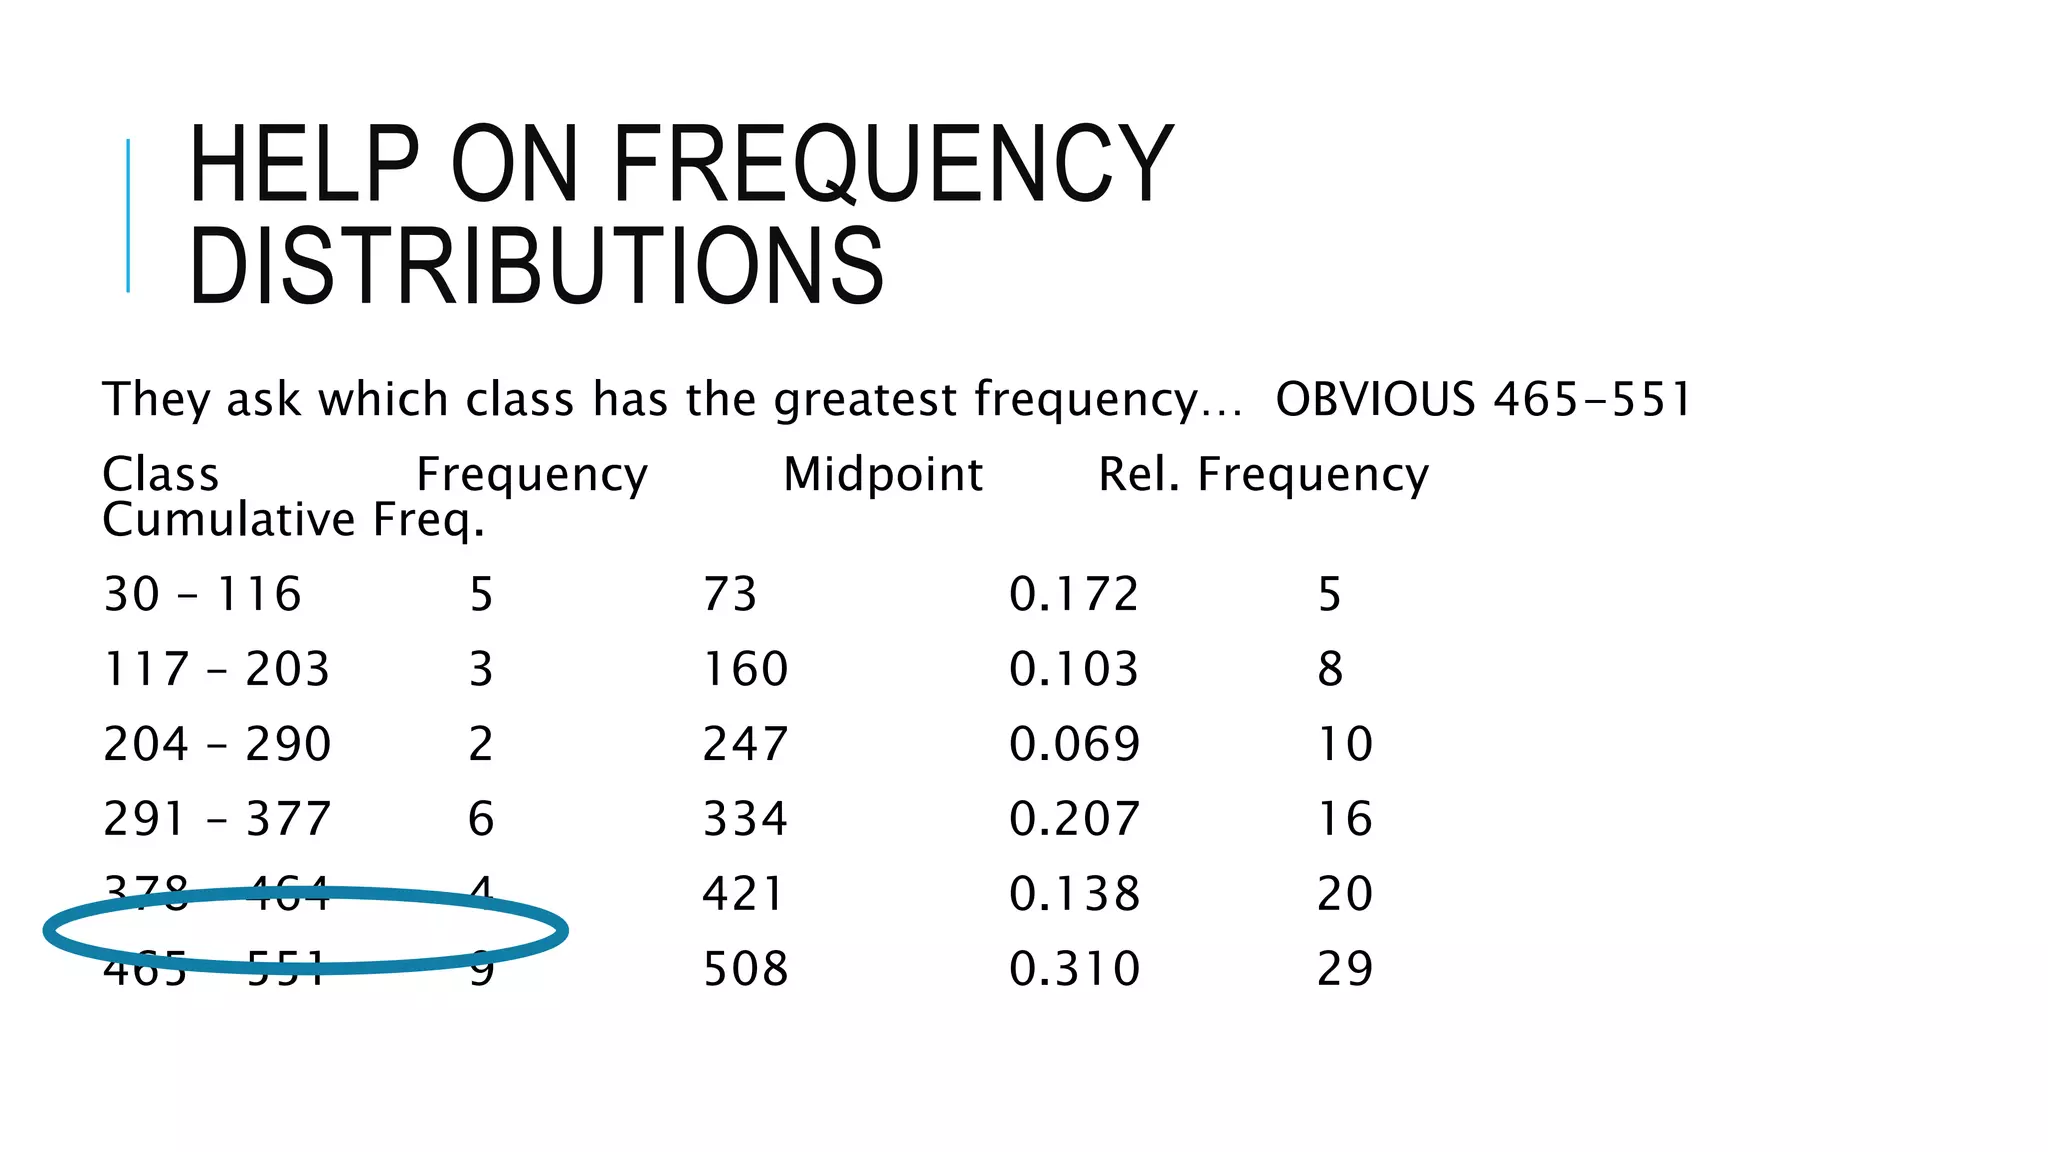
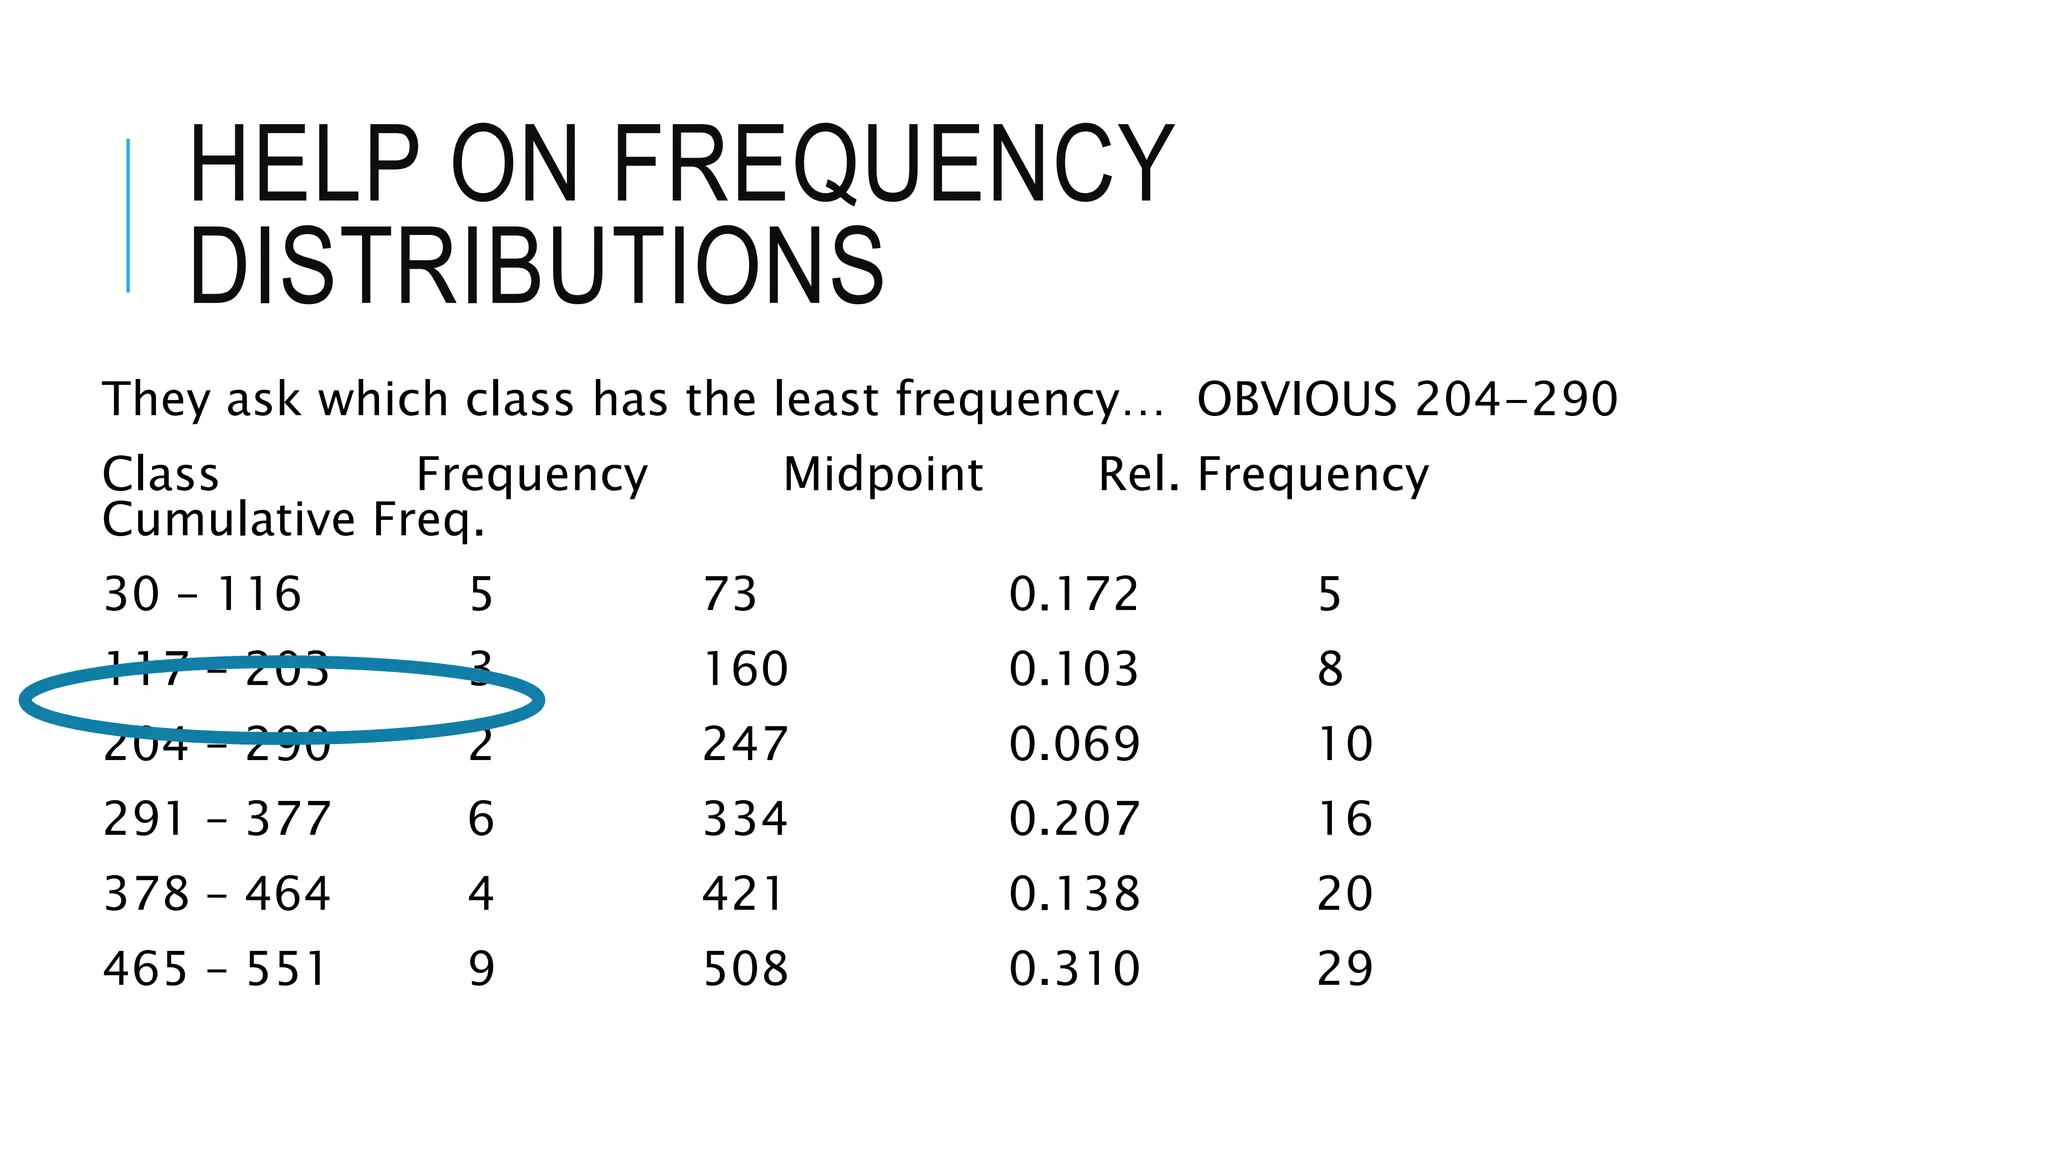

The document provides a detailed guide on creating frequency distributions using Excel, including sorting data, calculating class widths, and determining class frequencies and midpoints. It explains how to compute relative and cumulative frequencies step-by-step, ensuring that the total of frequency matches the data points. The author emphasizes the importance of accuracy and encourages helping others in learning.


![Week7 Quiz Help 2009[1]](https://cdn.slidesharecdn.com/ss_thumbnails/week7quizhelp20091-091012152329-phpapp02-thumbnail.jpg?width=640&height=640&fit=bounds)


