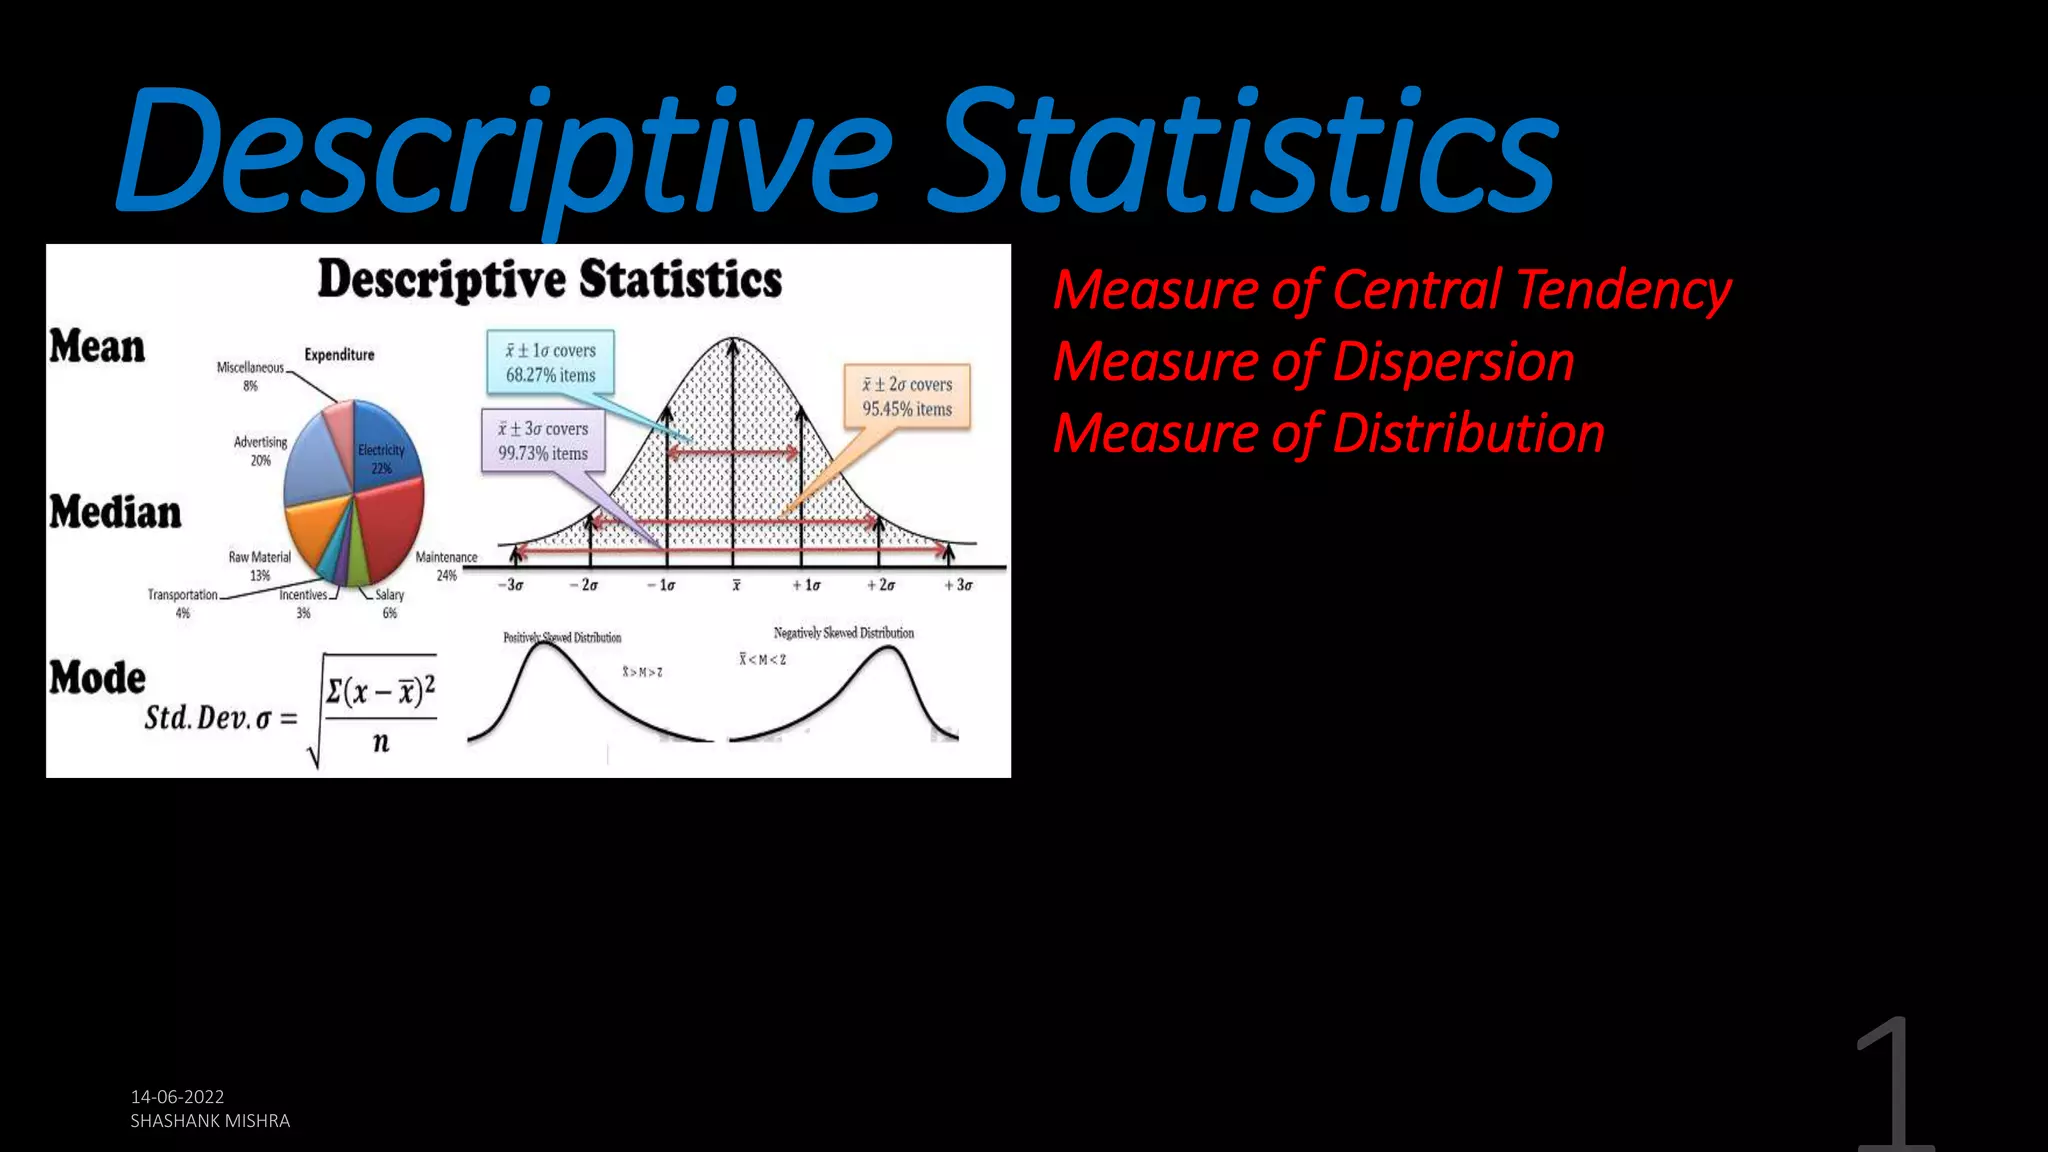
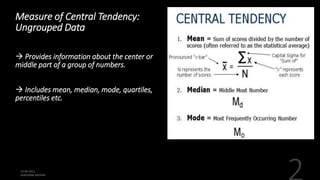
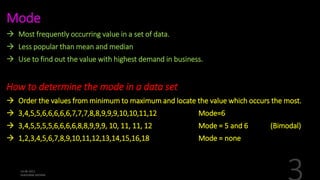
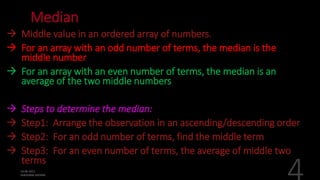
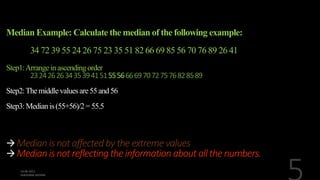
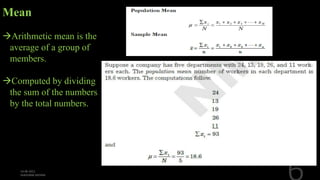
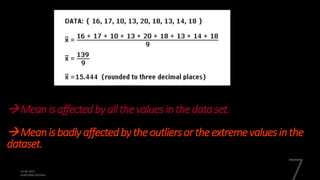
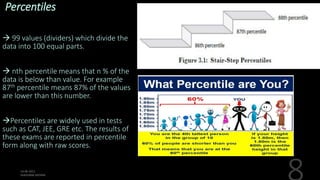
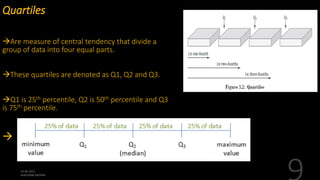
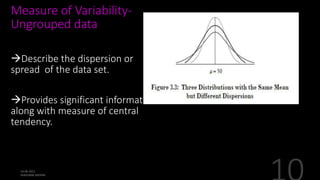
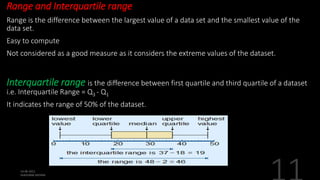
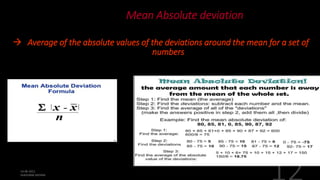
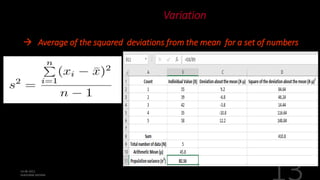
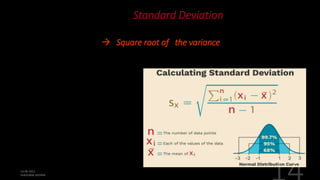
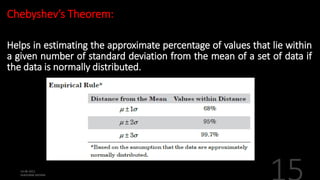
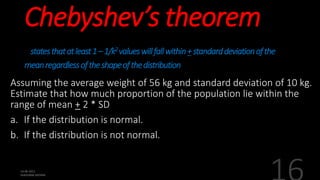
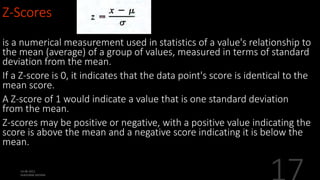
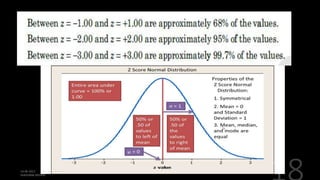
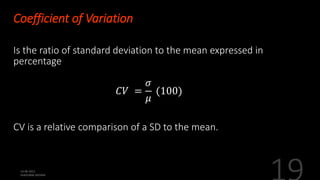
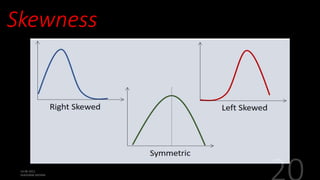
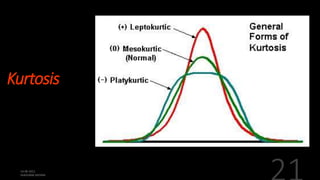
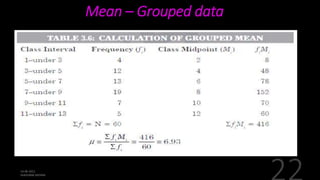
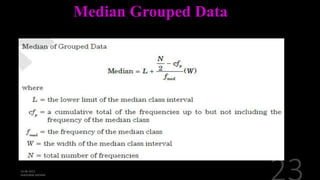
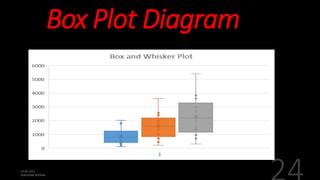
SlideShare a Scribd company logo
Descriptive Statistics
Measure of Central Tendency
Measure of Dispersion
Measure of Distribution
Measure of Central Tendency:
Ungrouped Data
 Provides information about the center or
middle part of a group of numbers.
 Includes mean, median, mode, quartiles,
percentiles etc.
Mode
 Most frequently occurring value in a set of data.
 Less popular than mean and median
 Use to find out the value with highest demand in business.
How to determine the mode in a data set
 Order the values from minimum to maximum and locate the value which occurs the most.
 3,4,5,5,6,6,6,6,6,7,7,7,8,8,9,9,9,10,10,11,12 Mode=6
 3,4,5,5,5,5,6,6,6,6,8,8,9,9,9, 10, 11, 11, 12 Mode = 5 and 6 (Bimodal)
 1,2,3,4,5,6,7,8,9,10,11,12,13,14,15,16,18 Mode = none
Median
 Middle value in an ordered array of numbers.
 For an array with an odd number of terms, the median is the
middle number
 For an array with an even number of terms, the median is an
average of the two middle numbers
 Steps to determine the median:
 Step1: Arrange the observation in an ascending/descending order
 Step2: For an odd number of terms, find the middle term
 Step3: For an even number of terms, the average of middle two
terms
Median Example: Calculate the median of the following example:
34 72 39 55 24 26 75 23 35 51 82 66 69 85 56 70 76 89 26 41
Step1:Arrange inascendingorder
2324262634353941515556666970727576828589
Step2:Themiddlevaluesare55and56
Step3:Medianis(55+56)/2= 55.5
Median is not affected by theextreme values
Median is not reflecting theinformation about all the numbers.
Mean
Arithmetic mean is the
average of a group of
members.
Computed by dividing
the sum of the numbers
by the total numbers.
Meanisaffectedbyallthevaluesinthedataset.
Meanisbadlyaffectedbytheoutliersortheextremevaluesinthe
dataset.
Percentiles
 99 values (dividers) which divide the
data into 100 equal parts.
 nth percentile means that n % of the
data is below than value. For example
87th percentile means 87% of the values
are lower than this number.
Percentiles are widely used in tests
such as CAT, JEE, GRE etc. The results of
these exams are reported in percentile
form along with raw scores.
Quartiles
Are measure of central tendency that divide a
group of data into four equal parts.
These quartiles are denoted as Q1, Q2 and Q3.
Q1 is 25th percentile, Q2 is 50th percentile and Q3
is 75th percentile.

Measure of Variability-
Ungrouped data
Describe the dispersion or
spread of the data set.
Provides significant information
along with measure of central
tendency.
Range and Interquartile range
Range is the difference between the largest value of a data set and the smallest value of the
data set.
Easy to compute
Not considered as a good measure as it considers the extreme values of the dataset.
Interquartile range is the difference between first quartile and third quartile of a dataset
i.e. Interquartile Range = Q3 - Q1
It indicates the range of 50% of the dataset.
Mean Absolute deviation
 Average of the absolute values of the deviations around the mean for a set of
numbers
Variation
 Average of the squared deviations from the mean for a set of numbers
Standard Deviation
 Square root of the variance
Chebyshev’s Theorem:
Helps in estimating the approximate percentage of values that lie within
a given number of standard deviation from the mean of a set of data if
the data is normally distributed.
Chebyshev’s theorem
statesthatatleast1–1/k2valueswillfallwithin+standarddeviationofthe
meanregardlessoftheshapeofthedistribution
Assuming the average weight of 56 kg and standard deviation of 10 kg.
Estimate that how much proportion of the population lie within the
range of mean + 2 * SD
a. If the distribution is normal.
b. If the distribution is not normal.
Z-Scores
is a numerical measurement used in statistics of a value's relationship to
the mean (average) of a group of values, measured in terms of standard
deviation from the mean.
If a Z-score is 0, it indicates that the data point's score is identical to the
mean score.
A Z-score of 1 would indicate a value that is one standard deviation
from the mean.
Z-scores may be positive or negative, with a positive value indicating the
score is above the mean and a negative score indicating it is below the
mean.
Coefficient of Variation
Is the ratio of standard deviation to the mean expressed in
percentage
𝐶𝑉 =
𝜎
𝜇
(100)
CV is a relative comparison of a SD to the mean.
Skewness
Kurtosis
Mean – Grouped data
Median Grouped Data
Box Plot Diagram
Thankyou

More Related Content

Similar to Descriptive Statistics.pptx

Summary statistics
Summary statisticsSummary statistics
Summary statistics
Rupak Roy
 
Central tendency _dispersion
Central tendency _dispersionCentral tendency _dispersion
Central tendency _dispersion
Kirti Gupta
 
Bio statistics
Bio statisticsBio statistics
Bio statisticsNc Das
 
Ch2 Data Description
Ch2 Data DescriptionCh2 Data Description
Ch2 Data Description
Farhan Alfin
 
Describing quantitative data with numbers
Describing quantitative data with numbersDescribing quantitative data with numbers
Describing quantitative data with numbersUlster BOCES
 
3.2 measures of variation
3.2 measures of variation3.2 measures of variation
3.2 measures of variationleblance
 
QT1 - 03 - Measures of Central Tendency
QT1 - 03 - Measures of Central TendencyQT1 - 03 - Measures of Central Tendency
QT1 - 03 - Measures of Central Tendency
Prithwis Mukerjee
 
QT1 - 03 - Measures of Central Tendency
QT1 - 03 - Measures of Central TendencyQT1 - 03 - Measures of Central Tendency
QT1 - 03 - Measures of Central Tendency
Prithwis Mukerjee
 
Descriptive Statistics: Measures of Central Tendency - Measures of Dispersion...
Descriptive Statistics: Measures of Central Tendency - Measures of Dispersion...Descriptive Statistics: Measures of Central Tendency - Measures of Dispersion...
Descriptive Statistics: Measures of Central Tendency - Measures of Dispersion...
EqraBaig
 
Basic Statistical Concepts in Machine Learning.pptx
Basic Statistical Concepts in Machine Learning.pptxBasic Statistical Concepts in Machine Learning.pptx
Basic Statistical Concepts in Machine Learning.pptx
bajajrishabh96tech
 
Ders 1 mean mod media st dev.pptx
Ders 1 mean mod media st dev.pptxDers 1 mean mod media st dev.pptx
Ders 1 mean mod media st dev.pptx
Ergin Akalpler
 
Measures of central tendancy easy to under this stats topic
Measures of central tendancy easy to under this stats topicMeasures of central tendancy easy to under this stats topic
Measures of central tendancy easy to under this stats topic
Nishant Taralkar
 
Statistics (GE 4 CLASS).pptx
Statistics (GE 4 CLASS).pptxStatistics (GE 4 CLASS).pptx
Statistics (GE 4 CLASS).pptx
YollyCalamba
 
Statistics review
Statistics reviewStatistics review
Statistics review
jpcagphil
 
Graphical presentation of data
Graphical presentation of dataGraphical presentation of data
Graphical presentation of datadrasifk
 
polar pojhjgfnbhggnbh hnhghgnhbhnhbjnhhhhhh
polar pojhjgfnbhggnbh hnhghgnhbhnhbjnhhhhhhpolar pojhjgfnbhggnbh hnhghgnhbhnhbjnhhhhhh
polar pojhjgfnbhggnbh hnhghgnhbhnhbjnhhhhhh
NathanAndreiBoongali
 
Statistical treatment and data processing copy
Statistical treatment and data processing   copyStatistical treatment and data processing   copy
Statistical treatment and data processing copy
SWEET PEARL GAMAYON
 
A Brief Overview On Central Tendency.pptx
A Brief Overview On Central Tendency.pptxA Brief Overview On Central Tendency.pptx
A Brief Overview On Central Tendency.pptx
CHIRANTANMONDAL2
 
Descriptive Statistics: Mean, Median Mode and Standard Deviation.
Descriptive Statistics: Mean, Median Mode and Standard Deviation.Descriptive Statistics: Mean, Median Mode and Standard Deviation.
Descriptive Statistics: Mean, Median Mode and Standard Deviation.
Megha Sharma
 

Similar to Descriptive Statistics.pptx (20)

Summary statistics
Summary statisticsSummary statistics
Summary statistics
 
Central tendency _dispersion
Central tendency _dispersionCentral tendency _dispersion
Central tendency _dispersion
 
Bio statistics
Bio statisticsBio statistics
Bio statistics
 
Ch2 Data Description
Ch2 Data DescriptionCh2 Data Description
Ch2 Data Description
 
Describing quantitative data with numbers
Describing quantitative data with numbersDescribing quantitative data with numbers
Describing quantitative data with numbers
 
3.2 measures of variation
3.2 measures of variation3.2 measures of variation
3.2 measures of variation
 
QT1 - 03 - Measures of Central Tendency
QT1 - 03 - Measures of Central TendencyQT1 - 03 - Measures of Central Tendency
QT1 - 03 - Measures of Central Tendency
 
QT1 - 03 - Measures of Central Tendency
QT1 - 03 - Measures of Central TendencyQT1 - 03 - Measures of Central Tendency
QT1 - 03 - Measures of Central Tendency
 
Descriptive Statistics: Measures of Central Tendency - Measures of Dispersion...
Descriptive Statistics: Measures of Central Tendency - Measures of Dispersion...Descriptive Statistics: Measures of Central Tendency - Measures of Dispersion...
Descriptive Statistics: Measures of Central Tendency - Measures of Dispersion...
 
Basic Statistical Concepts in Machine Learning.pptx
Basic Statistical Concepts in Machine Learning.pptxBasic Statistical Concepts in Machine Learning.pptx
Basic Statistical Concepts in Machine Learning.pptx
 
Ders 1 mean mod media st dev.pptx
Ders 1 mean mod media st dev.pptxDers 1 mean mod media st dev.pptx
Ders 1 mean mod media st dev.pptx
 
Measures of central tendancy easy to under this stats topic
Measures of central tendancy easy to under this stats topicMeasures of central tendancy easy to under this stats topic
Measures of central tendancy easy to under this stats topic
 
Statistics (GE 4 CLASS).pptx
Statistics (GE 4 CLASS).pptxStatistics (GE 4 CLASS).pptx
Statistics (GE 4 CLASS).pptx
 
Statistics review
Statistics reviewStatistics review
Statistics review
 
Graphical presentation of data
Graphical presentation of dataGraphical presentation of data
Graphical presentation of data
 
polar pojhjgfnbhggnbh hnhghgnhbhnhbjnhhhhhh
polar pojhjgfnbhggnbh hnhghgnhbhnhbjnhhhhhhpolar pojhjgfnbhggnbh hnhghgnhbhnhbjnhhhhhh
polar pojhjgfnbhggnbh hnhghgnhbhnhbjnhhhhhh
 
Quants
QuantsQuants
Quants
 
Statistical treatment and data processing copy
Statistical treatment and data processing   copyStatistical treatment and data processing   copy
Statistical treatment and data processing copy
 
A Brief Overview On Central Tendency.pptx
A Brief Overview On Central Tendency.pptxA Brief Overview On Central Tendency.pptx
A Brief Overview On Central Tendency.pptx
 
Descriptive Statistics: Mean, Median Mode and Standard Deviation.
Descriptive Statistics: Mean, Median Mode and Standard Deviation.Descriptive Statistics: Mean, Median Mode and Standard Deviation.
Descriptive Statistics: Mean, Median Mode and Standard Deviation.
 

Recently uploaded

Mule 4.6 & Java 17 Upgrade | MuleSoft Mysore Meetup #46
Mule 4.6 & Java 17 Upgrade | MuleSoft Mysore Meetup #46Mule 4.6 & Java 17 Upgrade | MuleSoft Mysore Meetup #46
Mule 4.6 & Java 17 Upgrade | MuleSoft Mysore Meetup #46
MysoreMuleSoftMeetup
 
Language Across the Curriculm LAC B.Ed.
Language Across the  Curriculm LAC B.Ed.Language Across the  Curriculm LAC B.Ed.
Language Across the Curriculm LAC B.Ed.
Atul Kumar Singh
 
Best Digital Marketing Institute In NOIDA
Best Digital Marketing Institute In NOIDABest Digital Marketing Institute In NOIDA
Best Digital Marketing Institute In NOIDA
deeptiverma2406
 
Marketing internship report file for MBA
Marketing internship report file for MBAMarketing internship report file for MBA
Marketing internship report file for MBA
gb193092
 
Embracing GenAI - A Strategic Imperative
Embracing GenAI - A Strategic ImperativeEmbracing GenAI - A Strategic Imperative
Embracing GenAI - A Strategic Imperative
Peter Windle
 
Digital Artifact 2 - Investigating Pavilion Designs
Digital Artifact 2 - Investigating Pavilion DesignsDigital Artifact 2 - Investigating Pavilion Designs
Digital Artifact 2 - Investigating Pavilion Designs
chanes7
 
Chapter -12, Antibiotics (One Page Notes).pdf
Chapter -12, Antibiotics (One Page Notes).pdfChapter -12, Antibiotics (One Page Notes).pdf
Chapter -12, Antibiotics (One Page Notes).pdf
Kartik Tiwari
 
1.4 modern child centered education - mahatma gandhi-2.pptx
1.4 modern child centered education - mahatma gandhi-2.pptx1.4 modern child centered education - mahatma gandhi-2.pptx
1.4 modern child centered education - mahatma gandhi-2.pptx
JosvitaDsouza2
 
The approach at University of Liverpool.pptx
The approach at University of Liverpool.pptxThe approach at University of Liverpool.pptx
The approach at University of Liverpool.pptx
Jisc
 
Unit 2- Research Aptitude (UGC NET Paper I).pdf
Unit 2- Research Aptitude (UGC NET Paper I).pdfUnit 2- Research Aptitude (UGC NET Paper I).pdf
Unit 2- Research Aptitude (UGC NET Paper I).pdf
Thiyagu K
 
Unit 8 - Information and Communication Technology (Paper I).pdf
Unit 8 - Information and Communication Technology (Paper I).pdfUnit 8 - Information and Communication Technology (Paper I).pdf
Unit 8 - Information and Communication Technology (Paper I).pdf
Thiyagu K
 
Azure Interview Questions and Answers PDF By ScholarHat
Azure Interview Questions and Answers PDF By ScholarHatAzure Interview Questions and Answers PDF By ScholarHat
Azure Interview Questions and Answers PDF By ScholarHat
Scholarhat
 
TESDA TM1 REVIEWER FOR NATIONAL ASSESSMENT WRITTEN AND ORAL QUESTIONS WITH A...
TESDA TM1 REVIEWER  FOR NATIONAL ASSESSMENT WRITTEN AND ORAL QUESTIONS WITH A...TESDA TM1 REVIEWER  FOR NATIONAL ASSESSMENT WRITTEN AND ORAL QUESTIONS WITH A...
TESDA TM1 REVIEWER FOR NATIONAL ASSESSMENT WRITTEN AND ORAL QUESTIONS WITH A...
EugeneSaldivar
 
How libraries can support authors with open access requirements for UKRI fund...
How libraries can support authors with open access requirements for UKRI fund...How libraries can support authors with open access requirements for UKRI fund...
How libraries can support authors with open access requirements for UKRI fund...
Jisc
 
The Accursed House by Émile Gaboriau.pptx
The Accursed House by Émile Gaboriau.pptxThe Accursed House by Émile Gaboriau.pptx
The Accursed House by Émile Gaboriau.pptx
DhatriParmar
 
special B.ed 2nd year old paper_20240531.pdf
special B.ed 2nd year old paper_20240531.pdfspecial B.ed 2nd year old paper_20240531.pdf
special B.ed 2nd year old paper_20240531.pdf
Special education needs
 
The Challenger.pdf DNHS Official Publication
The Challenger.pdf DNHS Official PublicationThe Challenger.pdf DNHS Official Publication
The Challenger.pdf DNHS Official Publication
Delapenabediema
 
June 3, 2024 Anti-Semitism Letter Sent to MIT President Kornbluth and MIT Cor...
June 3, 2024 Anti-Semitism Letter Sent to MIT President Kornbluth and MIT Cor...June 3, 2024 Anti-Semitism Letter Sent to MIT President Kornbluth and MIT Cor...
June 3, 2024 Anti-Semitism Letter Sent to MIT President Kornbluth and MIT Cor...
Levi Shapiro
 
Supporting (UKRI) OA monographs at Salford.pptx
Supporting (UKRI) OA monographs at Salford.pptxSupporting (UKRI) OA monographs at Salford.pptx
Supporting (UKRI) OA monographs at Salford.pptx
Jisc
 
Biological Screening of Herbal Drugs in detailed.
Biological Screening of Herbal Drugs in detailed.Biological Screening of Herbal Drugs in detailed.
Biological Screening of Herbal Drugs in detailed.
Ashokrao Mane college of Pharmacy Peth-Vadgaon
 

Recently uploaded (20)

Mule 4.6 & Java 17 Upgrade | MuleSoft Mysore Meetup #46
Mule 4.6 & Java 17 Upgrade | MuleSoft Mysore Meetup #46Mule 4.6 & Java 17 Upgrade | MuleSoft Mysore Meetup #46
Mule 4.6 & Java 17 Upgrade | MuleSoft Mysore Meetup #46
 
Language Across the Curriculm LAC B.Ed.
Language Across the  Curriculm LAC B.Ed.Language Across the  Curriculm LAC B.Ed.
Language Across the Curriculm LAC B.Ed.
 
Best Digital Marketing Institute In NOIDA
Best Digital Marketing Institute In NOIDABest Digital Marketing Institute In NOIDA
Best Digital Marketing Institute In NOIDA
 
Marketing internship report file for MBA
Marketing internship report file for MBAMarketing internship report file for MBA
Marketing internship report file for MBA
 
Embracing GenAI - A Strategic Imperative
Embracing GenAI - A Strategic ImperativeEmbracing GenAI - A Strategic Imperative
Embracing GenAI - A Strategic Imperative
 
Digital Artifact 2 - Investigating Pavilion Designs
Digital Artifact 2 - Investigating Pavilion DesignsDigital Artifact 2 - Investigating Pavilion Designs
Digital Artifact 2 - Investigating Pavilion Designs
 
Chapter -12, Antibiotics (One Page Notes).pdf
Chapter -12, Antibiotics (One Page Notes).pdfChapter -12, Antibiotics (One Page Notes).pdf
Chapter -12, Antibiotics (One Page Notes).pdf
 
1.4 modern child centered education - mahatma gandhi-2.pptx
1.4 modern child centered education - mahatma gandhi-2.pptx1.4 modern child centered education - mahatma gandhi-2.pptx
1.4 modern child centered education - mahatma gandhi-2.pptx
 
The approach at University of Liverpool.pptx
The approach at University of Liverpool.pptxThe approach at University of Liverpool.pptx
The approach at University of Liverpool.pptx
 
Unit 2- Research Aptitude (UGC NET Paper I).pdf
Unit 2- Research Aptitude (UGC NET Paper I).pdfUnit 2- Research Aptitude (UGC NET Paper I).pdf
Unit 2- Research Aptitude (UGC NET Paper I).pdf
 
Unit 8 - Information and Communication Technology (Paper I).pdf
Unit 8 - Information and Communication Technology (Paper I).pdfUnit 8 - Information and Communication Technology (Paper I).pdf
Unit 8 - Information and Communication Technology (Paper I).pdf
 
Azure Interview Questions and Answers PDF By ScholarHat
Azure Interview Questions and Answers PDF By ScholarHatAzure Interview Questions and Answers PDF By ScholarHat
Azure Interview Questions and Answers PDF By ScholarHat
 
TESDA TM1 REVIEWER FOR NATIONAL ASSESSMENT WRITTEN AND ORAL QUESTIONS WITH A...
TESDA TM1 REVIEWER  FOR NATIONAL ASSESSMENT WRITTEN AND ORAL QUESTIONS WITH A...TESDA TM1 REVIEWER  FOR NATIONAL ASSESSMENT WRITTEN AND ORAL QUESTIONS WITH A...
TESDA TM1 REVIEWER FOR NATIONAL ASSESSMENT WRITTEN AND ORAL QUESTIONS WITH A...
 
How libraries can support authors with open access requirements for UKRI fund...
How libraries can support authors with open access requirements for UKRI fund...How libraries can support authors with open access requirements for UKRI fund...
How libraries can support authors with open access requirements for UKRI fund...
 
The Accursed House by Émile Gaboriau.pptx
The Accursed House by Émile Gaboriau.pptxThe Accursed House by Émile Gaboriau.pptx
The Accursed House by Émile Gaboriau.pptx
 
special B.ed 2nd year old paper_20240531.pdf
special B.ed 2nd year old paper_20240531.pdfspecial B.ed 2nd year old paper_20240531.pdf
special B.ed 2nd year old paper_20240531.pdf
 
The Challenger.pdf DNHS Official Publication
The Challenger.pdf DNHS Official PublicationThe Challenger.pdf DNHS Official Publication
The Challenger.pdf DNHS Official Publication
 
June 3, 2024 Anti-Semitism Letter Sent to MIT President Kornbluth and MIT Cor...
June 3, 2024 Anti-Semitism Letter Sent to MIT President Kornbluth and MIT Cor...June 3, 2024 Anti-Semitism Letter Sent to MIT President Kornbluth and MIT Cor...
June 3, 2024 Anti-Semitism Letter Sent to MIT President Kornbluth and MIT Cor...
 
Supporting (UKRI) OA monographs at Salford.pptx
Supporting (UKRI) OA monographs at Salford.pptxSupporting (UKRI) OA monographs at Salford.pptx
Supporting (UKRI) OA monographs at Salford.pptx
 
Biological Screening of Herbal Drugs in detailed.
Biological Screening of Herbal Drugs in detailed.Biological Screening of Herbal Drugs in detailed.
Biological Screening of Herbal Drugs in detailed.
 

Descriptive Statistics.pptx

  • 1. Descriptive Statistics Measure of Central Tendency Measure of Dispersion Measure of Distribution
  • 2. Measure of Central Tendency: Ungrouped Data  Provides information about the center or middle part of a group of numbers.  Includes mean, median, mode, quartiles, percentiles etc.
  • 3. Mode  Most frequently occurring value in a set of data.  Less popular than mean and median  Use to find out the value with highest demand in business. How to determine the mode in a data set  Order the values from minimum to maximum and locate the value which occurs the most.  3,4,5,5,6,6,6,6,6,7,7,7,8,8,9,9,9,10,10,11,12 Mode=6  3,4,5,5,5,5,6,6,6,6,8,8,9,9,9, 10, 11, 11, 12 Mode = 5 and 6 (Bimodal)  1,2,3,4,5,6,7,8,9,10,11,12,13,14,15,16,18 Mode = none
  • 4. Median  Middle value in an ordered array of numbers.  For an array with an odd number of terms, the median is the middle number  For an array with an even number of terms, the median is an average of the two middle numbers  Steps to determine the median:  Step1: Arrange the observation in an ascending/descending order  Step2: For an odd number of terms, find the middle term  Step3: For an even number of terms, the average of middle two terms
  • 5. Median Example: Calculate the median of the following example: 34 72 39 55 24 26 75 23 35 51 82 66 69 85 56 70 76 89 26 41 Step1:Arrange inascendingorder 2324262634353941515556666970727576828589 Step2:Themiddlevaluesare55and56 Step3:Medianis(55+56)/2= 55.5 Median is not affected by theextreme values Median is not reflecting theinformation about all the numbers.
  • 6. Mean Arithmetic mean is the average of a group of members. Computed by dividing the sum of the numbers by the total numbers.
  • 8. Percentiles  99 values (dividers) which divide the data into 100 equal parts.  nth percentile means that n % of the data is below than value. For example 87th percentile means 87% of the values are lower than this number. Percentiles are widely used in tests such as CAT, JEE, GRE etc. The results of these exams are reported in percentile form along with raw scores.
  • 9. Quartiles Are measure of central tendency that divide a group of data into four equal parts. These quartiles are denoted as Q1, Q2 and Q3. Q1 is 25th percentile, Q2 is 50th percentile and Q3 is 75th percentile. 
  • 10. Measure of Variability- Ungrouped data Describe the dispersion or spread of the data set. Provides significant information along with measure of central tendency.
  • 11. Range and Interquartile range Range is the difference between the largest value of a data set and the smallest value of the data set. Easy to compute Not considered as a good measure as it considers the extreme values of the dataset. Interquartile range is the difference between first quartile and third quartile of a dataset i.e. Interquartile Range = Q3 - Q1 It indicates the range of 50% of the dataset.
  • 12. Mean Absolute deviation  Average of the absolute values of the deviations around the mean for a set of numbers
  • 13. Variation  Average of the squared deviations from the mean for a set of numbers
  • 14. Standard Deviation  Square root of the variance
  • 15. Chebyshev’s Theorem: Helps in estimating the approximate percentage of values that lie within a given number of standard deviation from the mean of a set of data if the data is normally distributed.
  • 16. Chebyshev’s theorem statesthatatleast1–1/k2valueswillfallwithin+standarddeviationofthe meanregardlessoftheshapeofthedistribution Assuming the average weight of 56 kg and standard deviation of 10 kg. Estimate that how much proportion of the population lie within the range of mean + 2 * SD a. If the distribution is normal. b. If the distribution is not normal.
  • 17. Z-Scores is a numerical measurement used in statistics of a value's relationship to the mean (average) of a group of values, measured in terms of standard deviation from the mean. If a Z-score is 0, it indicates that the data point's score is identical to the mean score. A Z-score of 1 would indicate a value that is one standard deviation from the mean. Z-scores may be positive or negative, with a positive value indicating the score is above the mean and a negative score indicating it is below the mean.
  • 18.
  • 19. Coefficient of Variation Is the ratio of standard deviation to the mean expressed in percentage 𝐶𝑉 = 𝜎 𝜇 (100) CV is a relative comparison of a SD to the mean.