Downloaded 104 times
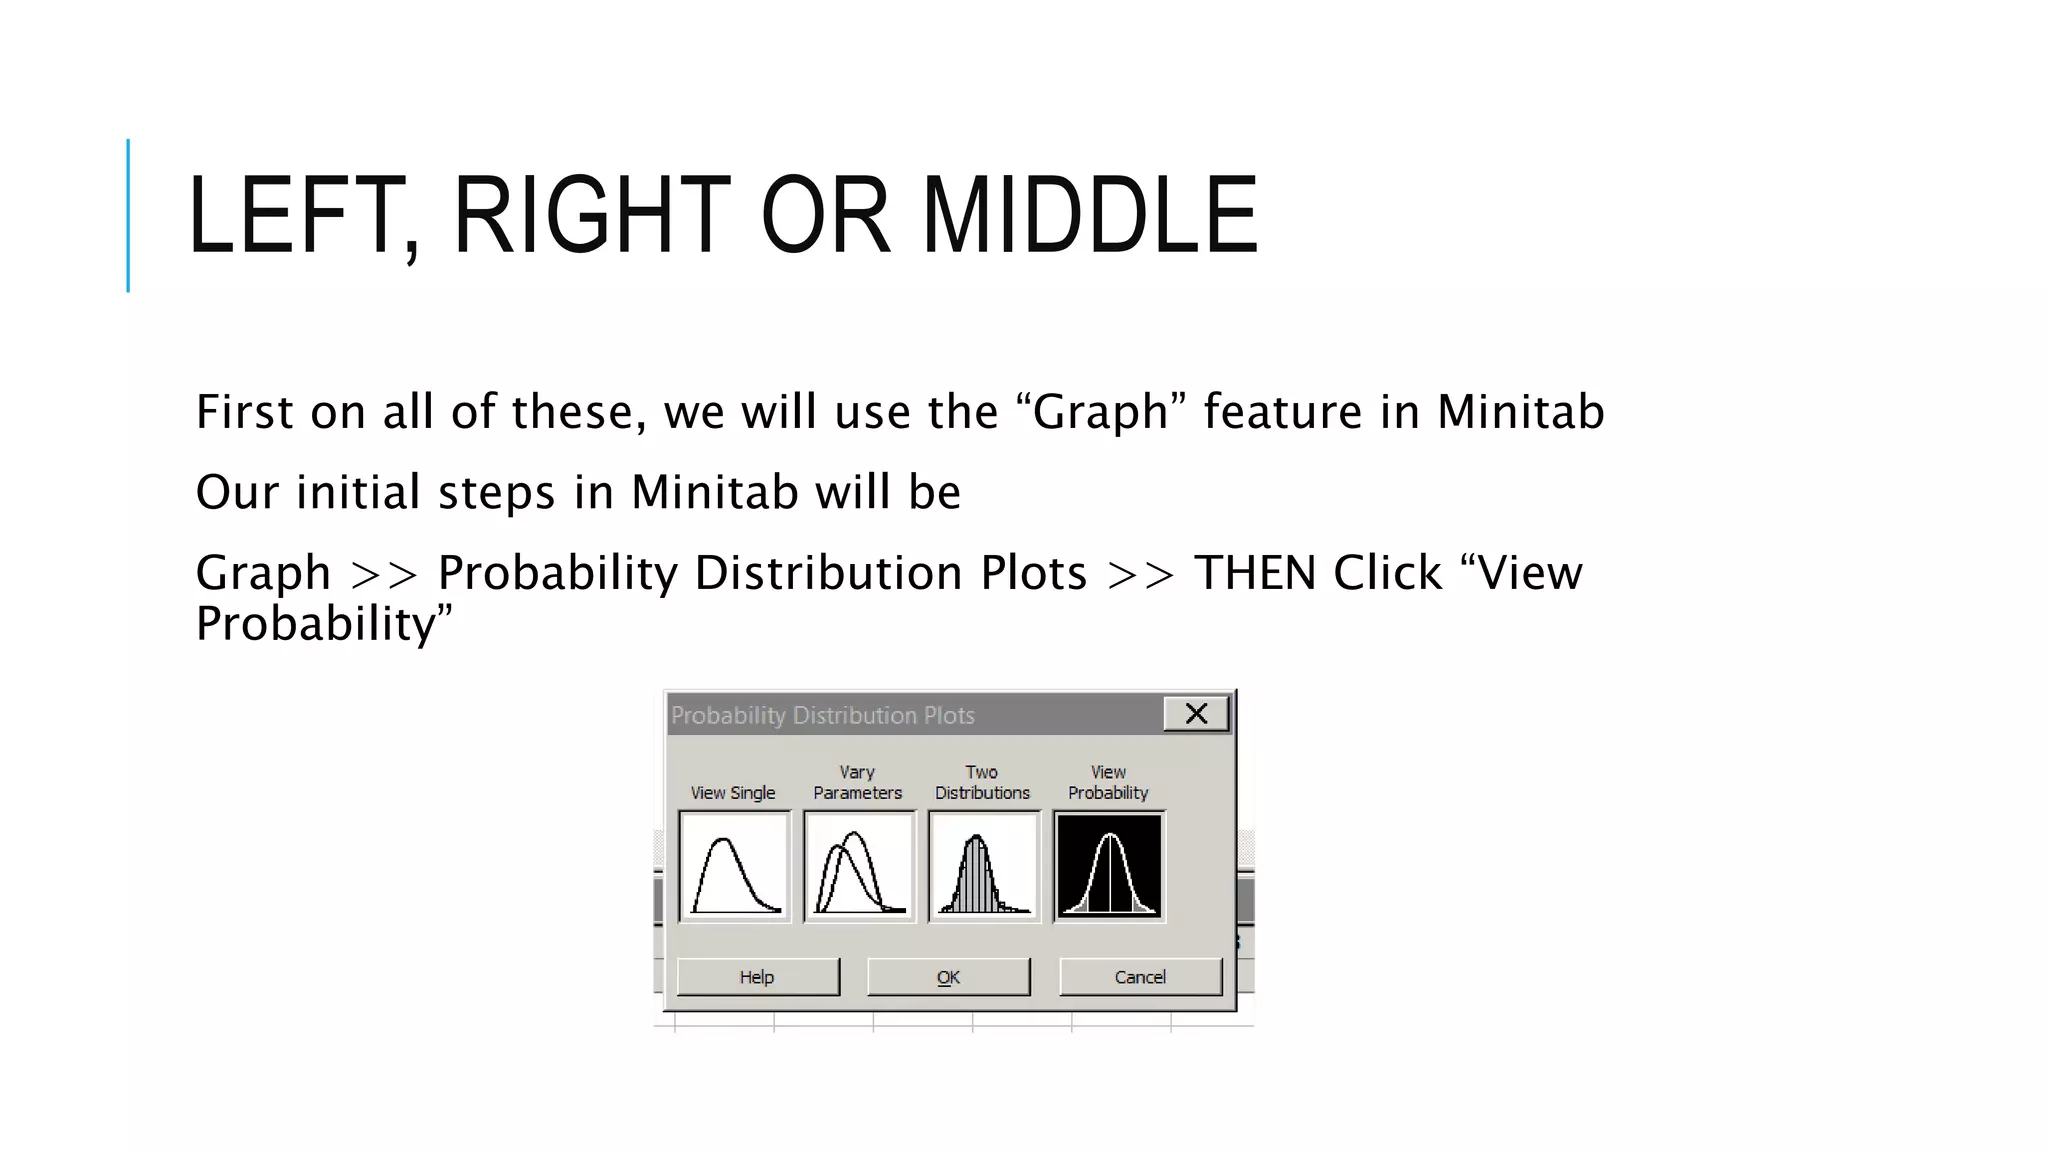
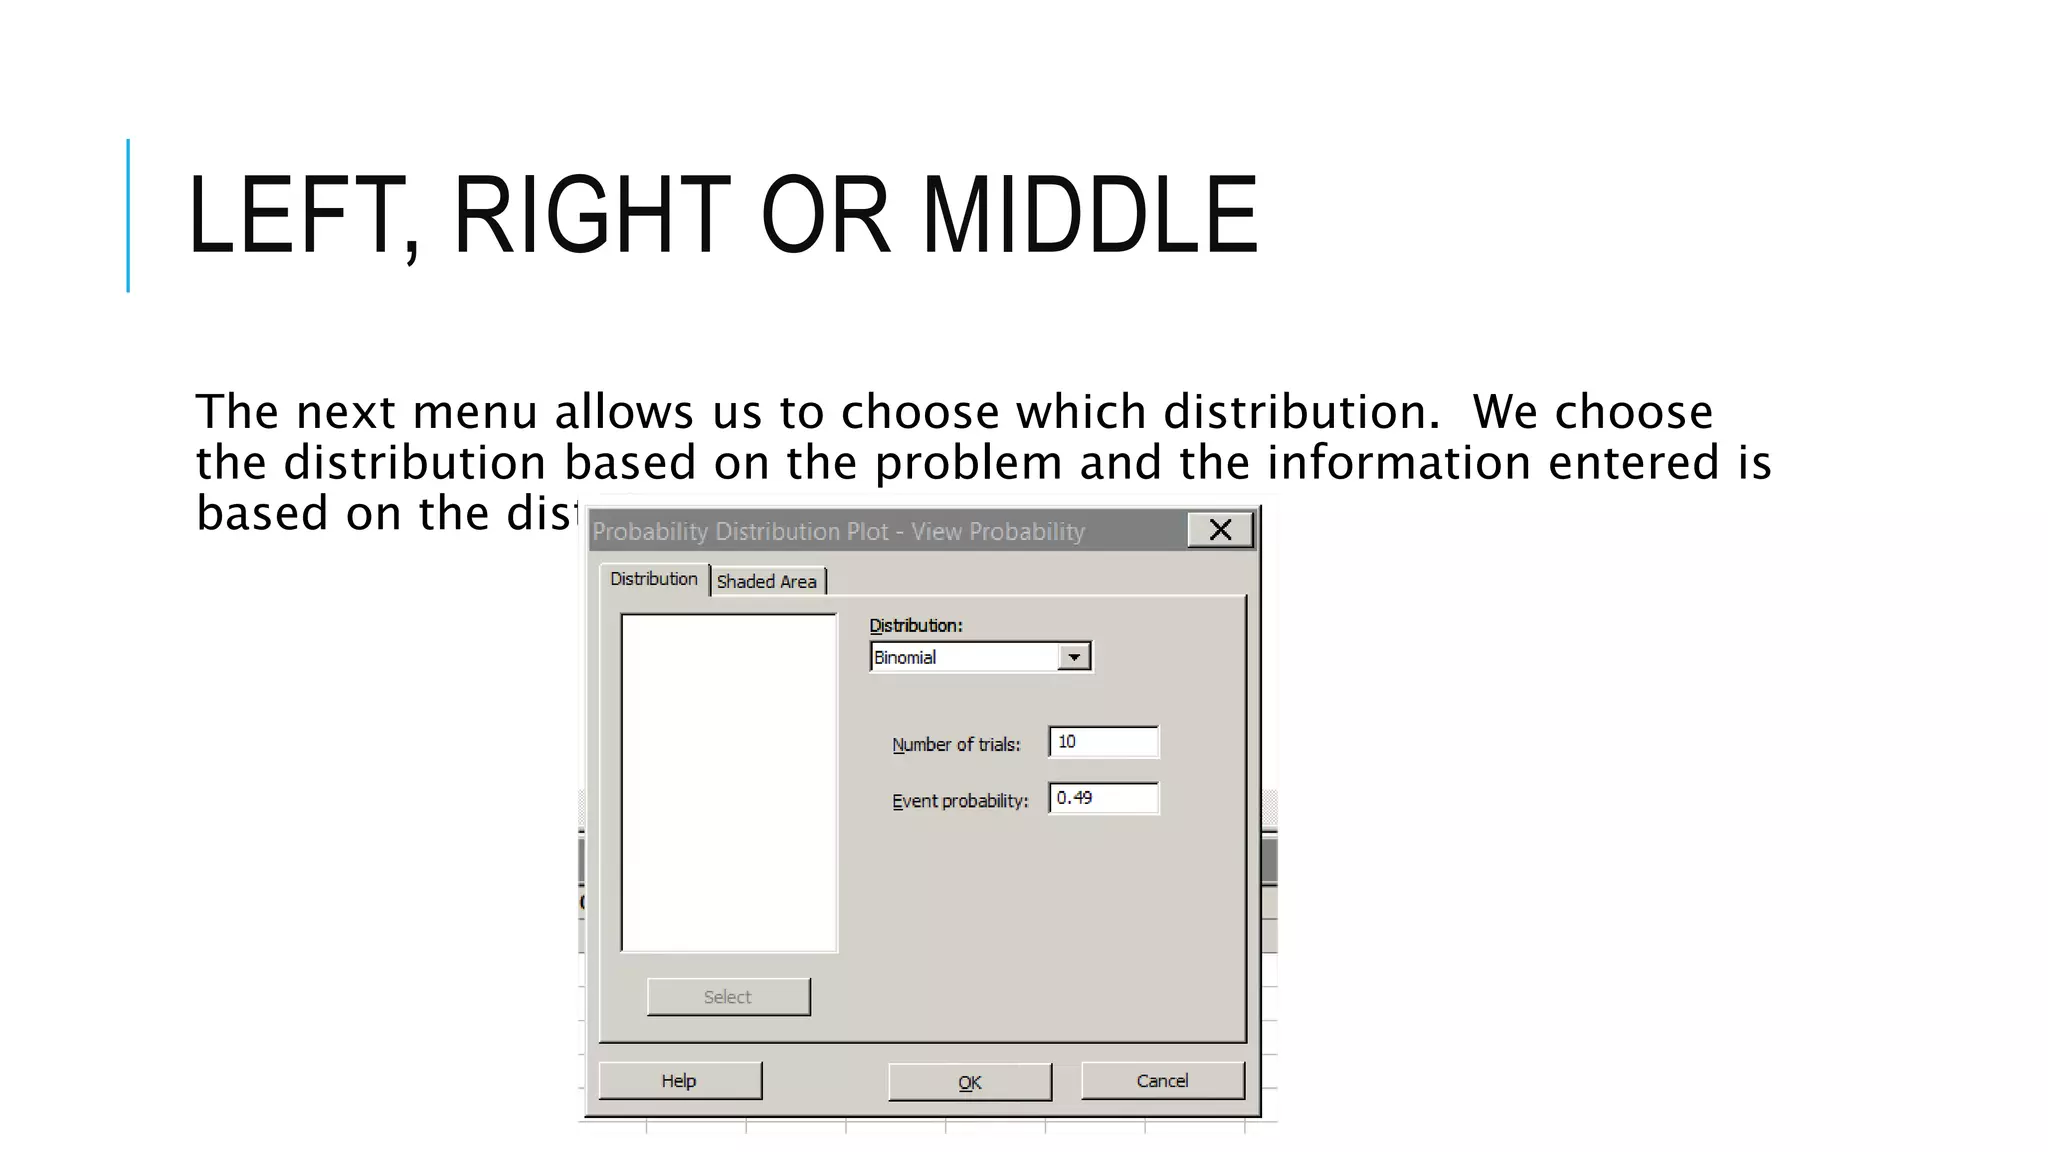
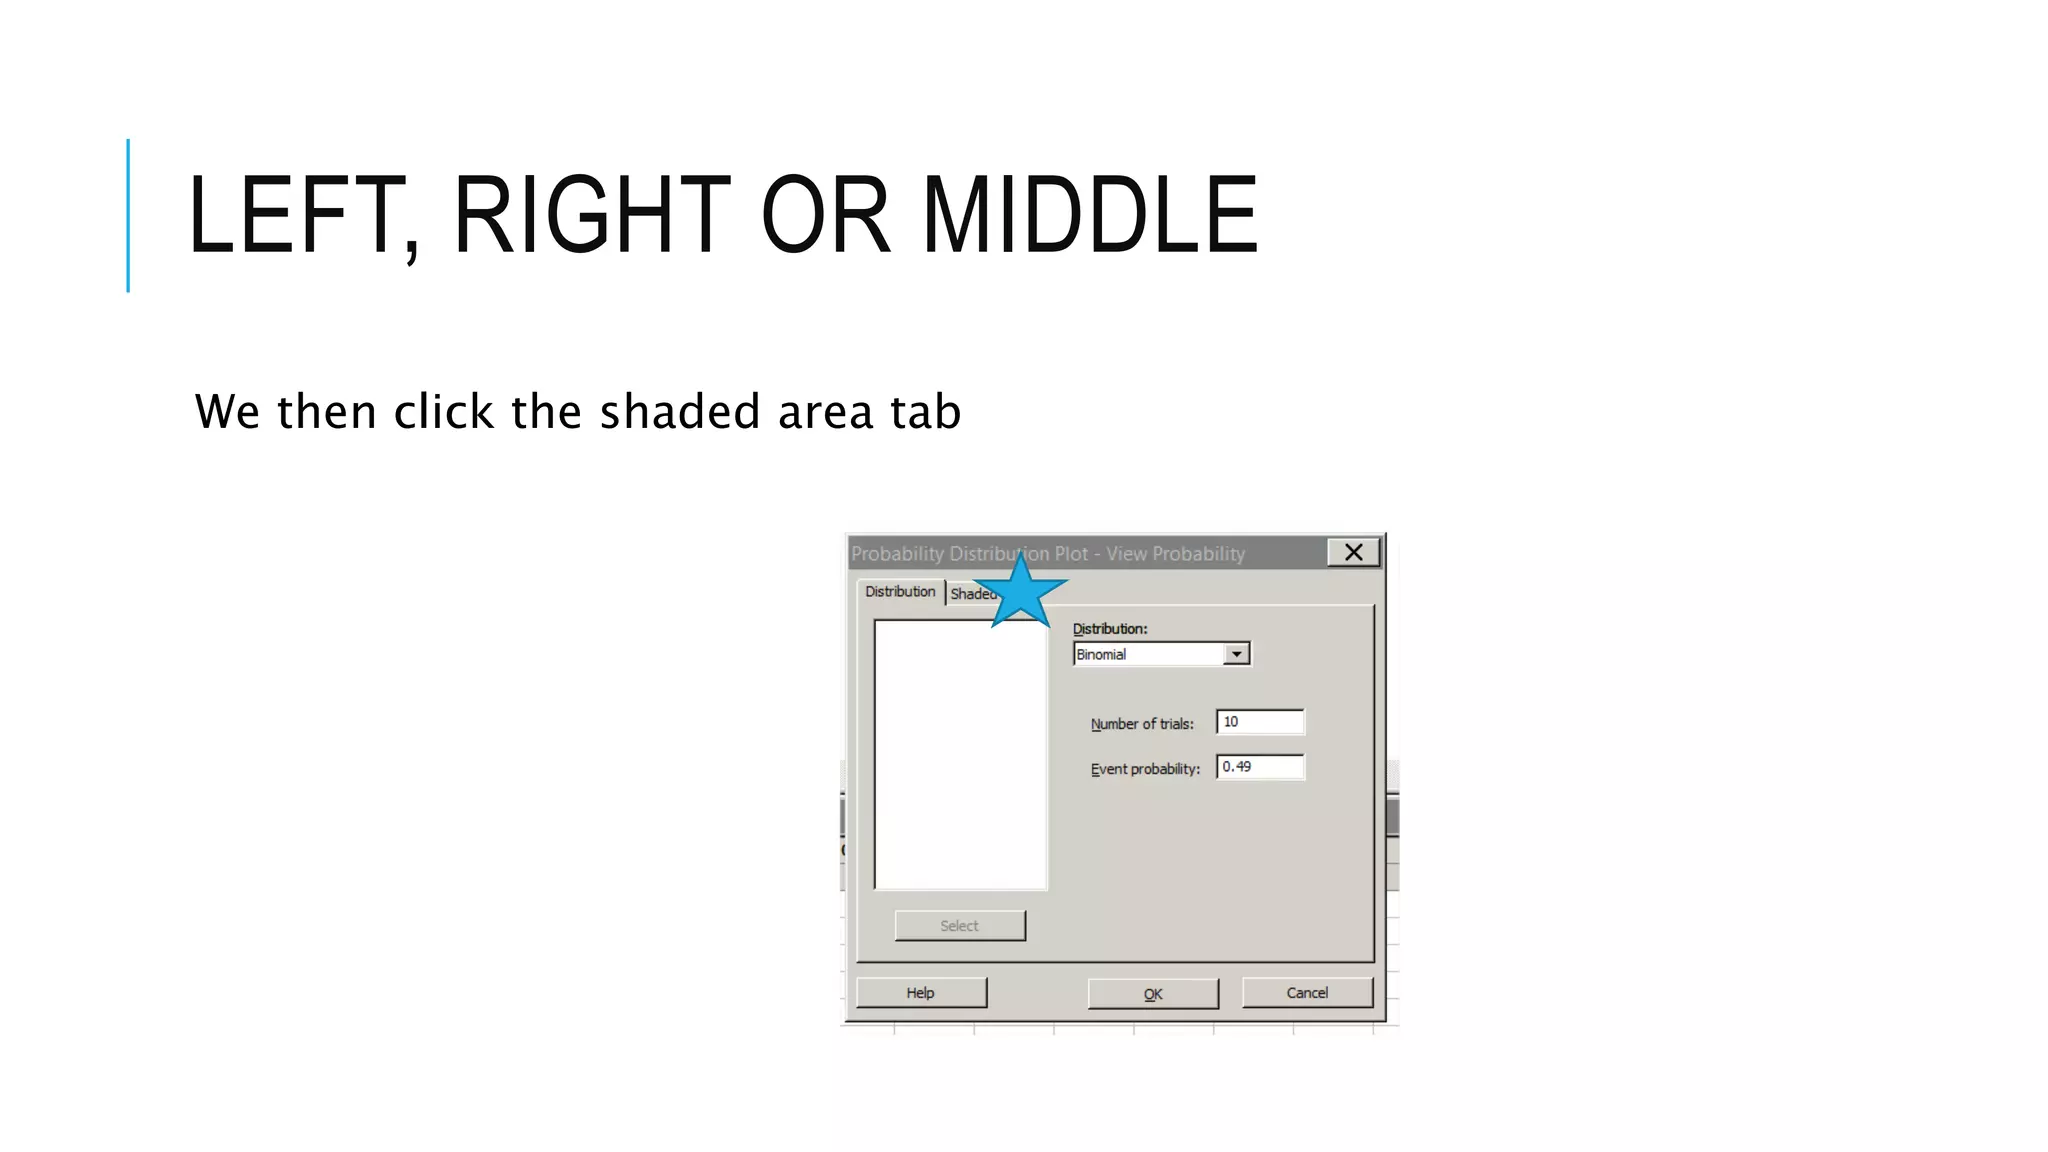
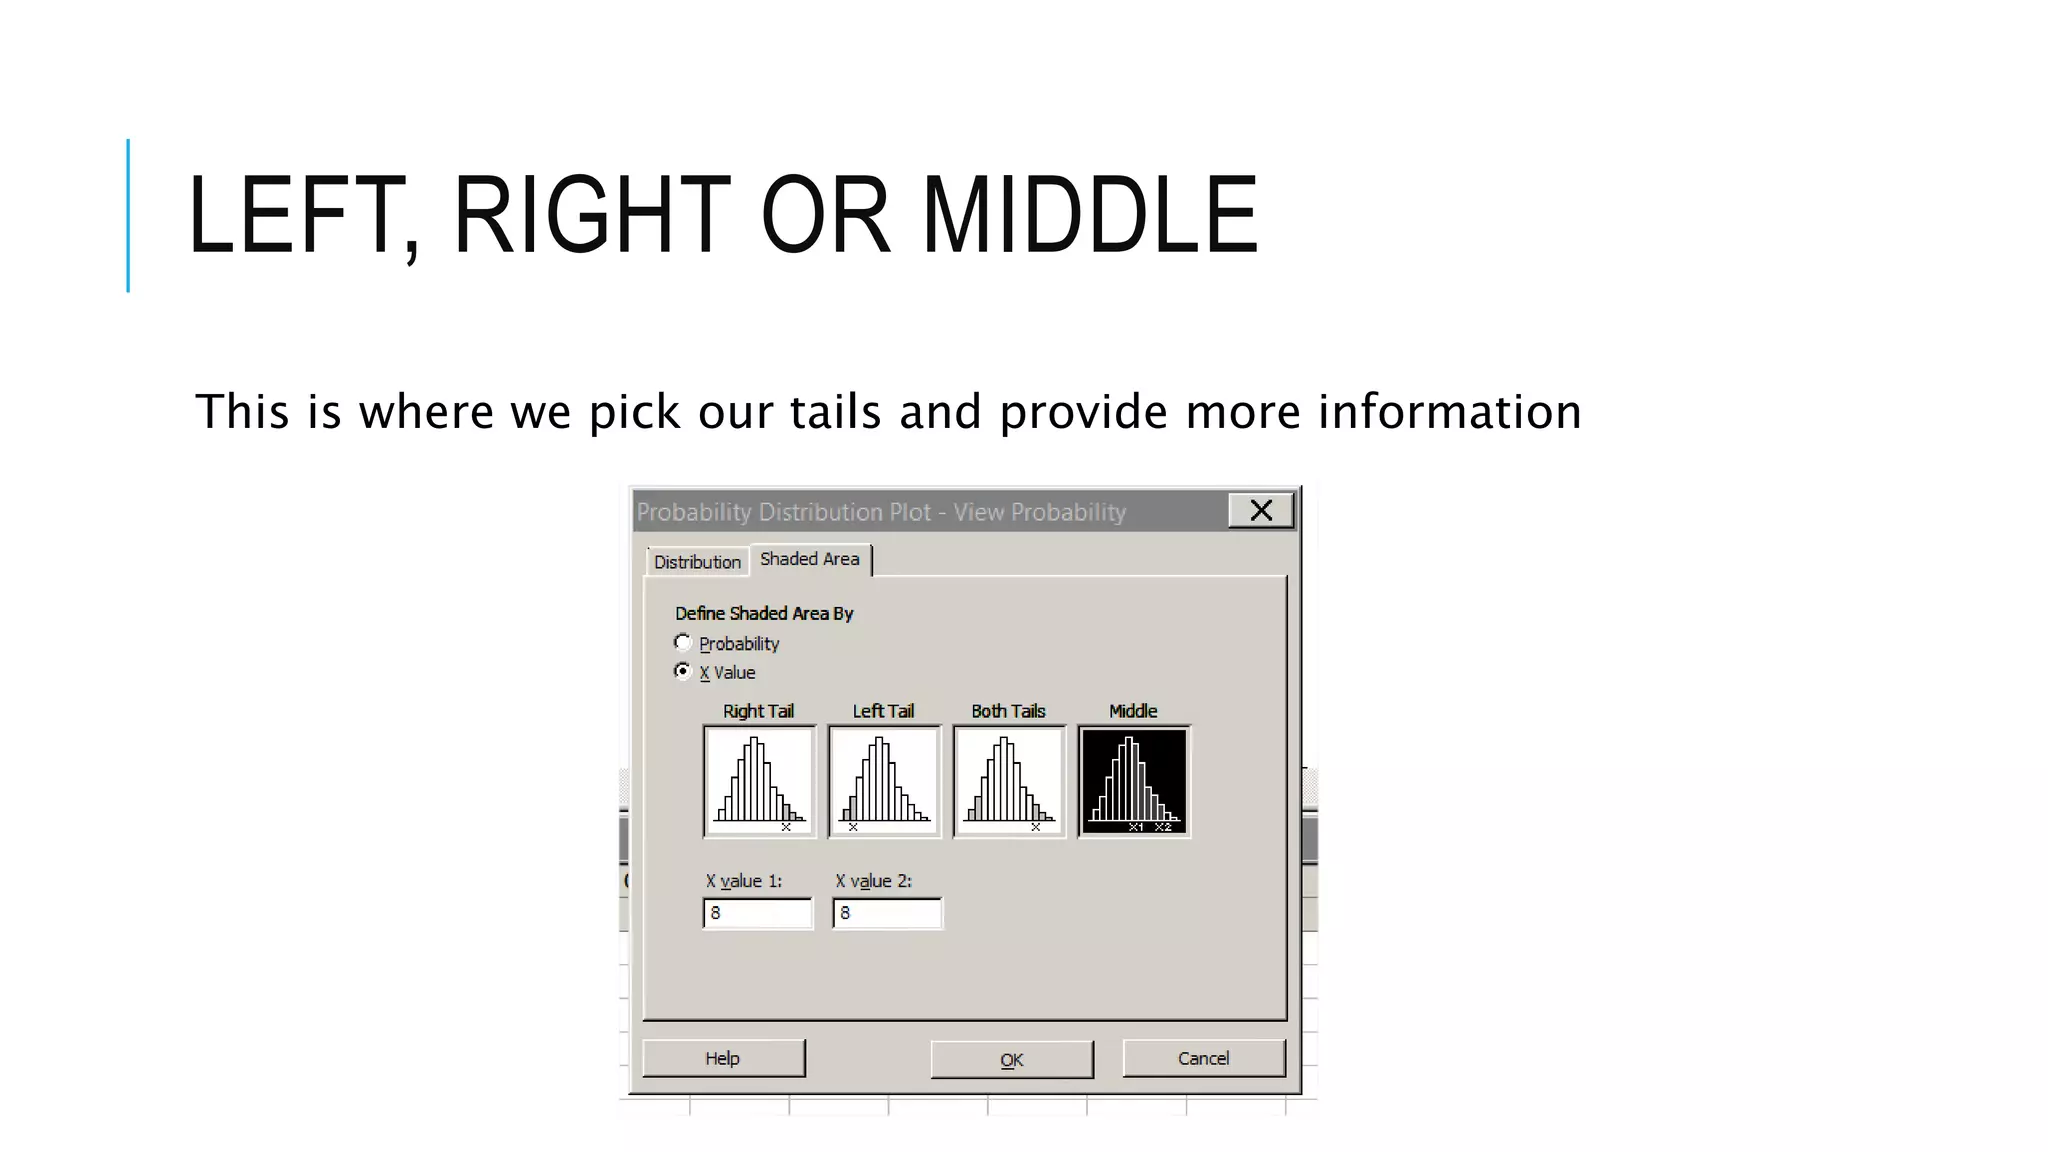
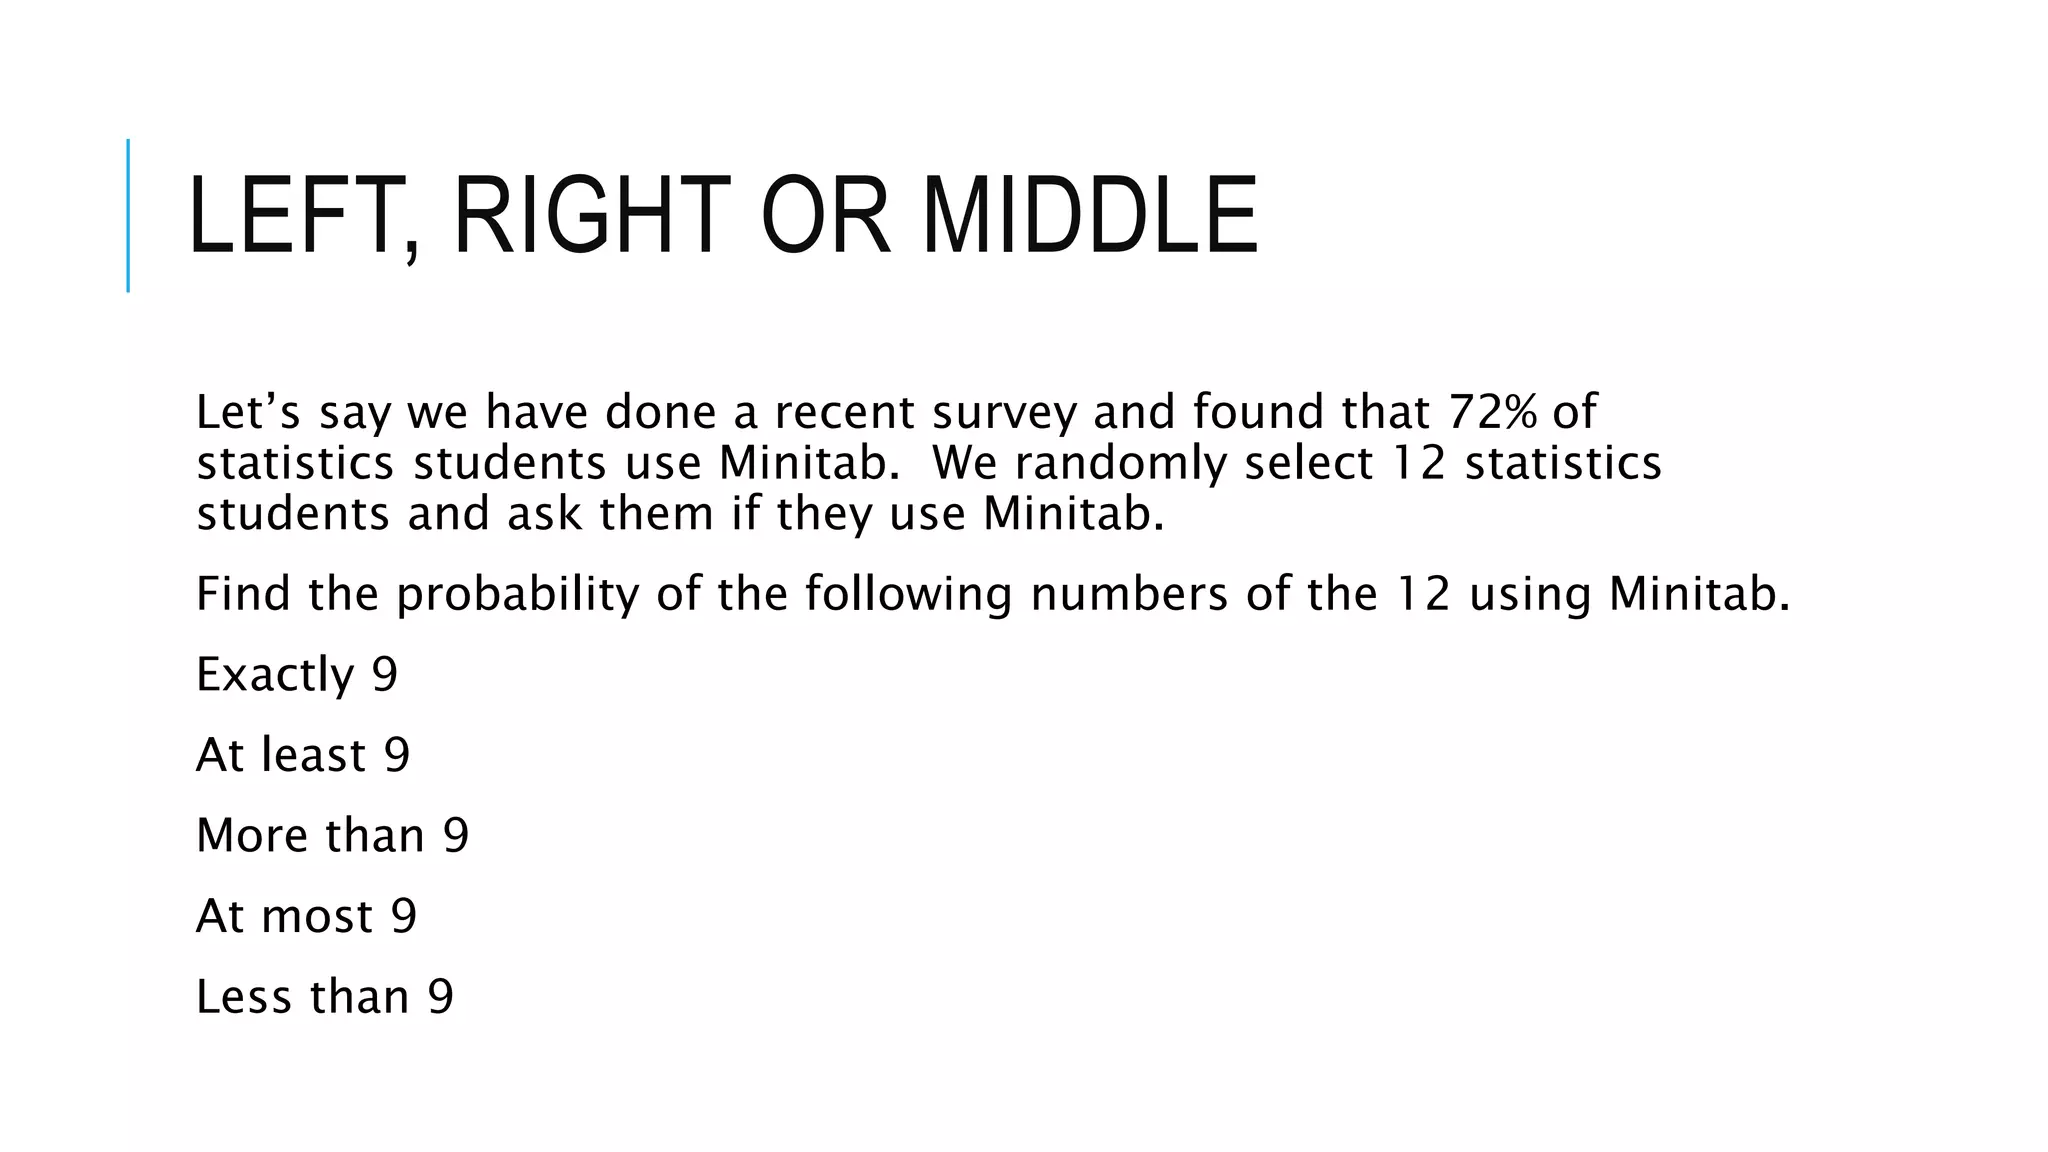
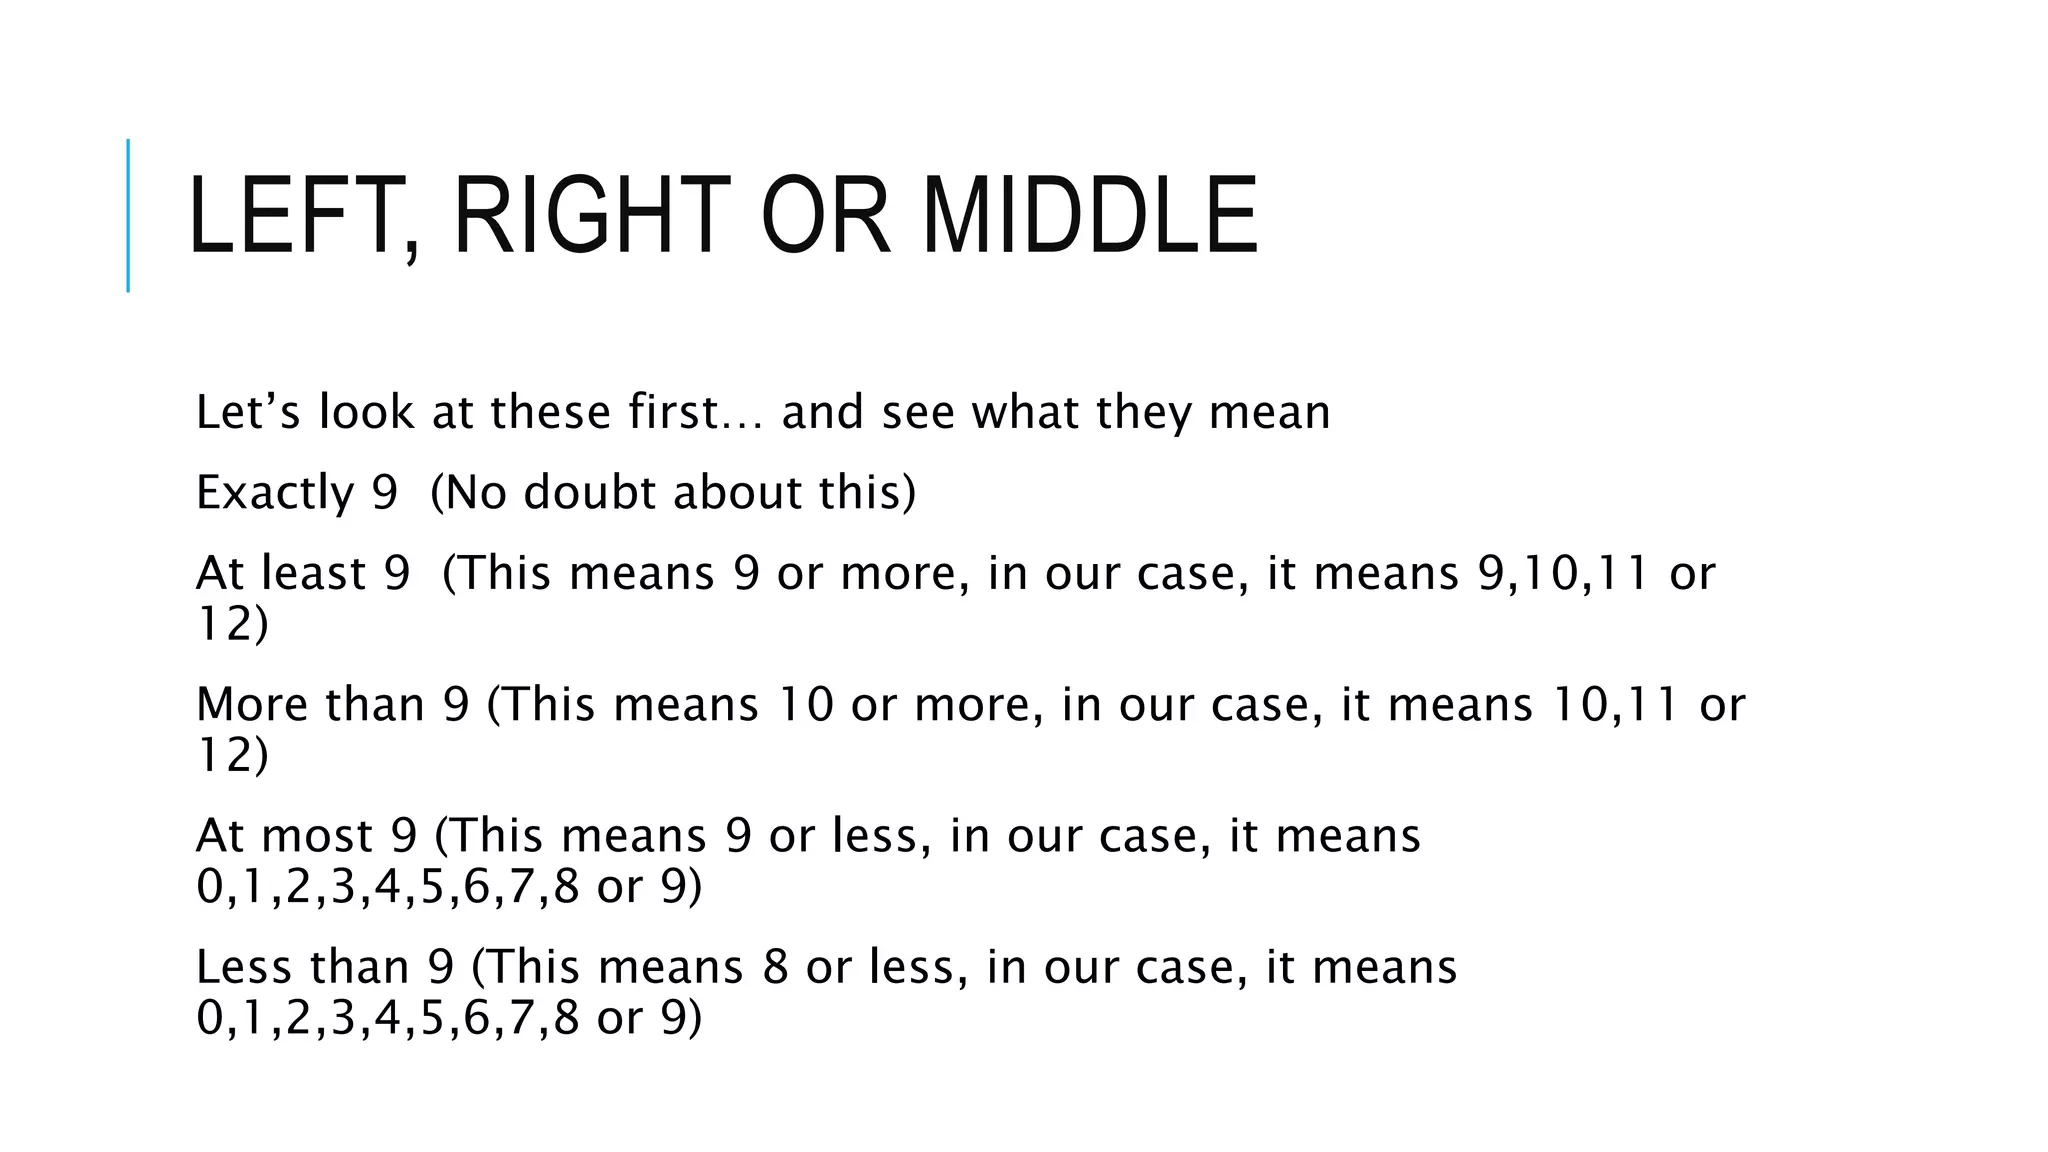

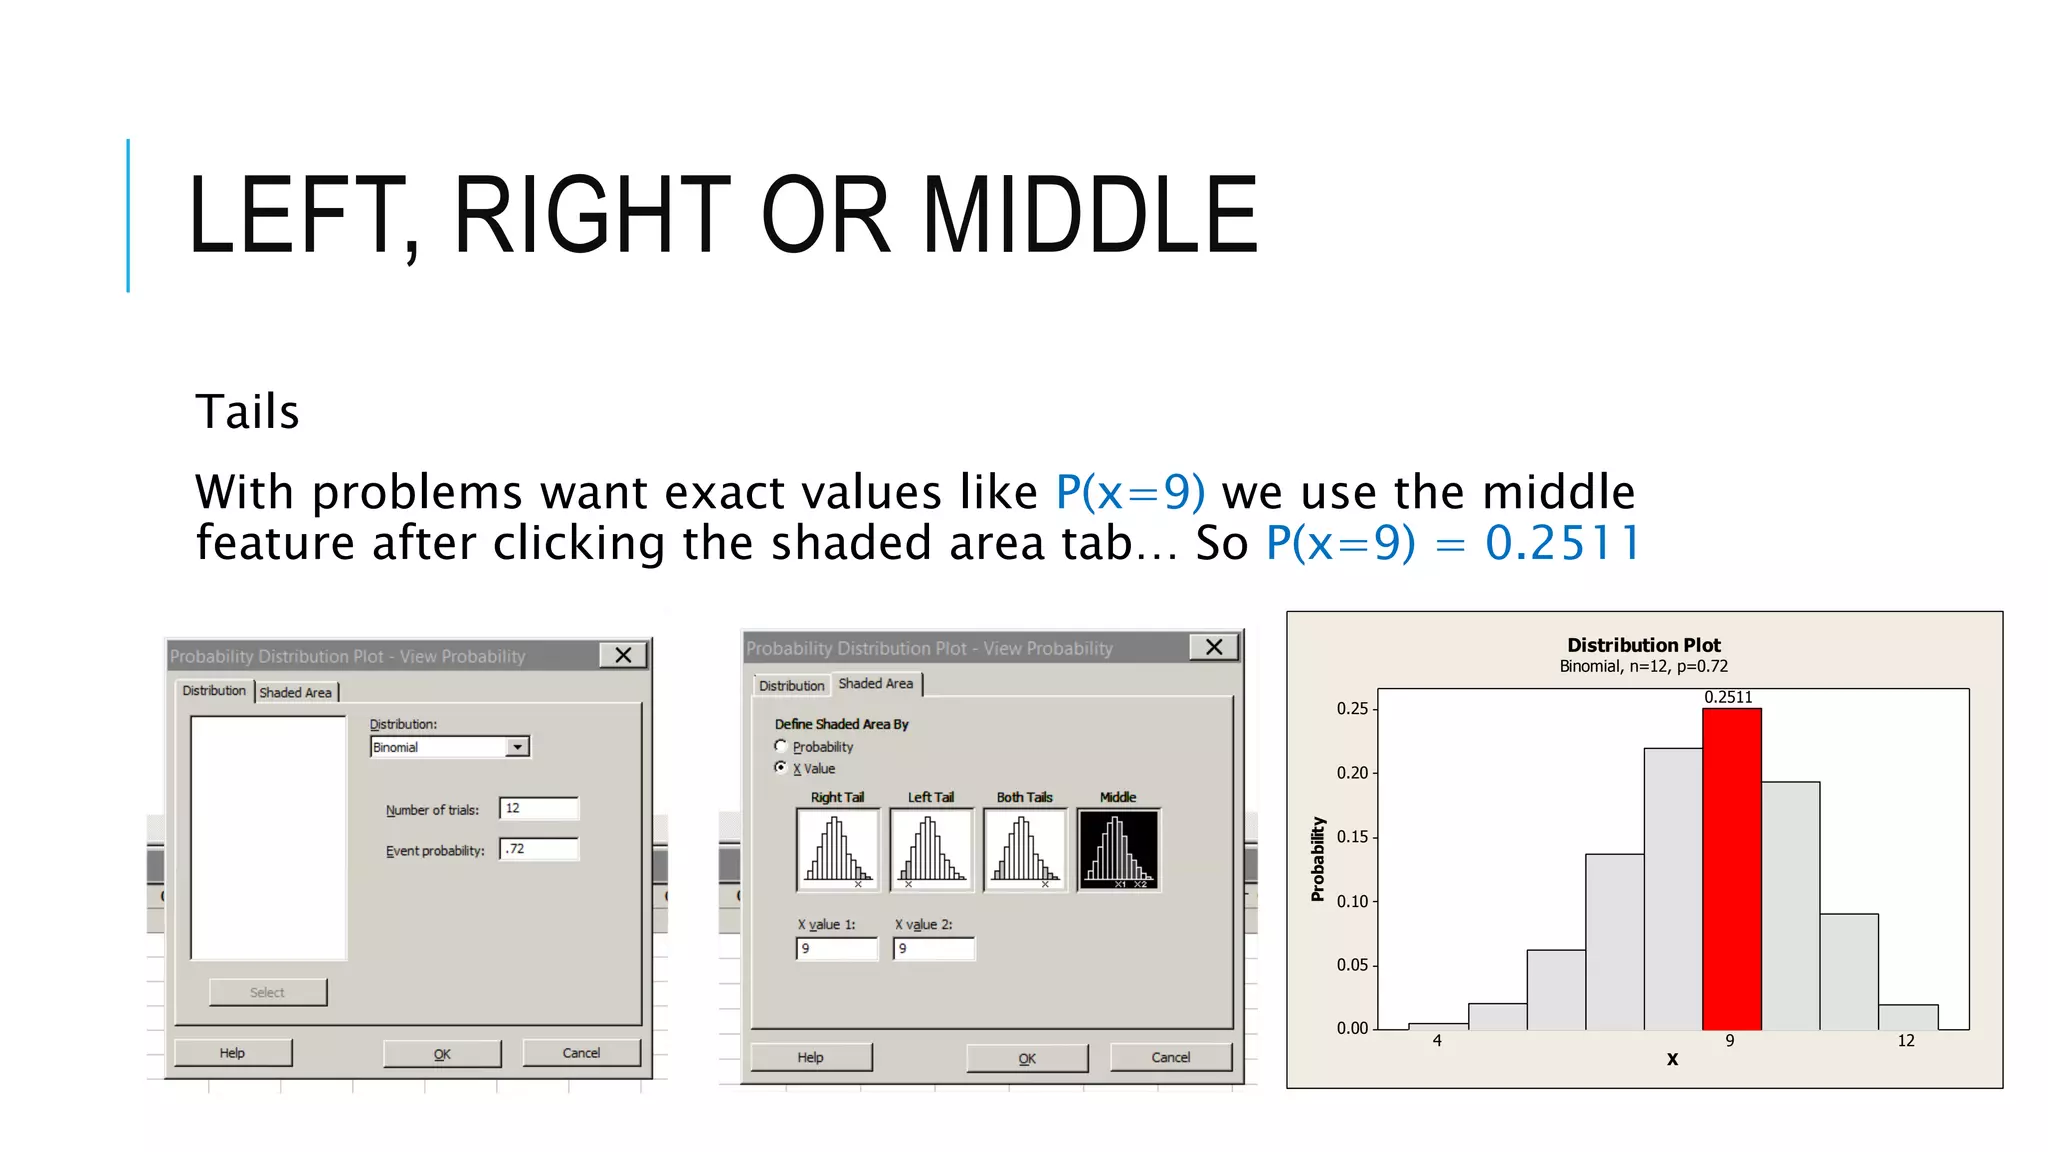

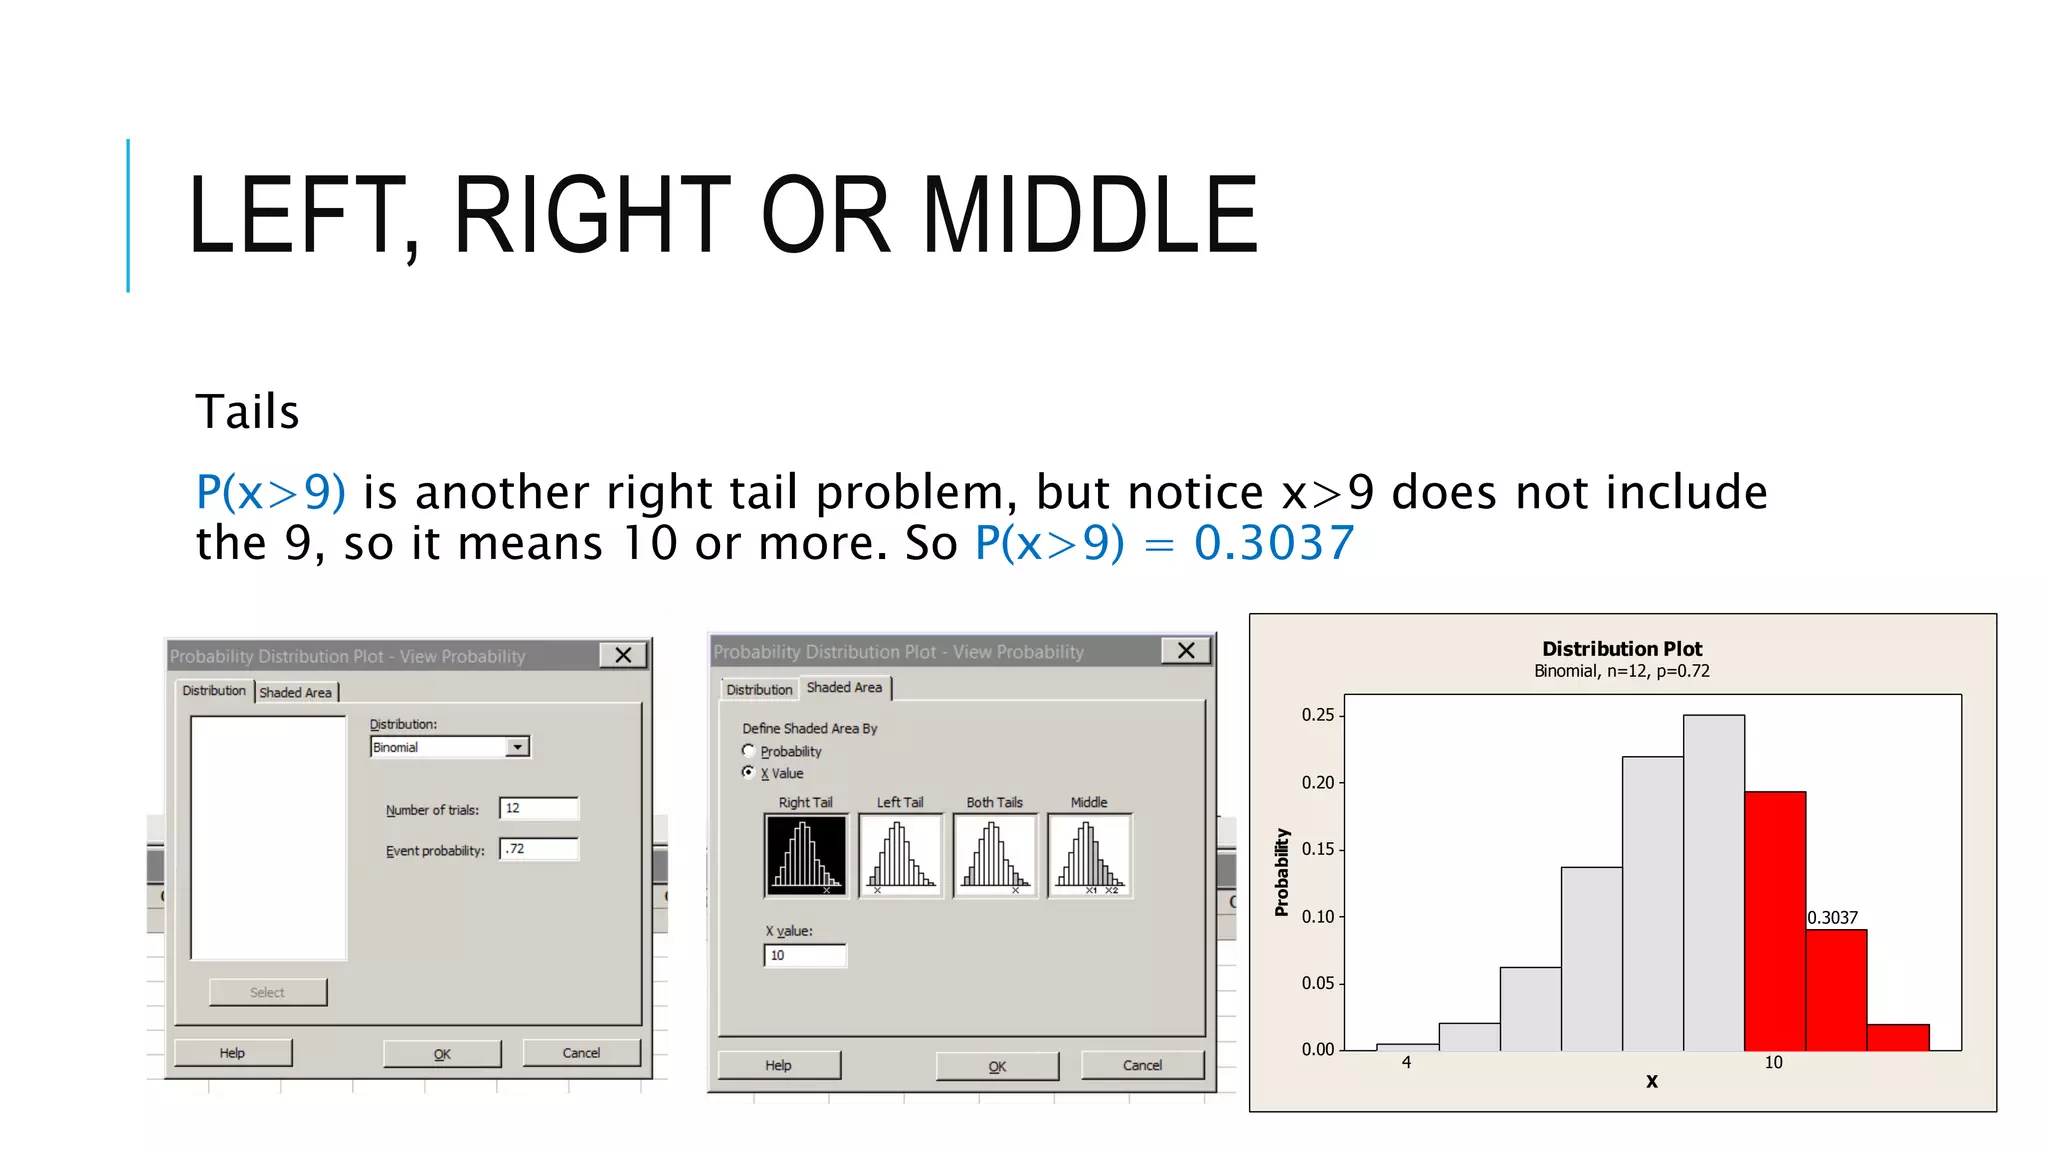

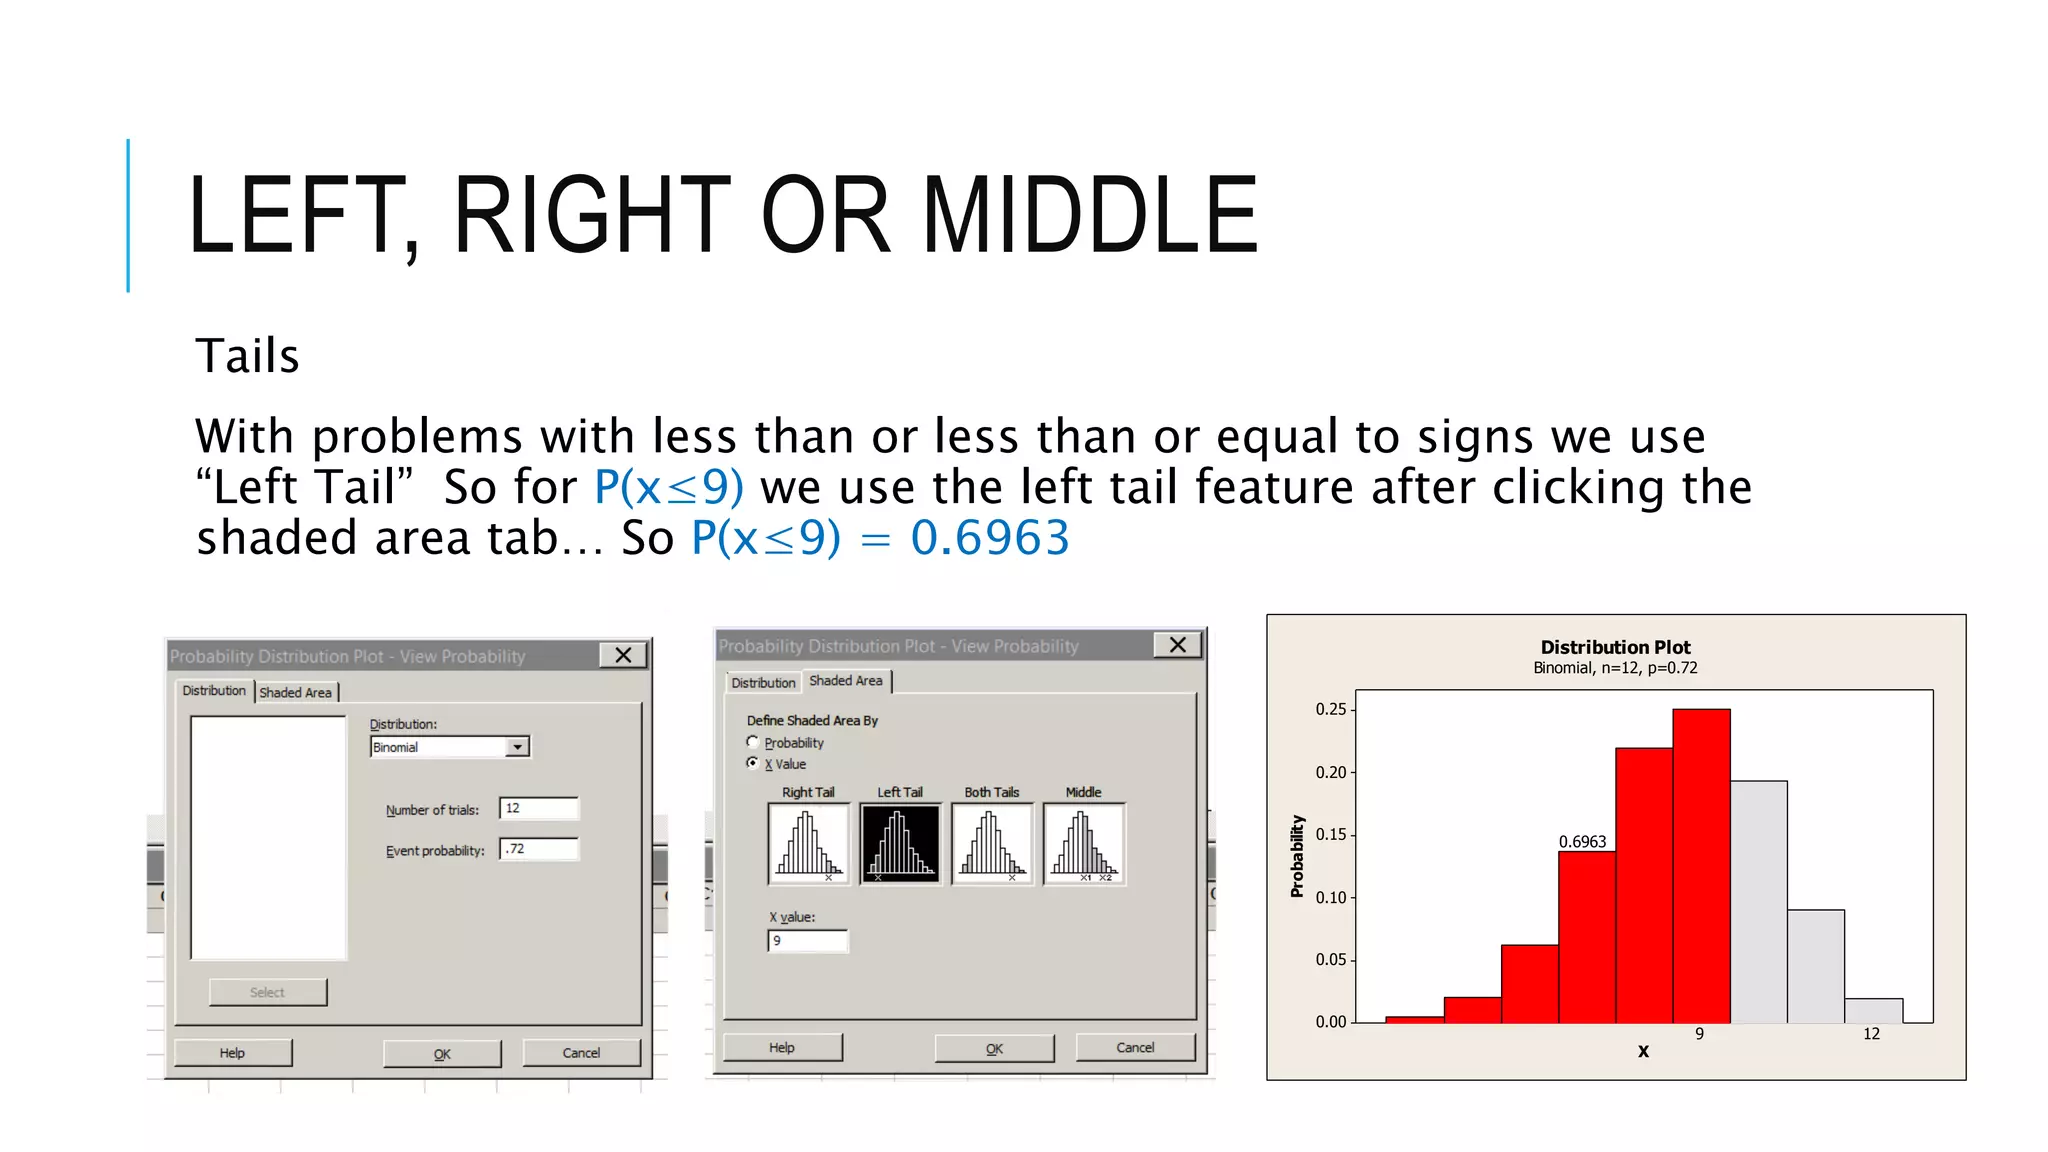
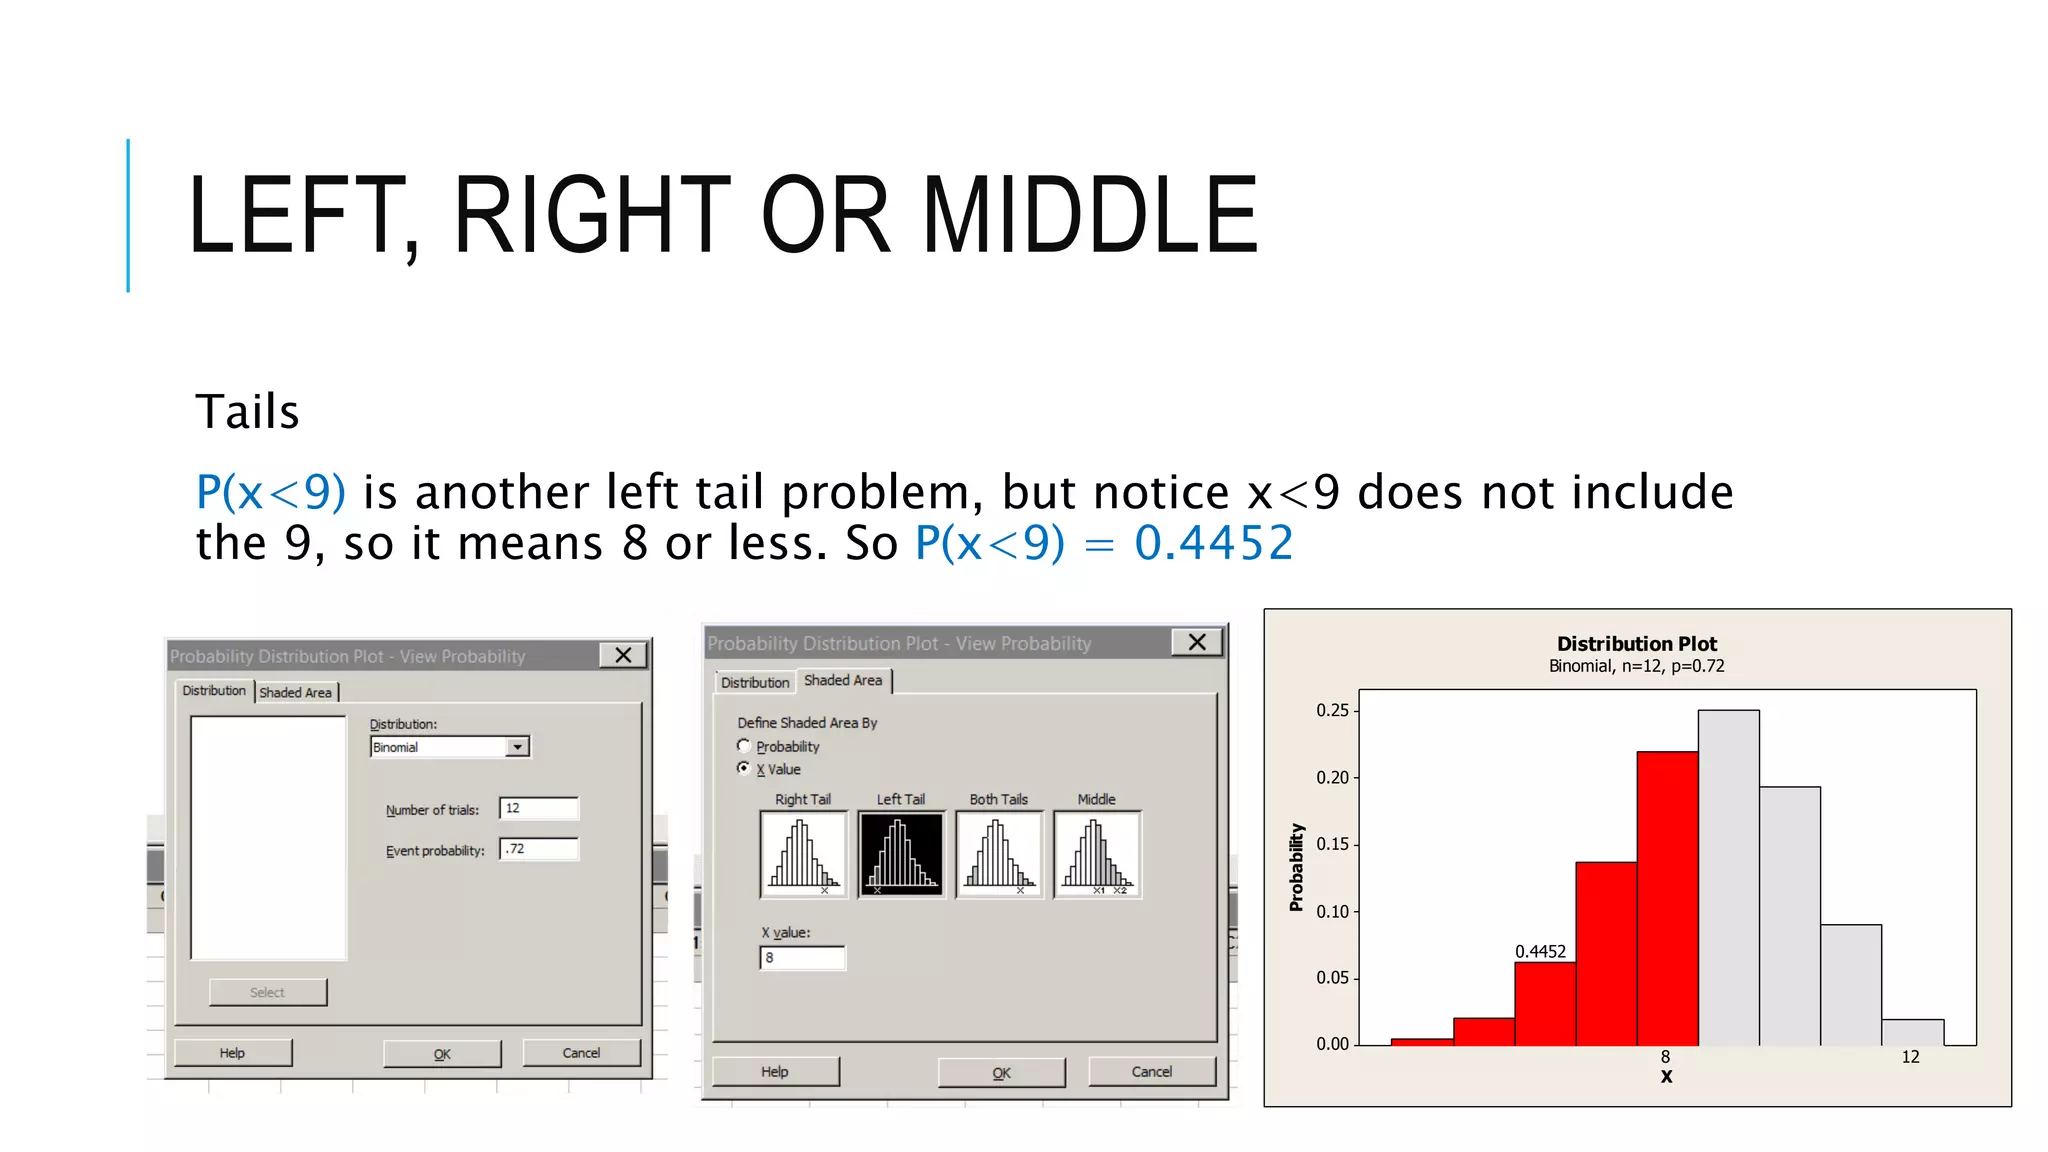
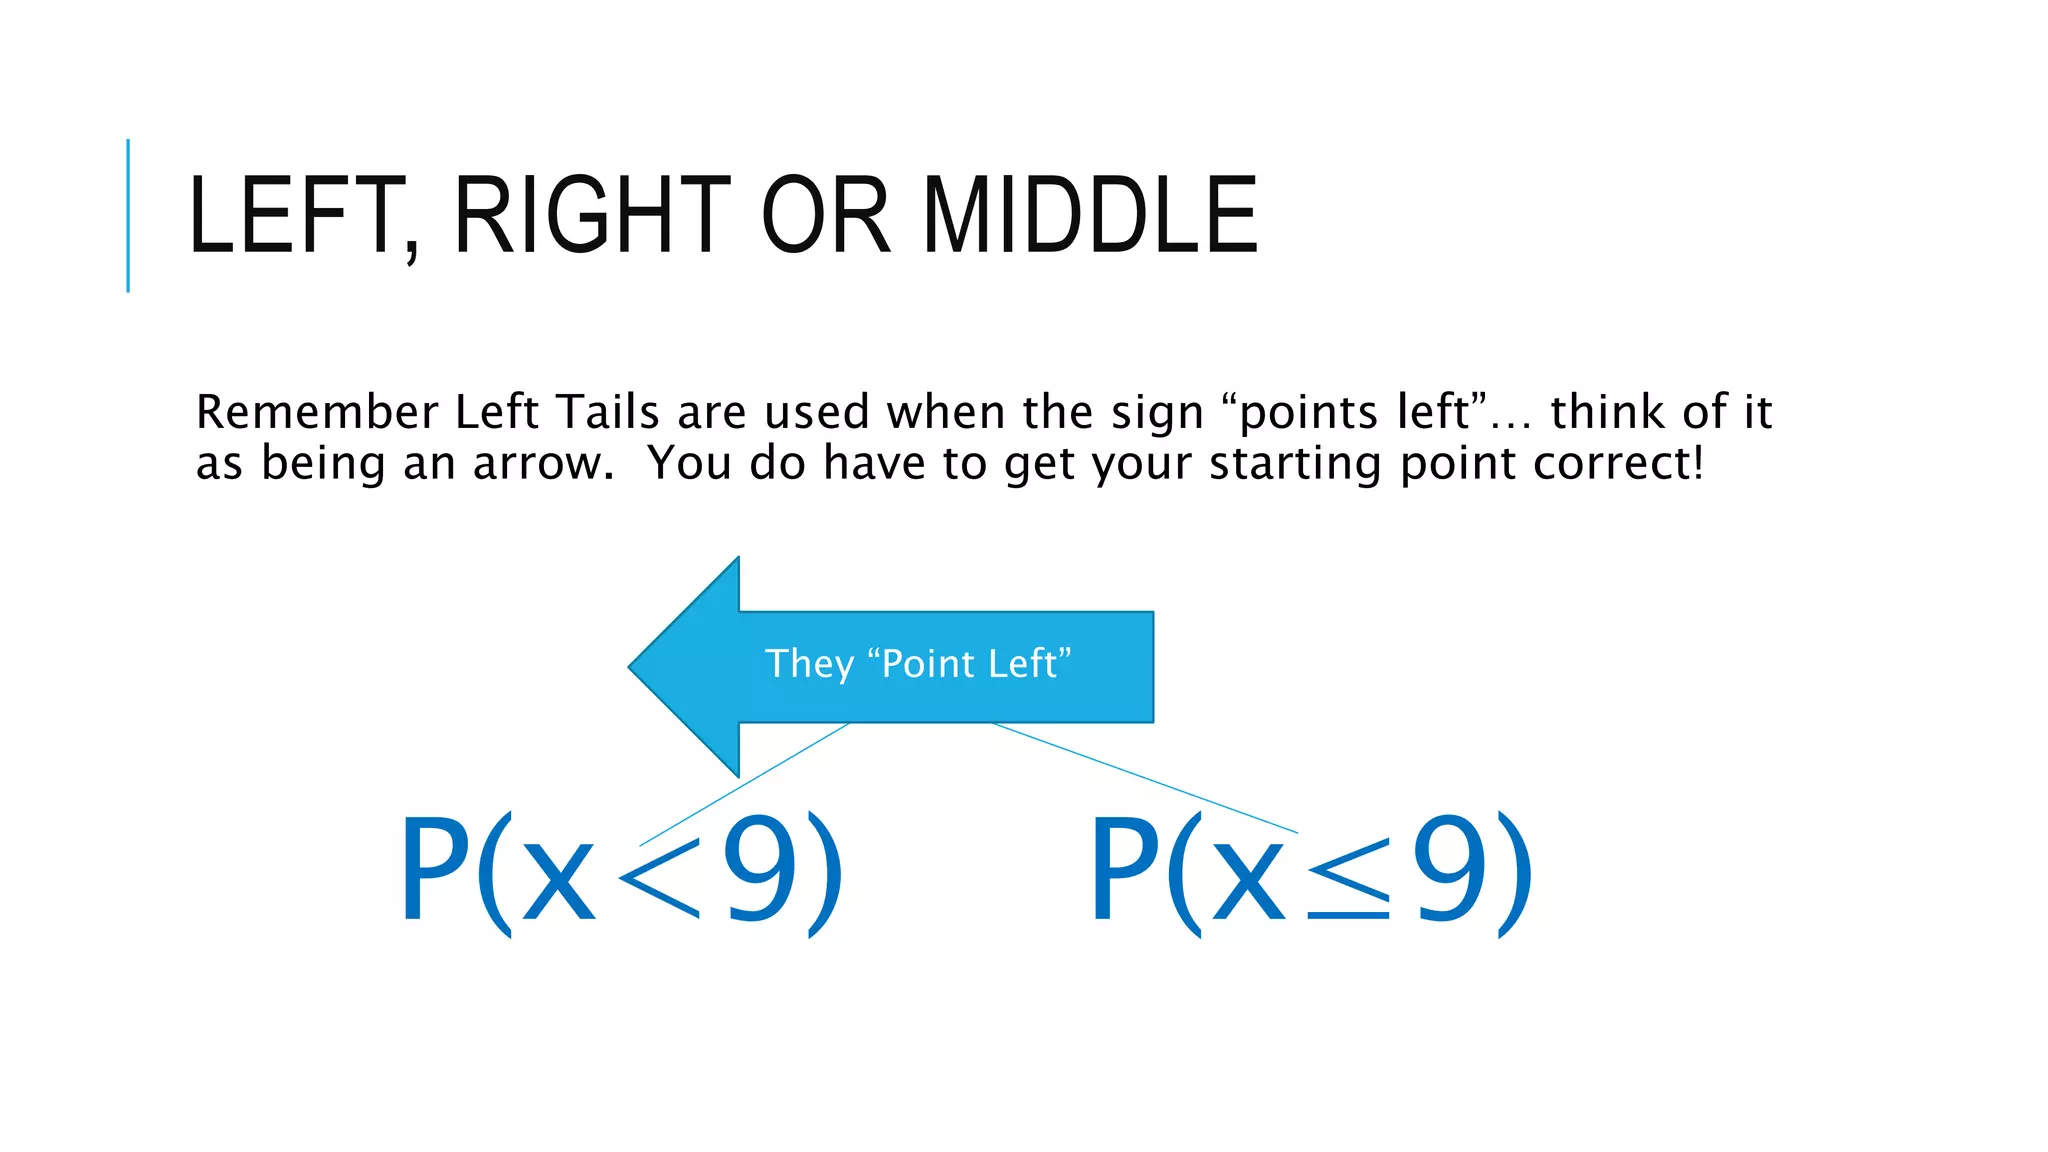

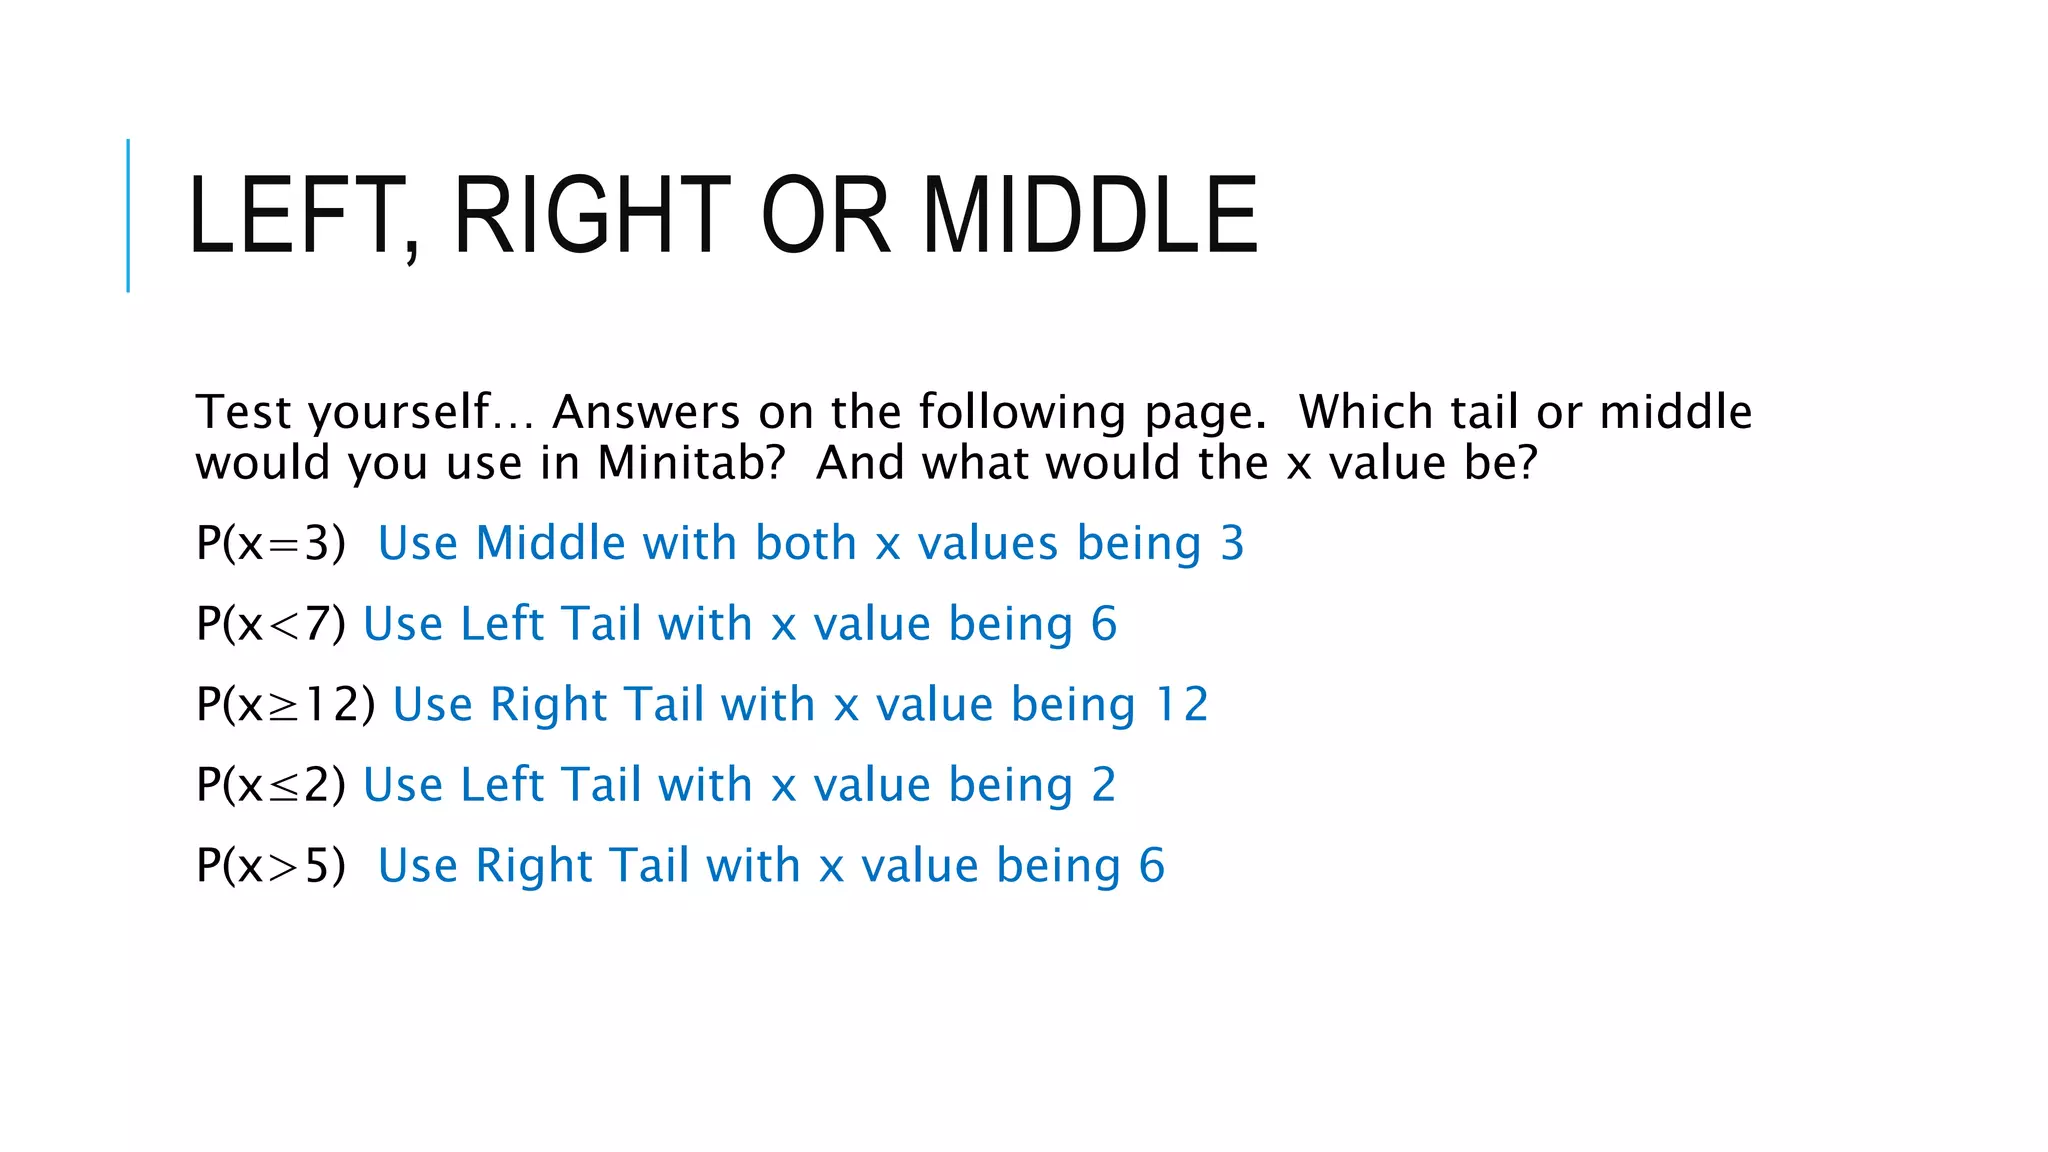
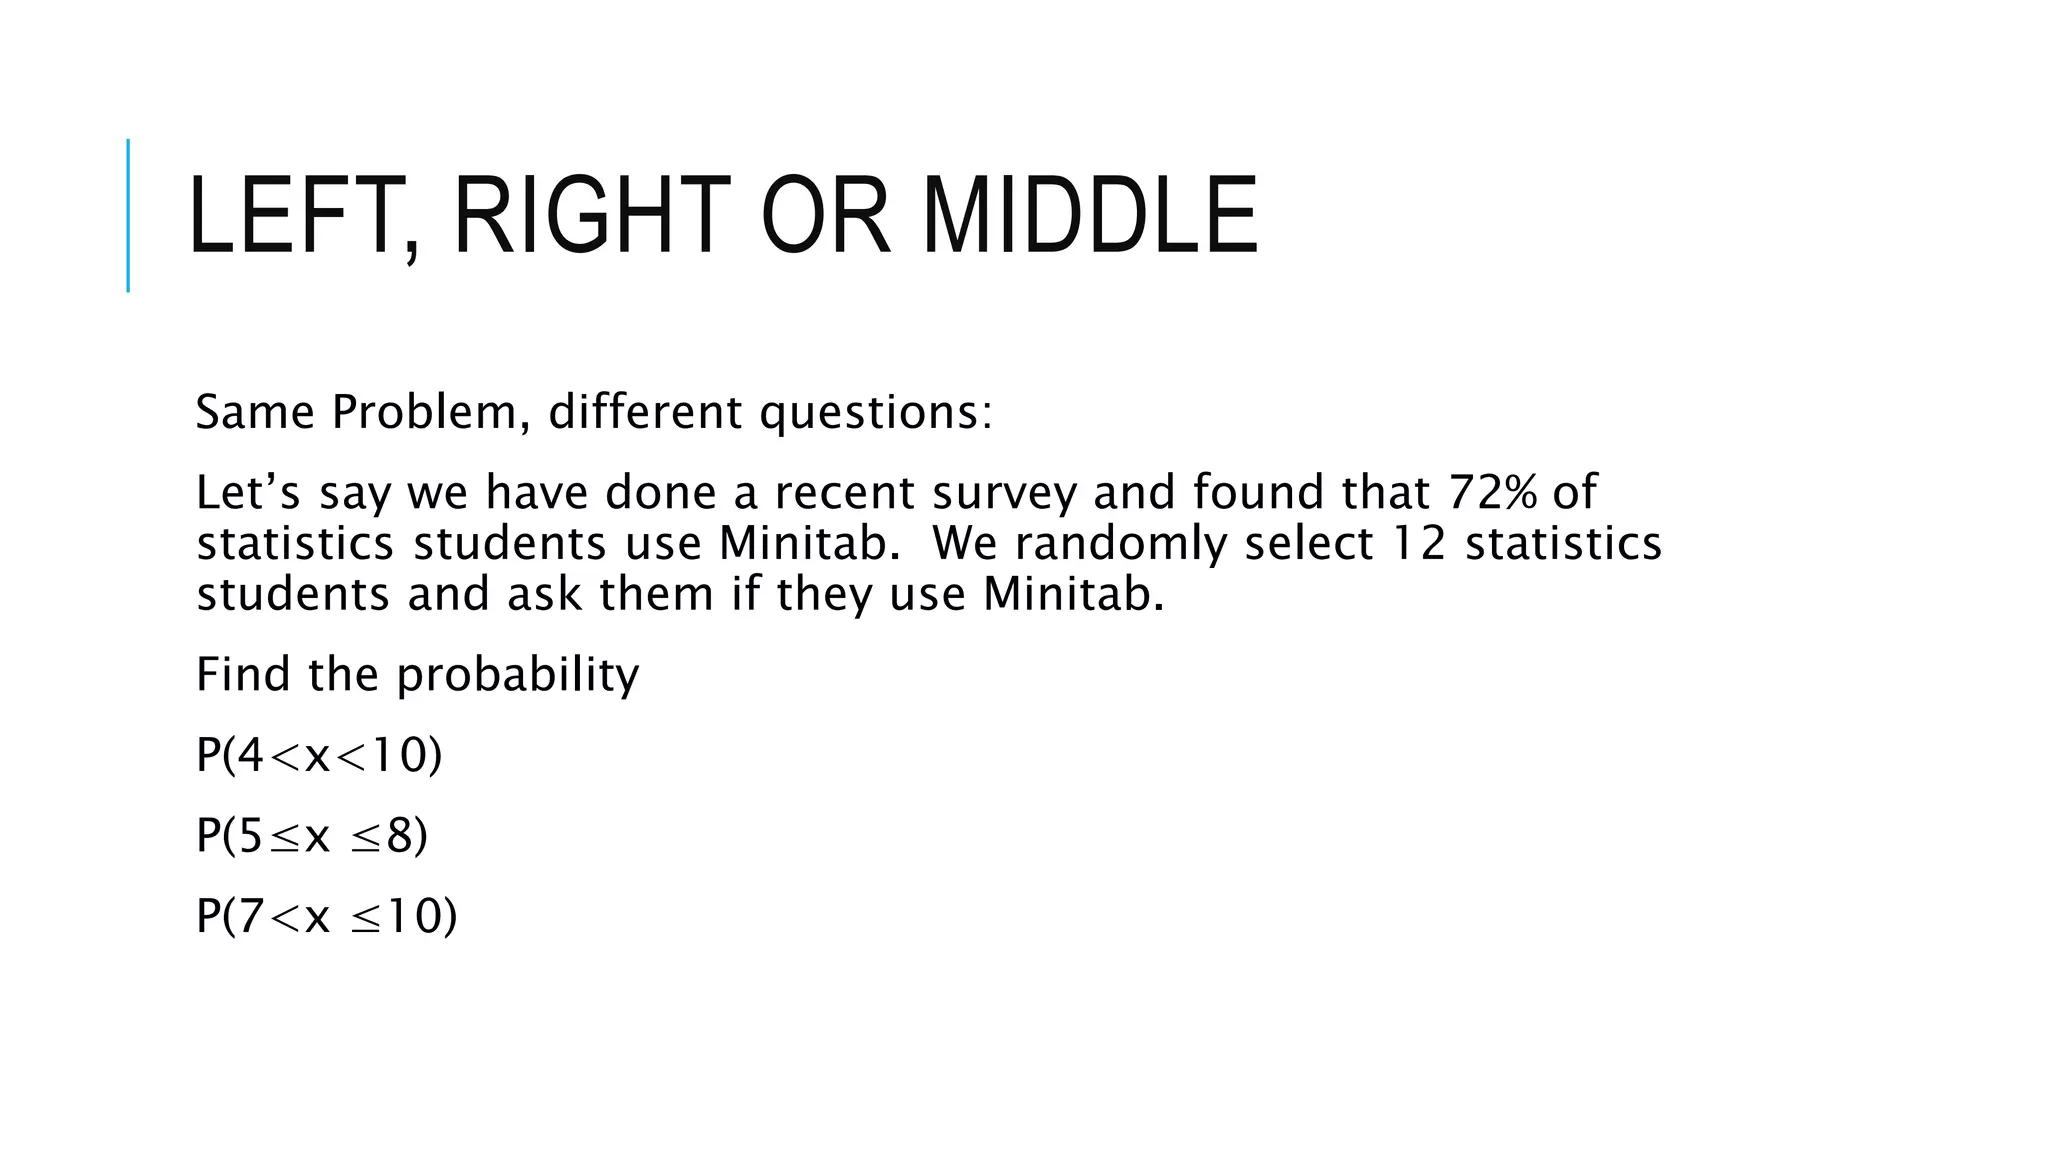
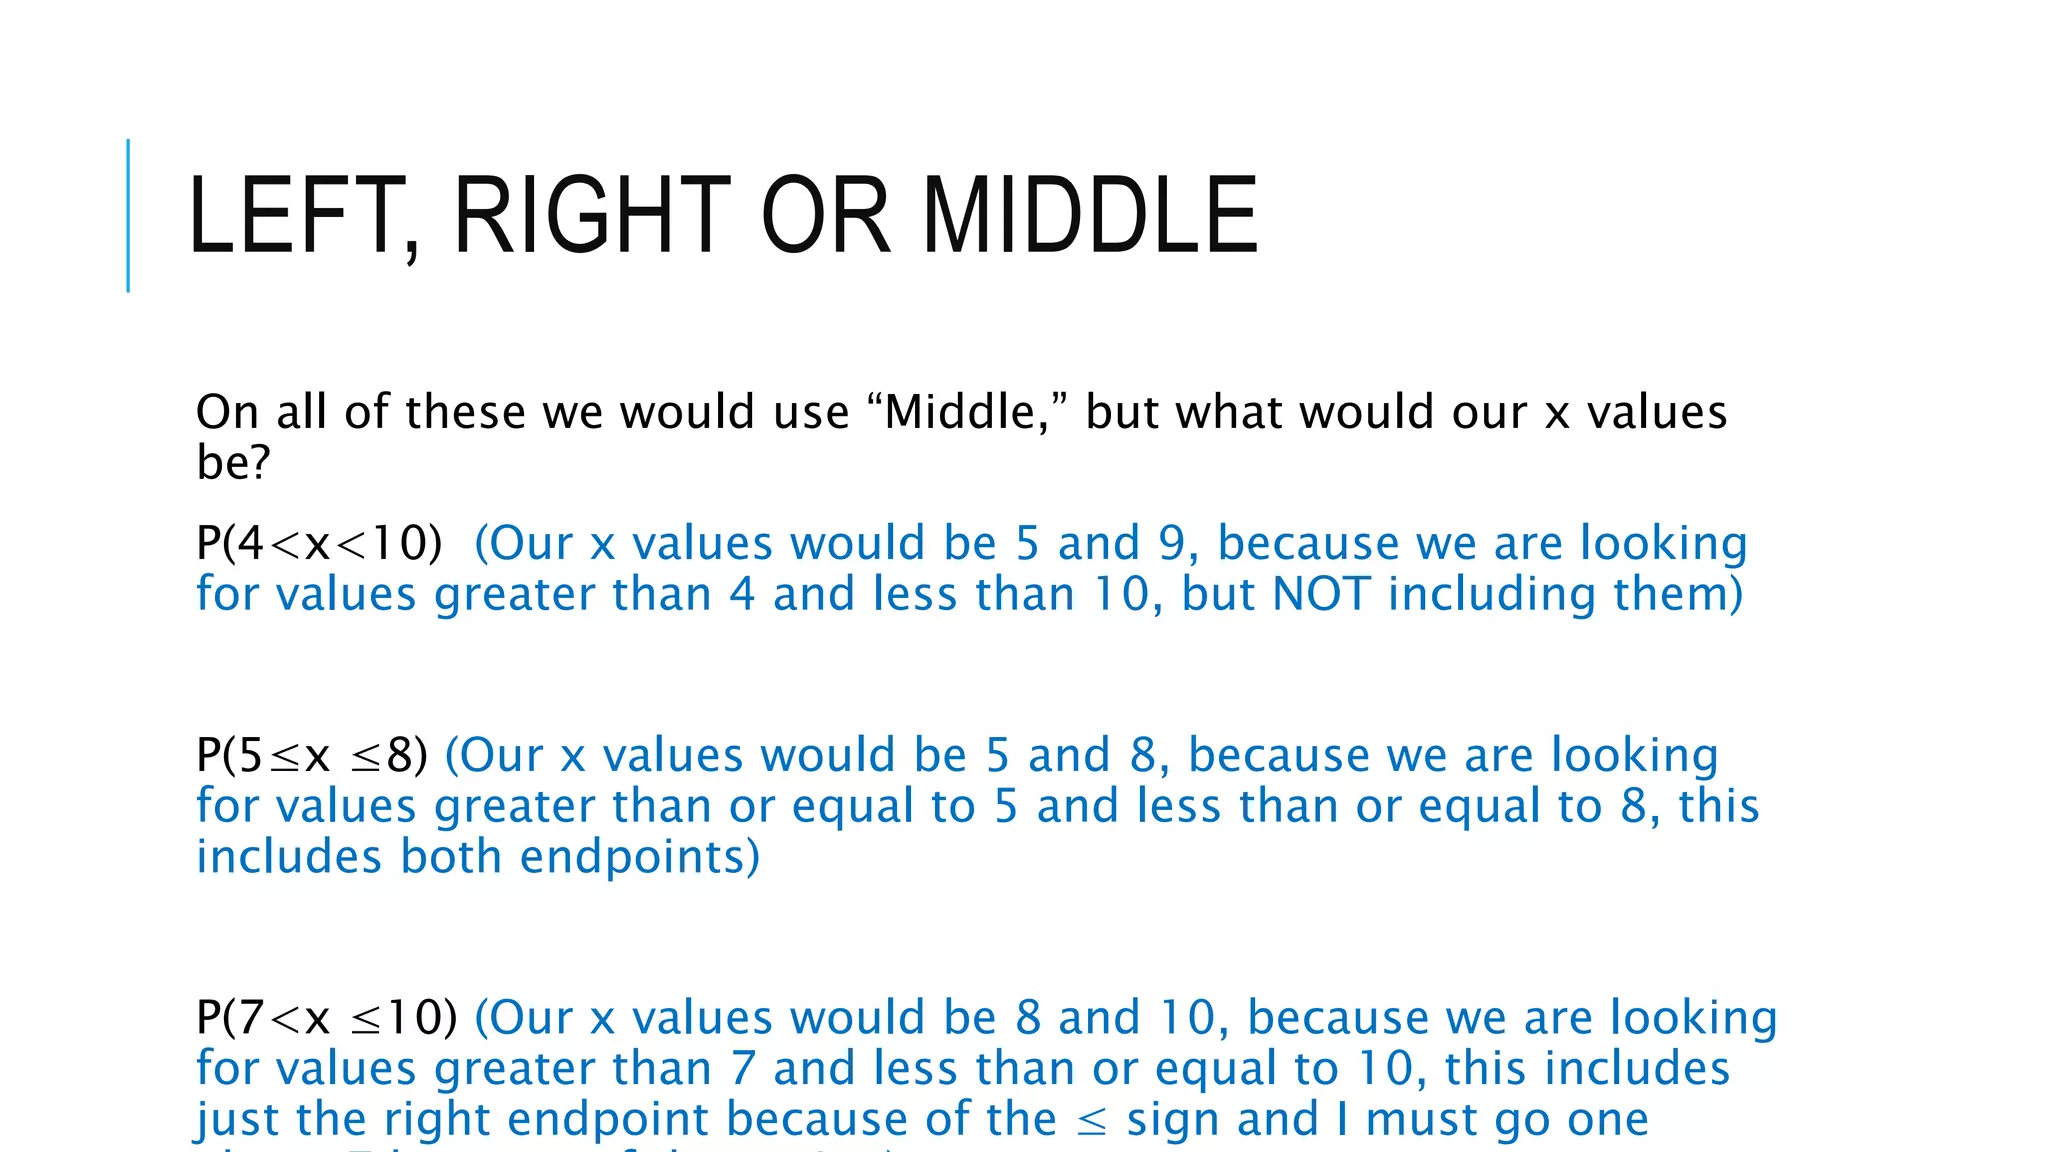
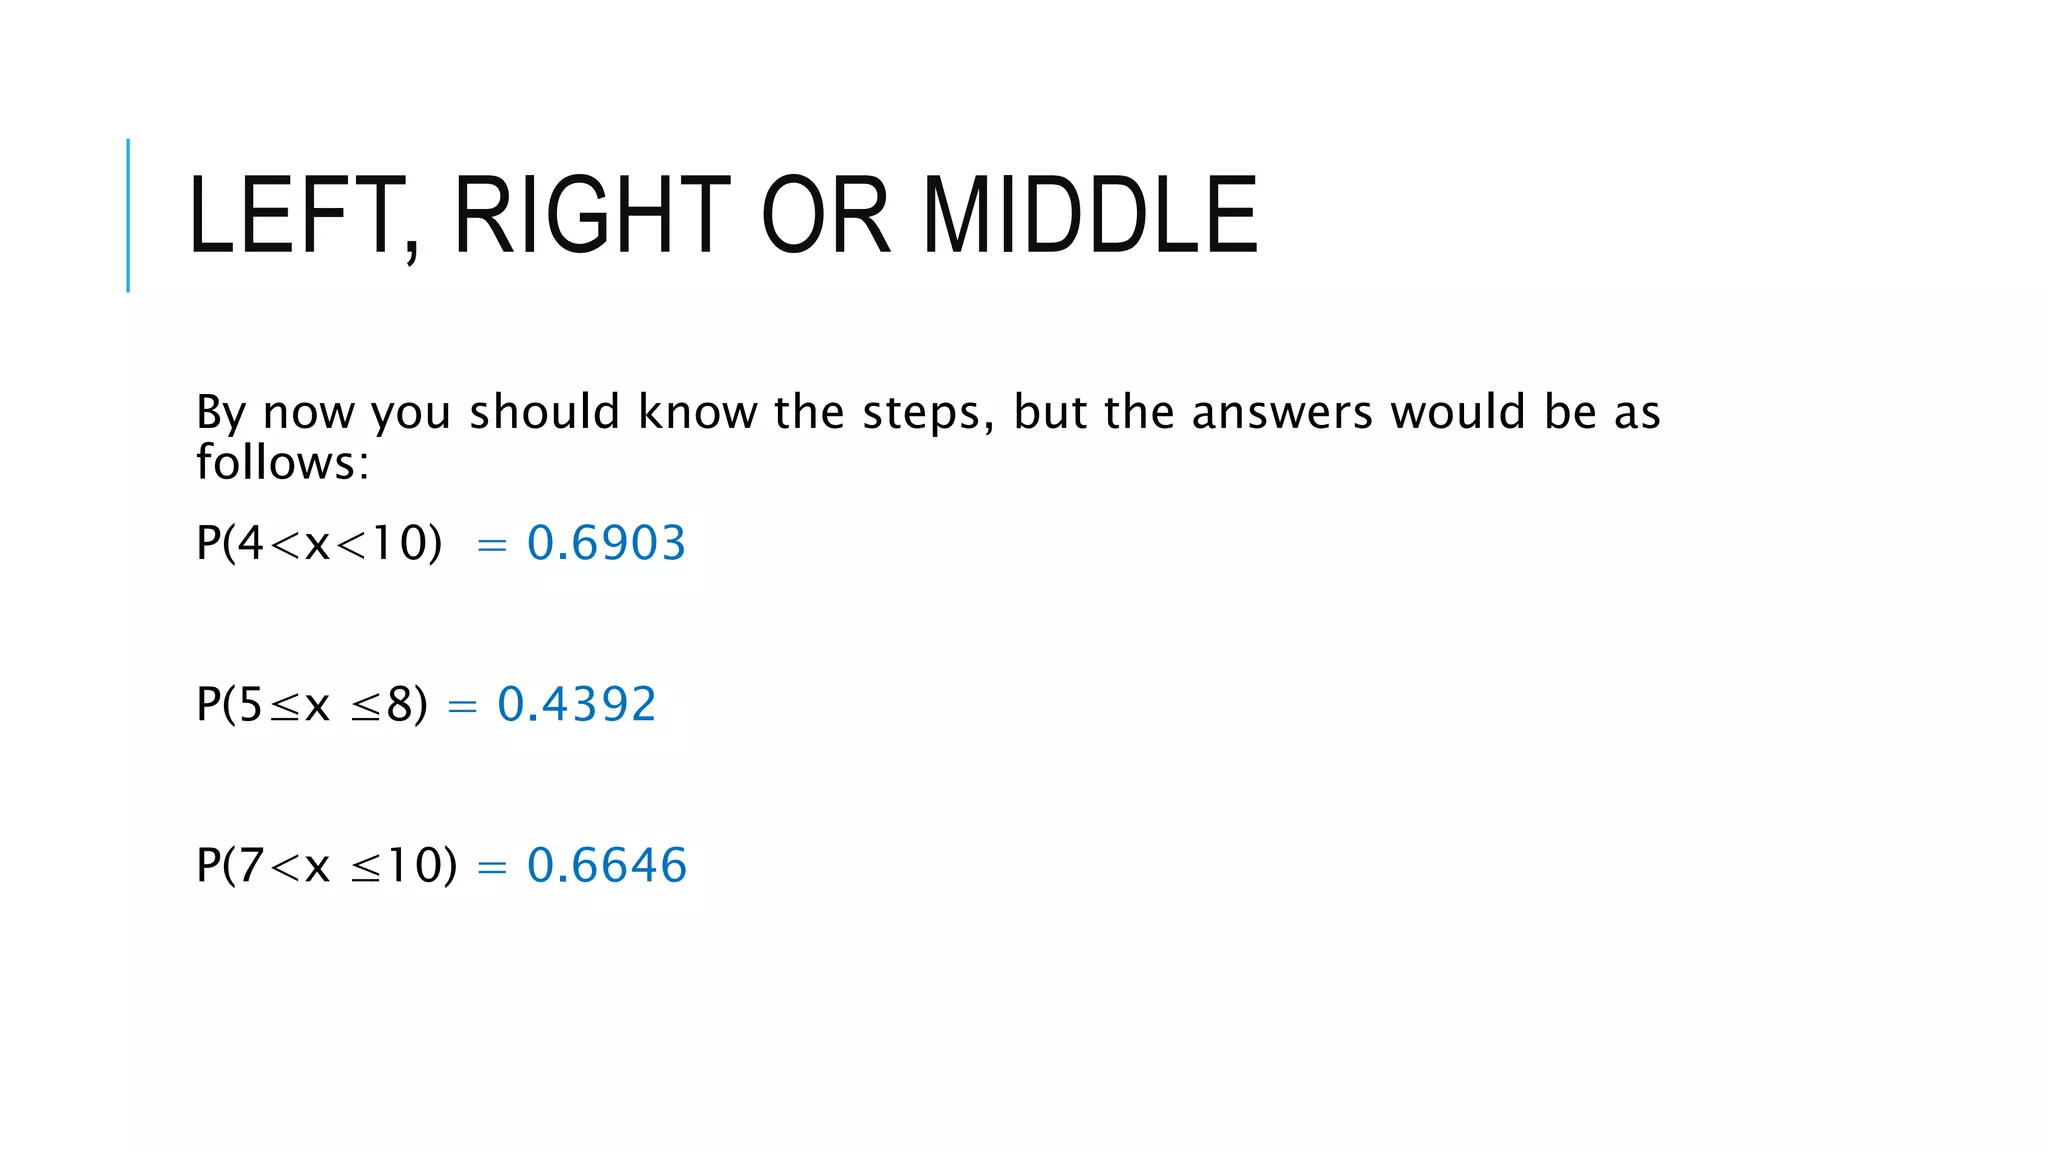
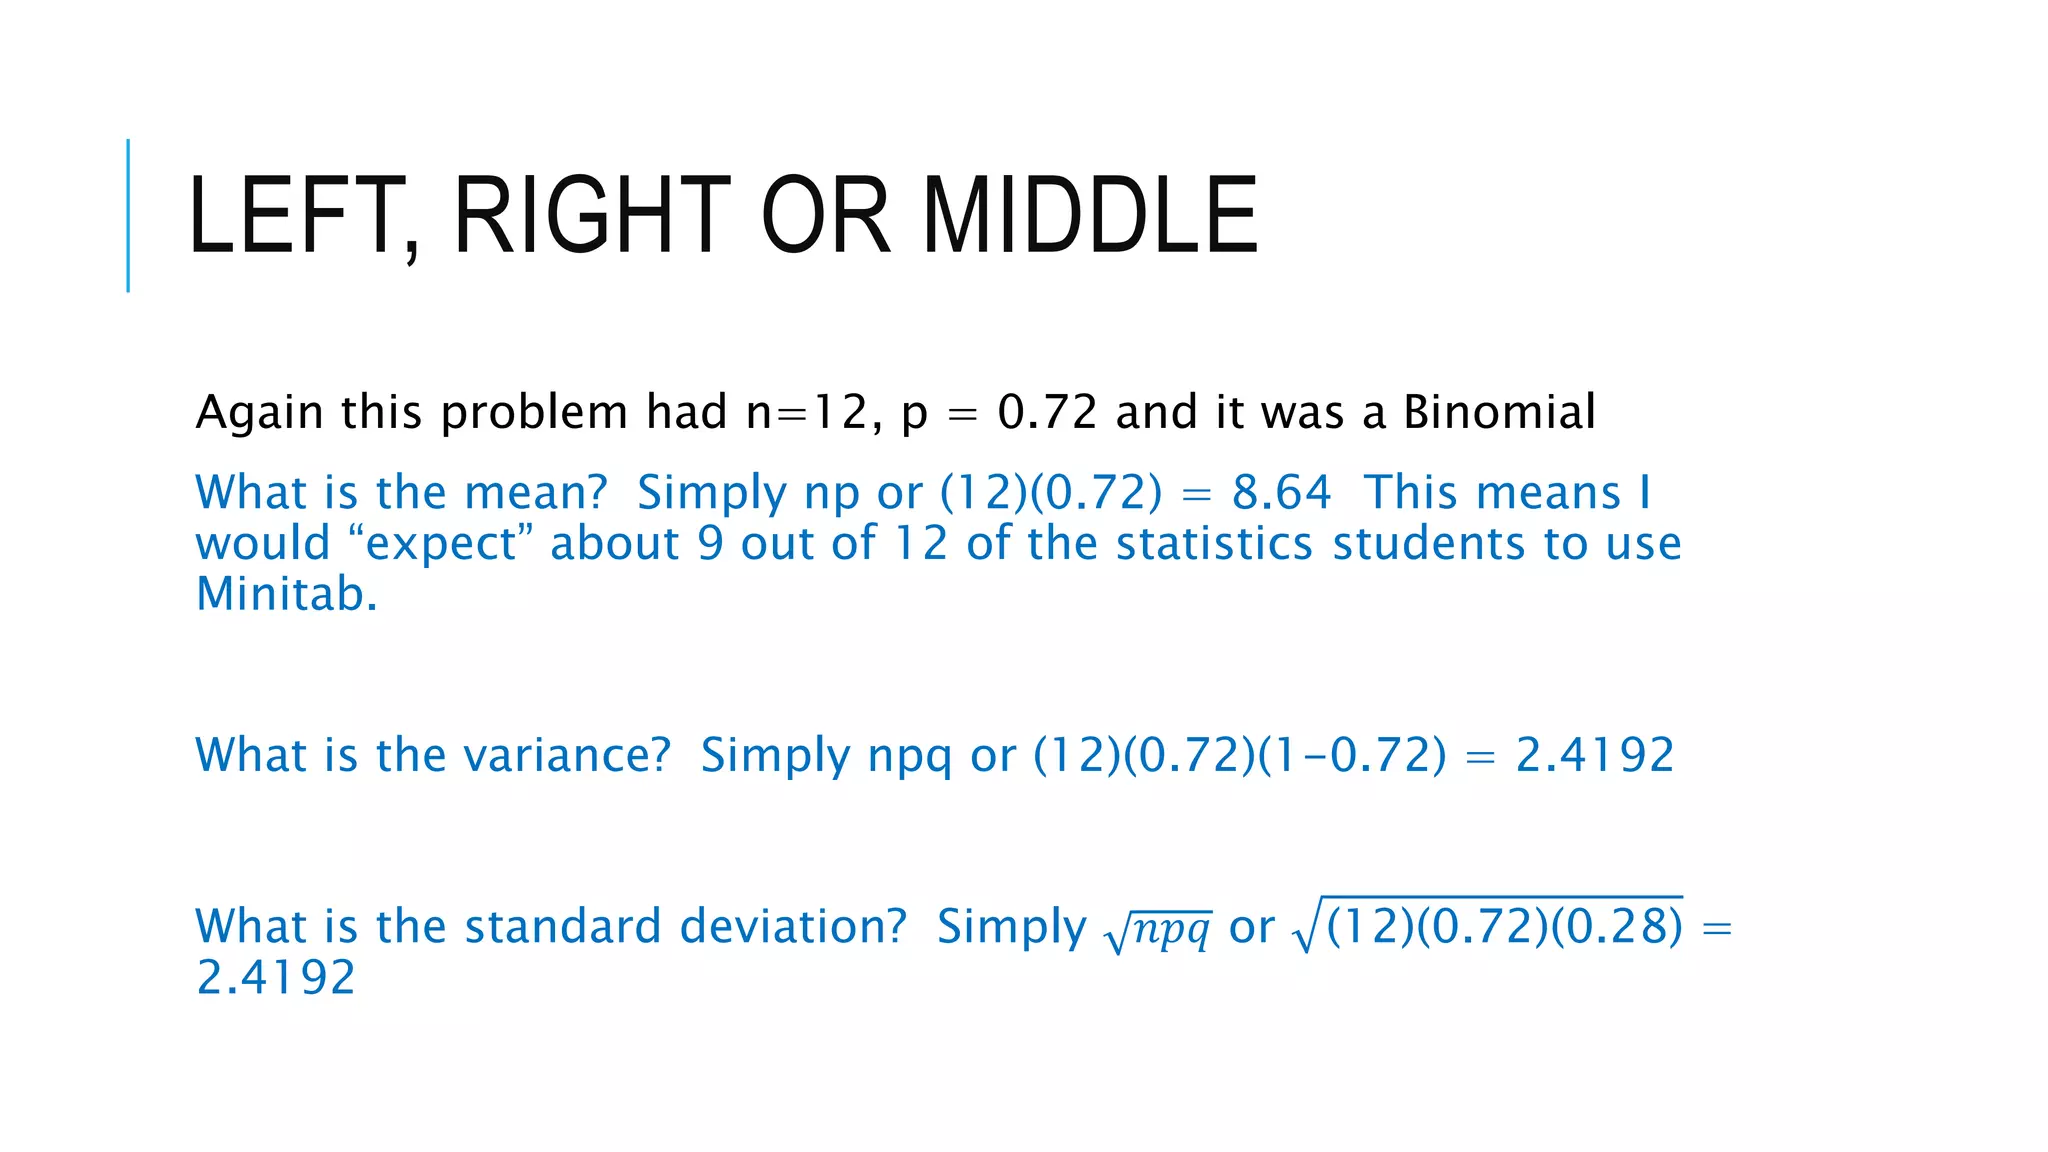
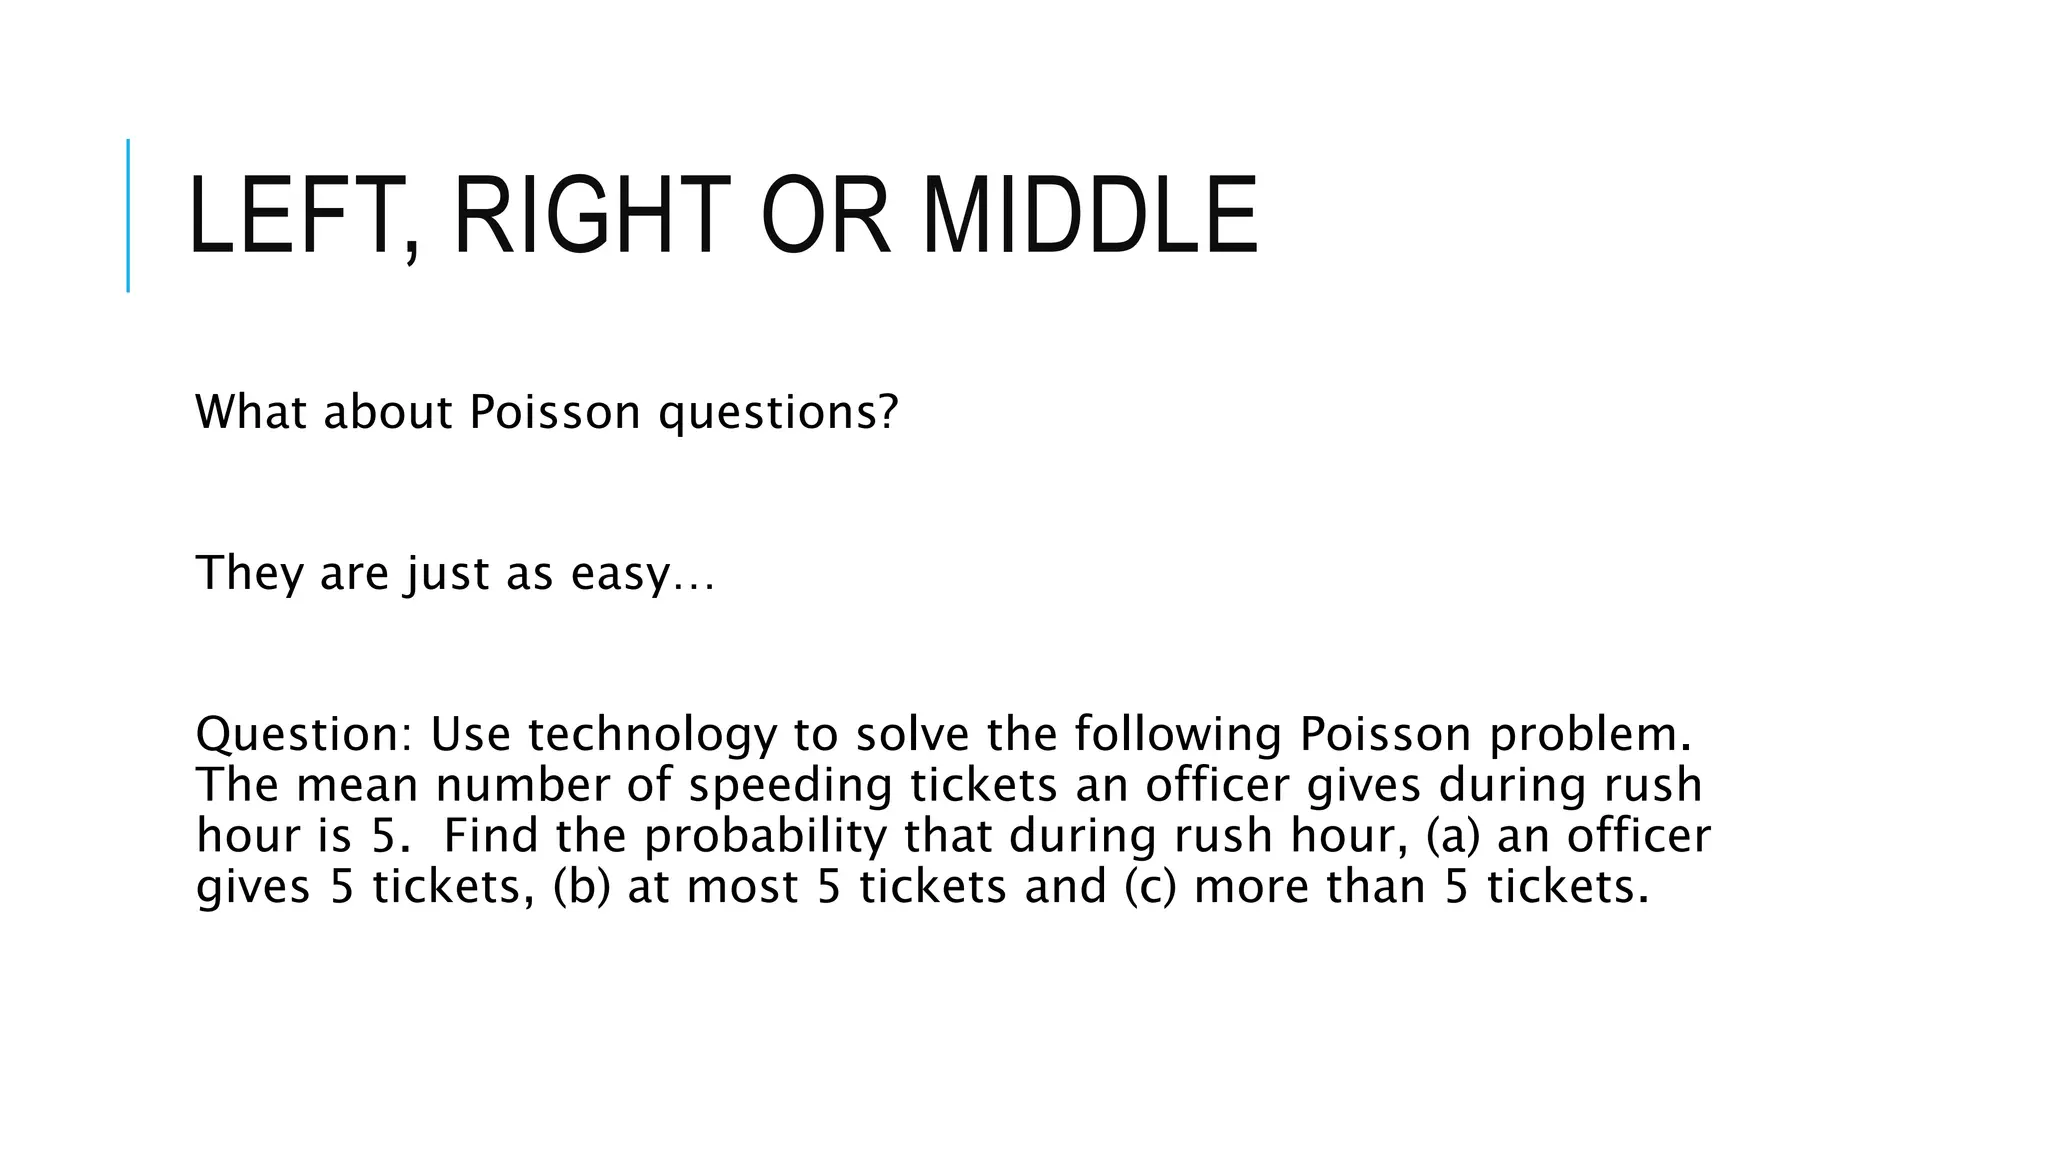
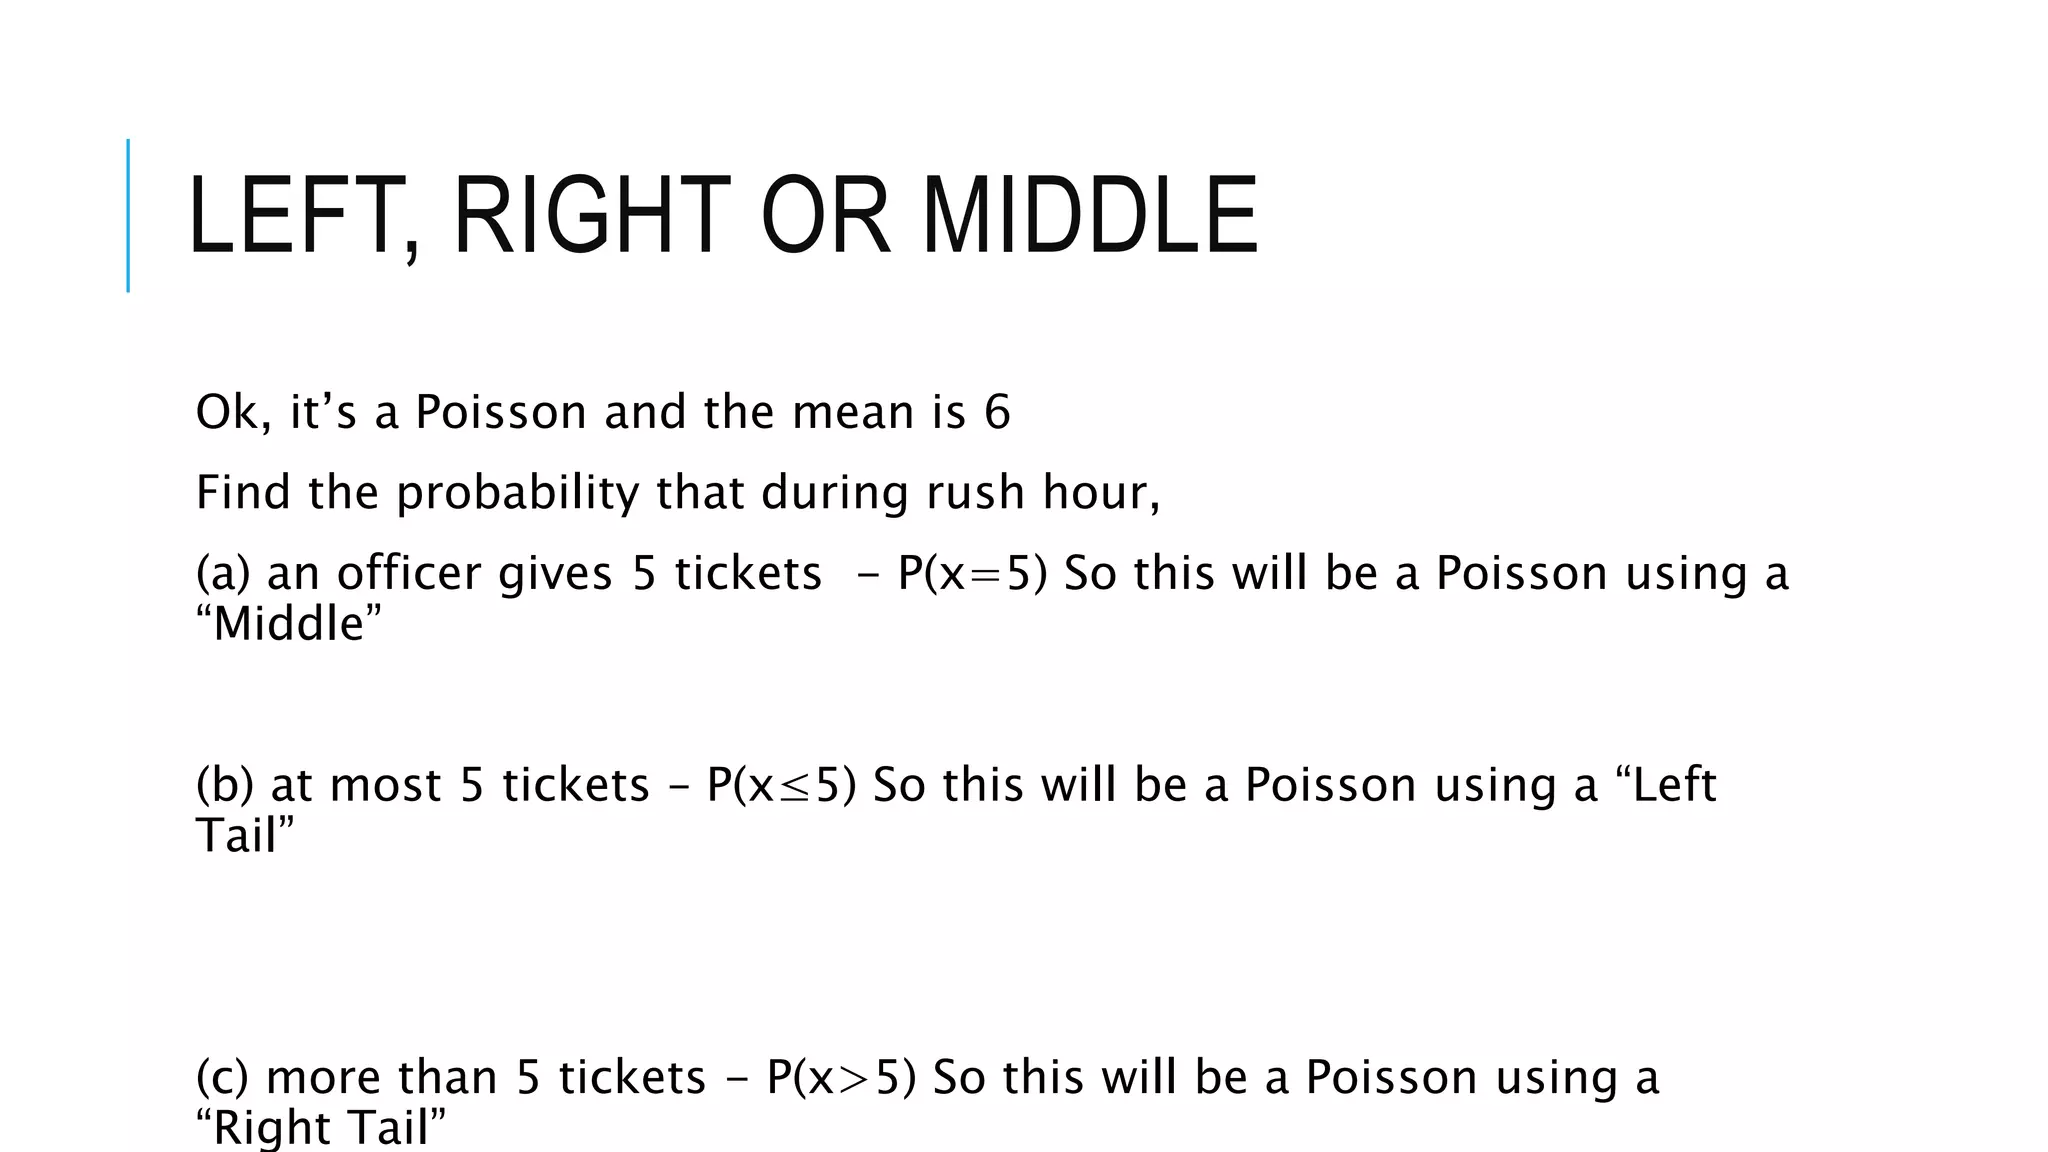
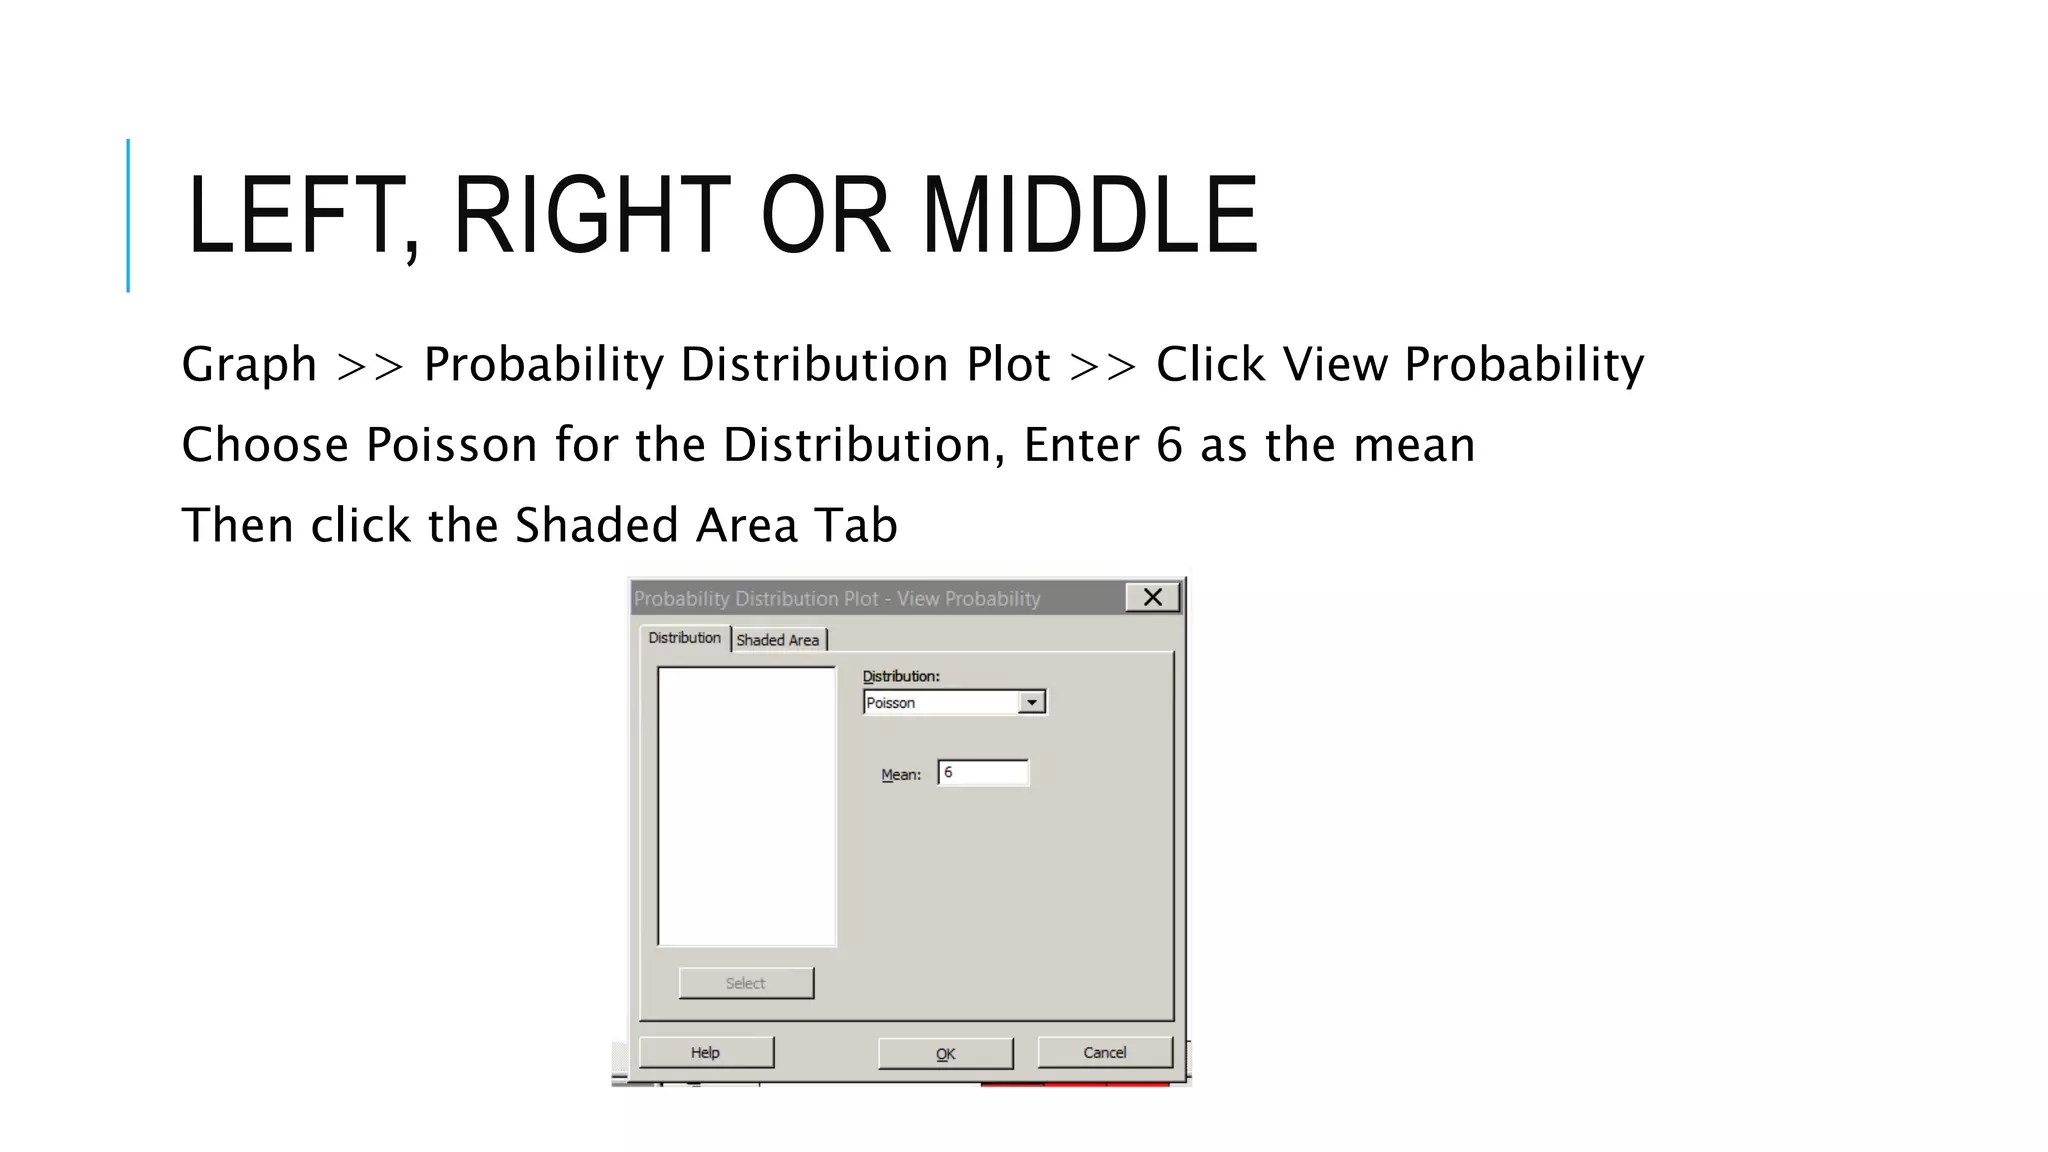

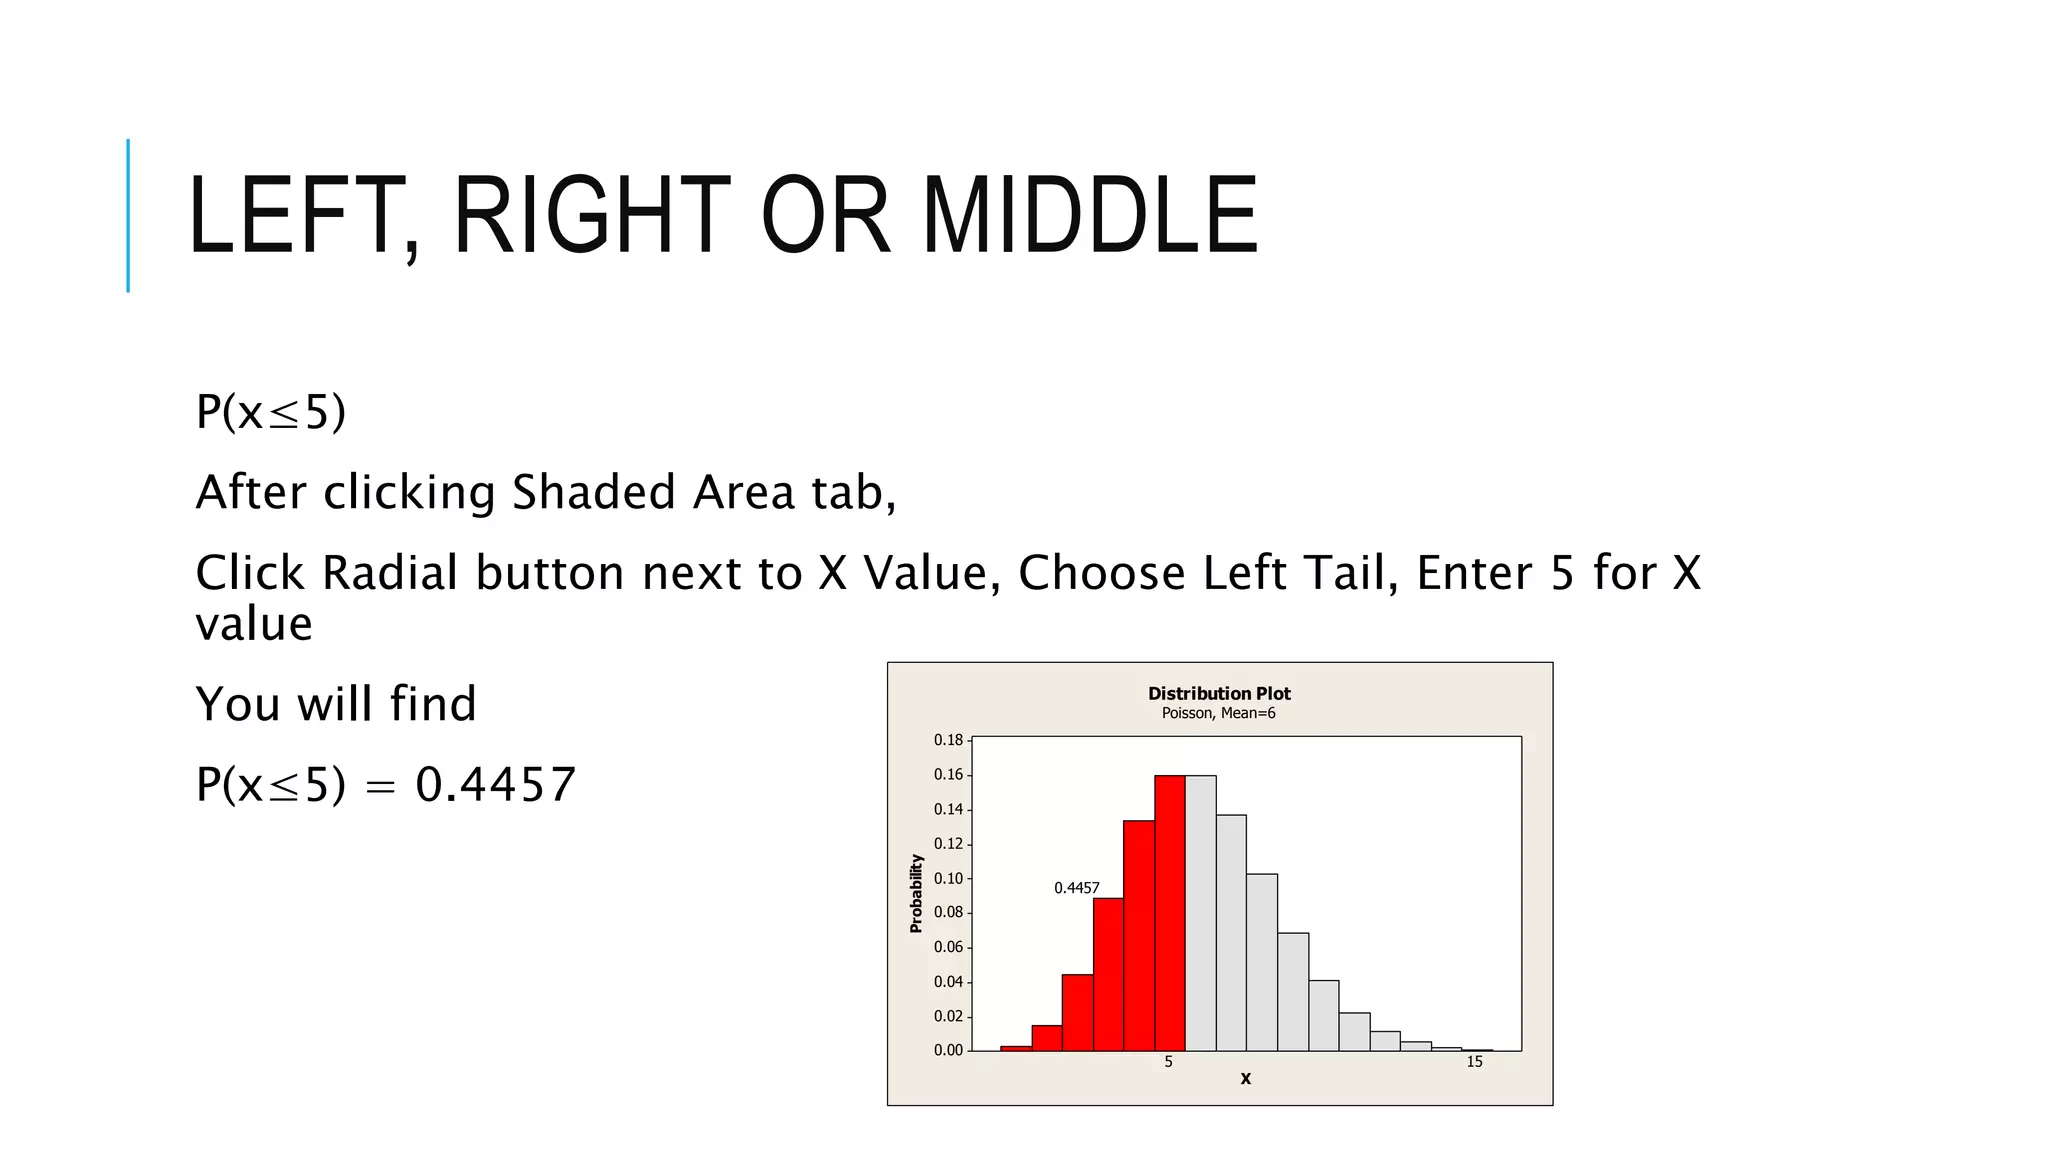
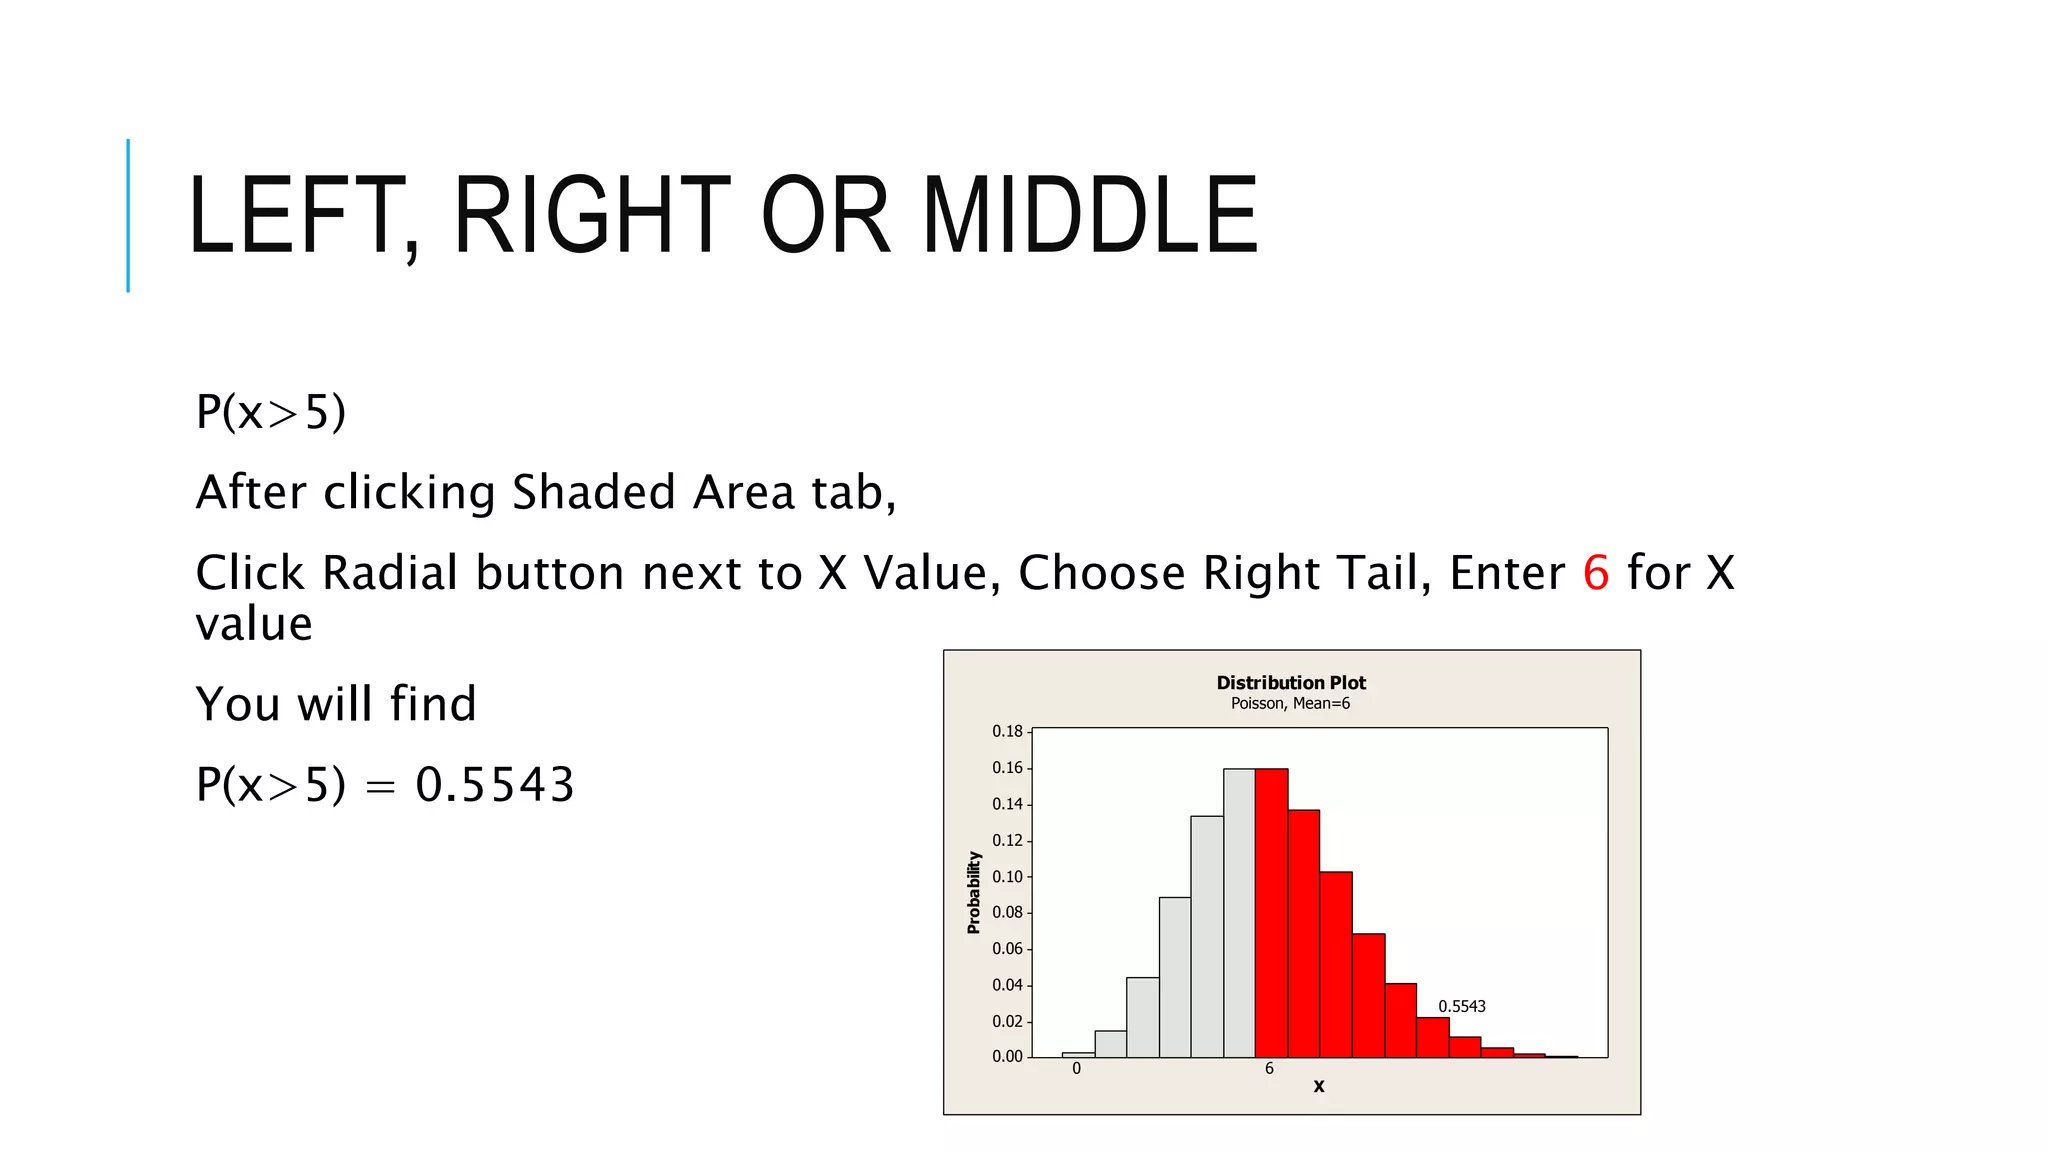


The document provides a comprehensive explanation of using Minitab to analyze probability distributions, including binomial, Poisson, and geometric distributions. It discusses the concept of left, right, and middle tails in relation to probability calculations and their respective formulas, using examples from surveys of statistics students. Additionally, it includes detailed steps for finding probabilities and statistical measures such as mean, variance, and standard deviation related to different scenarios.


![Week7 Quiz Help 2009[1]](https://cdn.slidesharecdn.com/ss_thumbnails/week7quizhelp20091-091012152329-phpapp02-thumbnail.jpg?width=640&height=640&fit=bounds)


![Cmmi hm 2008 sepg model changes for high maturity 1v01[1]](https://cdn.slidesharecdn.com/ss_thumbnails/cmmihm2008sepgmodelchangesforhighmaturity1v011-150525024656-lva1-app6892-thumbnail.jpg?width=640&height=640&fit=bounds)