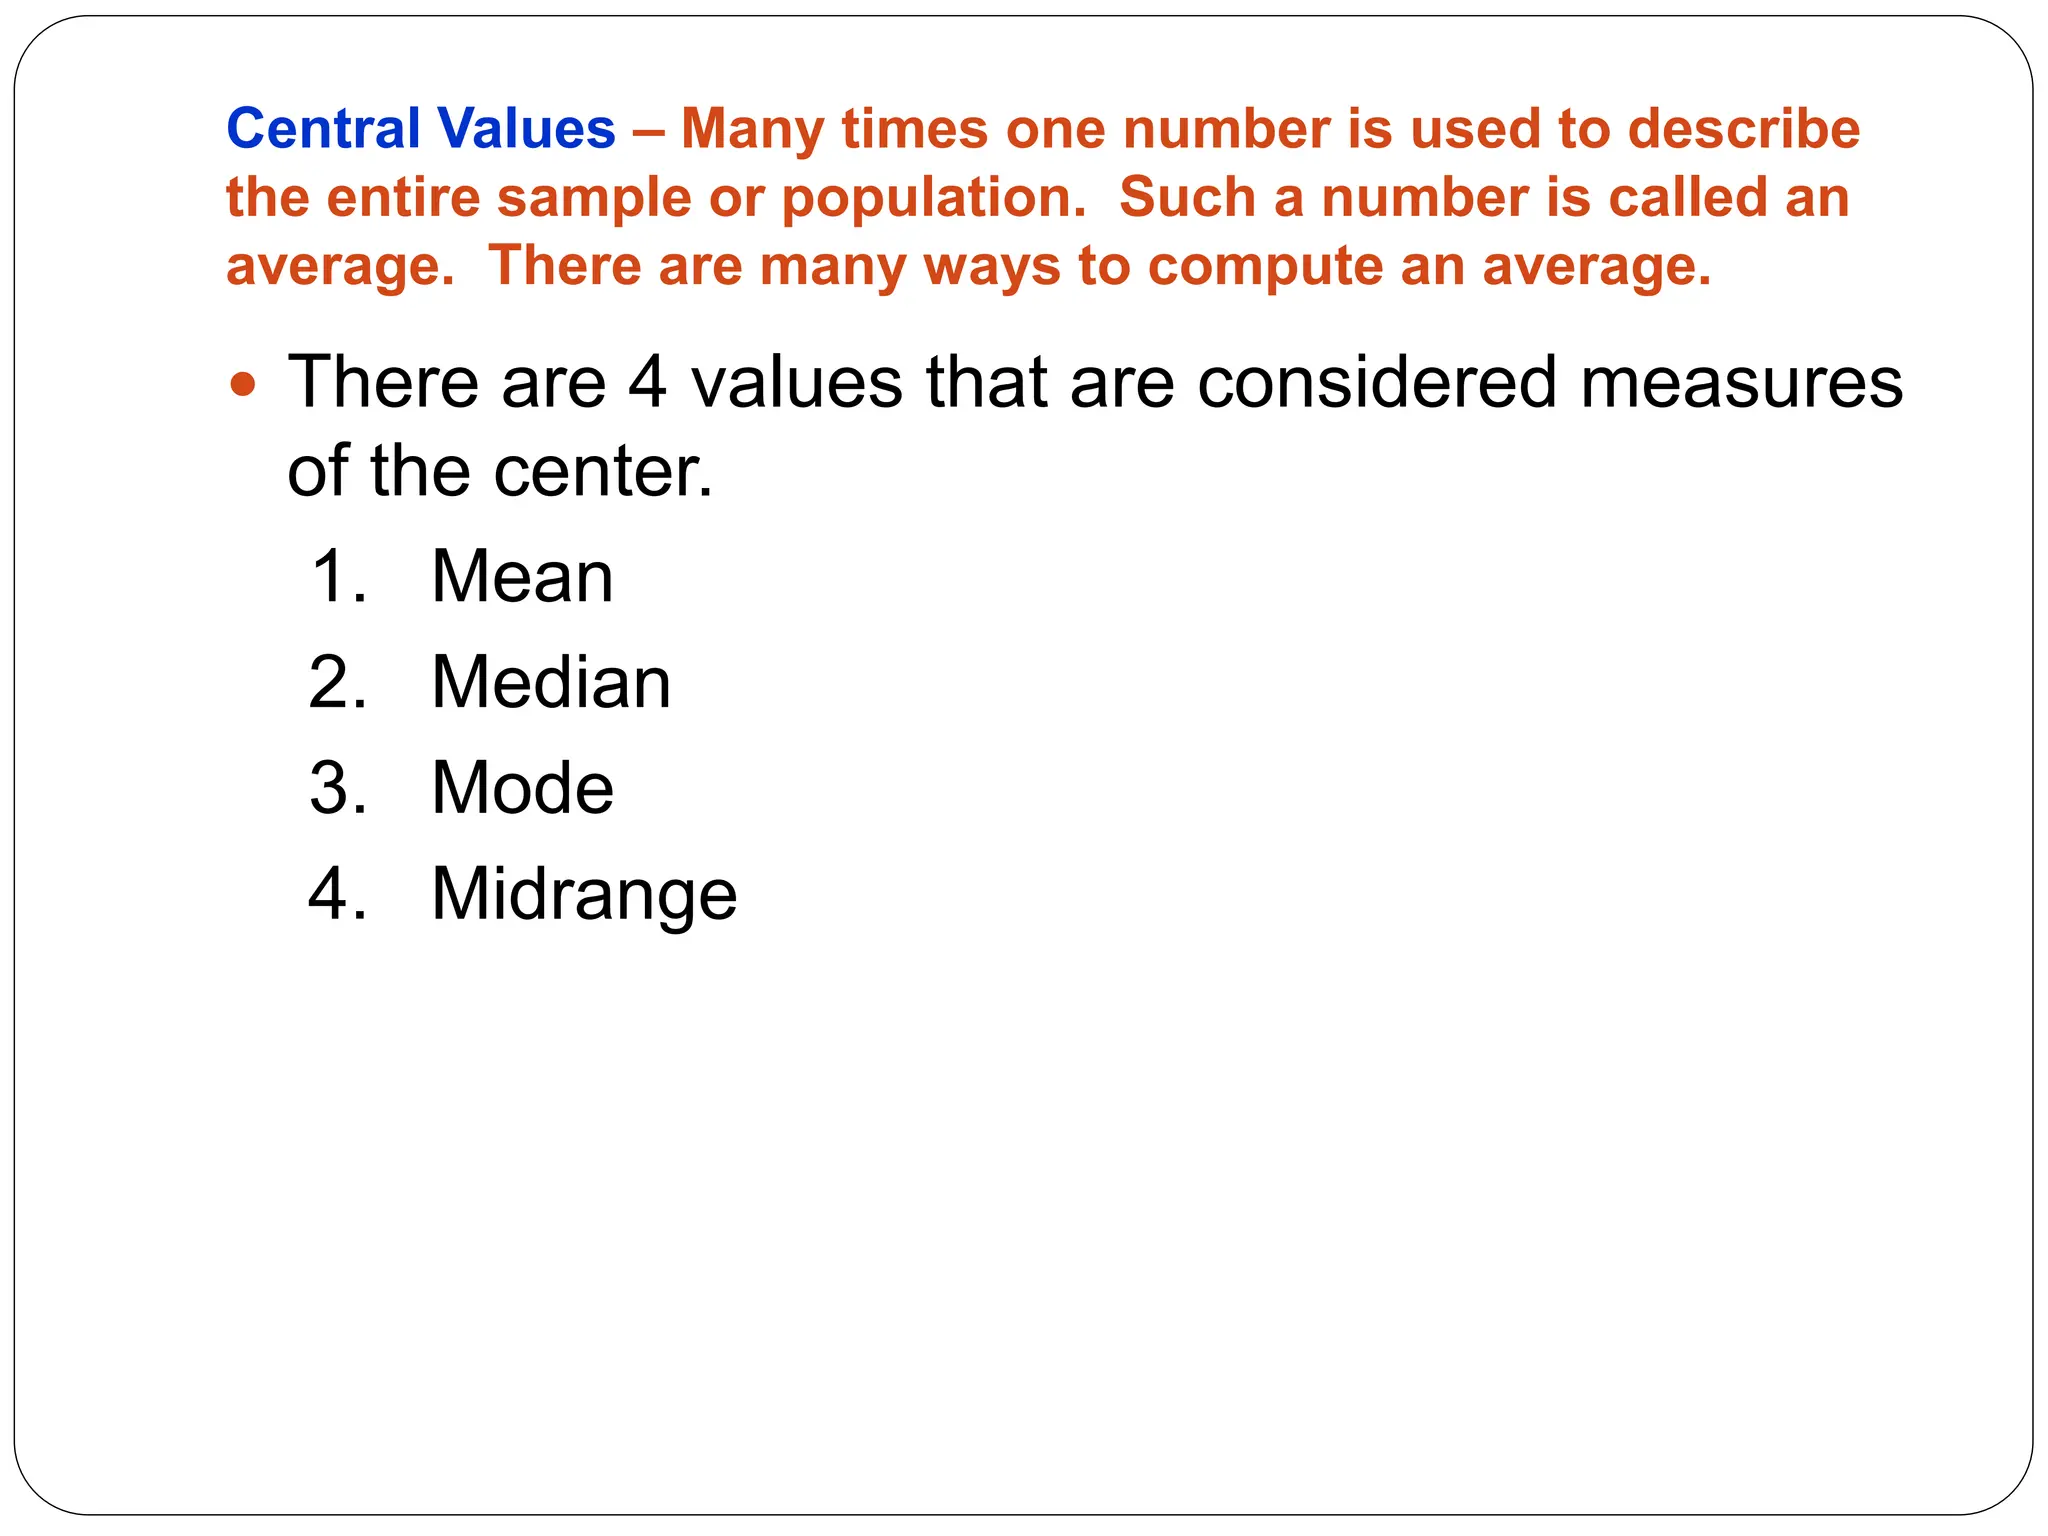
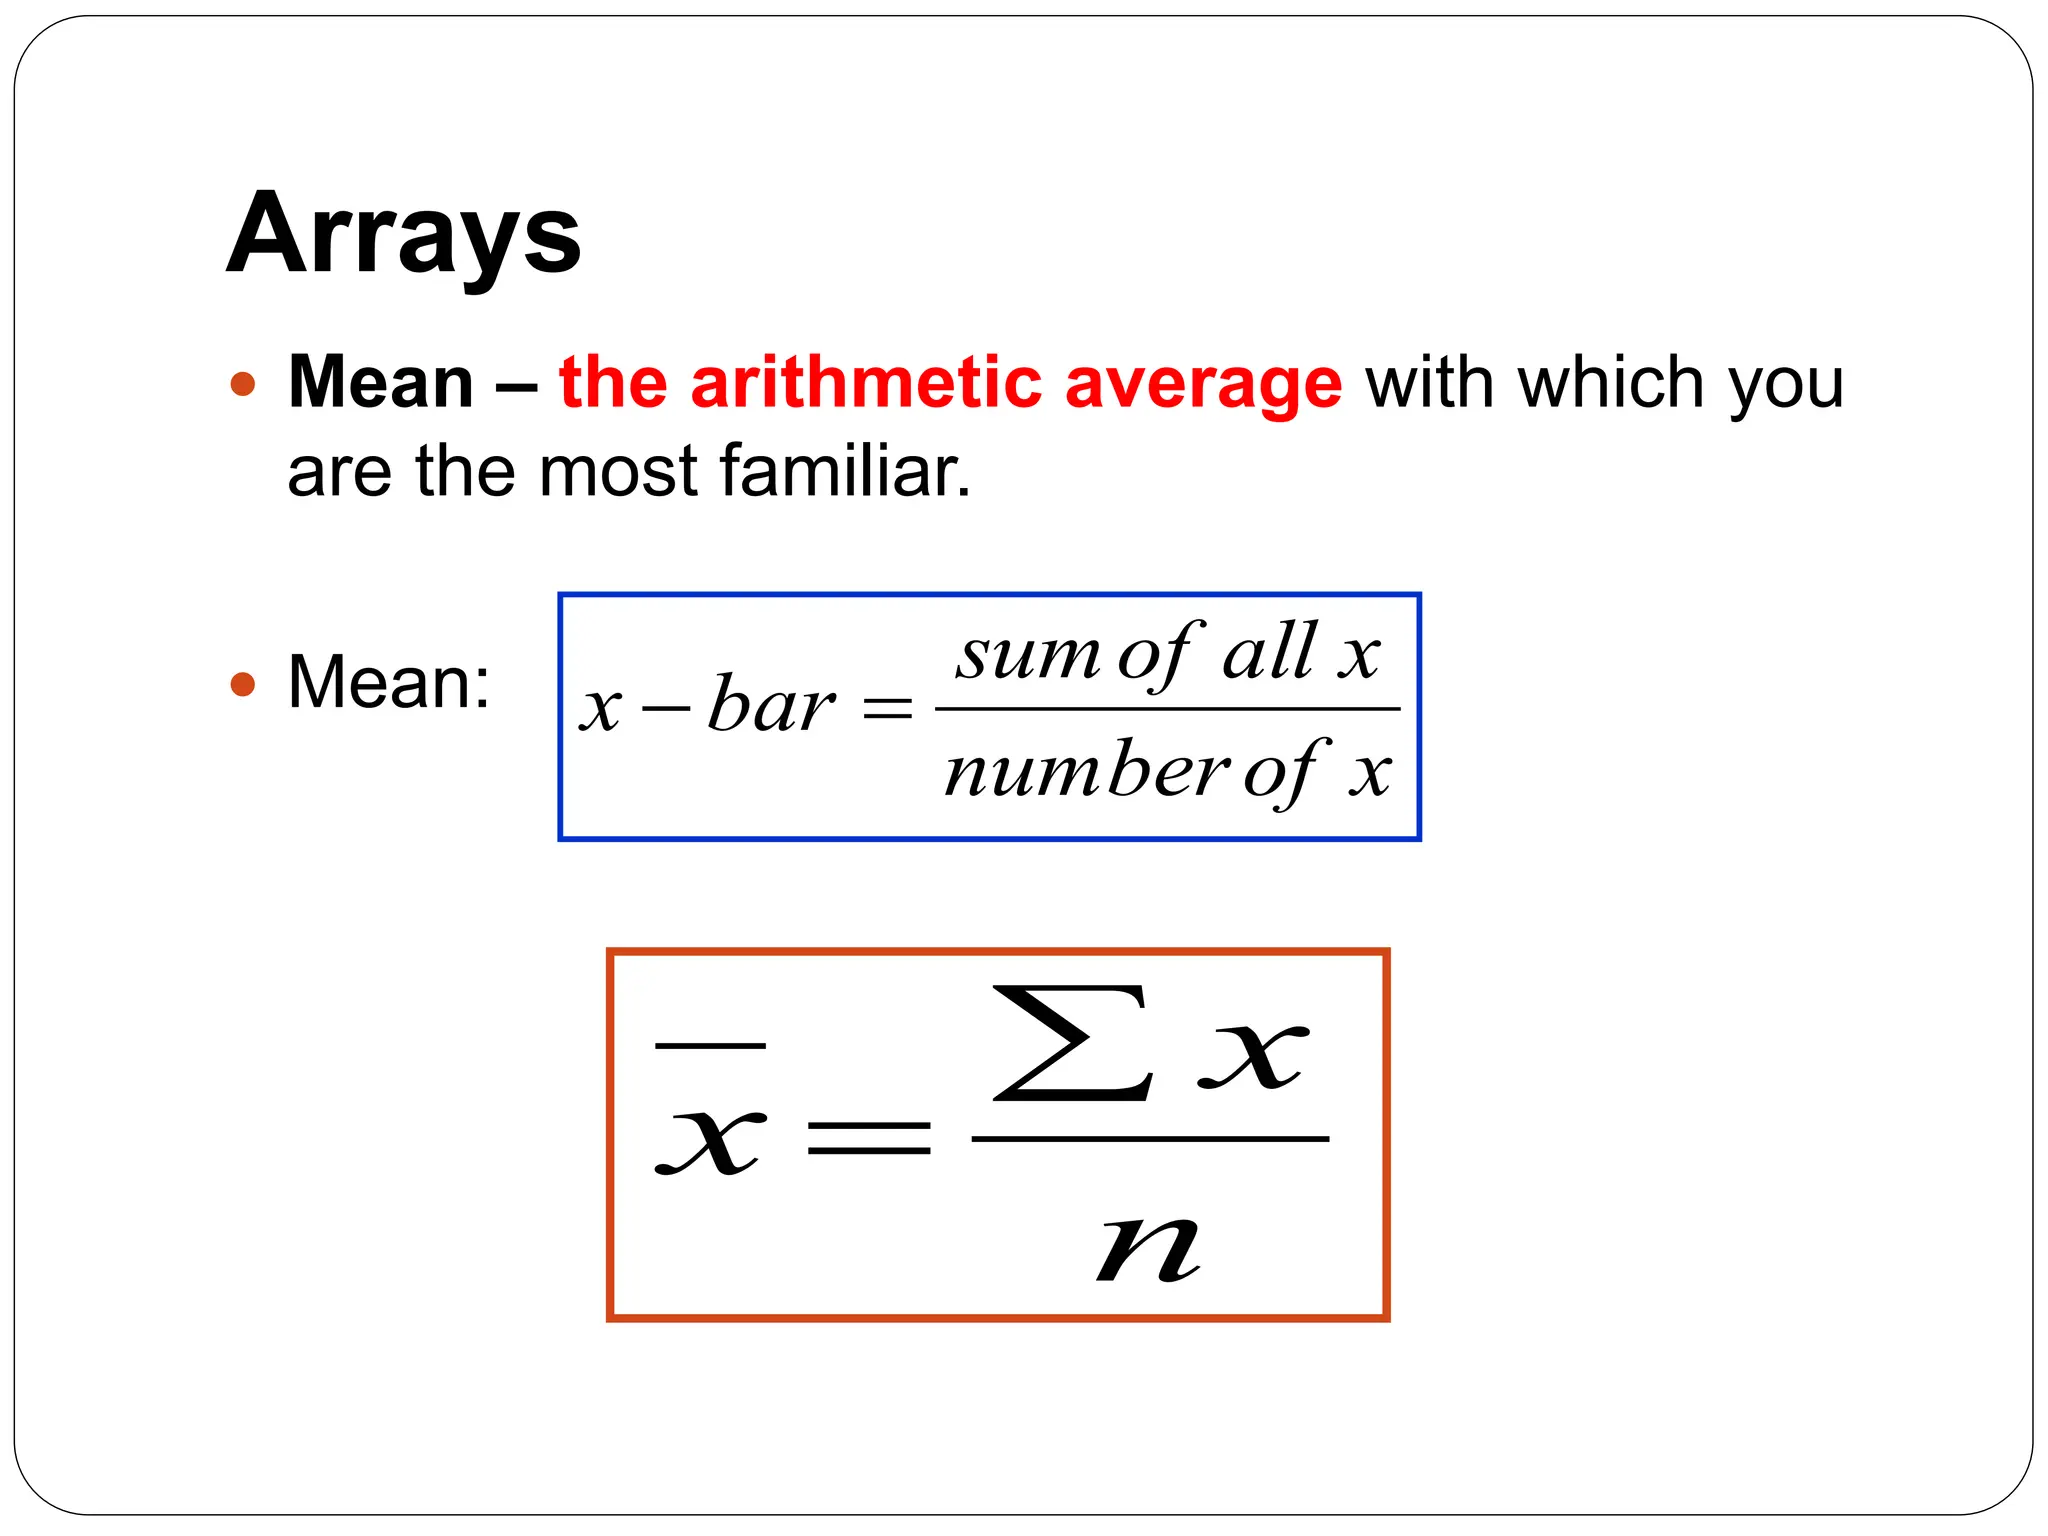
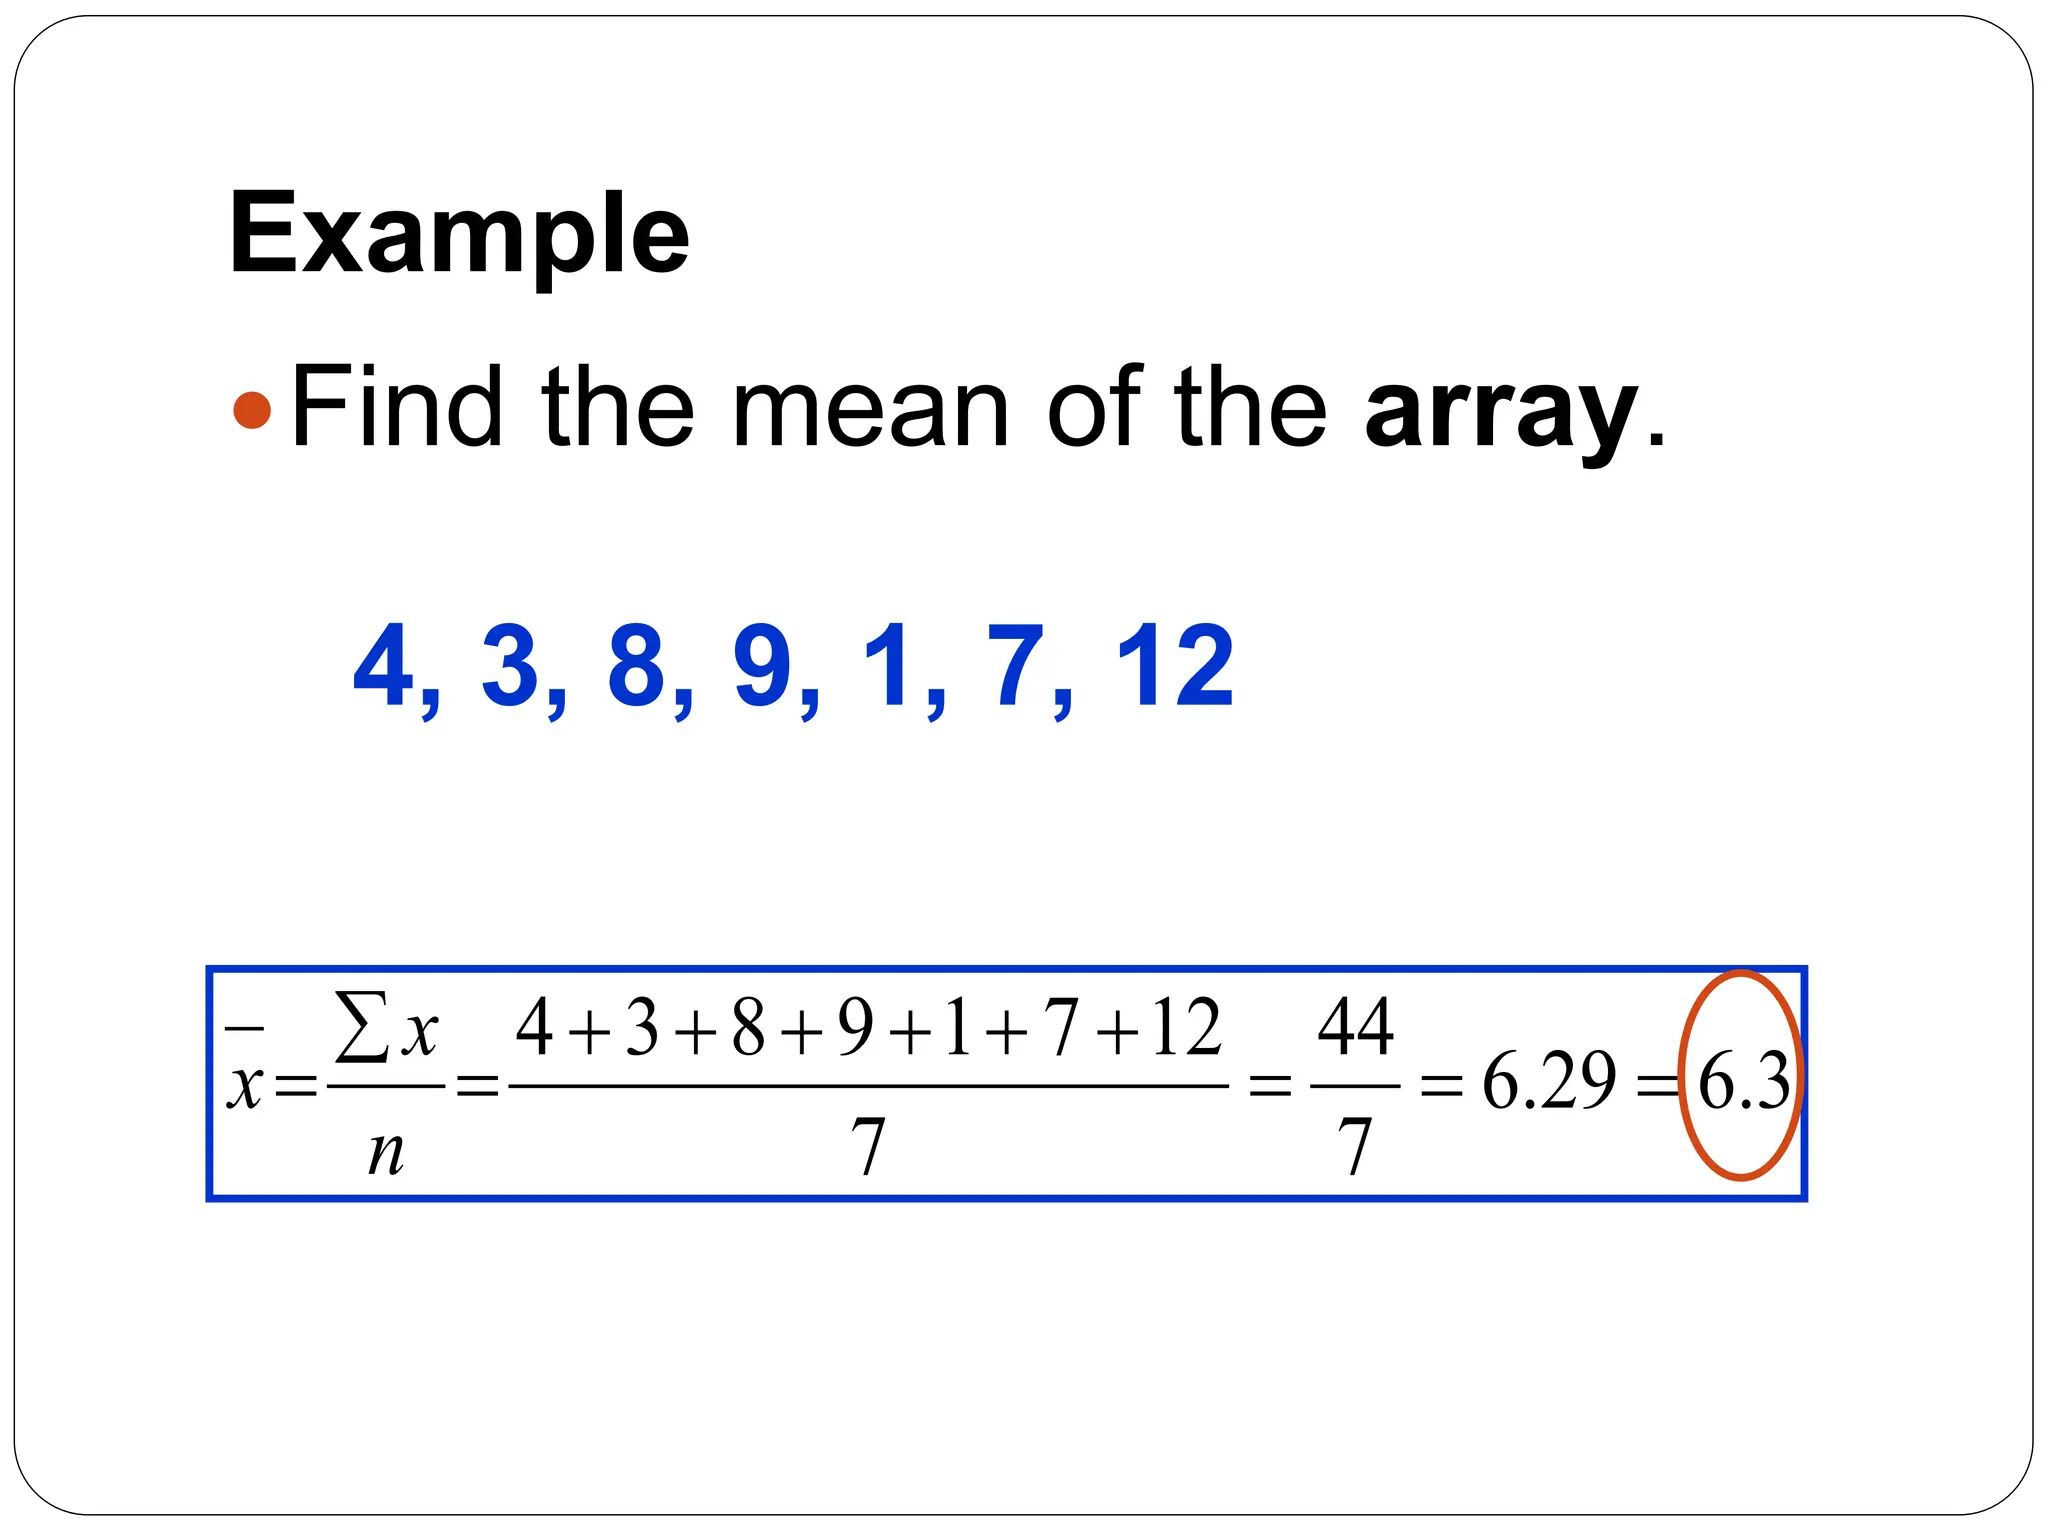
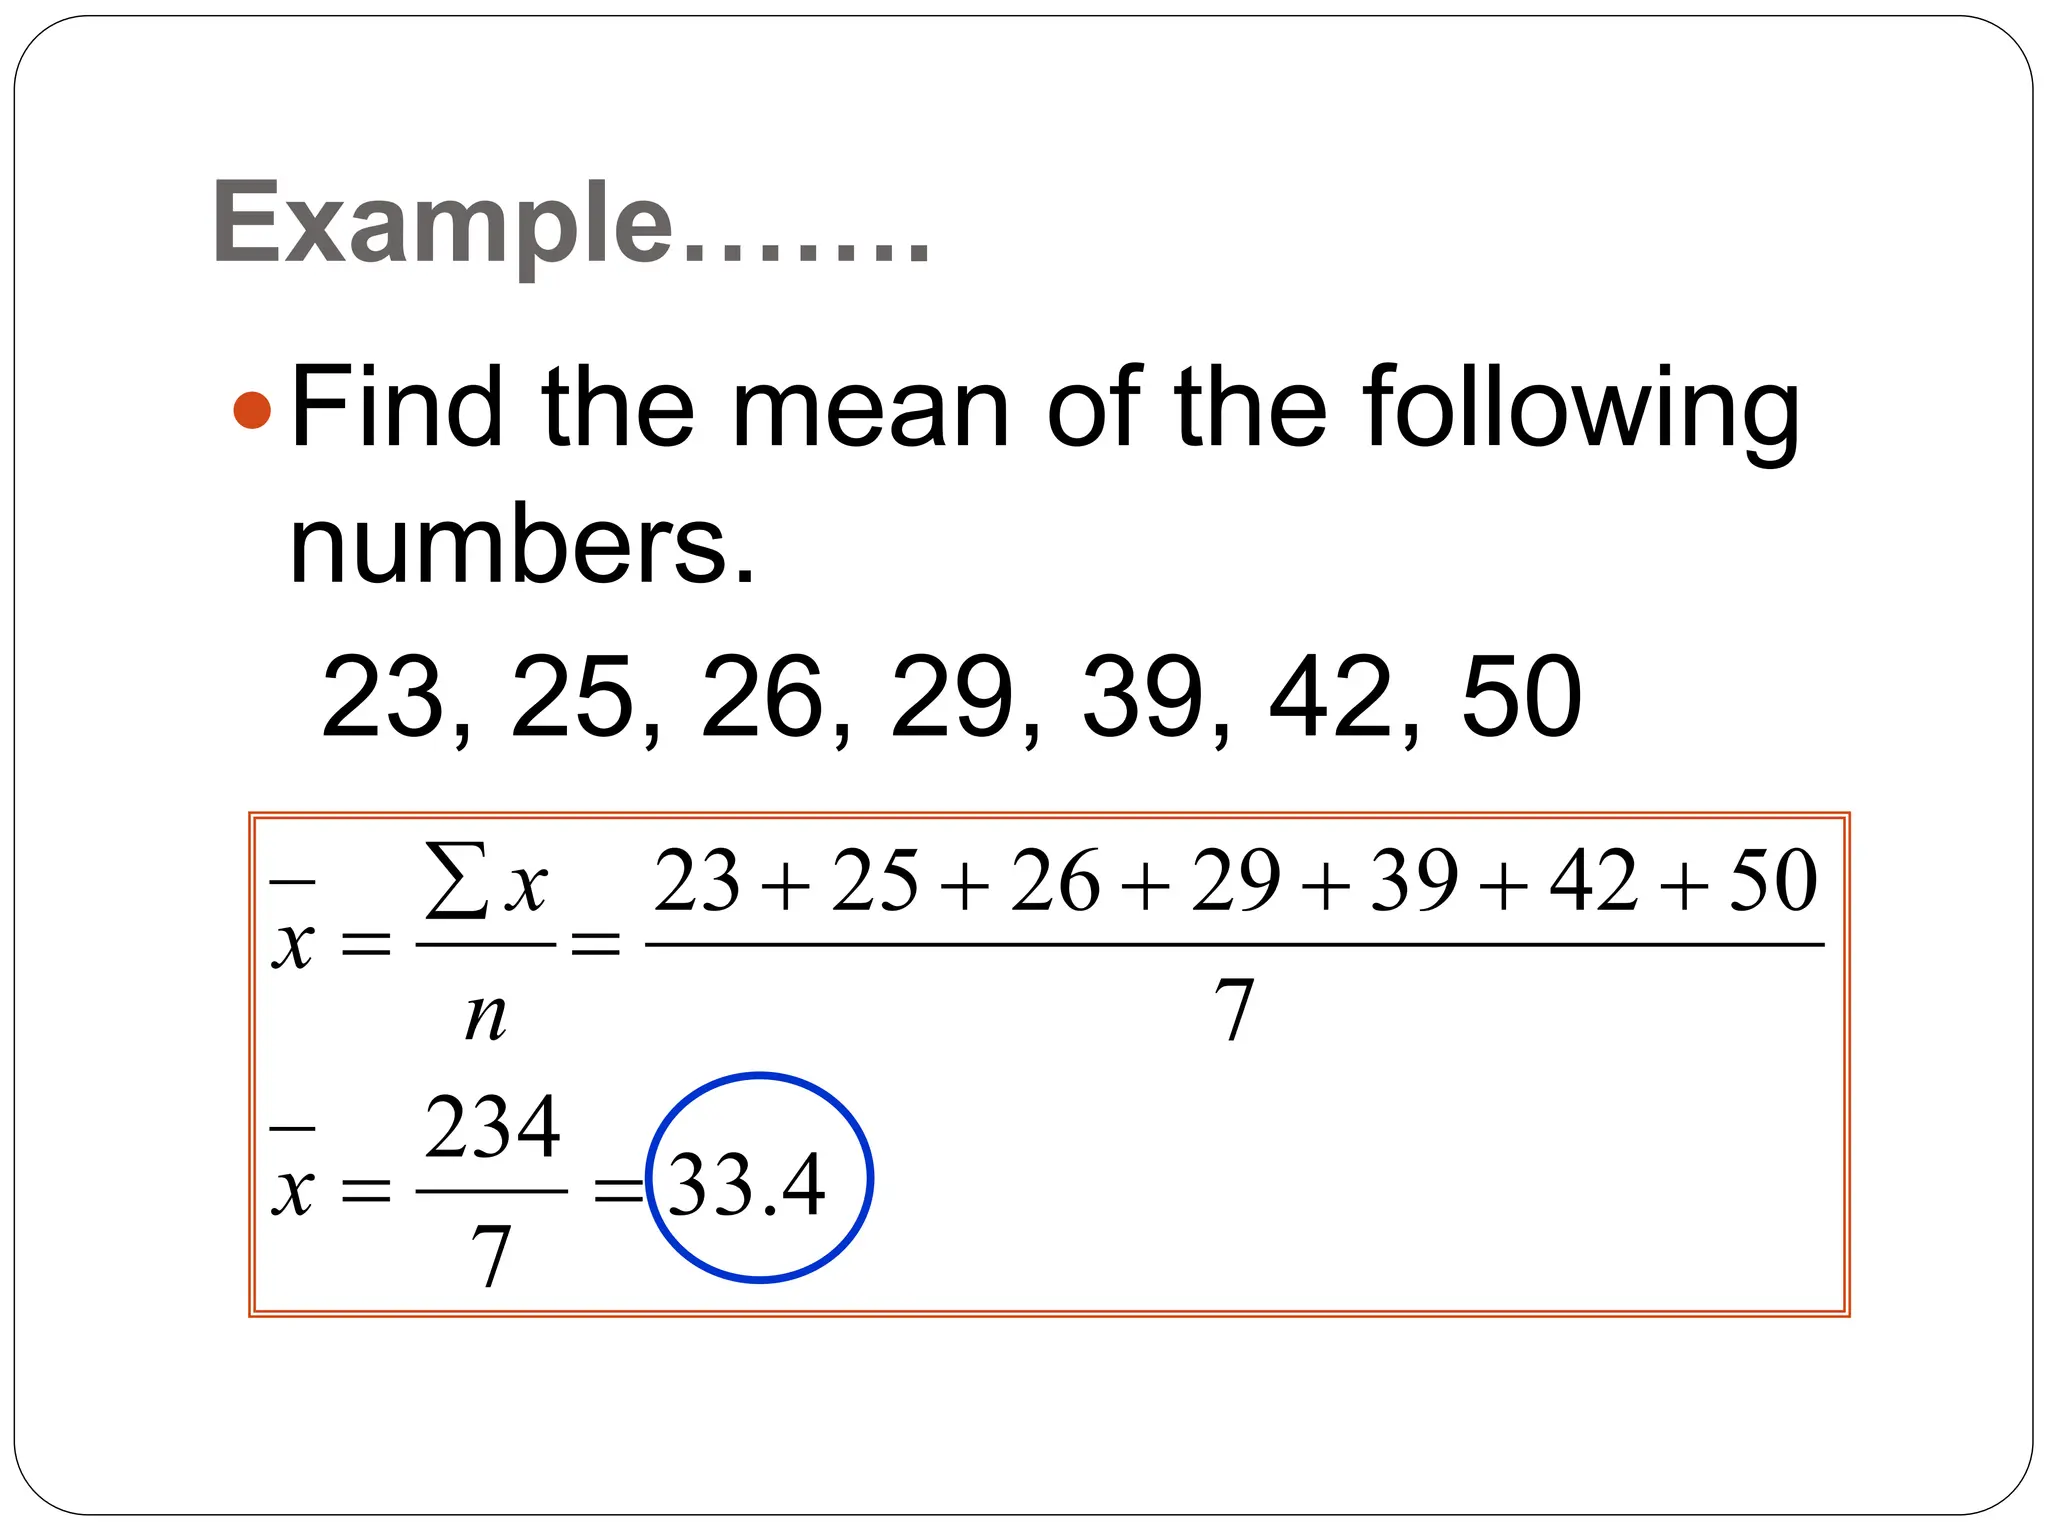
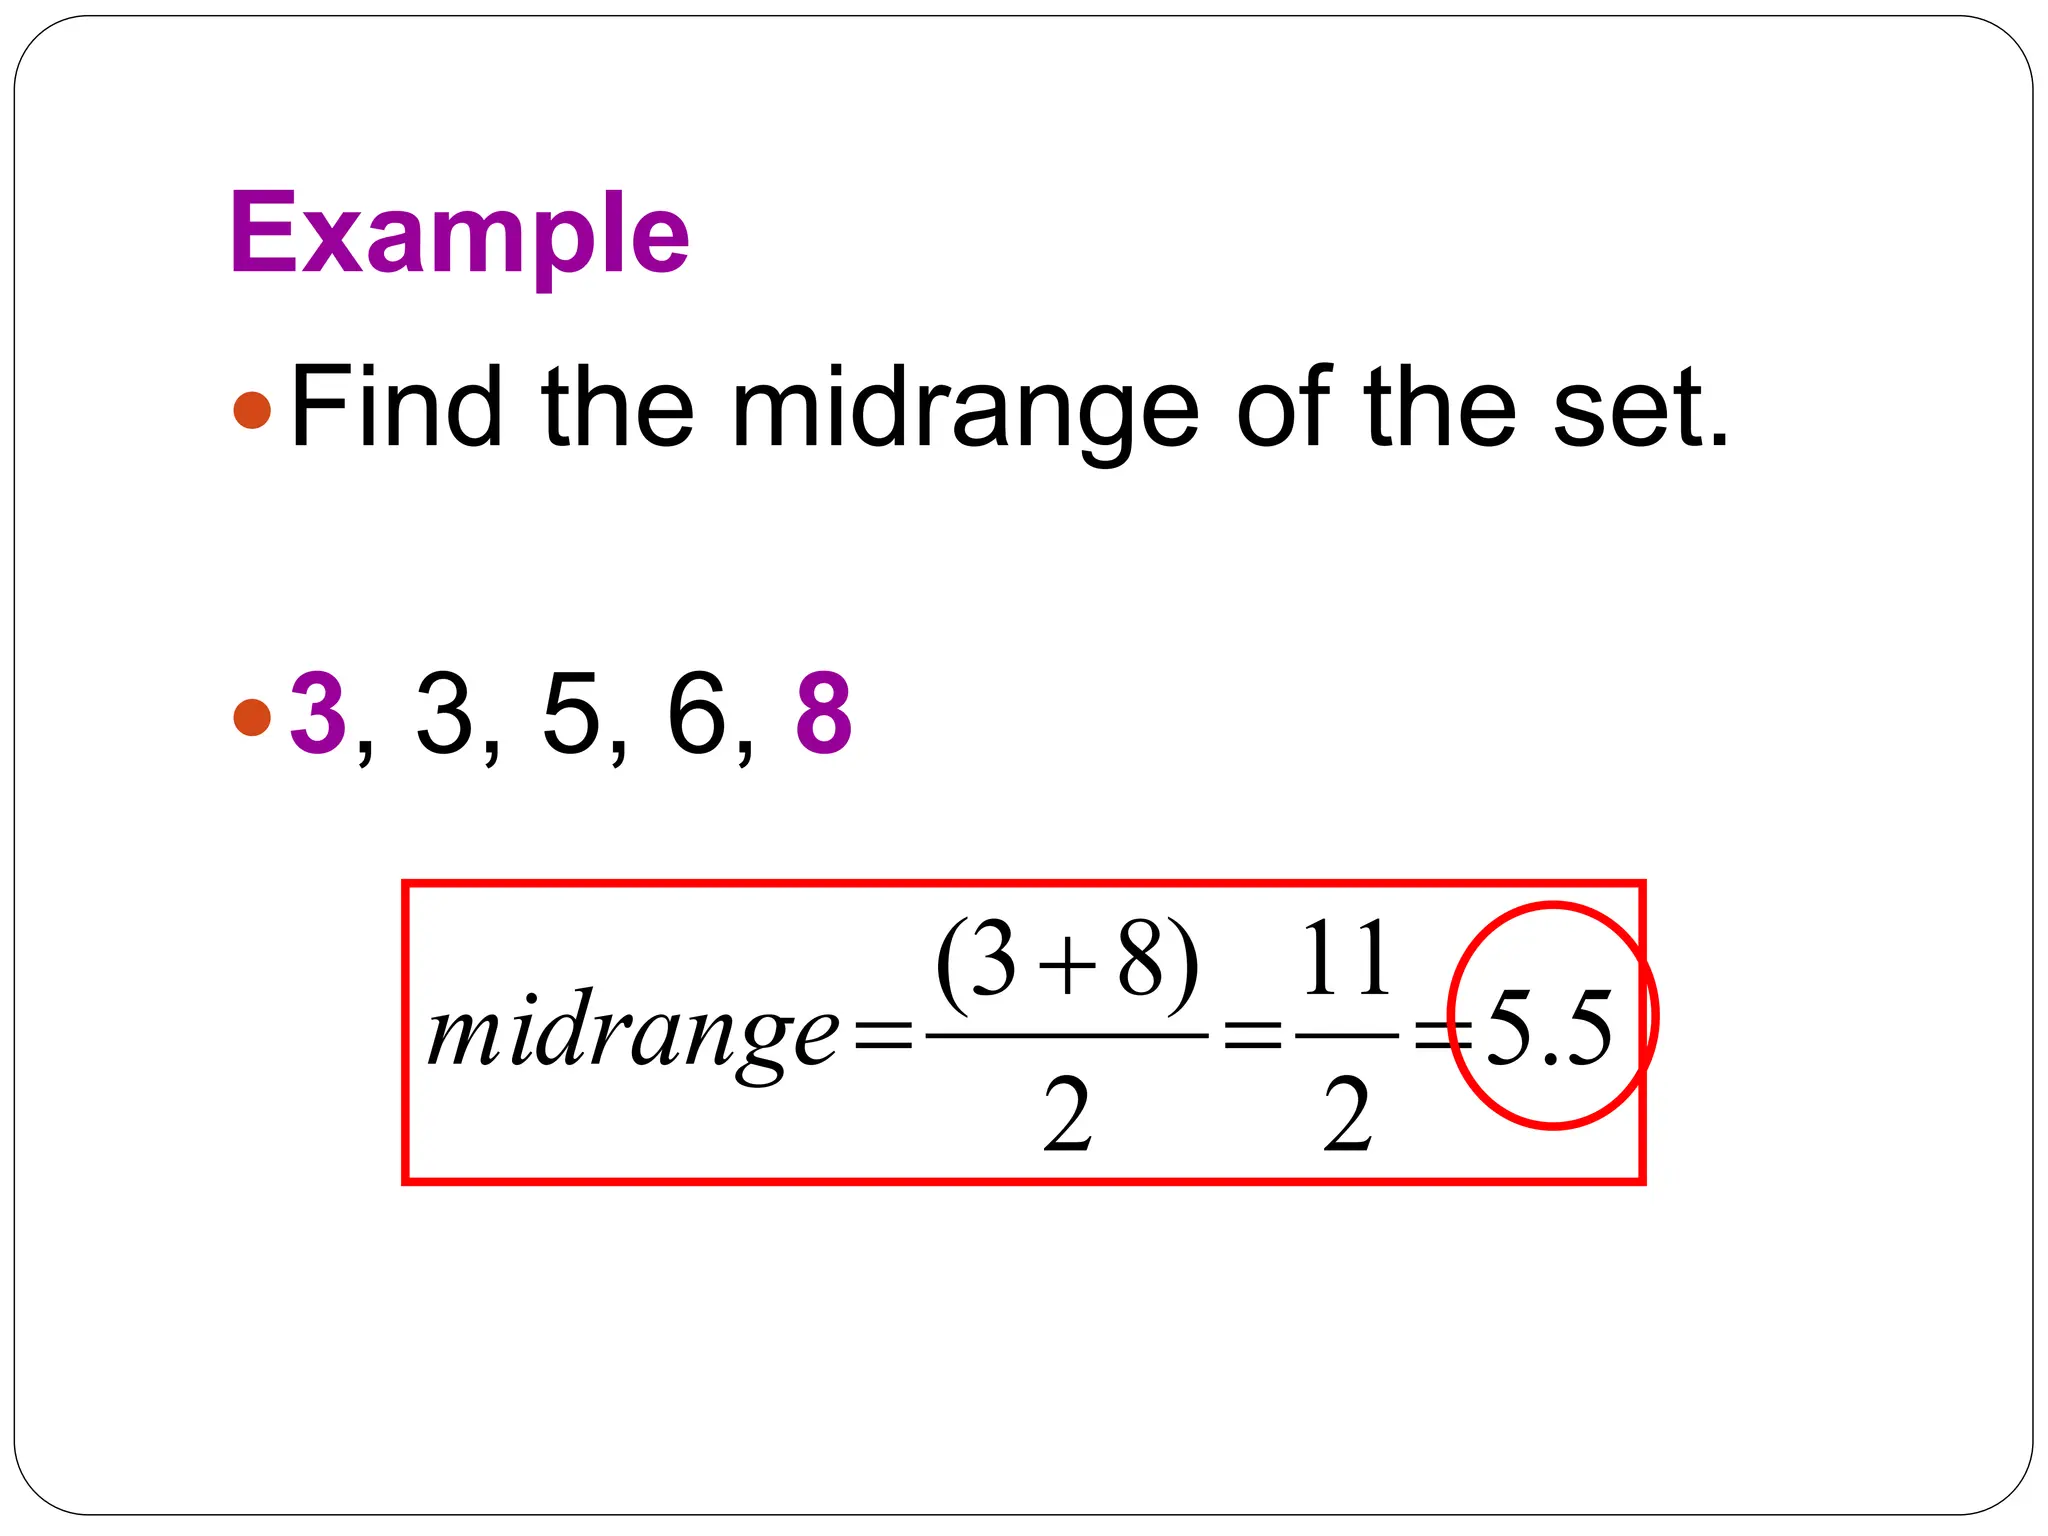
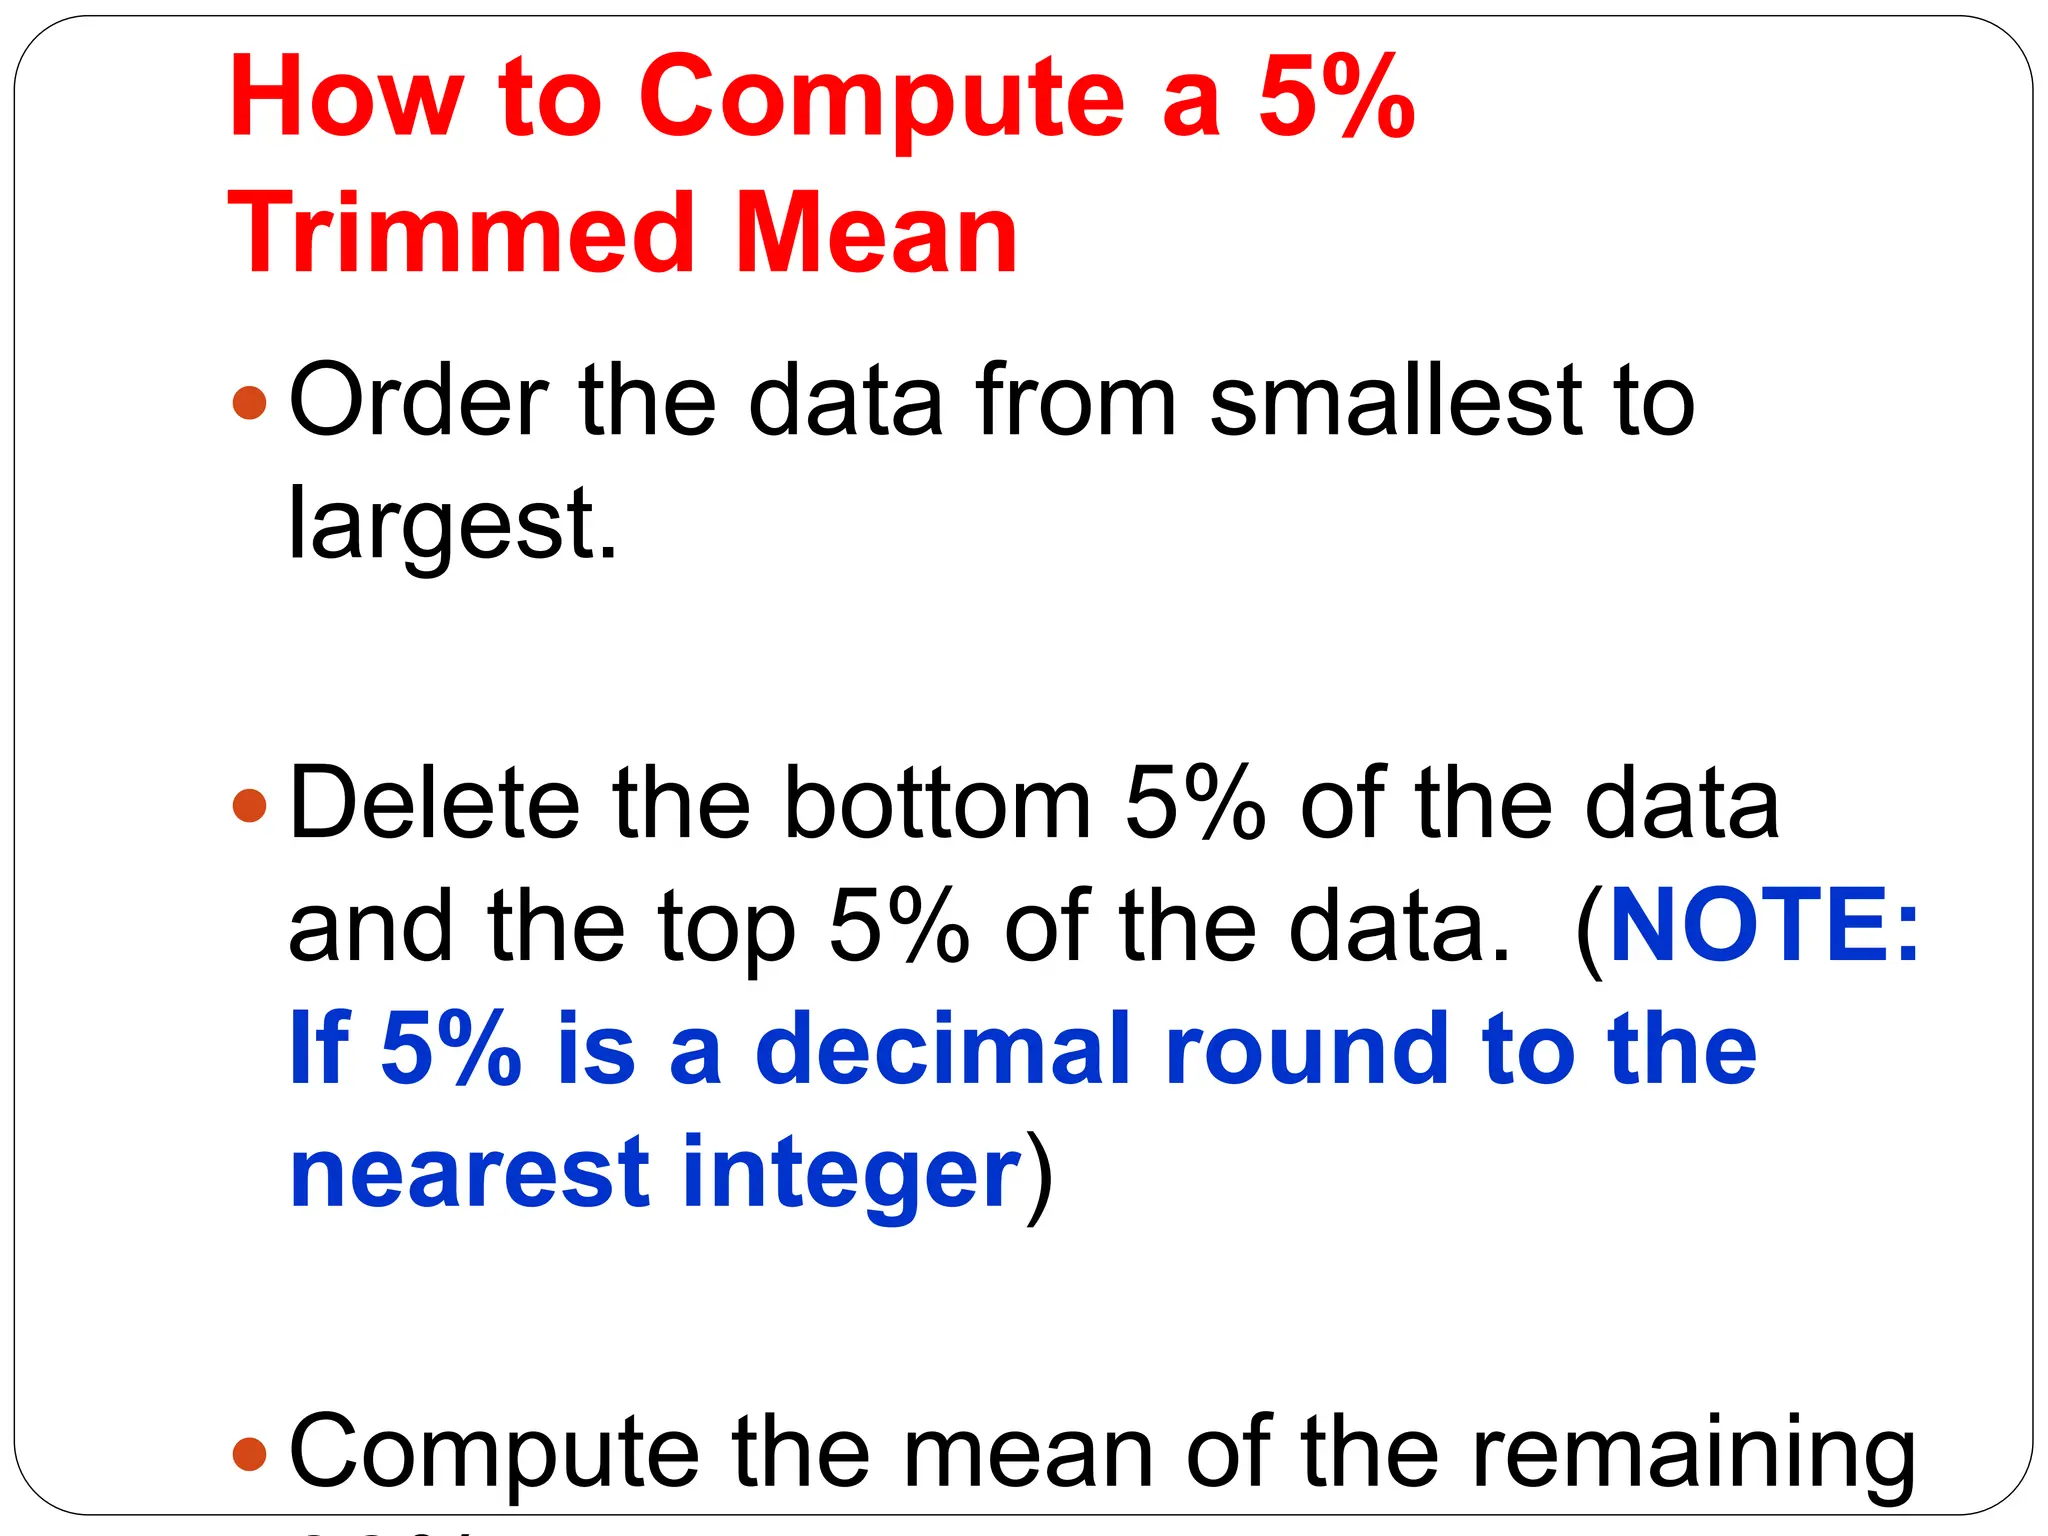
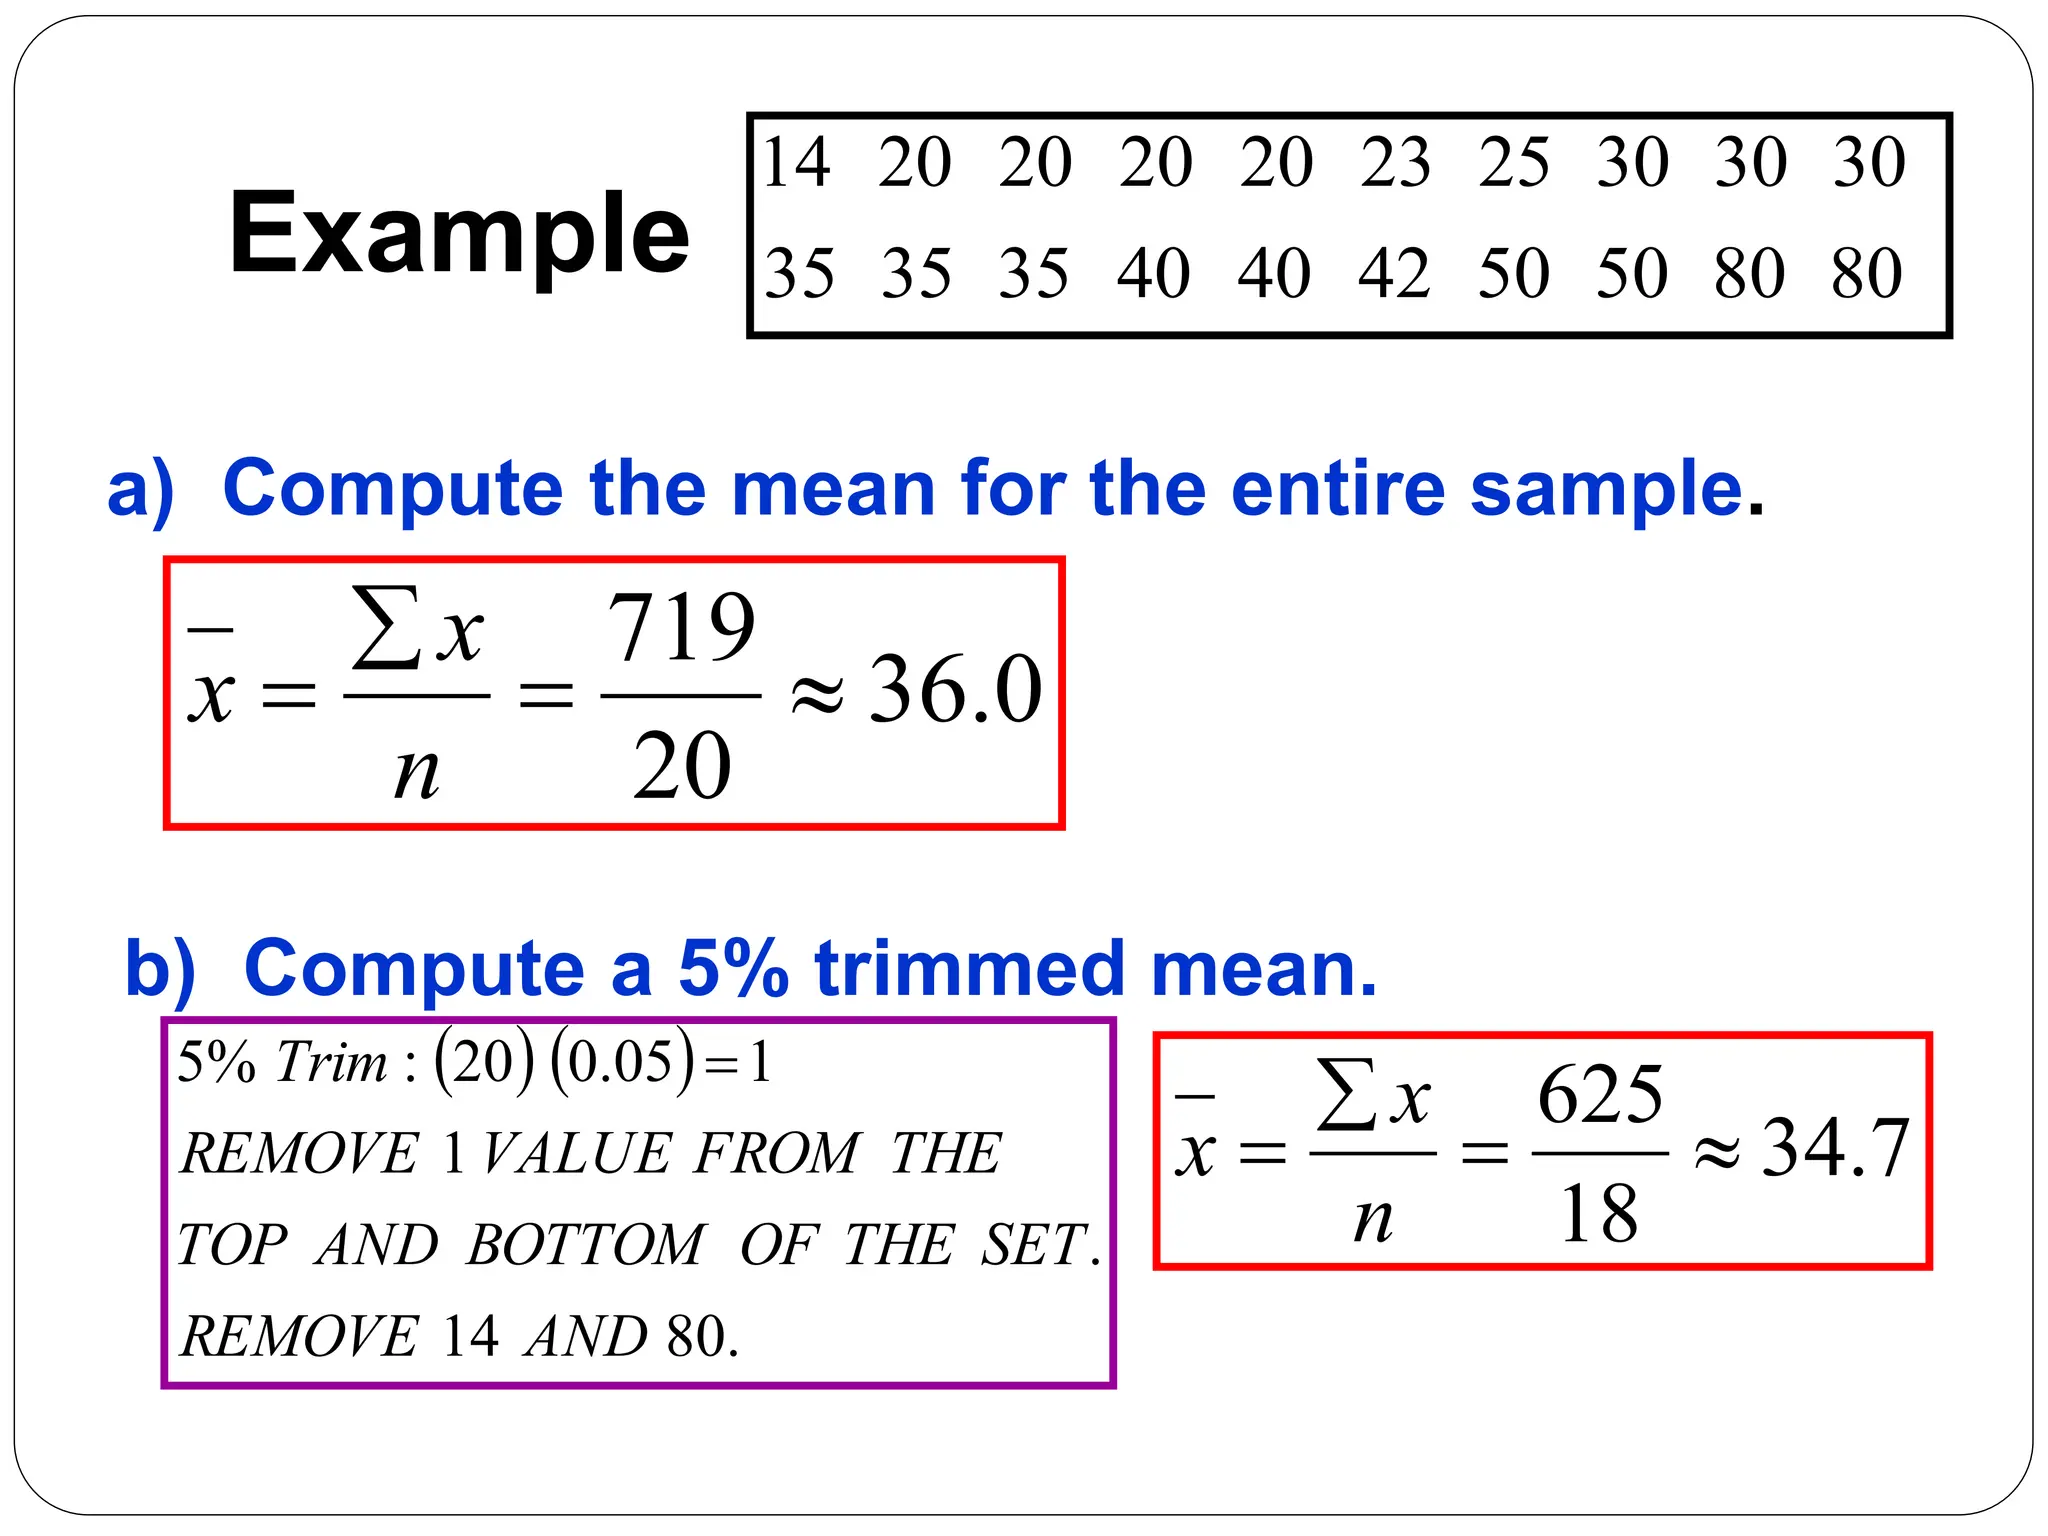
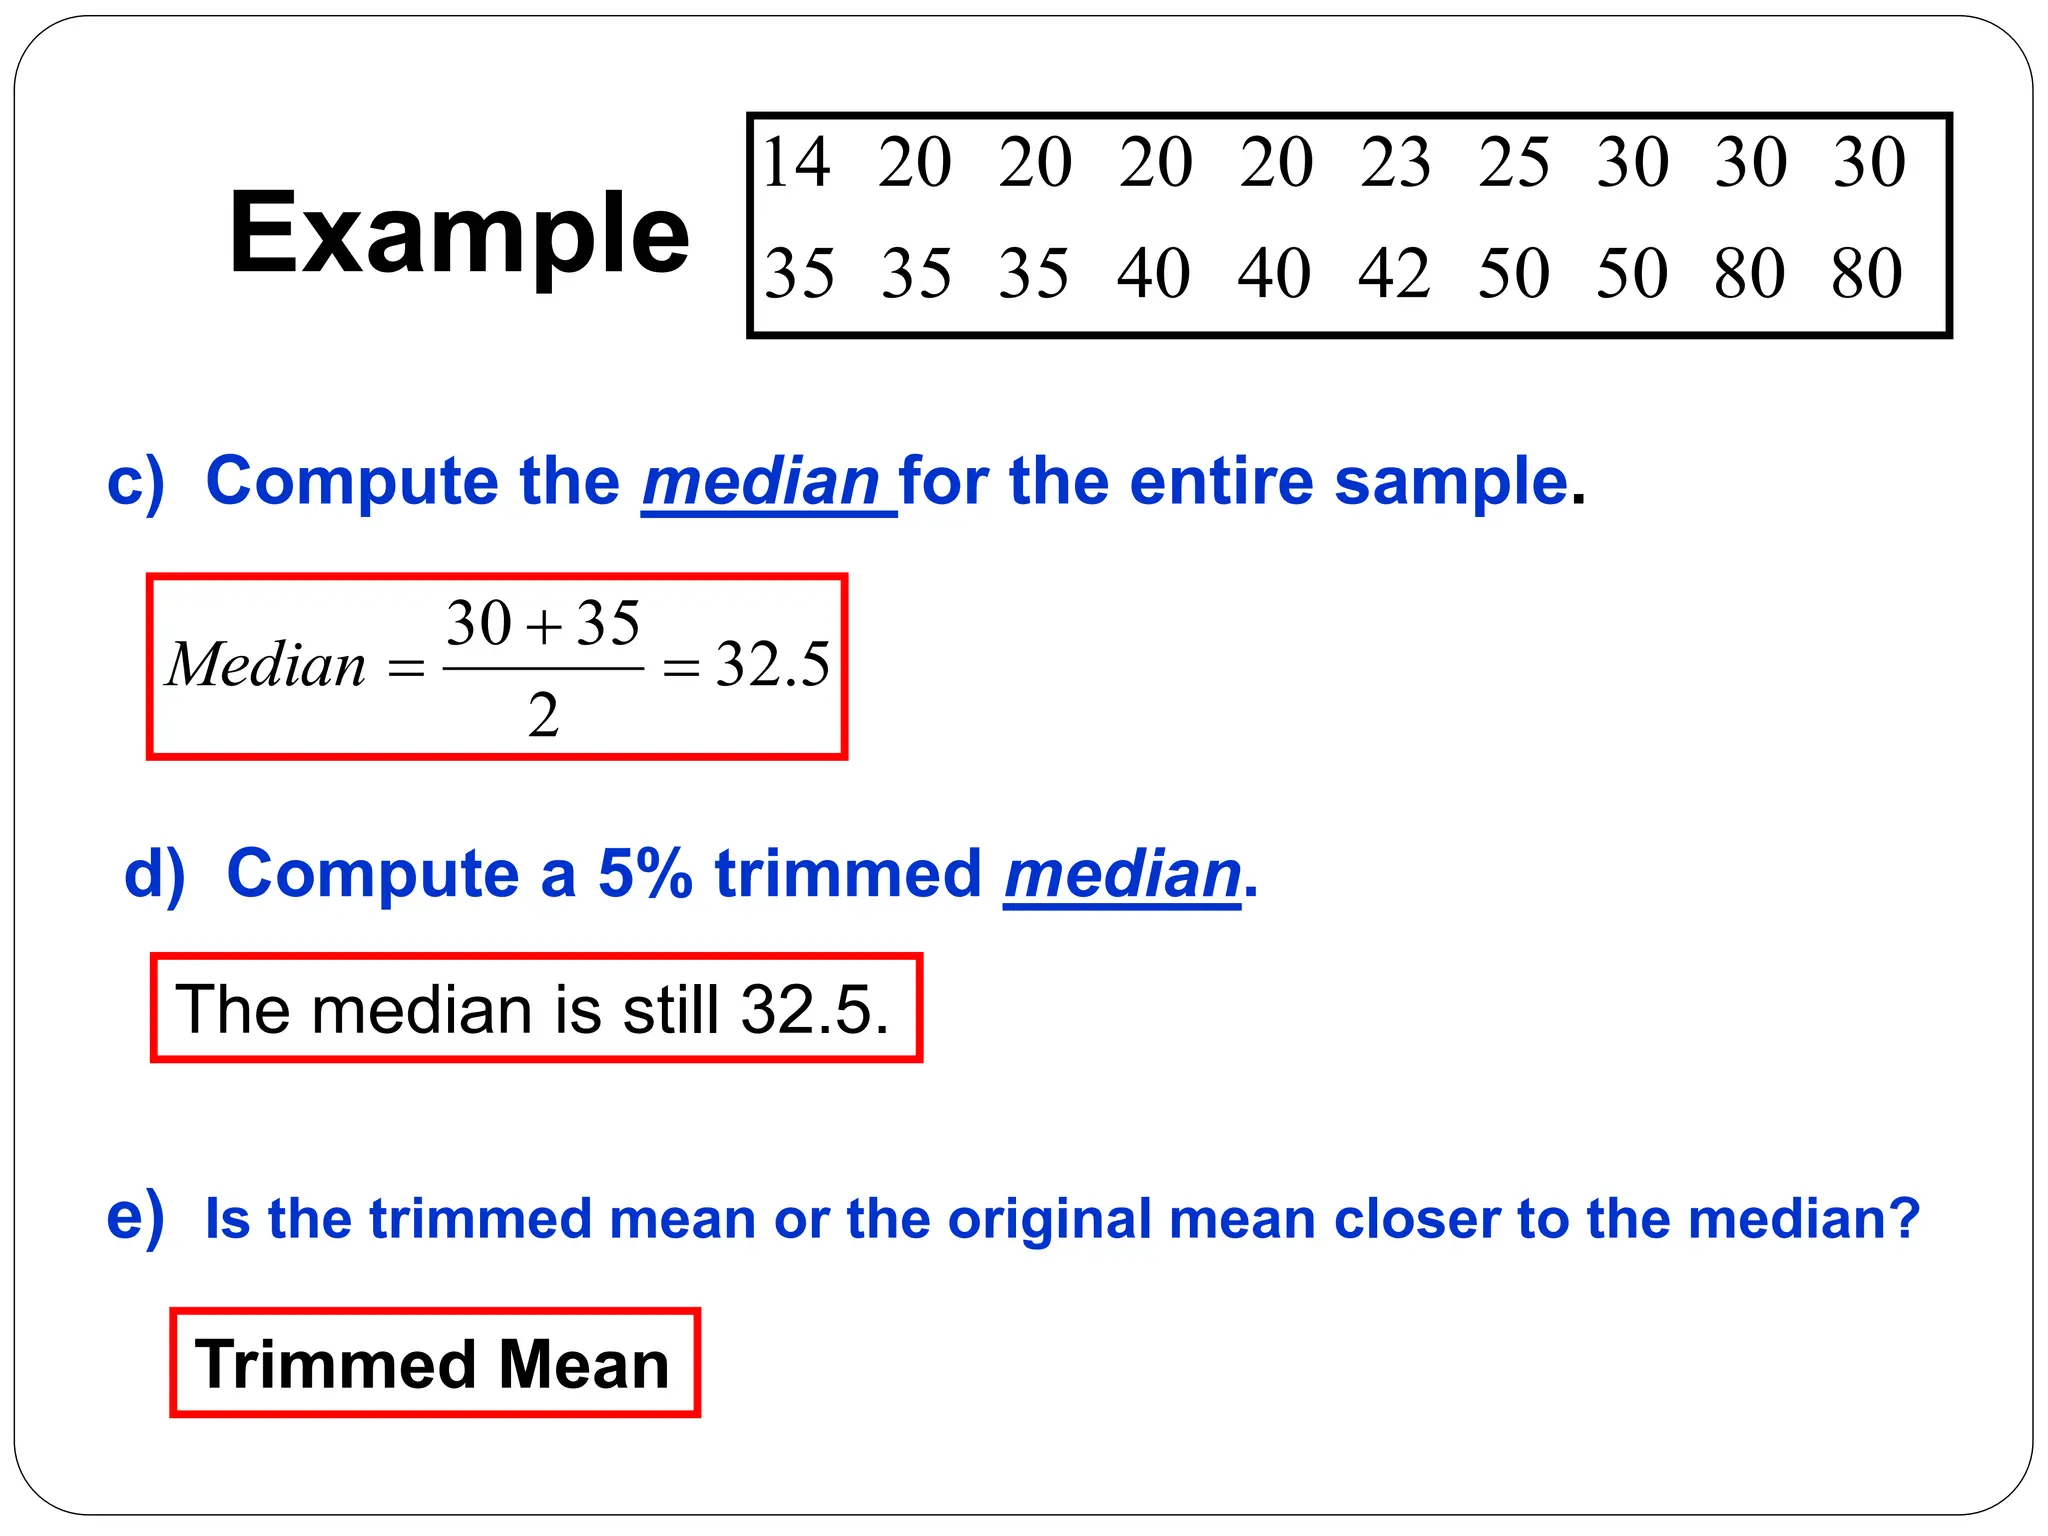
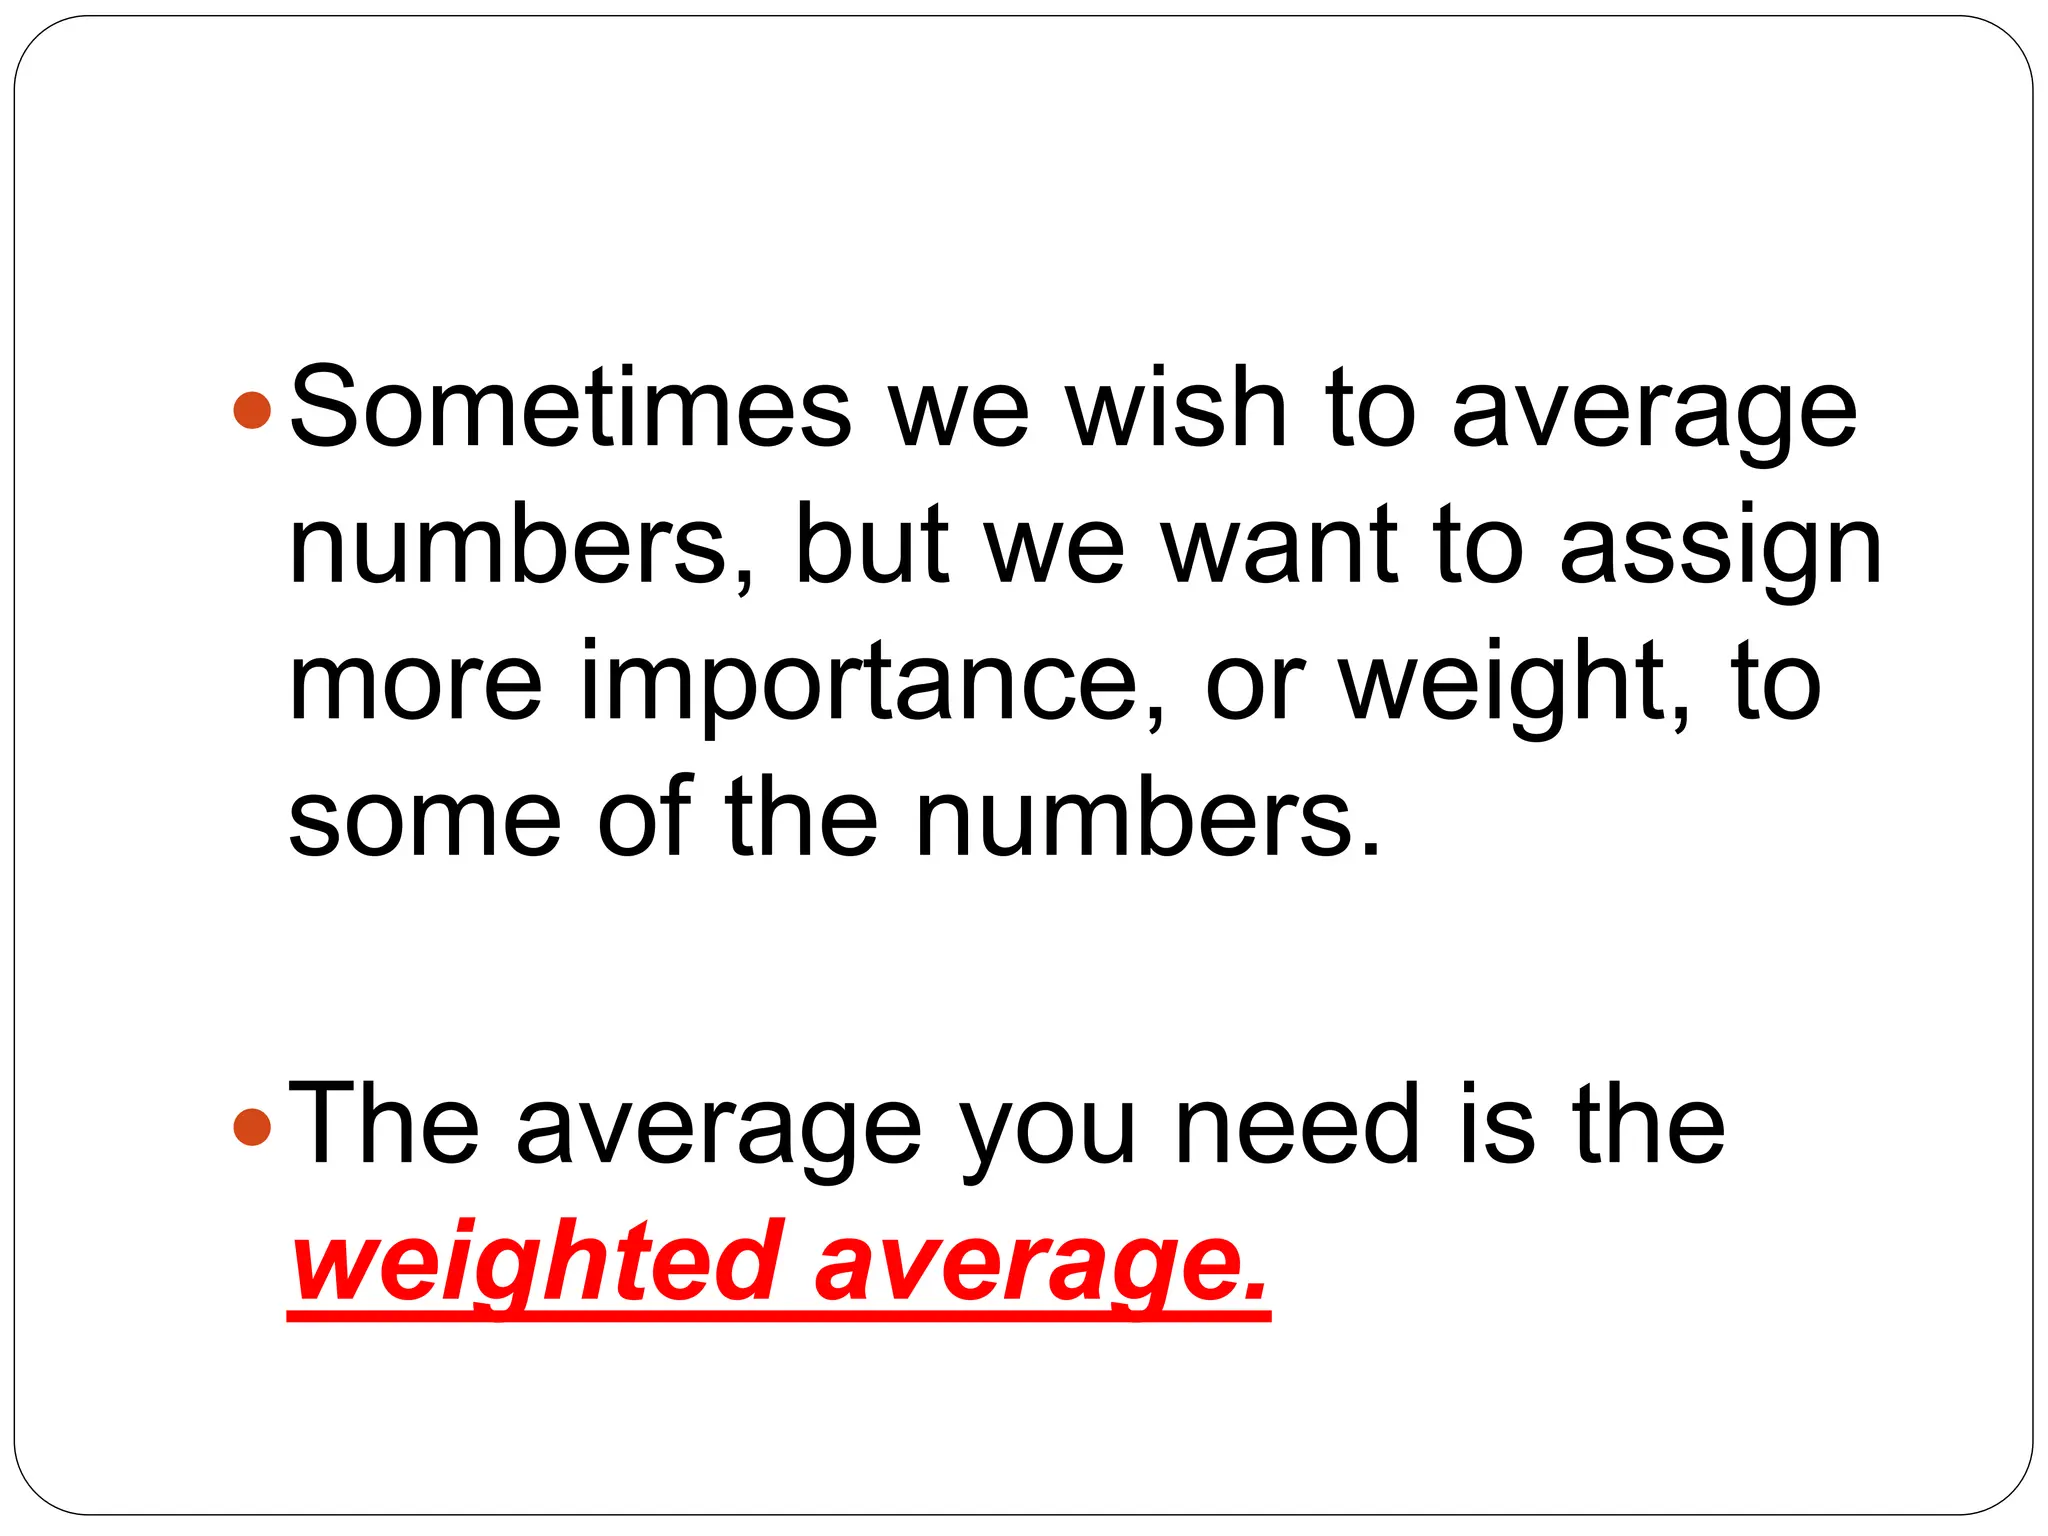
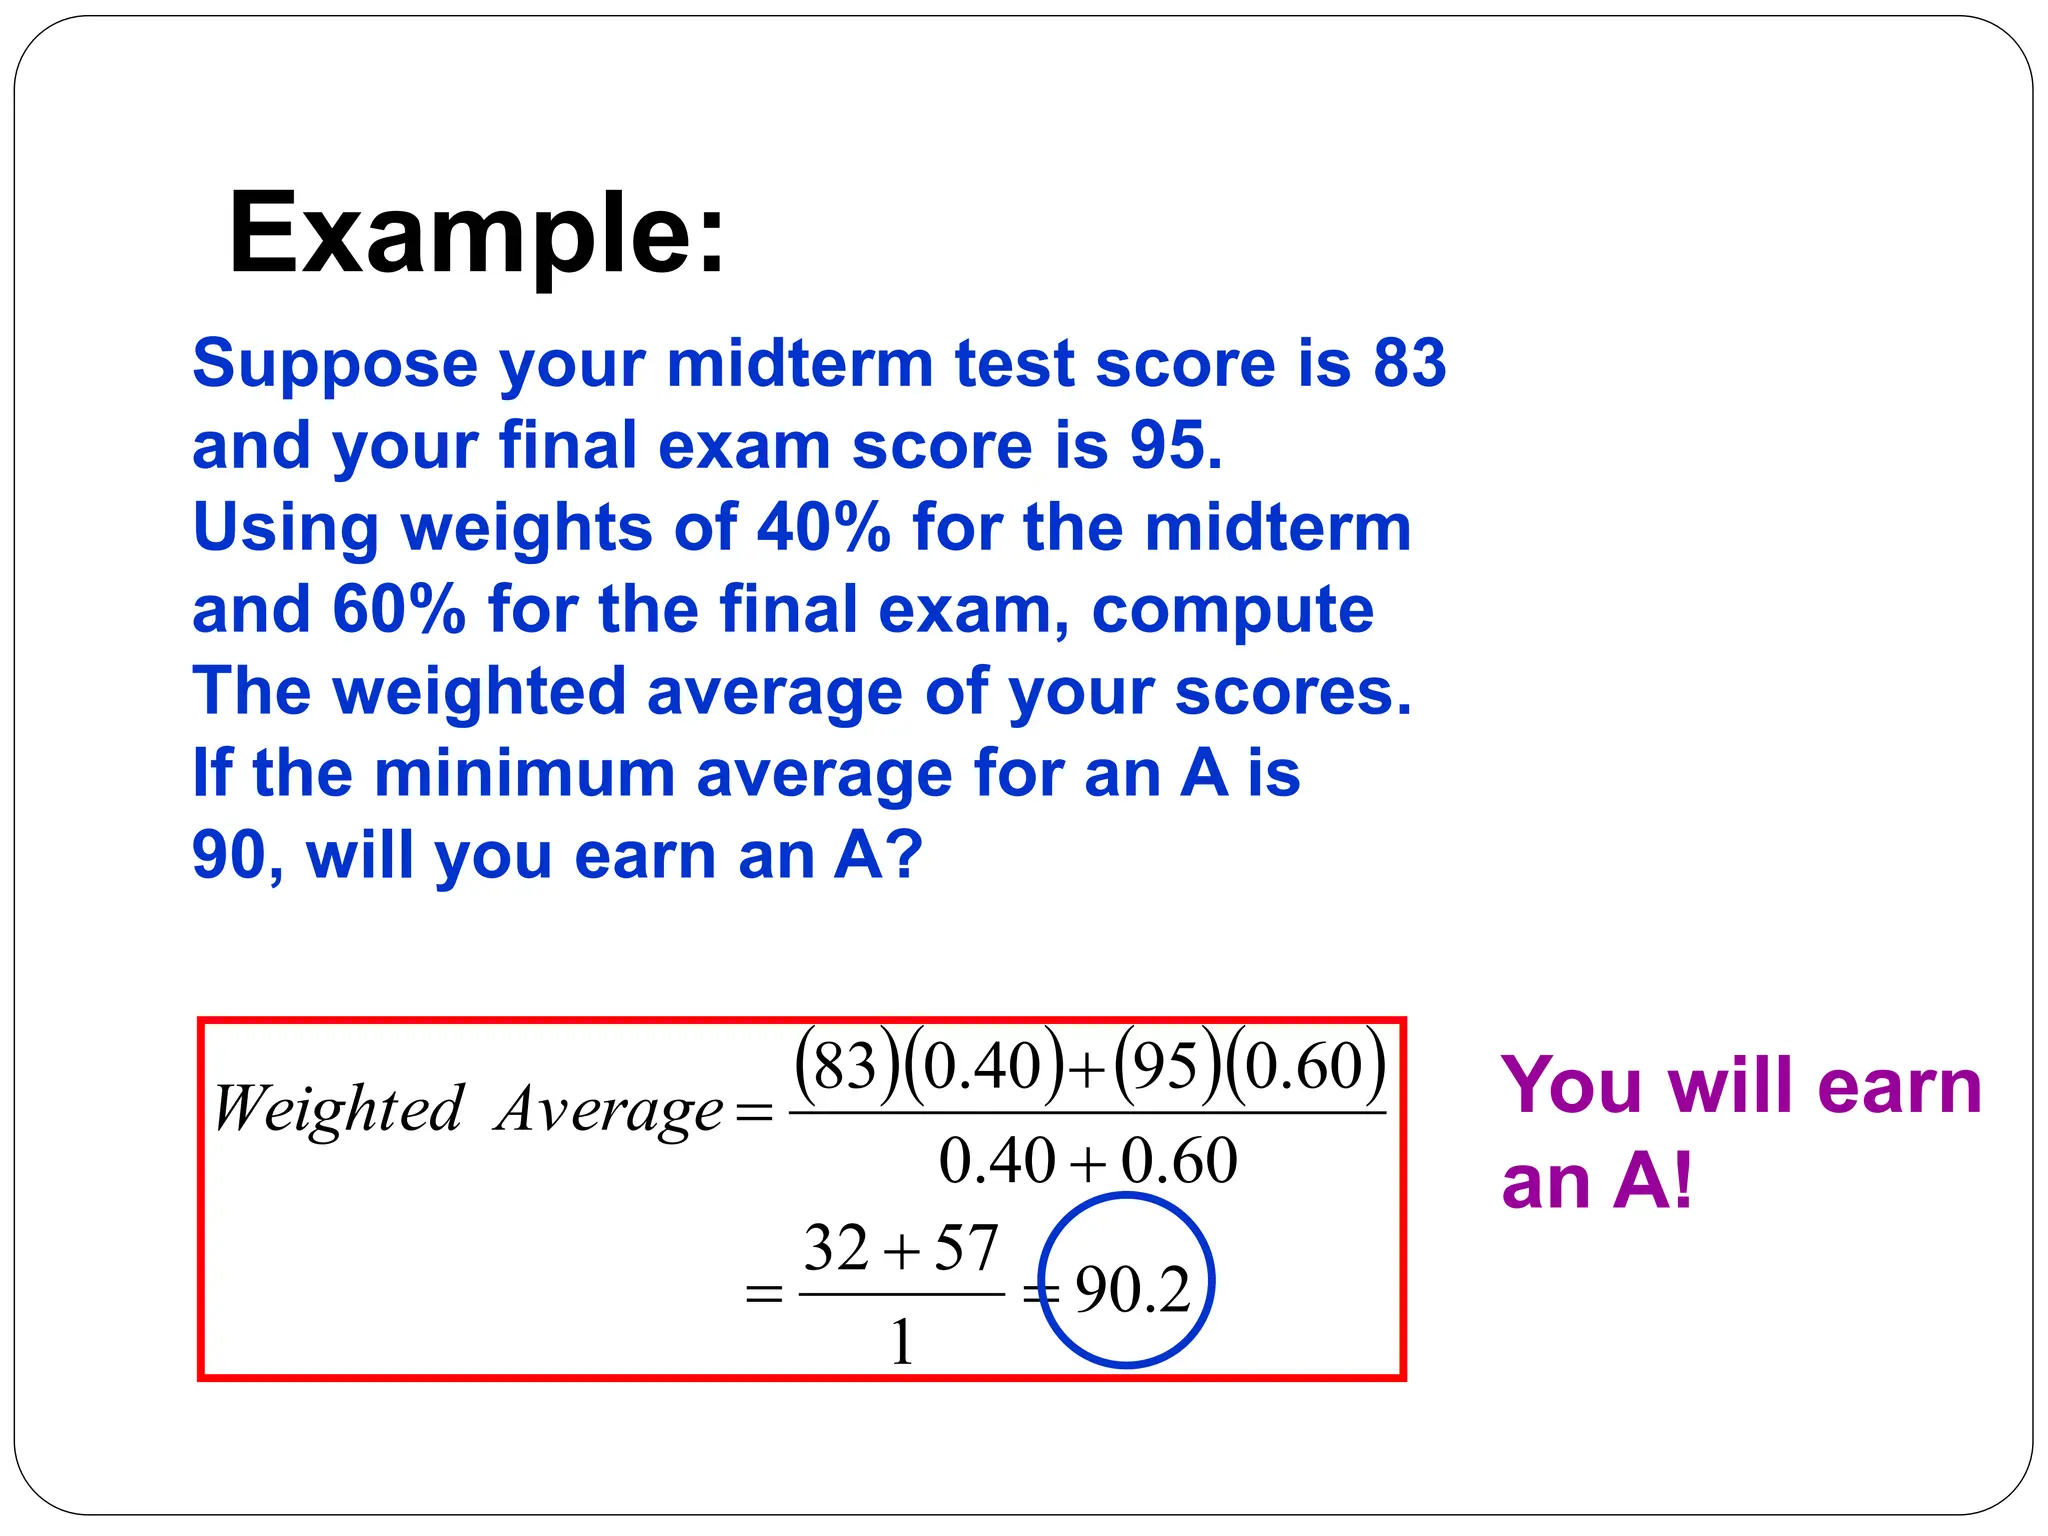
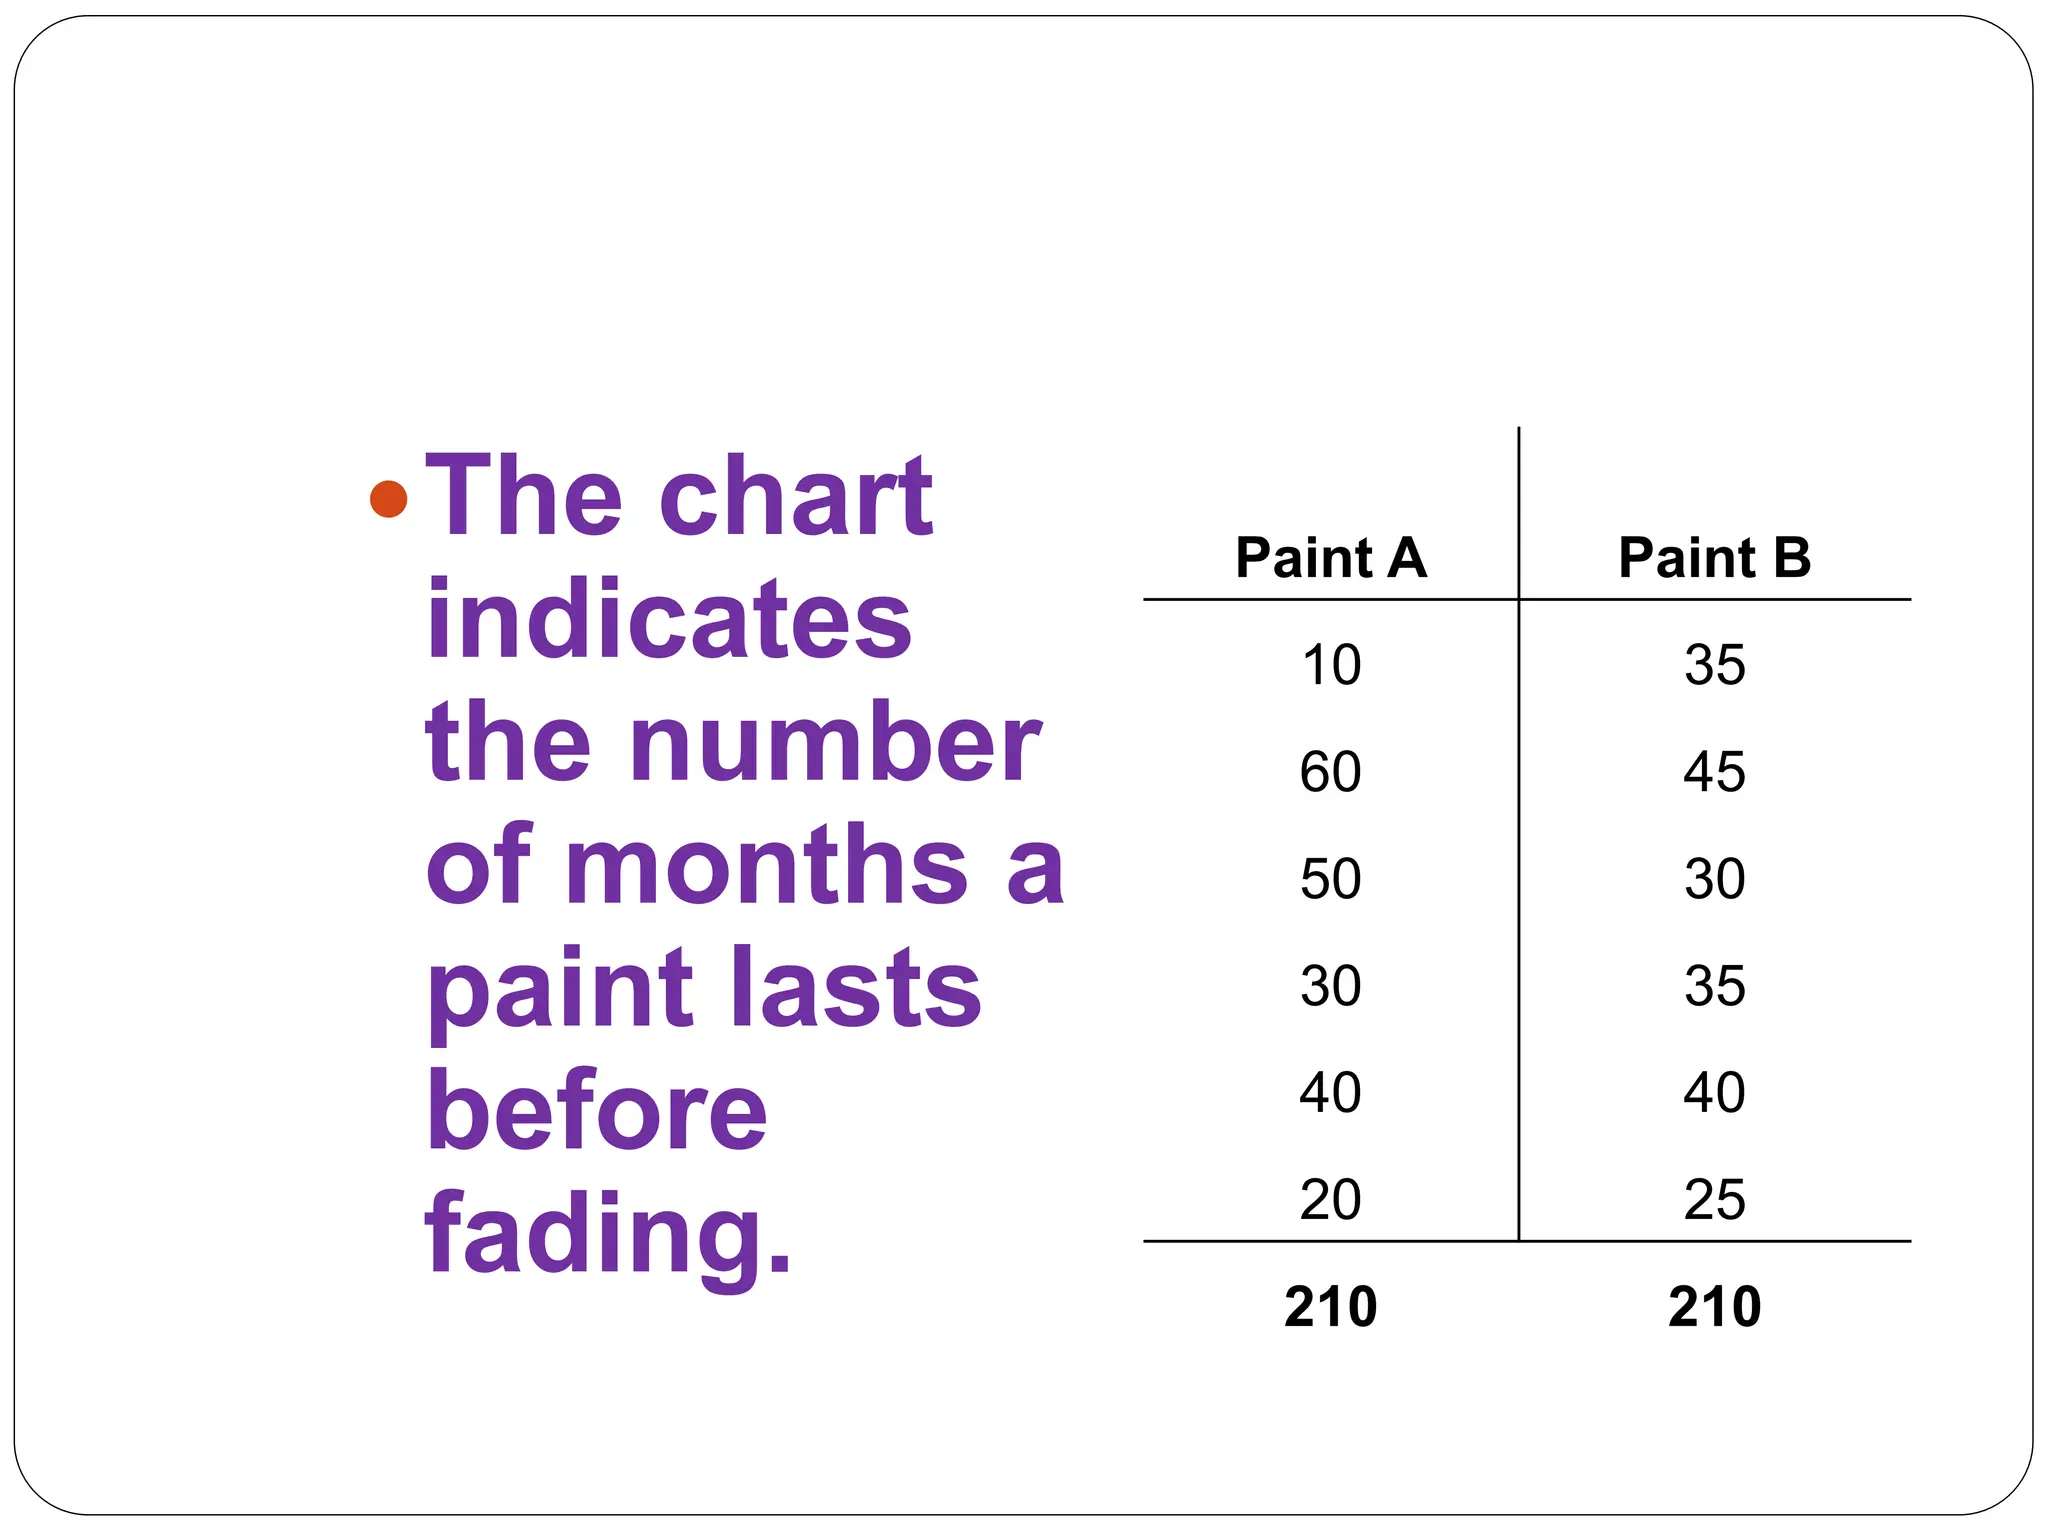
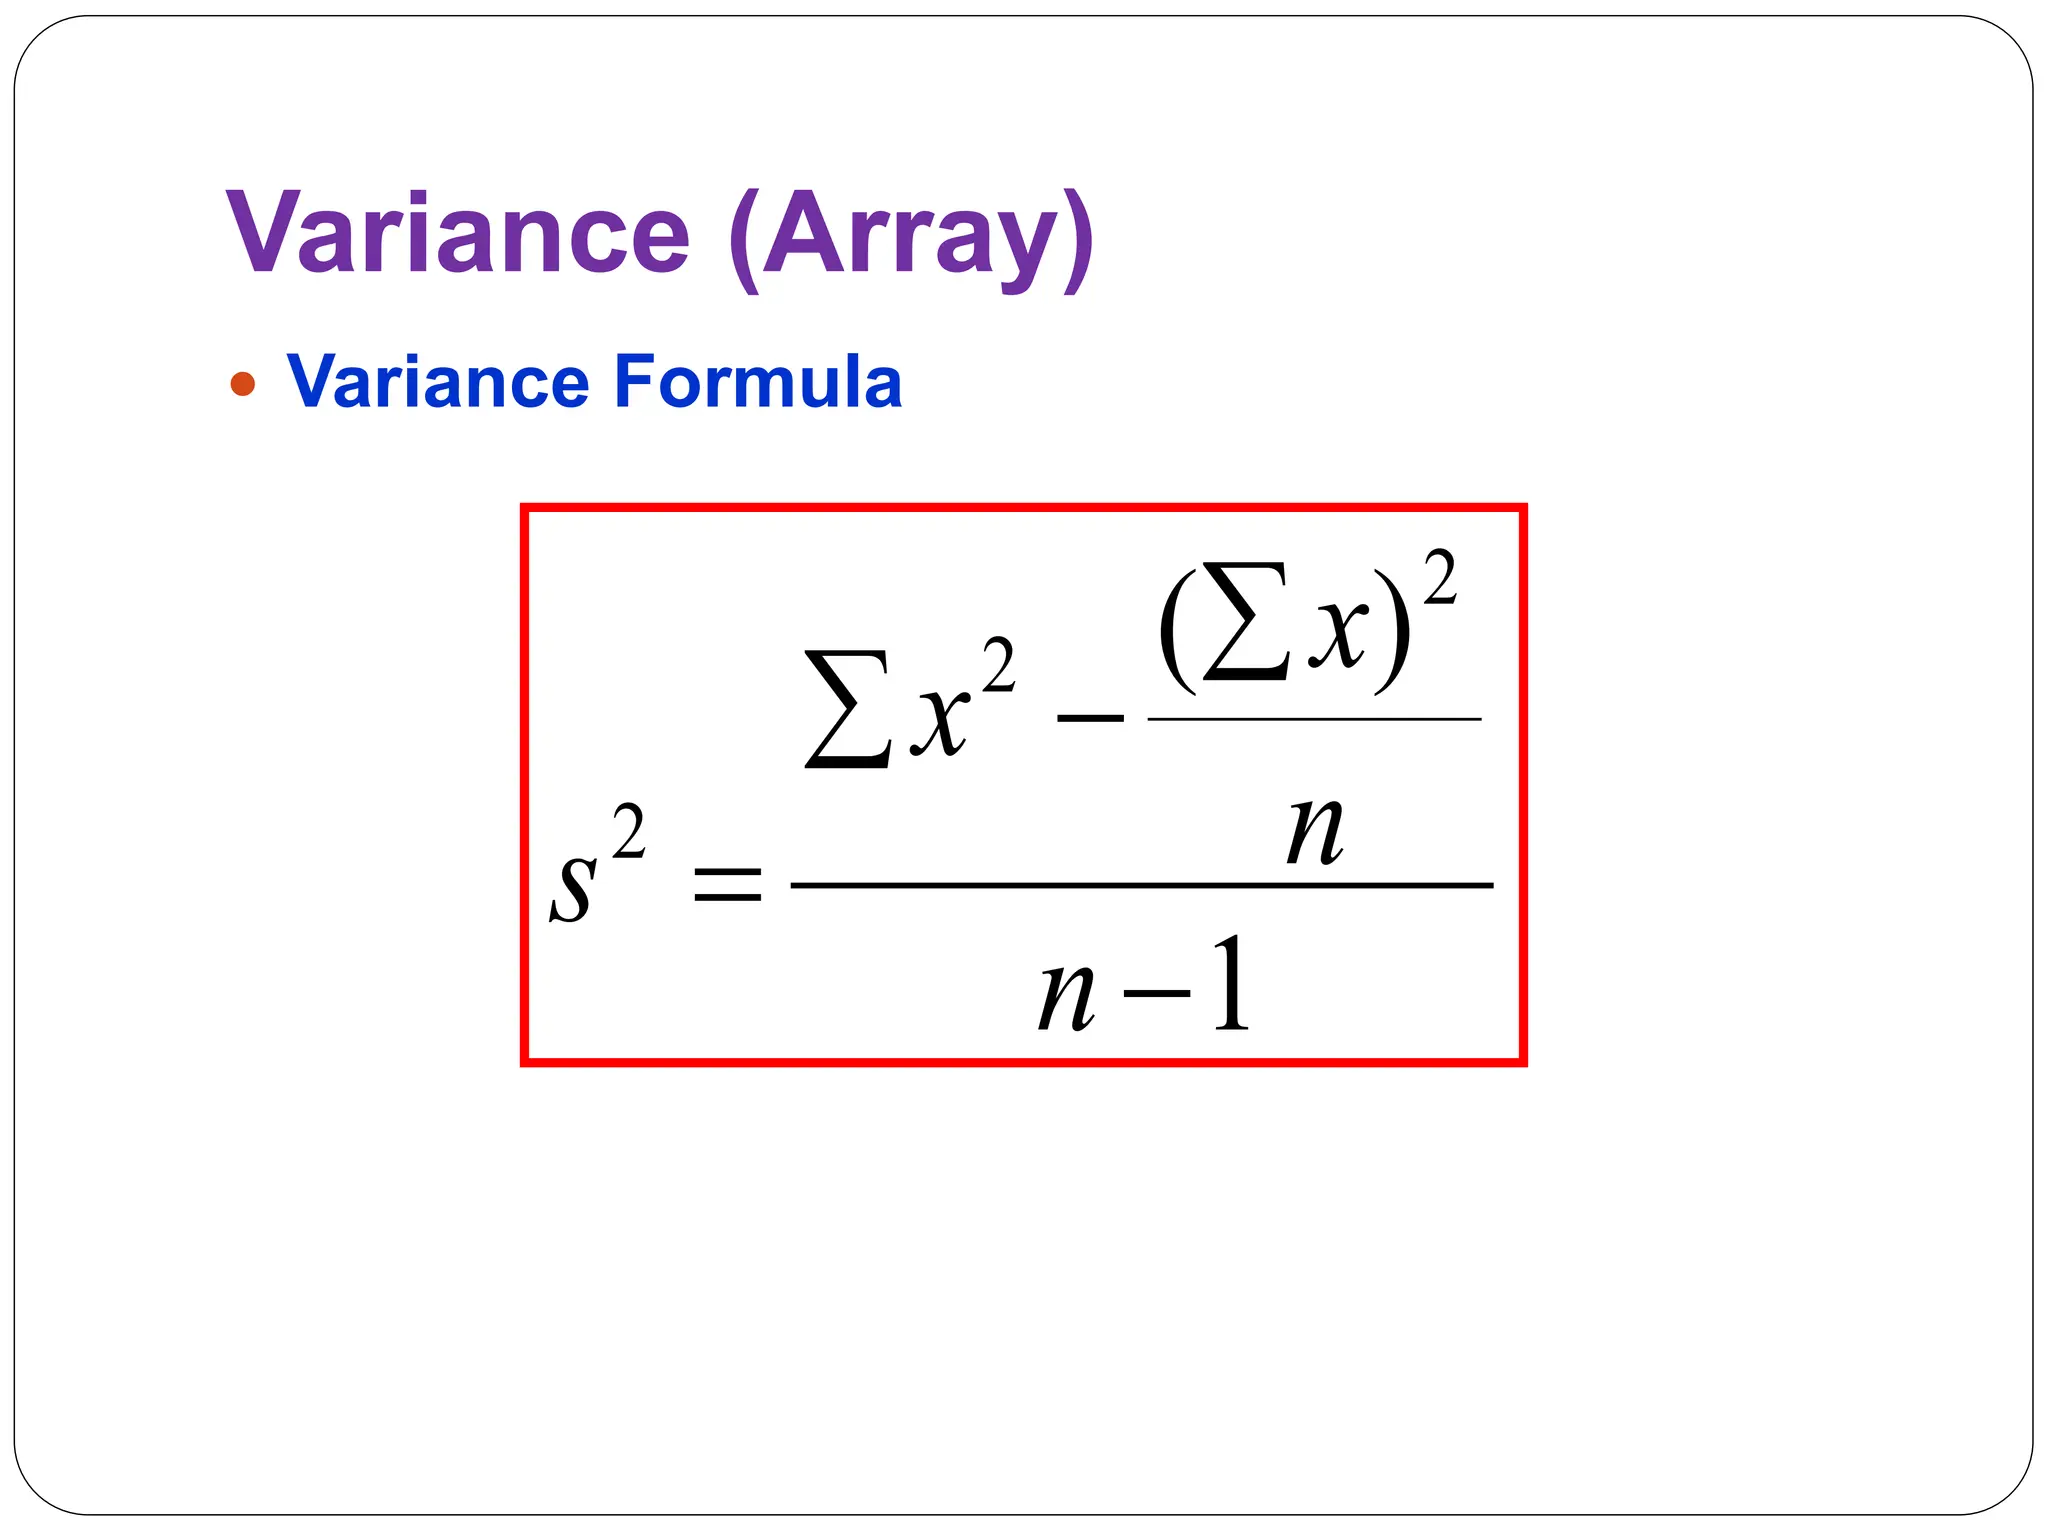
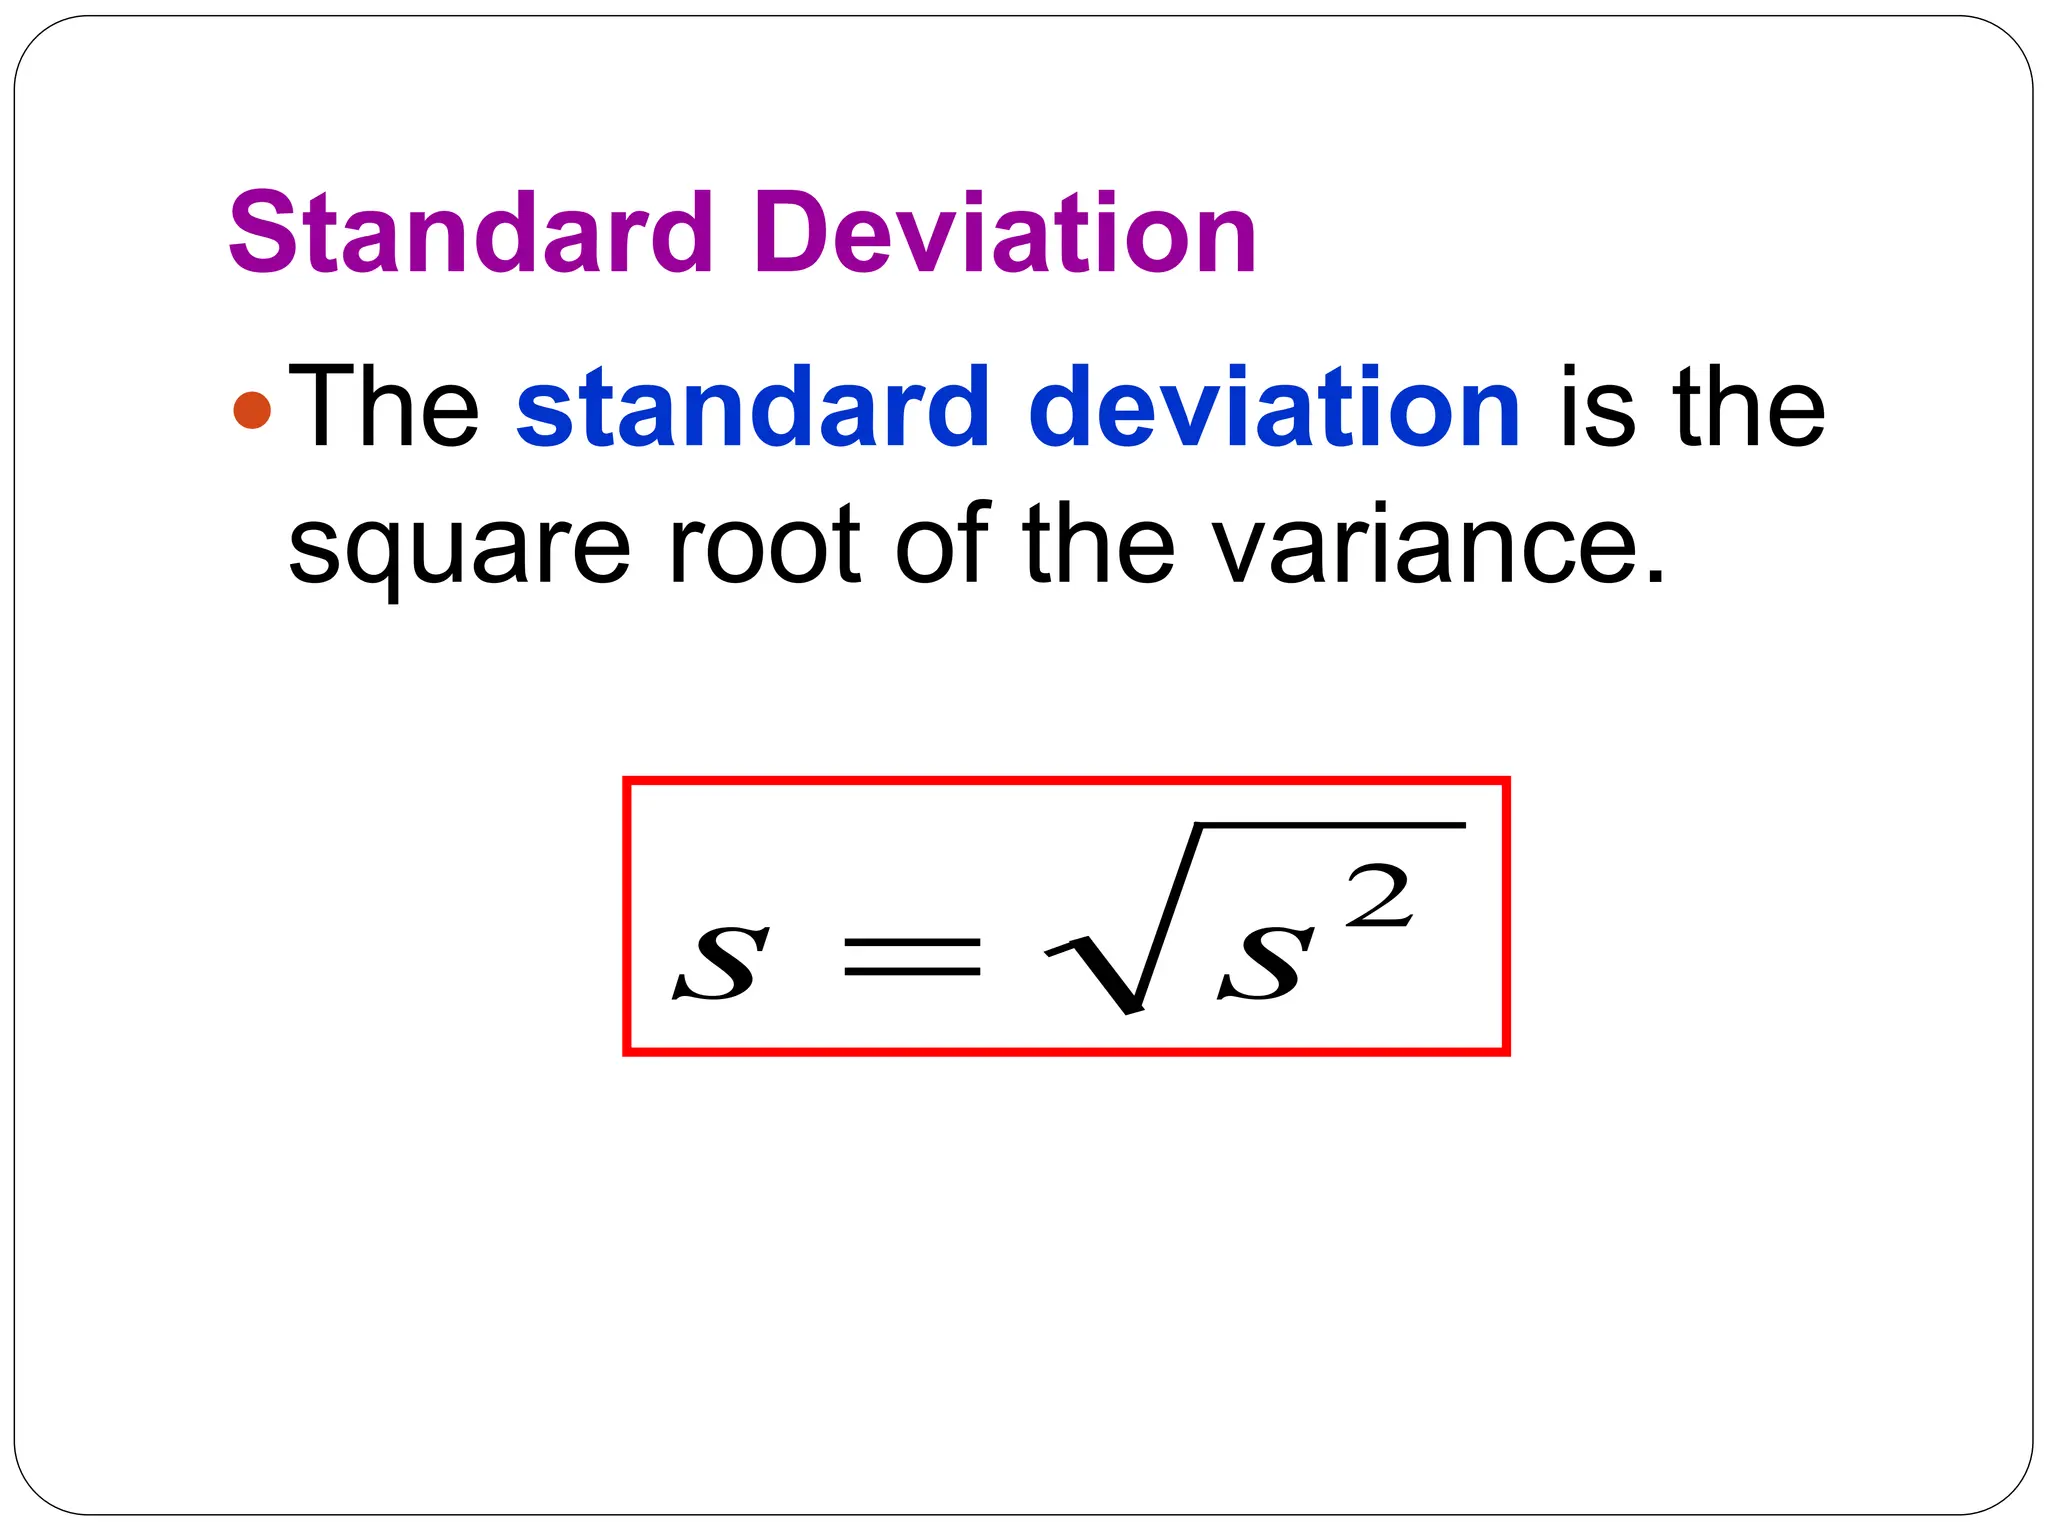
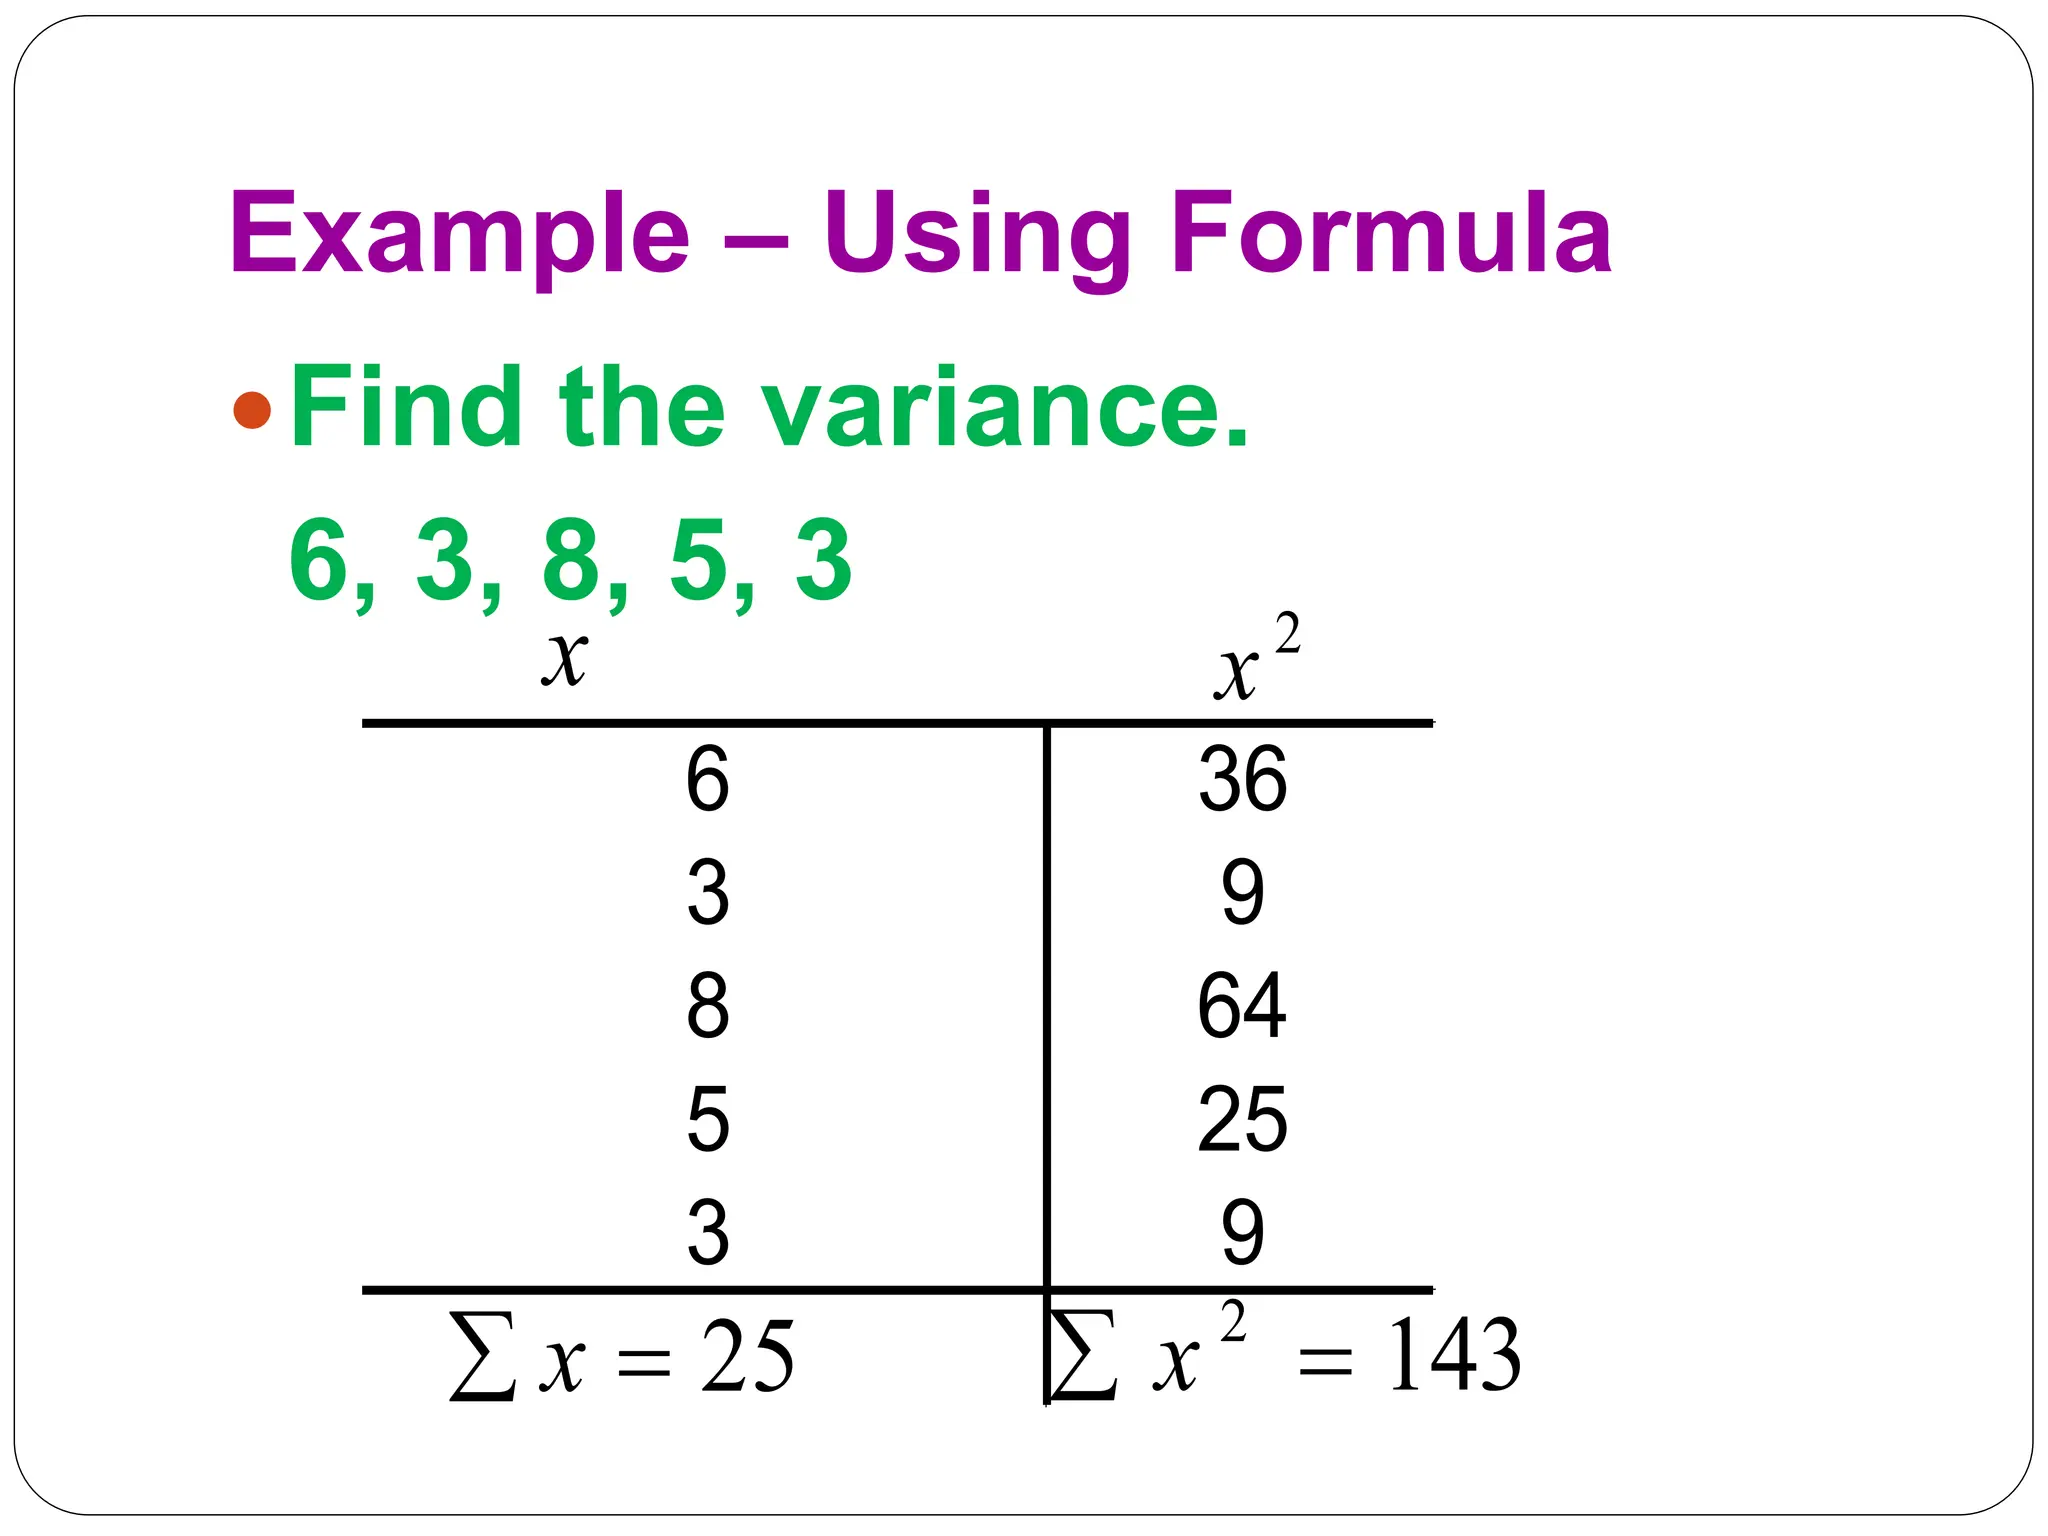
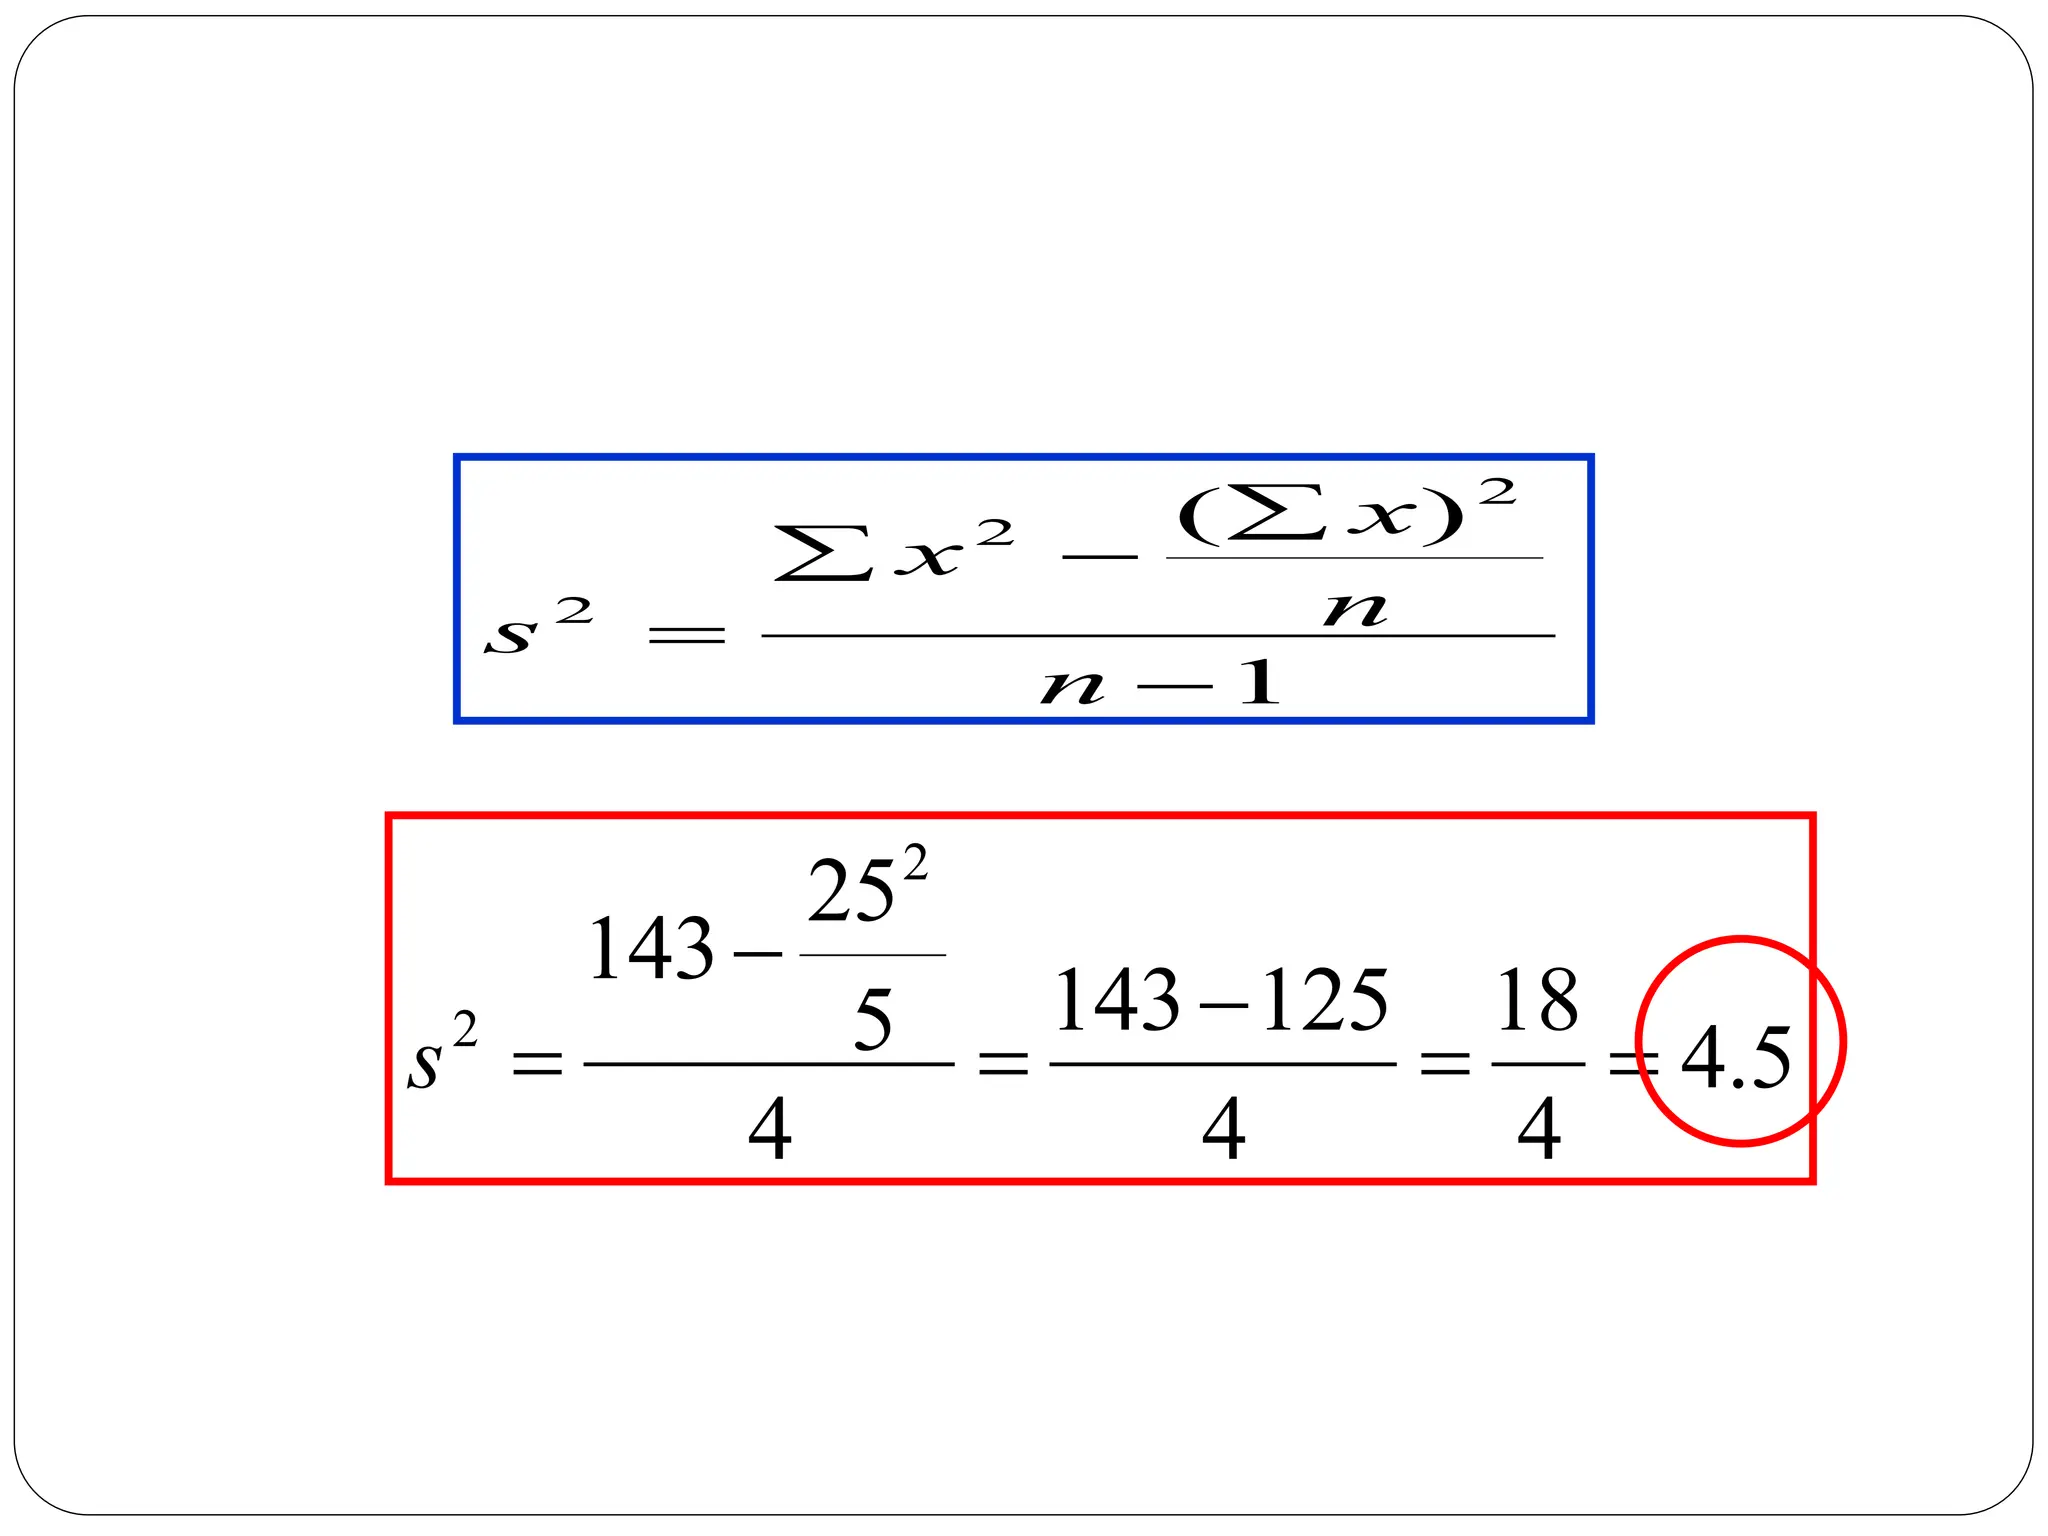
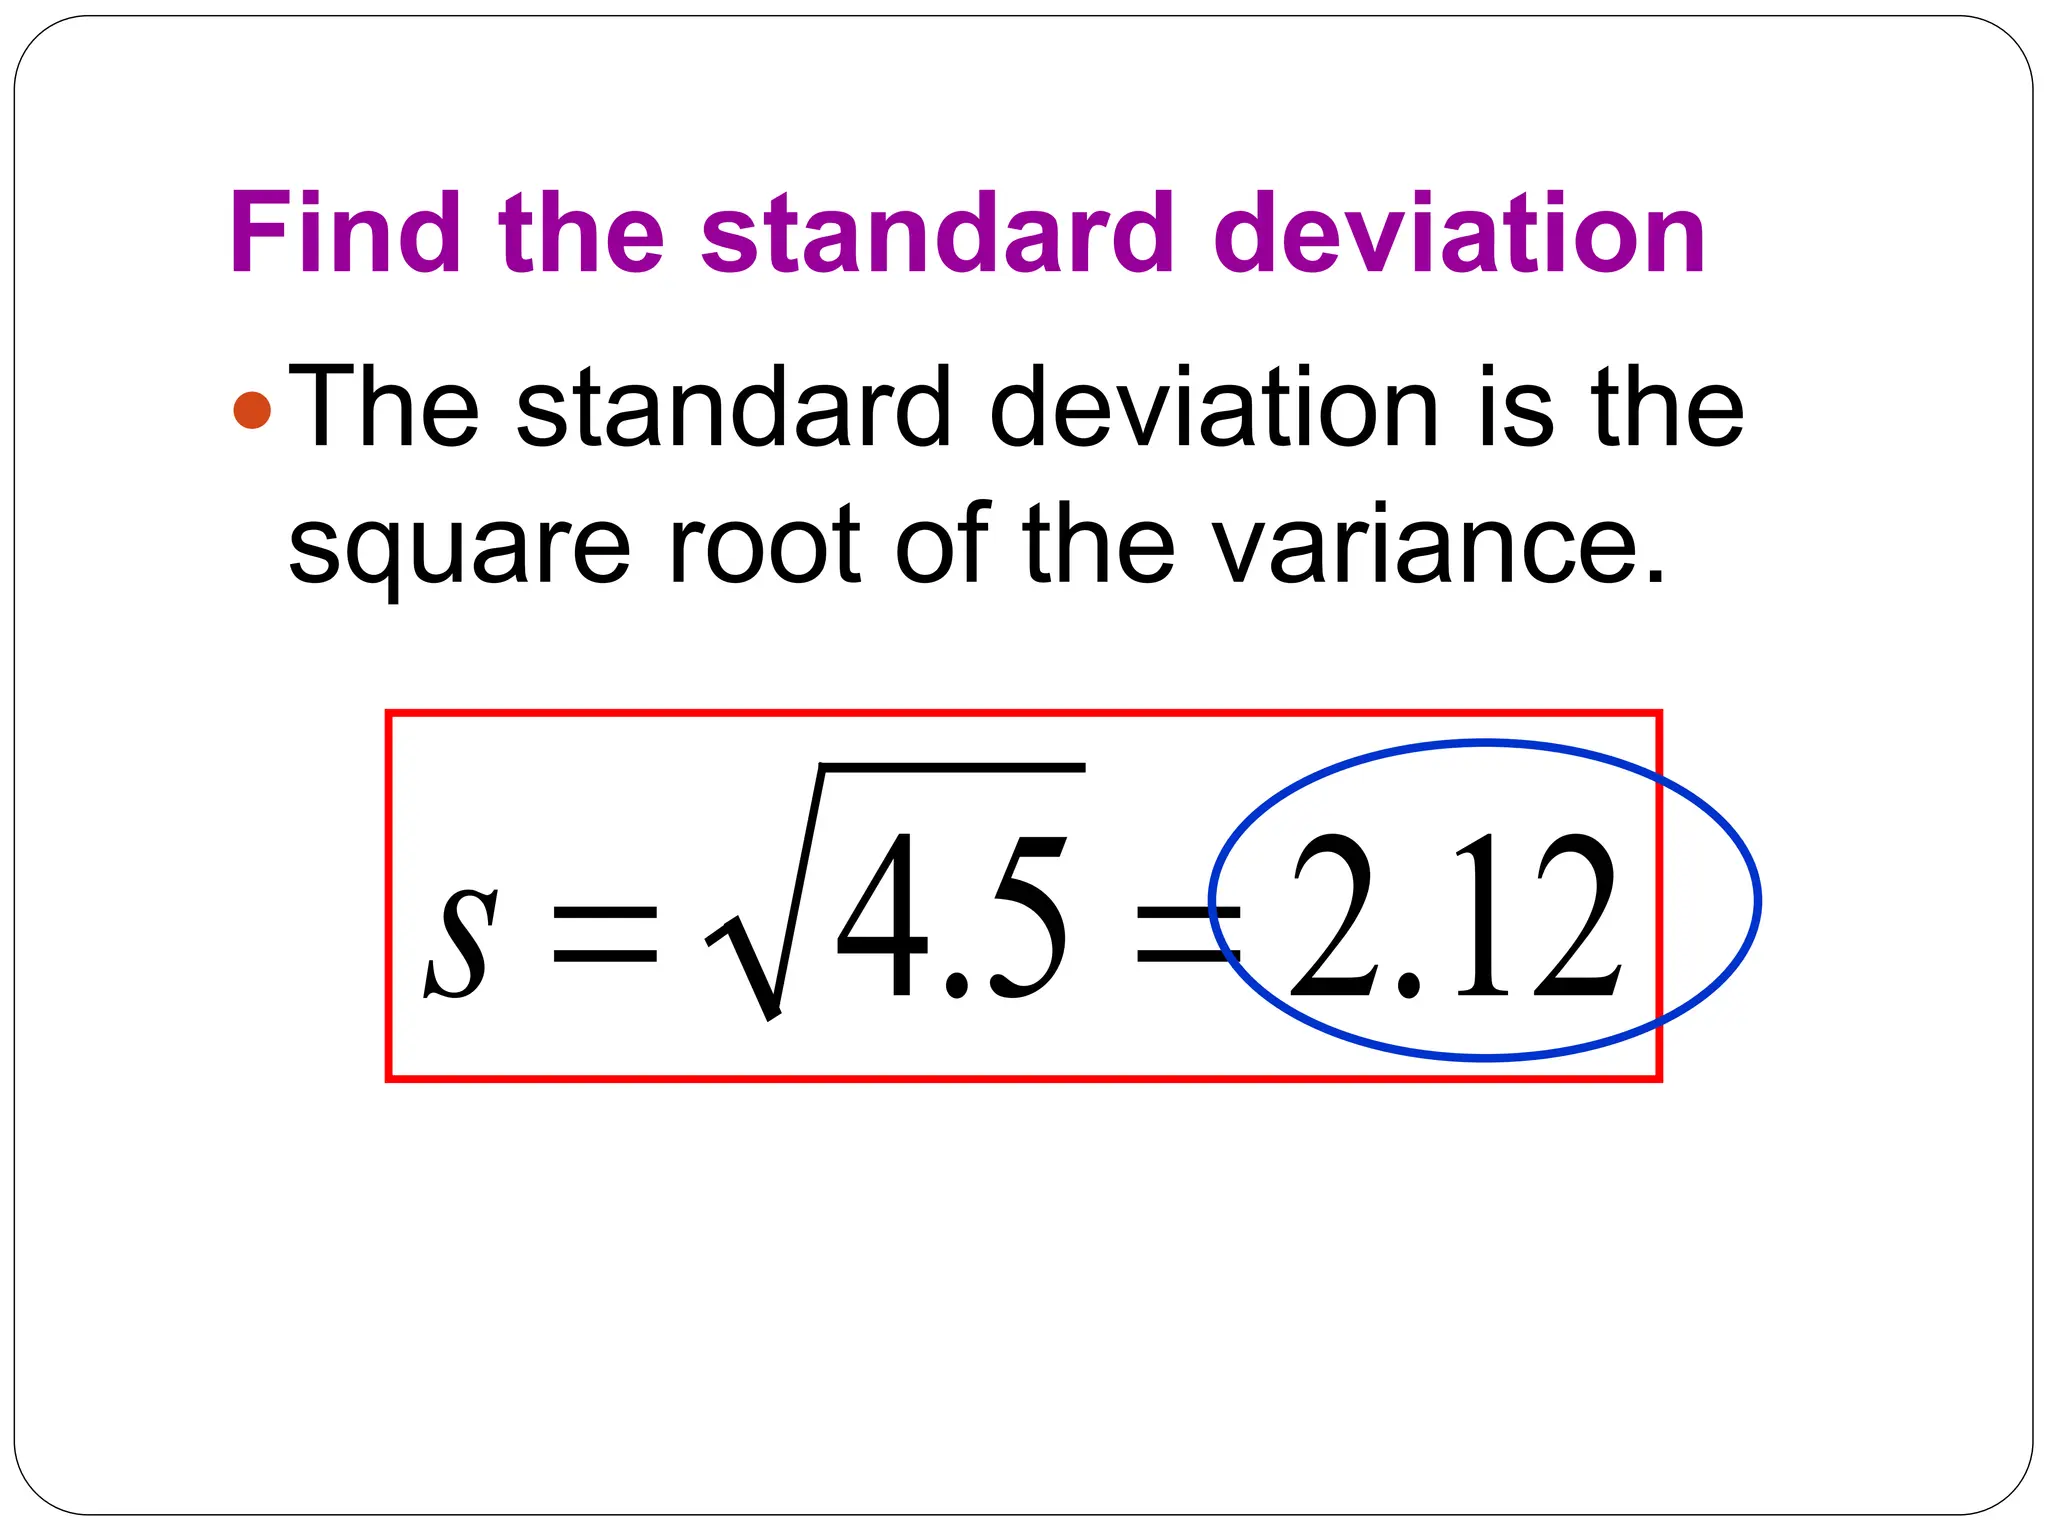
SlideShare a Scribd company logo
1 of 57
Measures of Central Tendency
Objective
To learn how to
find measures of
central tendency
in a set of raw
data.
Relevance
To be able to calculate the
most appropriate measure of
center after analyzing the
context of a study that might
or might not contain extreme
values.
Central Values – Many times one number is used to describe
the entire sample or population. Such a number is called an
average. There are many ways to compute an average.
 There are 4 values that are considered measures
of the center.
1. Mean
2. Median
3. Mode
4. Midrange
Arrays
 Mean – the arithmetic average with which you
are the most familiar.
 Mean:
x
of
number
x
all
of
sum
bar
x 

n
x
x


Sample and Population Symbols
As we progress in this course there
will be different symbols that
represent the same thing. The only
difference is that one comes from a
sample and one comes from a
population.
Symbols for Mean
Sample Mean:
Population Mean:
x

Rounding Rule
Round answers to one decimal
place more than the number of
decimal places in the original
data.
Example: 2, 3, 4, 5, 6, 8
A Sample answer would be 4.1
Example
Find the mean of the array.
4, 3, 8, 9, 1, 7, 12
3
.
6
29
.
6
7
44
7
12
7
1
9
8
3
4












n
x
x
Example…….
Find the mean of the following
numbers.
23, 25, 26, 29, 39, 42, 50
4
.
33
7
234
7
50
42
39
29
26
25
23











x
n
x
x
Example 2 – Use GDC
Find the mean of the array.
2.0, 4.9, 6.5, 2.1, 5.1, 3.2, 16.6
Use your lists on the calculator
and follow the steps.
Stat, Edit – input list
Stat, Calc, One-Var Stats, L1
Or…..(I like this way better!)
Home: 2nd
Stat
Math
3: Mean (L#)
Rounding
The mean (x-bar) is 5.77.
We used 2 decimal places
because our original data had 1
decimal place.
Median
Median – the middle number in
an ordered set of numbers.
Divides the data into two equal
parts.
Odd # in set: falls exactly on the
middle number.
Even # in set: falls in between the
two middle values in the set; find
the average of the two middle
values.
Example
Find the median.
A. 2, 3, 4, 7, 8 - the median
is 4.
B. 6, 7, 8, 9, 9, 10
median = (8+9)/2 = 8.5.
Ex 2 – Use Calculator
Input data into L1.
Run “Stat, Calc, One-Variable
Stats, L1”
Cursor all the way down to
find “med”
Or…….from the home screen
2nd
Stat
Math
4: Median(L#)
Mode
 The number that occurs most
often.
 Suggestion: Sort the numbers in
L1 to make it easier to see the
grouping of the numbers.
 You can have a single number for
the mode, no mode, or more than
one number.
Example
Find the mode.
1, 2, 1, 2, 2, 2, 1, 3, 3
Put numbers in L1 and sort to
see the groupings easier.
The mode is 2.
Ex 2
Find the mode.
A. 0, 1, 2, 3, 4 - no mode
B. 4, 4, 6, 7, 8, 9, 6, 9 - 4 ,6,
and 9
Midrange
The number exactly midway
between the lowest value and
highest value of the data set.
It is found by averaging the low
and high numbers.
2
)
( Value
High
value
Low
midrange


Example
Find the midrange of the set.
3, 3, 5, 6, 8
5
.
5
2
11
2
)
8
3
(




midrange
Trimmed Mean
Trimmed Mean
 We have seen 4 different averages: the
mean, median, mode, and midrange.
For later work, the mean is the most
important.
 However, a disadvantage of the mean is
that it can be affected by extremely high
or low values.
 One way to make the mean more
resistant to exceptional values and still
sensitive to specific data values is to do
How to Compute a 5%
Trimmed Mean
Order the data from smallest to
largest.
Delete the bottom 5% of the data
and the top 5% of the data. (NOTE:
If 5% is a decimal round to the
nearest integer)
Compute the mean of the remaining
Example 80
80
50
50
42
40
40
35
35
35
30
30
30
25
23
20
20
20
20
14
a) Compute the mean for the entire sample.
b) Compute a 5% trimmed mean.
0
.
36
20
719




n
x
x
   
.
80
14
.
1
1
05
.
0
20
:
%
5
AND
REMOVE
SET
THE
OF
BOTTOM
AND
TOP
THE
FROM
VALUE
REMOVE
Trim 
7
.
34
18
625




n
x
x
Example 80
80
50
50
42
40
40
35
35
35
30
30
30
25
23
20
20
20
20
14
c) Compute the median for the entire sample.
d) Compute a 5% trimmed median.
5
.
32
2
35
30



Median
The median is still 32.5.
e) Is the trimmed mean or the original mean closer to the median?
Trimmed Mean
Weighted Average
Sometimes we wish to average
numbers, but we want to assign
more importance, or weight, to
some of the numbers.
The average you need is the
weighted average.
Formula for Weighted Average
w
xw
Average
Weighted



.
.
values
data
all
over
taken
is
sum
The
value
data
that
to
assigned
weight
the
is
w
and
value
data
a
is
x
where
Example:
Suppose your midterm test score is 83
and your final exam score is 95.
Using weights of 40% for the midterm
and 60% for the final exam, compute
The weighted average of your scores.
If the minimum average for an A is
90, will you earn an A?
     
2
.
90
1
57
32
60
.
0
40
.
0
60
.
0
95
40
.
0
83






Average
Weighted You will earn
an A!
Measures of Dispersion…..Arrays
Dispersion
The measure of the spread or
variability
No Variability – No Dispersion
Measures of Variation
There are 3 values used to
measure the amount of
dispersion or variation. (The
spread of the group)
1. Range
2. Variance
3. Standard Deviation
Why is it Important?
You want to choose the best
brand of paint for your house.
You are interested in how long
the paint lasts before it fades
and you must repaint. The
choices are narrowed down to 2
different paints. The results are
shown in the chart. Which
The chart
indicates
the number
of months a
paint lasts
before
fading.
Paint A Paint B
10 35
60 45
50 30
30 35
40 40
20 25
210 210
Does the Average Help?
Paint A: Avg = 210/6 = 35
months
Paint B: Avg = 210/6 = 35
months
They both last 35 months before
fading. No help in deciding
Consider the Spread
Paint A: Spread = 60 – 10 = 50
months
Paint B: Spread = 45 – 25 = 20
months
Paint B has a smaller variance
which means that it performs more
consistently. Choose paint B.
Range
The range is the difference
between the lowest value in
the set and the highest value
in the set.
Range = High # - Low #
Example
Find the range of the data set.
40, 30, 15, 2, 100, 37, 24, 99
Range = 100 – 2 = 98
Deviation from the Mean
 A deviation from the mean, x – x bar, is
the difference between the value of x and
the mean x bar.
We base our formulas for variance and
standard deviation on the amount that
they deviate from the mean.
 We’ll use a shortcut formula – not in
book.
Variance (Array)
 Variance Formula
1
)
( 2
2
2





n
n
x
x
s
Standard Deviation
The standard deviation is the
square root of the variance.
2
s
s 
Example – Using Formula
Find the variance.
6, 3, 8, 5, 3
6 36
3 9
8 64
5 25
3 9
x 2
x
25

 x 143
2

 x
5
.
4
4
18
4
125
143
4
5
25
143
2
2






s
1
)
( 2
2
2





n
n
x
x
s
Find the standard deviation
The standard deviation is the
square root of the variance.
12
.
2
5
.
4 

s
Same Example – Use
Calculator
Put numbers in L1.
Run “Stat, Calc, One-Variable Stats,
L1” and read the numbers. Remember
you have to square the standard
deviation to get variance.
Square this number
to get the variance!
Or….from the home screen
2nd Stat
Math
7:stdDev(L1)
Enter
Variance – Using Formula
Square the ENTIRE number for
the standard deviation not the
rounded version you gave for
your answer.
5
.
4
)
121320344
.
2
( 2
2


s
Variance using GDC
2nd Stat
Math
8: Variance (L1)
UNIT III - Arrays - Measures of Center and Variation (2).ppt

More Related Content

Similar to UNIT III - Arrays - Measures of Center and Variation (2).ppt

Mean_Median_Mode.ppthhhhhhhhhhhhhhhhhhhhhhhhhhhhhhhhhhhhhhhhhhhhhhhhhhhhhhhhh...
Mean_Median_Mode.ppthhhhhhhhhhhhhhhhhhhhhhhhhhhhhhhhhhhhhhhhhhhhhhhhhhhhhhhhh...Mean_Median_Mode.ppthhhhhhhhhhhhhhhhhhhhhhhhhhhhhhhhhhhhhhhhhhhhhhhhhhhhhhhhh...
Mean_Median_Mode.ppthhhhhhhhhhhhhhhhhhhhhhhhhhhhhhhhhhhhhhhhhhhhhhhhhhhhhhhhh...JuliusRomano3
 
Central tendency _dispersion
Central tendency _dispersionCentral tendency _dispersion
Central tendency _dispersionKirti Gupta
 
Class1.ppt
Class1.pptClass1.ppt
Class1.pptGautam G
 
Introduction to Statistics - Basics of Data - Class 1
Introduction to Statistics - Basics of Data - Class 1Introduction to Statistics - Basics of Data - Class 1
Introduction to Statistics - Basics of Data - Class 1RajnishSingh367990
 
STATISTICS BASICS INCLUDING DESCRIPTIVE STATISTICS
STATISTICS BASICS INCLUDING DESCRIPTIVE STATISTICSSTATISTICS BASICS INCLUDING DESCRIPTIVE STATISTICS
STATISTICS BASICS INCLUDING DESCRIPTIVE STATISTICSnagamani651296
 
best for normal distribution.ppt
best for normal distribution.pptbest for normal distribution.ppt
best for normal distribution.pptDejeneDay
 
statical-data-1 to know how to measure.ppt
statical-data-1 to know how to measure.pptstatical-data-1 to know how to measure.ppt
statical-data-1 to know how to measure.pptNazarudinManik1
 
DEMO LESSON PLAN.docx
DEMO LESSON PLAN.docxDEMO LESSON PLAN.docx
DEMO LESSON PLAN.docxChinGa7
 
Module 3 statistics
Module 3   statisticsModule 3   statistics
Module 3 statisticsdionesioable
 
SAMPLING MEAN DEFINITION The term sampling mean is.docx
SAMPLING MEAN  DEFINITION  The term sampling mean is.docxSAMPLING MEAN  DEFINITION  The term sampling mean is.docx
SAMPLING MEAN DEFINITION The term sampling mean is.docxagnesdcarey33086
 
Lesson 3 measures of central tendency
Lesson 3   measures of central tendencyLesson 3   measures of central tendency
Lesson 3 measures of central tendencykarisashley
 
Day 1 - Measures of Position - Quartiles - Percentiles - ZScores-BoxPlots 2.6...
Day 1 - Measures of Position - Quartiles - Percentiles - ZScores-BoxPlots 2.6...Day 1 - Measures of Position - Quartiles - Percentiles - ZScores-BoxPlots 2.6...
Day 1 - Measures of Position - Quartiles - Percentiles - ZScores-BoxPlots 2.6...rich_26
 

Similar to UNIT III - Arrays - Measures of Center and Variation (2).ppt (20)

G7-quantitative
G7-quantitativeG7-quantitative
G7-quantitative
 
Mean_Median_Mode.ppthhhhhhhhhhhhhhhhhhhhhhhhhhhhhhhhhhhhhhhhhhhhhhhhhhhhhhhhh...
Mean_Median_Mode.ppthhhhhhhhhhhhhhhhhhhhhhhhhhhhhhhhhhhhhhhhhhhhhhhhhhhhhhhhh...Mean_Median_Mode.ppthhhhhhhhhhhhhhhhhhhhhhhhhhhhhhhhhhhhhhhhhhhhhhhhhhhhhhhhh...
Mean_Median_Mode.ppthhhhhhhhhhhhhhhhhhhhhhhhhhhhhhhhhhhhhhhhhhhhhhhhhhhhhhhhh...
 
Statistics
StatisticsStatistics
Statistics
 
Central tendency _dispersion
Central tendency _dispersionCentral tendency _dispersion
Central tendency _dispersion
 
Class1.ppt
Class1.pptClass1.ppt
Class1.ppt
 
Class1.ppt
Class1.pptClass1.ppt
Class1.ppt
 
Class1.ppt
Class1.pptClass1.ppt
Class1.ppt
 
Introduction to Statistics - Basics of Data - Class 1
Introduction to Statistics - Basics of Data - Class 1Introduction to Statistics - Basics of Data - Class 1
Introduction to Statistics - Basics of Data - Class 1
 
STATISTICS BASICS INCLUDING DESCRIPTIVE STATISTICS
STATISTICS BASICS INCLUDING DESCRIPTIVE STATISTICSSTATISTICS BASICS INCLUDING DESCRIPTIVE STATISTICS
STATISTICS BASICS INCLUDING DESCRIPTIVE STATISTICS
 
Class1.ppt
Class1.pptClass1.ppt
Class1.ppt
 
Statistics
StatisticsStatistics
Statistics
 
best for normal distribution.ppt
best for normal distribution.pptbest for normal distribution.ppt
best for normal distribution.ppt
 
statical-data-1 to know how to measure.ppt
statical-data-1 to know how to measure.pptstatical-data-1 to know how to measure.ppt
statical-data-1 to know how to measure.ppt
 
Central Tendency.pptx
Central Tendency.pptxCentral Tendency.pptx
Central Tendency.pptx
 
Median
MedianMedian
Median
 
DEMO LESSON PLAN.docx
DEMO LESSON PLAN.docxDEMO LESSON PLAN.docx
DEMO LESSON PLAN.docx
 
Module 3 statistics
Module 3   statisticsModule 3   statistics
Module 3 statistics
 
SAMPLING MEAN DEFINITION The term sampling mean is.docx
SAMPLING MEAN  DEFINITION  The term sampling mean is.docxSAMPLING MEAN  DEFINITION  The term sampling mean is.docx
SAMPLING MEAN DEFINITION The term sampling mean is.docx
 
Lesson 3 measures of central tendency
Lesson 3   measures of central tendencyLesson 3   measures of central tendency
Lesson 3 measures of central tendency
 
Day 1 - Measures of Position - Quartiles - Percentiles - ZScores-BoxPlots 2.6...
Day 1 - Measures of Position - Quartiles - Percentiles - ZScores-BoxPlots 2.6...Day 1 - Measures of Position - Quartiles - Percentiles - ZScores-BoxPlots 2.6...
Day 1 - Measures of Position - Quartiles - Percentiles - ZScores-BoxPlots 2.6...
 

Recently uploaded

Industrialised data - the key to AI success.pdf
Industrialised data - the key to AI success.pdfIndustrialised data - the key to AI success.pdf
Industrialised data - the key to AI success.pdfLars Albertsson
 
DBA Basics: Getting Started with Performance Tuning.pdf
DBA Basics: Getting Started with Performance Tuning.pdfDBA Basics: Getting Started with Performance Tuning.pdf
DBA Basics: Getting Started with Performance Tuning.pdfJohn Sterrett
 
Beautiful Sapna Vip Call Girls Hauz Khas 9711199012 Call /Whatsapps
Beautiful Sapna Vip  Call Girls Hauz Khas 9711199012 Call /WhatsappsBeautiful Sapna Vip  Call Girls Hauz Khas 9711199012 Call /Whatsapps
Beautiful Sapna Vip Call Girls Hauz Khas 9711199012 Call /Whatsappssapnasaifi408
 
办理学位证纽约大学毕业证(NYU毕业证书)原版一比一
办理学位证纽约大学毕业证(NYU毕业证书)原版一比一办理学位证纽约大学毕业证(NYU毕业证书)原版一比一
办理学位证纽约大学毕业证(NYU毕业证书)原版一比一fhwihughh
 
Saket, (-DELHI )+91-9654467111-(=)CHEAP Call Girls in Escorts Service Saket C...
Saket, (-DELHI )+91-9654467111-(=)CHEAP Call Girls in Escorts Service Saket C...Saket, (-DELHI )+91-9654467111-(=)CHEAP Call Girls in Escorts Service Saket C...
Saket, (-DELHI )+91-9654467111-(=)CHEAP Call Girls in Escorts Service Saket C...Sapana Sha
 
Effects of Smartphone Addiction on the Academic Performances of Grades 9 to 1...
Effects of Smartphone Addiction on the Academic Performances of Grades 9 to 1...Effects of Smartphone Addiction on the Academic Performances of Grades 9 to 1...
Effects of Smartphone Addiction on the Academic Performances of Grades 9 to 1...limedy534
 
专业一比一美国俄亥俄大学毕业证成绩单pdf电子版制作修改
专业一比一美国俄亥俄大学毕业证成绩单pdf电子版制作修改专业一比一美国俄亥俄大学毕业证成绩单pdf电子版制作修改
专业一比一美国俄亥俄大学毕业证成绩单pdf电子版制作修改yuu sss
 
NLP Data Science Project Presentation:Predicting Heart Disease with NLP Data ...
NLP Data Science Project Presentation:Predicting Heart Disease with NLP Data ...NLP Data Science Project Presentation:Predicting Heart Disease with NLP Data ...
NLP Data Science Project Presentation:Predicting Heart Disease with NLP Data ...Boston Institute of Analytics
 
办美国阿肯色大学小石城分校毕业证成绩单pdf电子版制作修改#真实留信入库#永久存档#真实可查#diploma#degree
办美国阿肯色大学小石城分校毕业证成绩单pdf电子版制作修改#真实留信入库#永久存档#真实可查#diploma#degree办美国阿肯色大学小石城分校毕业证成绩单pdf电子版制作修改#真实留信入库#永久存档#真实可查#diploma#degree
办美国阿肯色大学小石城分校毕业证成绩单pdf电子版制作修改#真实留信入库#永久存档#真实可查#diploma#degreeyuu sss
 
RABBIT: A CLI tool for identifying bots based on their GitHub events.
RABBIT: A CLI tool for identifying bots based on their GitHub events.RABBIT: A CLI tool for identifying bots based on their GitHub events.
RABBIT: A CLI tool for identifying bots based on their GitHub events.natarajan8993
 
办理(Vancouver毕业证书)加拿大温哥华岛大学毕业证成绩单原版一比一
办理(Vancouver毕业证书)加拿大温哥华岛大学毕业证成绩单原版一比一办理(Vancouver毕业证书)加拿大温哥华岛大学毕业证成绩单原版一比一
办理(Vancouver毕业证书)加拿大温哥华岛大学毕业证成绩单原版一比一F La
 
20240419 - Measurecamp Amsterdam - SAM.pdf
20240419 - Measurecamp Amsterdam - SAM.pdf20240419 - Measurecamp Amsterdam - SAM.pdf
20240419 - Measurecamp Amsterdam - SAM.pdfHuman37
 
9711147426✨Call In girls Gurgaon Sector 31. SCO 25 escort service
9711147426✨Call In girls Gurgaon Sector 31. SCO 25 escort service9711147426✨Call In girls Gurgaon Sector 31. SCO 25 escort service
9711147426✨Call In girls Gurgaon Sector 31. SCO 25 escort servicejennyeacort
 
04242024_CCC TUG_Joins and Relationships
04242024_CCC TUG_Joins and Relationships04242024_CCC TUG_Joins and Relationships
04242024_CCC TUG_Joins and Relationshipsccctableauusergroup
 
Generative AI for Social Good at Open Data Science East 2024
Generative AI for Social Good at Open Data Science East 2024Generative AI for Social Good at Open Data Science East 2024
Generative AI for Social Good at Open Data Science East 2024Colleen Farrelly
 
科罗拉多大学波尔得分校毕业证学位证成绩单-可办理
科罗拉多大学波尔得分校毕业证学位证成绩单-可办理科罗拉多大学波尔得分校毕业证学位证成绩单-可办理
科罗拉多大学波尔得分校毕业证学位证成绩单-可办理e4aez8ss
 
Kantar AI Summit- Under Embargo till Wednesday, 24th April 2024, 4 PM, IST.pdf
Kantar AI Summit- Under Embargo till Wednesday, 24th April 2024, 4 PM, IST.pdfKantar AI Summit- Under Embargo till Wednesday, 24th April 2024, 4 PM, IST.pdf
Kantar AI Summit- Under Embargo till Wednesday, 24th April 2024, 4 PM, IST.pdfSocial Samosa
 
dokumen.tips_chapter-4-transient-heat-conduction-mehmet-kanoglu.ppt
dokumen.tips_chapter-4-transient-heat-conduction-mehmet-kanoglu.pptdokumen.tips_chapter-4-transient-heat-conduction-mehmet-kanoglu.ppt
dokumen.tips_chapter-4-transient-heat-conduction-mehmet-kanoglu.pptSonatrach
 

Recently uploaded (20)

Industrialised data - the key to AI success.pdf
Industrialised data - the key to AI success.pdfIndustrialised data - the key to AI success.pdf
Industrialised data - the key to AI success.pdf
 
DBA Basics: Getting Started with Performance Tuning.pdf
DBA Basics: Getting Started with Performance Tuning.pdfDBA Basics: Getting Started with Performance Tuning.pdf
DBA Basics: Getting Started with Performance Tuning.pdf
 
Beautiful Sapna Vip Call Girls Hauz Khas 9711199012 Call /Whatsapps
Beautiful Sapna Vip  Call Girls Hauz Khas 9711199012 Call /WhatsappsBeautiful Sapna Vip  Call Girls Hauz Khas 9711199012 Call /Whatsapps
Beautiful Sapna Vip Call Girls Hauz Khas 9711199012 Call /Whatsapps
 
办理学位证纽约大学毕业证(NYU毕业证书)原版一比一
办理学位证纽约大学毕业证(NYU毕业证书)原版一比一办理学位证纽约大学毕业证(NYU毕业证书)原版一比一
办理学位证纽约大学毕业证(NYU毕业证书)原版一比一
 
Saket, (-DELHI )+91-9654467111-(=)CHEAP Call Girls in Escorts Service Saket C...
Saket, (-DELHI )+91-9654467111-(=)CHEAP Call Girls in Escorts Service Saket C...Saket, (-DELHI )+91-9654467111-(=)CHEAP Call Girls in Escorts Service Saket C...
Saket, (-DELHI )+91-9654467111-(=)CHEAP Call Girls in Escorts Service Saket C...
 
Effects of Smartphone Addiction on the Academic Performances of Grades 9 to 1...
Effects of Smartphone Addiction on the Academic Performances of Grades 9 to 1...Effects of Smartphone Addiction on the Academic Performances of Grades 9 to 1...
Effects of Smartphone Addiction on the Academic Performances of Grades 9 to 1...
 
专业一比一美国俄亥俄大学毕业证成绩单pdf电子版制作修改
专业一比一美国俄亥俄大学毕业证成绩单pdf电子版制作修改专业一比一美国俄亥俄大学毕业证成绩单pdf电子版制作修改
专业一比一美国俄亥俄大学毕业证成绩单pdf电子版制作修改
 
NLP Data Science Project Presentation:Predicting Heart Disease with NLP Data ...
NLP Data Science Project Presentation:Predicting Heart Disease with NLP Data ...NLP Data Science Project Presentation:Predicting Heart Disease with NLP Data ...
NLP Data Science Project Presentation:Predicting Heart Disease with NLP Data ...
 
办美国阿肯色大学小石城分校毕业证成绩单pdf电子版制作修改#真实留信入库#永久存档#真实可查#diploma#degree
办美国阿肯色大学小石城分校毕业证成绩单pdf电子版制作修改#真实留信入库#永久存档#真实可查#diploma#degree办美国阿肯色大学小石城分校毕业证成绩单pdf电子版制作修改#真实留信入库#永久存档#真实可查#diploma#degree
办美国阿肯色大学小石城分校毕业证成绩单pdf电子版制作修改#真实留信入库#永久存档#真实可查#diploma#degree
 
RABBIT: A CLI tool for identifying bots based on their GitHub events.
RABBIT: A CLI tool for identifying bots based on their GitHub events.RABBIT: A CLI tool for identifying bots based on their GitHub events.
RABBIT: A CLI tool for identifying bots based on their GitHub events.
 
办理(Vancouver毕业证书)加拿大温哥华岛大学毕业证成绩单原版一比一
办理(Vancouver毕业证书)加拿大温哥华岛大学毕业证成绩单原版一比一办理(Vancouver毕业证书)加拿大温哥华岛大学毕业证成绩单原版一比一
办理(Vancouver毕业证书)加拿大温哥华岛大学毕业证成绩单原版一比一
 
20240419 - Measurecamp Amsterdam - SAM.pdf
20240419 - Measurecamp Amsterdam - SAM.pdf20240419 - Measurecamp Amsterdam - SAM.pdf
20240419 - Measurecamp Amsterdam - SAM.pdf
 
E-Commerce Order PredictionShraddha Kamble.pptx
E-Commerce Order PredictionShraddha Kamble.pptxE-Commerce Order PredictionShraddha Kamble.pptx
E-Commerce Order PredictionShraddha Kamble.pptx
 
9711147426✨Call In girls Gurgaon Sector 31. SCO 25 escort service
9711147426✨Call In girls Gurgaon Sector 31. SCO 25 escort service9711147426✨Call In girls Gurgaon Sector 31. SCO 25 escort service
9711147426✨Call In girls Gurgaon Sector 31. SCO 25 escort service
 
04242024_CCC TUG_Joins and Relationships
04242024_CCC TUG_Joins and Relationships04242024_CCC TUG_Joins and Relationships
04242024_CCC TUG_Joins and Relationships
 
Generative AI for Social Good at Open Data Science East 2024
Generative AI for Social Good at Open Data Science East 2024Generative AI for Social Good at Open Data Science East 2024
Generative AI for Social Good at Open Data Science East 2024
 
Call Girls in Saket 99530🔝 56974 Escort Service
Call Girls in Saket 99530🔝 56974 Escort ServiceCall Girls in Saket 99530🔝 56974 Escort Service
Call Girls in Saket 99530🔝 56974 Escort Service
 
科罗拉多大学波尔得分校毕业证学位证成绩单-可办理
科罗拉多大学波尔得分校毕业证学位证成绩单-可办理科罗拉多大学波尔得分校毕业证学位证成绩单-可办理
科罗拉多大学波尔得分校毕业证学位证成绩单-可办理
 
Kantar AI Summit- Under Embargo till Wednesday, 24th April 2024, 4 PM, IST.pdf
Kantar AI Summit- Under Embargo till Wednesday, 24th April 2024, 4 PM, IST.pdfKantar AI Summit- Under Embargo till Wednesday, 24th April 2024, 4 PM, IST.pdf
Kantar AI Summit- Under Embargo till Wednesday, 24th April 2024, 4 PM, IST.pdf
 
dokumen.tips_chapter-4-transient-heat-conduction-mehmet-kanoglu.ppt
dokumen.tips_chapter-4-transient-heat-conduction-mehmet-kanoglu.pptdokumen.tips_chapter-4-transient-heat-conduction-mehmet-kanoglu.ppt
dokumen.tips_chapter-4-transient-heat-conduction-mehmet-kanoglu.ppt
 

UNIT III - Arrays - Measures of Center and Variation (2).ppt

  • 2. Objective To learn how to find measures of central tendency in a set of raw data.
  • 3. Relevance To be able to calculate the most appropriate measure of center after analyzing the context of a study that might or might not contain extreme values.
  • 4. Central Values – Many times one number is used to describe the entire sample or population. Such a number is called an average. There are many ways to compute an average.  There are 4 values that are considered measures of the center. 1. Mean 2. Median 3. Mode 4. Midrange
  • 5. Arrays  Mean – the arithmetic average with which you are the most familiar.  Mean: x of number x all of sum bar x   n x x  
  • 6. Sample and Population Symbols As we progress in this course there will be different symbols that represent the same thing. The only difference is that one comes from a sample and one comes from a population.
  • 7. Symbols for Mean Sample Mean: Population Mean: x 
  • 8. Rounding Rule Round answers to one decimal place more than the number of decimal places in the original data. Example: 2, 3, 4, 5, 6, 8 A Sample answer would be 4.1
  • 9. Example Find the mean of the array. 4, 3, 8, 9, 1, 7, 12 3 . 6 29 . 6 7 44 7 12 7 1 9 8 3 4             n x x
  • 10. Example……. Find the mean of the following numbers. 23, 25, 26, 29, 39, 42, 50 4 . 33 7 234 7 50 42 39 29 26 25 23            x n x x
  • 11. Example 2 – Use GDC Find the mean of the array. 2.0, 4.9, 6.5, 2.1, 5.1, 3.2, 16.6 Use your lists on the calculator and follow the steps.
  • 12. Stat, Edit – input list
  • 13. Stat, Calc, One-Var Stats, L1
  • 14. Or…..(I like this way better!) Home: 2nd Stat Math 3: Mean (L#)
  • 15. Rounding The mean (x-bar) is 5.77. We used 2 decimal places because our original data had 1 decimal place.
  • 16. Median Median – the middle number in an ordered set of numbers. Divides the data into two equal parts. Odd # in set: falls exactly on the middle number. Even # in set: falls in between the two middle values in the set; find the average of the two middle values.
  • 17. Example Find the median. A. 2, 3, 4, 7, 8 - the median is 4. B. 6, 7, 8, 9, 9, 10 median = (8+9)/2 = 8.5.
  • 18. Ex 2 – Use Calculator Input data into L1.
  • 19. Run “Stat, Calc, One-Variable Stats, L1” Cursor all the way down to find “med”
  • 20. Or…….from the home screen 2nd Stat Math 4: Median(L#)
  • 21. Mode  The number that occurs most often.  Suggestion: Sort the numbers in L1 to make it easier to see the grouping of the numbers.  You can have a single number for the mode, no mode, or more than one number.
  • 22. Example Find the mode. 1, 2, 1, 2, 2, 2, 1, 3, 3 Put numbers in L1 and sort to see the groupings easier.
  • 24. Ex 2 Find the mode. A. 0, 1, 2, 3, 4 - no mode B. 4, 4, 6, 7, 8, 9, 6, 9 - 4 ,6, and 9
  • 25. Midrange The number exactly midway between the lowest value and highest value of the data set. It is found by averaging the low and high numbers. 2 ) ( Value High value Low midrange  
  • 26. Example Find the midrange of the set. 3, 3, 5, 6, 8 5 . 5 2 11 2 ) 8 3 (     midrange
  • 28. Trimmed Mean  We have seen 4 different averages: the mean, median, mode, and midrange. For later work, the mean is the most important.  However, a disadvantage of the mean is that it can be affected by extremely high or low values.  One way to make the mean more resistant to exceptional values and still sensitive to specific data values is to do
  • 29. How to Compute a 5% Trimmed Mean Order the data from smallest to largest. Delete the bottom 5% of the data and the top 5% of the data. (NOTE: If 5% is a decimal round to the nearest integer) Compute the mean of the remaining
  • 30. Example 80 80 50 50 42 40 40 35 35 35 30 30 30 25 23 20 20 20 20 14 a) Compute the mean for the entire sample. b) Compute a 5% trimmed mean. 0 . 36 20 719     n x x     . 80 14 . 1 1 05 . 0 20 : % 5 AND REMOVE SET THE OF BOTTOM AND TOP THE FROM VALUE REMOVE Trim  7 . 34 18 625     n x x
  • 31. Example 80 80 50 50 42 40 40 35 35 35 30 30 30 25 23 20 20 20 20 14 c) Compute the median for the entire sample. d) Compute a 5% trimmed median. 5 . 32 2 35 30    Median The median is still 32.5. e) Is the trimmed mean or the original mean closer to the median? Trimmed Mean
  • 33. Sometimes we wish to average numbers, but we want to assign more importance, or weight, to some of the numbers. The average you need is the weighted average.
  • 34. Formula for Weighted Average w xw Average Weighted    . . values data all over taken is sum The value data that to assigned weight the is w and value data a is x where
  • 35. Example: Suppose your midterm test score is 83 and your final exam score is 95. Using weights of 40% for the midterm and 60% for the final exam, compute The weighted average of your scores. If the minimum average for an A is 90, will you earn an A?       2 . 90 1 57 32 60 . 0 40 . 0 60 . 0 95 40 . 0 83       Average Weighted You will earn an A!
  • 37. Dispersion The measure of the spread or variability No Variability – No Dispersion
  • 38. Measures of Variation There are 3 values used to measure the amount of dispersion or variation. (The spread of the group) 1. Range 2. Variance 3. Standard Deviation
  • 39. Why is it Important? You want to choose the best brand of paint for your house. You are interested in how long the paint lasts before it fades and you must repaint. The choices are narrowed down to 2 different paints. The results are shown in the chart. Which
  • 40. The chart indicates the number of months a paint lasts before fading. Paint A Paint B 10 35 60 45 50 30 30 35 40 40 20 25 210 210
  • 41. Does the Average Help? Paint A: Avg = 210/6 = 35 months Paint B: Avg = 210/6 = 35 months They both last 35 months before fading. No help in deciding
  • 42. Consider the Spread Paint A: Spread = 60 – 10 = 50 months Paint B: Spread = 45 – 25 = 20 months Paint B has a smaller variance which means that it performs more consistently. Choose paint B.
  • 43. Range The range is the difference between the lowest value in the set and the highest value in the set. Range = High # - Low #
  • 44. Example Find the range of the data set. 40, 30, 15, 2, 100, 37, 24, 99 Range = 100 – 2 = 98
  • 45. Deviation from the Mean  A deviation from the mean, x – x bar, is the difference between the value of x and the mean x bar. We base our formulas for variance and standard deviation on the amount that they deviate from the mean.  We’ll use a shortcut formula – not in book.
  • 46. Variance (Array)  Variance Formula 1 ) ( 2 2 2      n n x x s
  • 47. Standard Deviation The standard deviation is the square root of the variance. 2 s s 
  • 48. Example – Using Formula Find the variance. 6, 3, 8, 5, 3 6 36 3 9 8 64 5 25 3 9 x 2 x 25   x 143 2   x
  • 50. Find the standard deviation The standard deviation is the square root of the variance. 12 . 2 5 . 4   s
  • 51. Same Example – Use Calculator Put numbers in L1.
  • 52. Run “Stat, Calc, One-Variable Stats, L1” and read the numbers. Remember you have to square the standard deviation to get variance. Square this number to get the variance!
  • 53. Or….from the home screen 2nd Stat Math 7:stdDev(L1) Enter
  • 54. Variance – Using Formula Square the ENTIRE number for the standard deviation not the rounded version you gave for your answer. 5 . 4 ) 121320344 . 2 ( 2 2   s
  • 55. Variance using GDC 2nd Stat Math 8: Variance (L1)