Downloaded 126 times


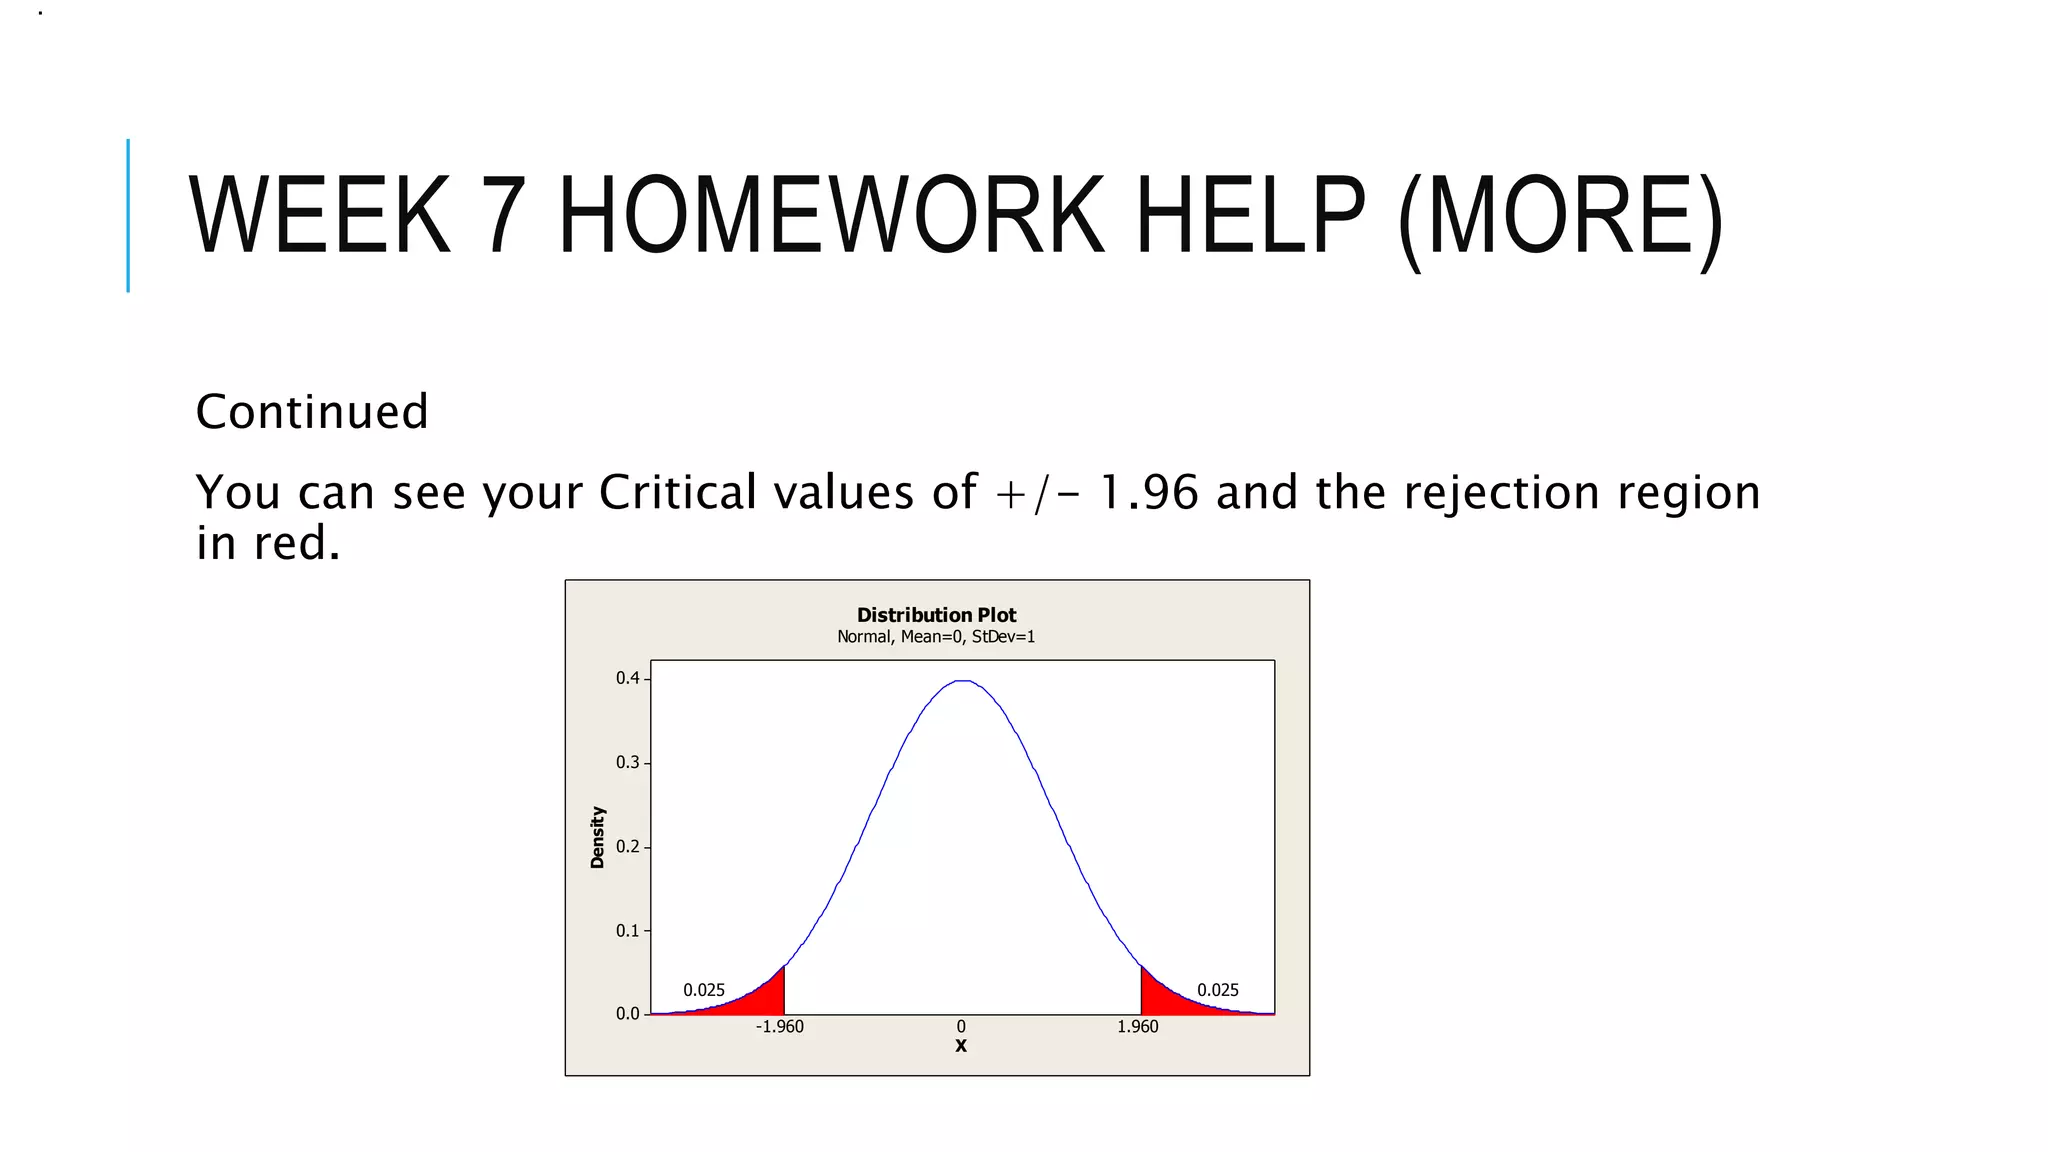


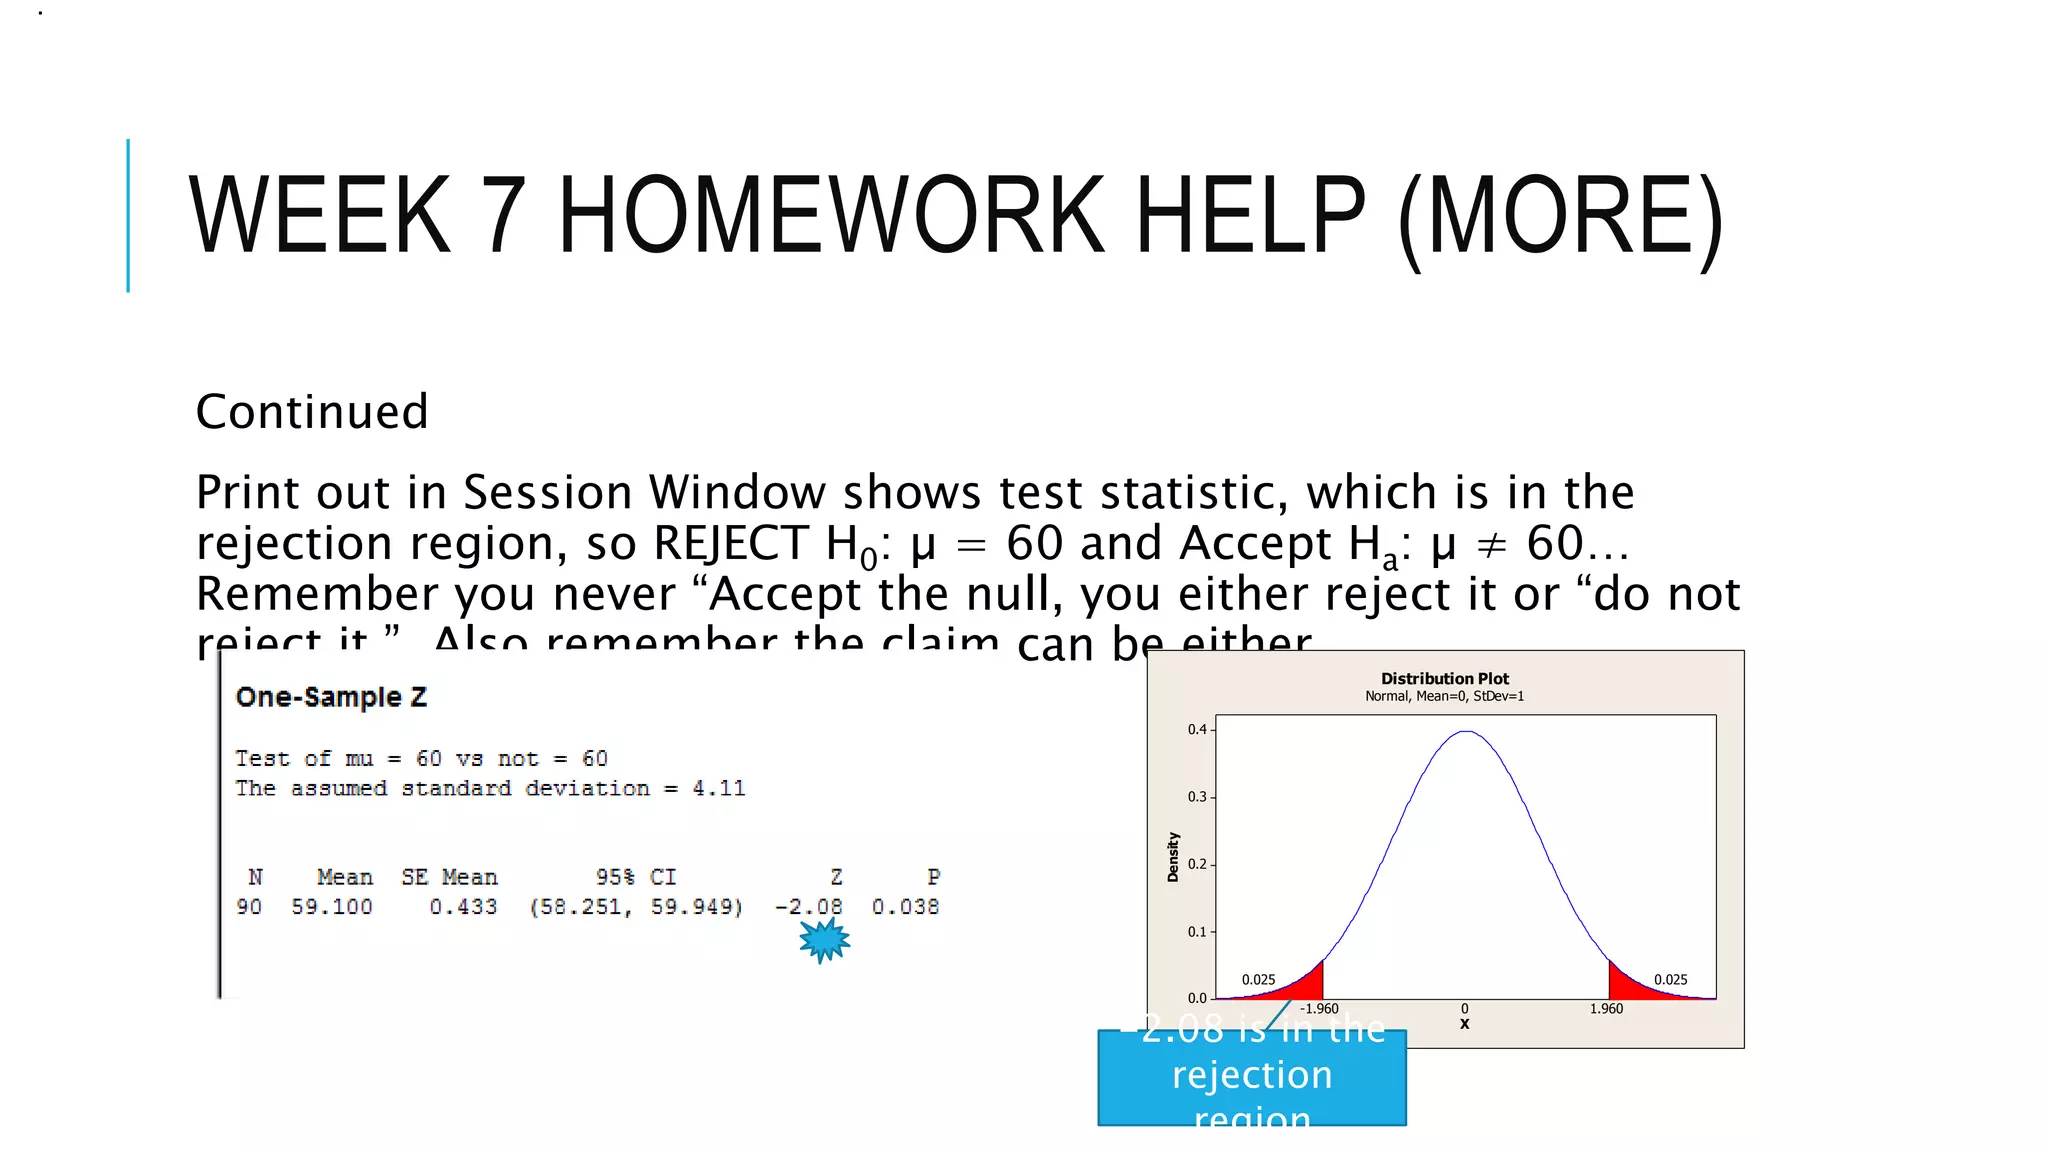


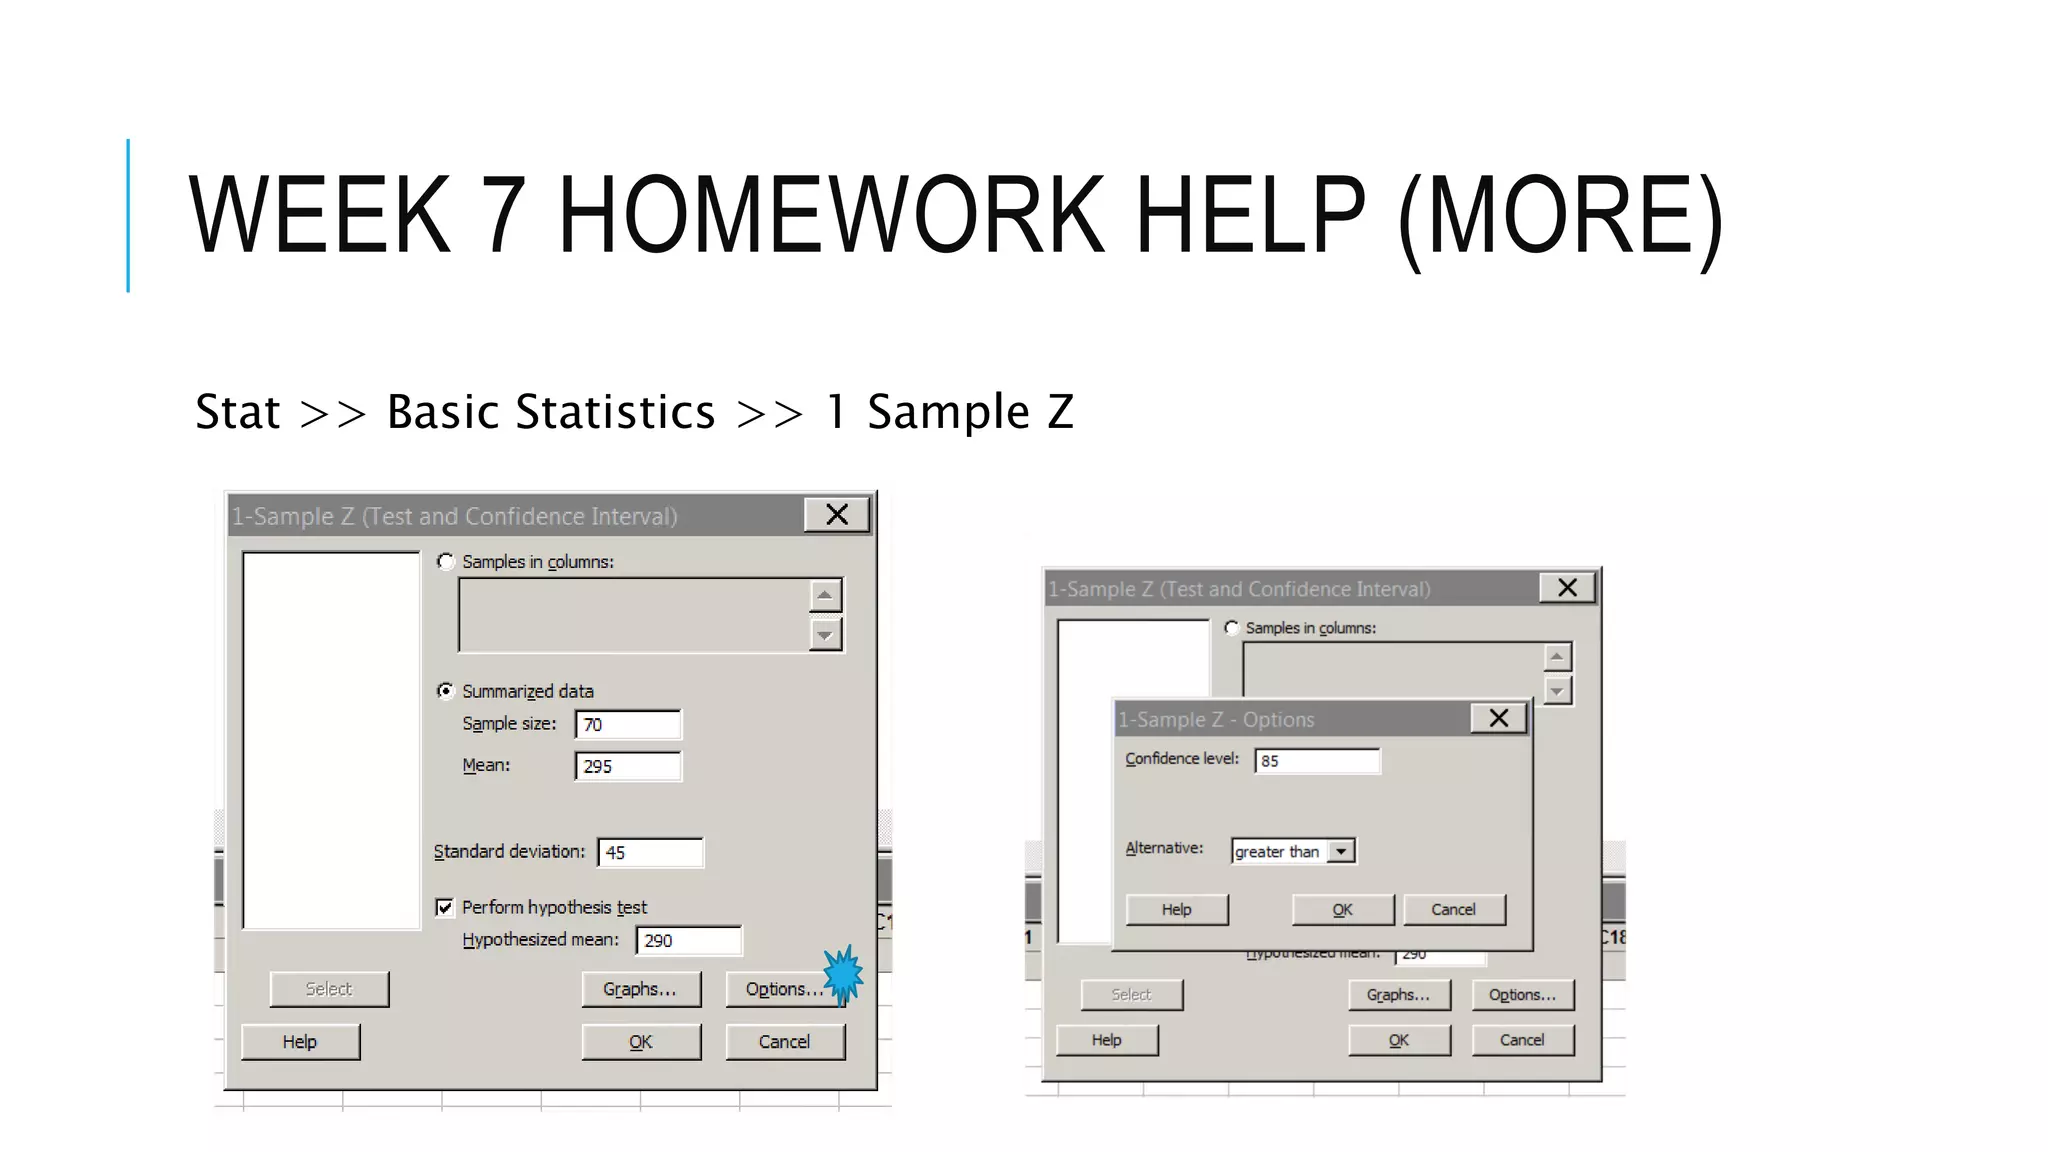
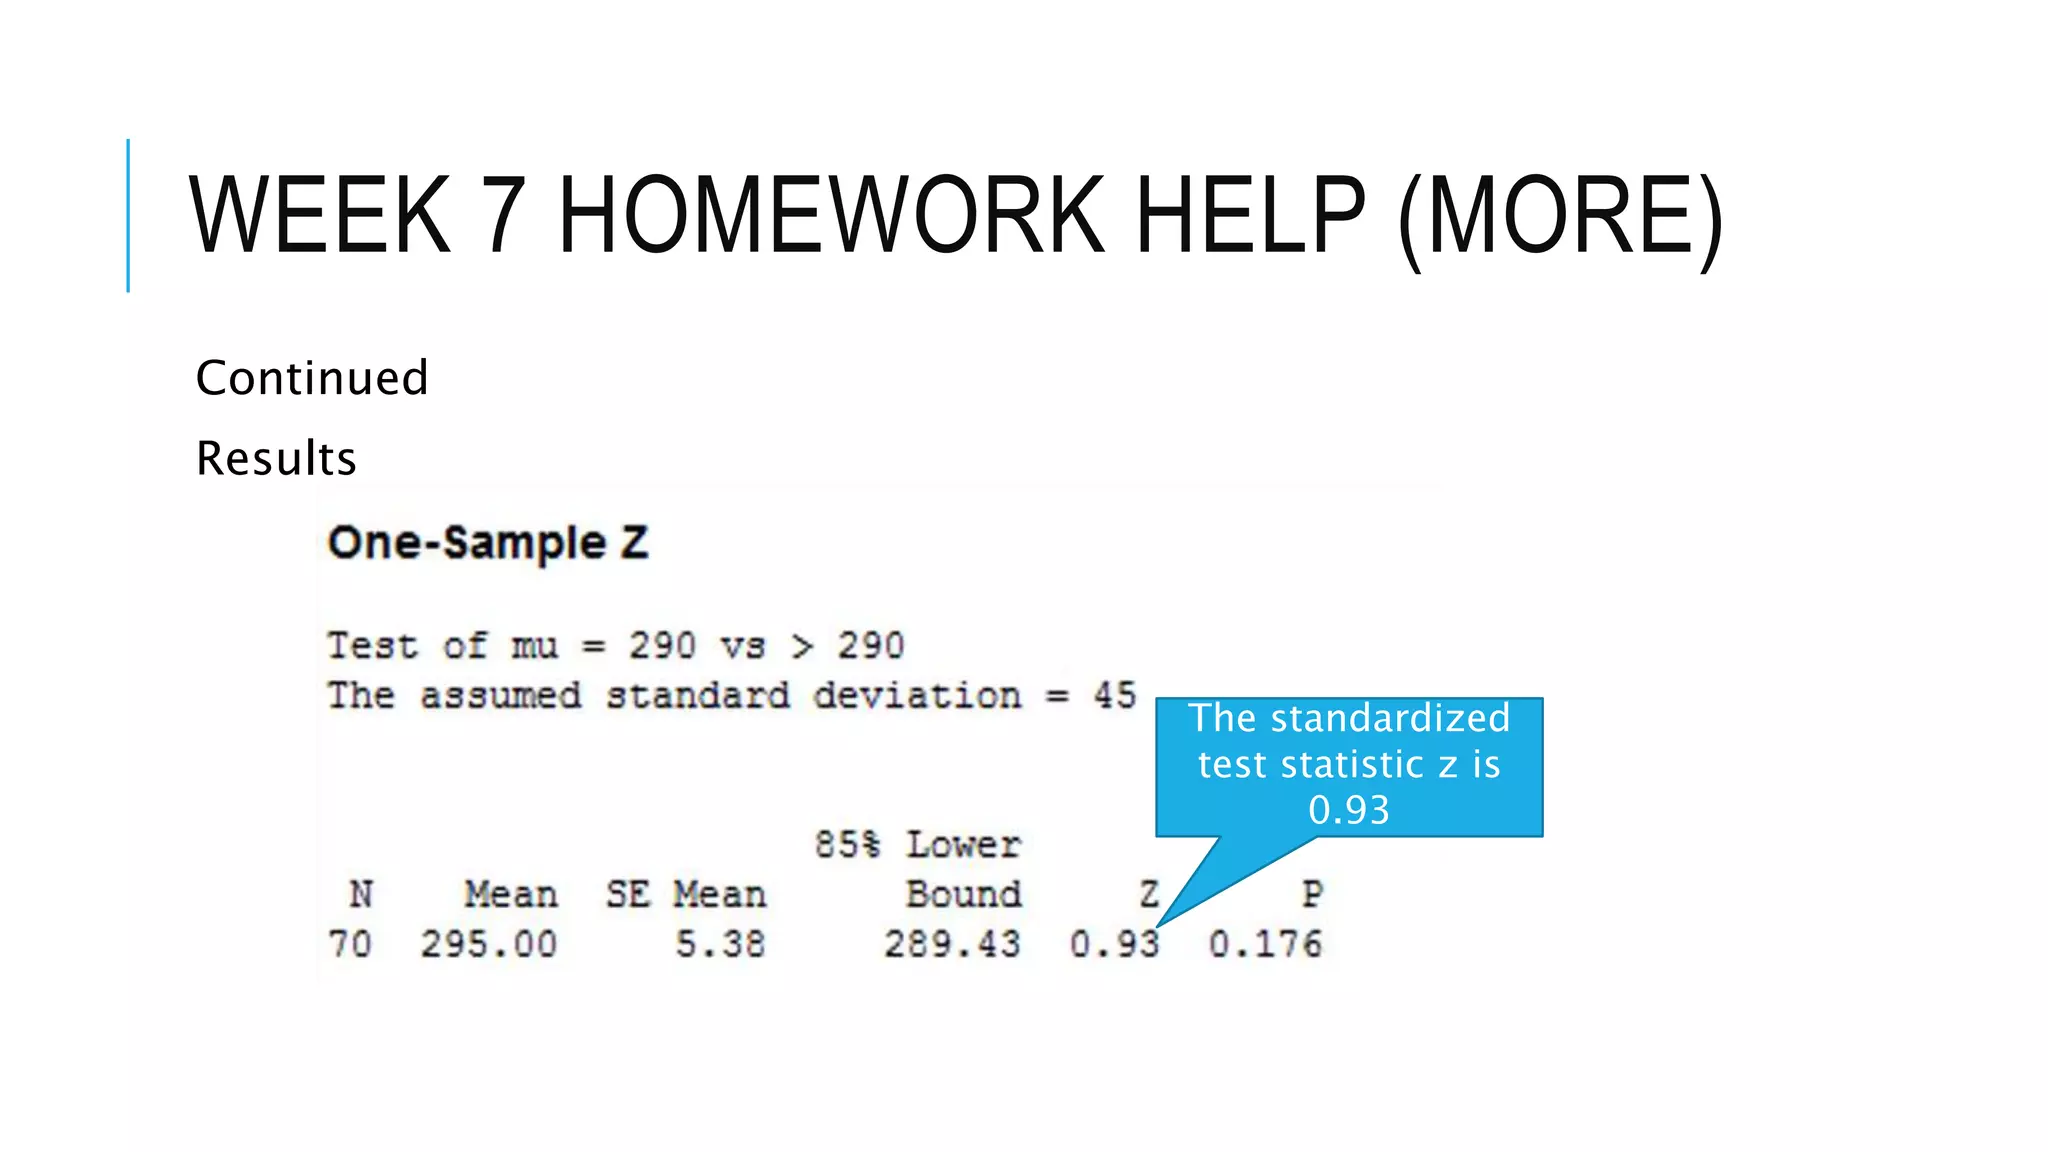

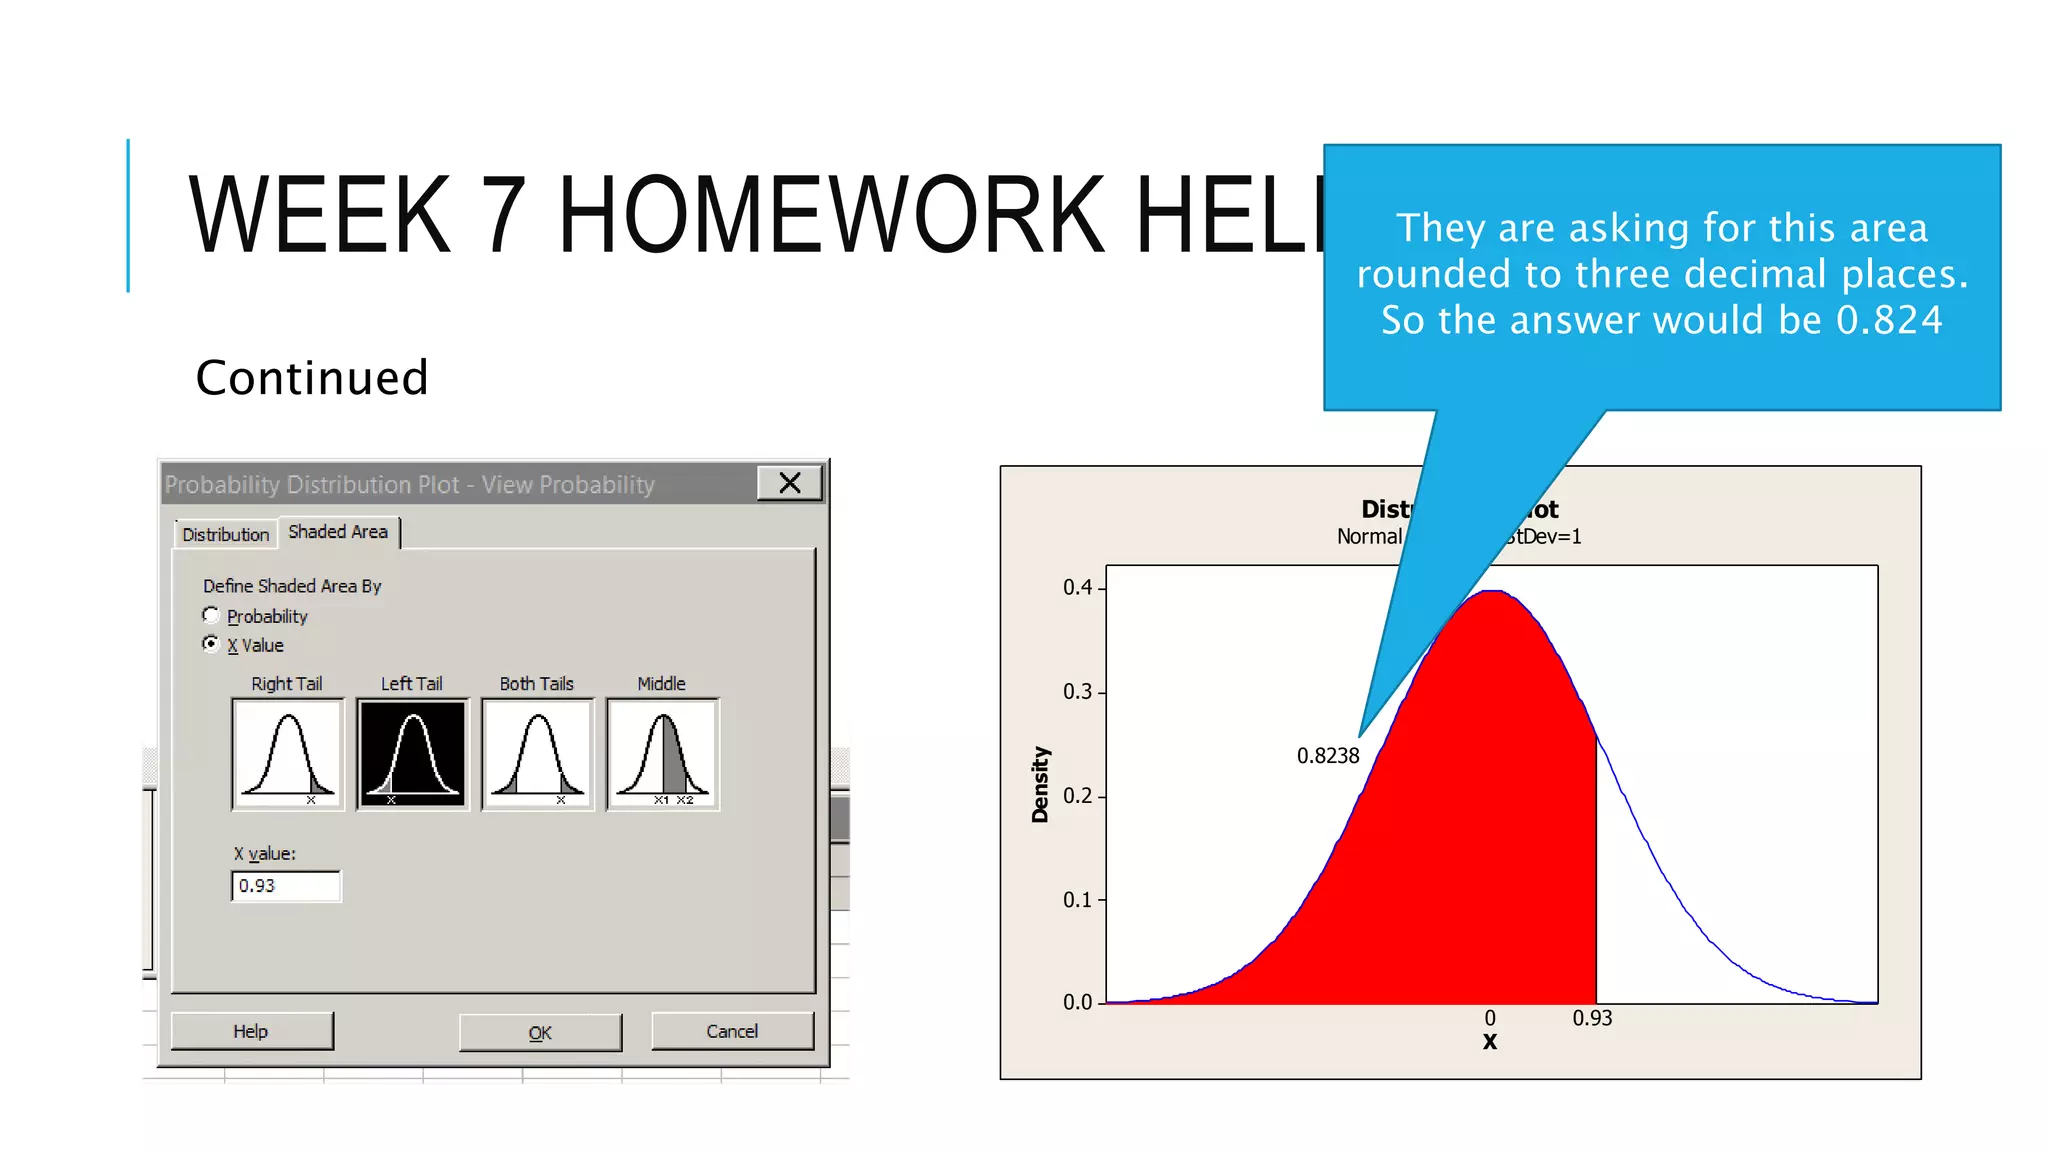
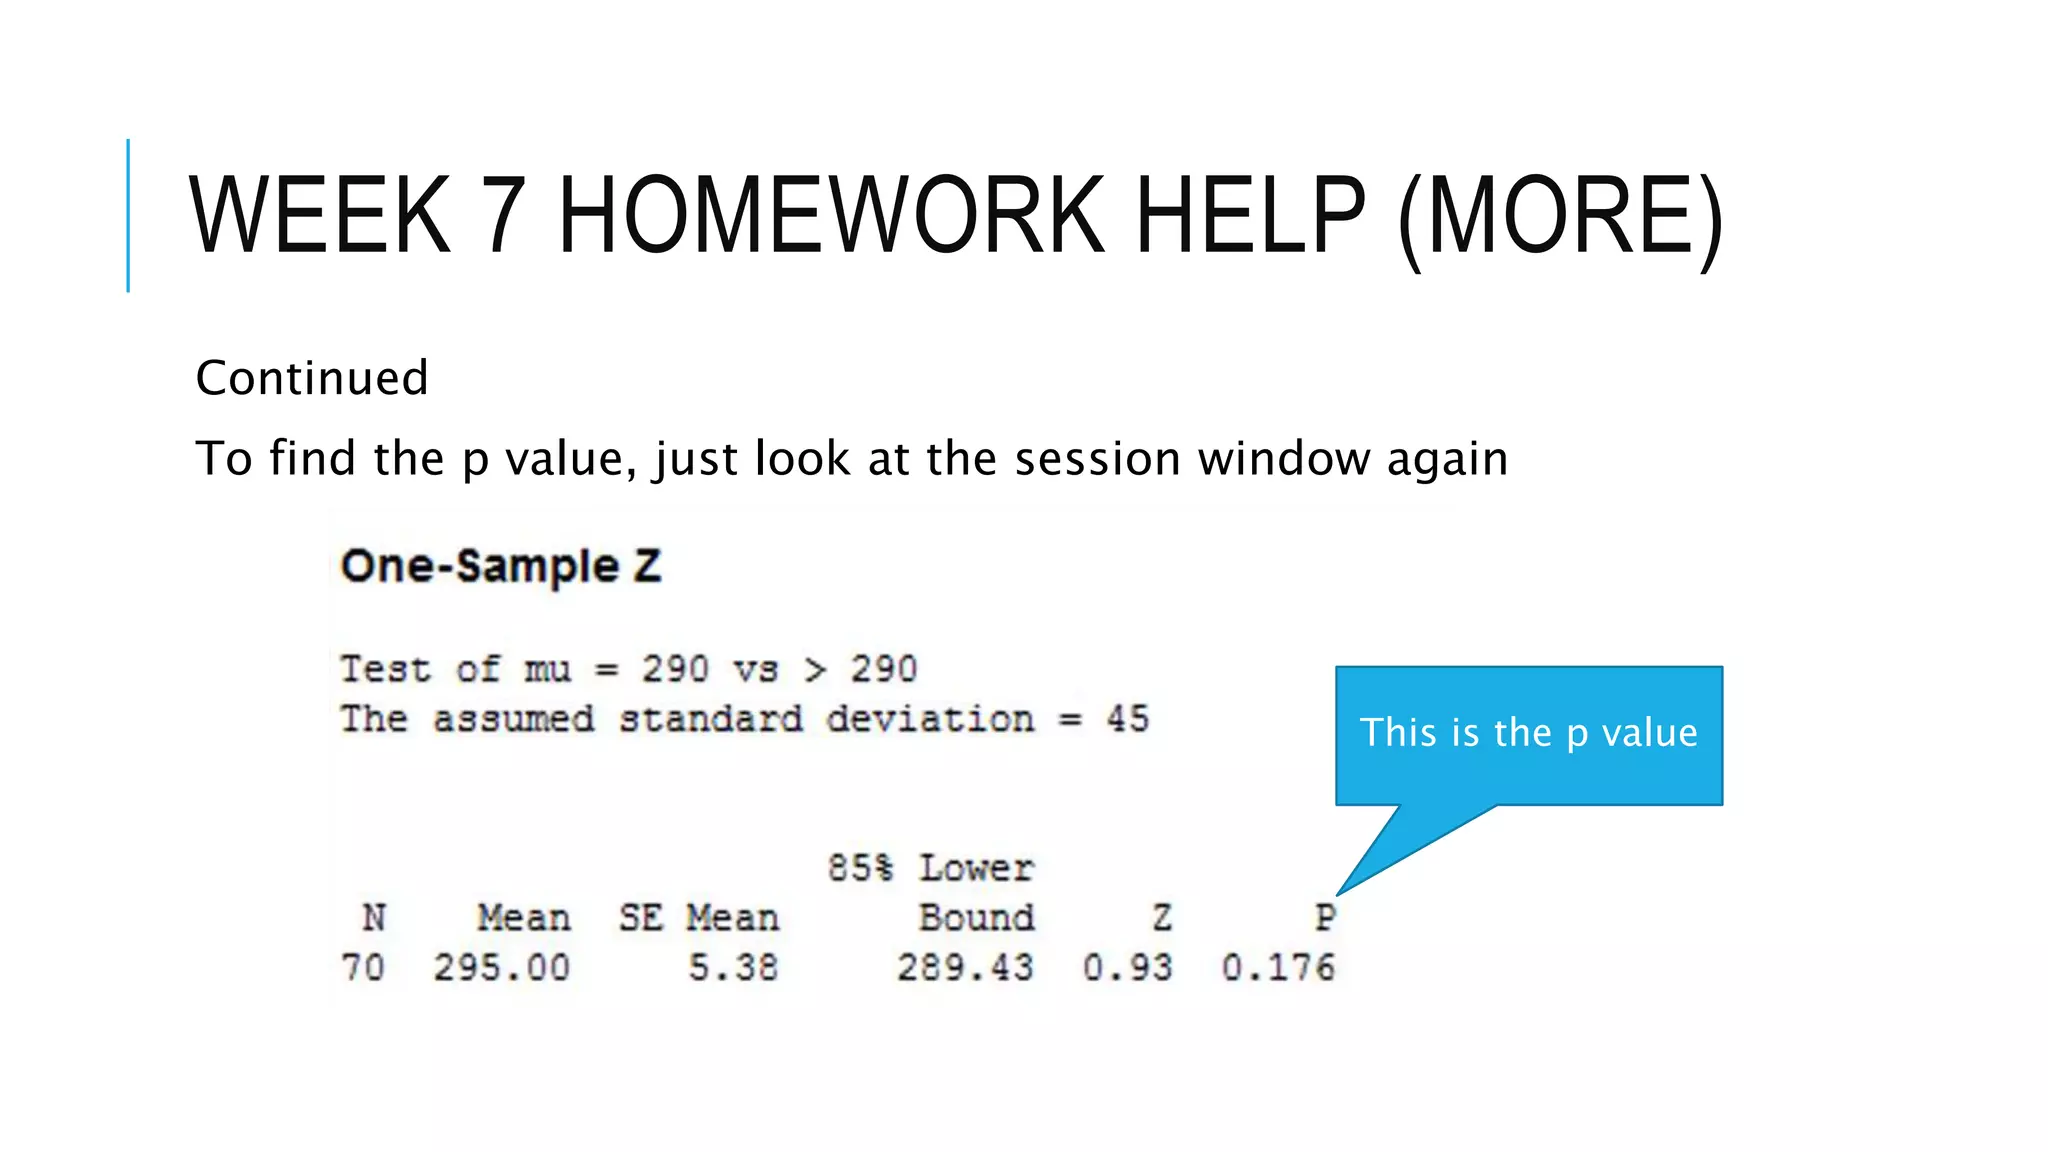
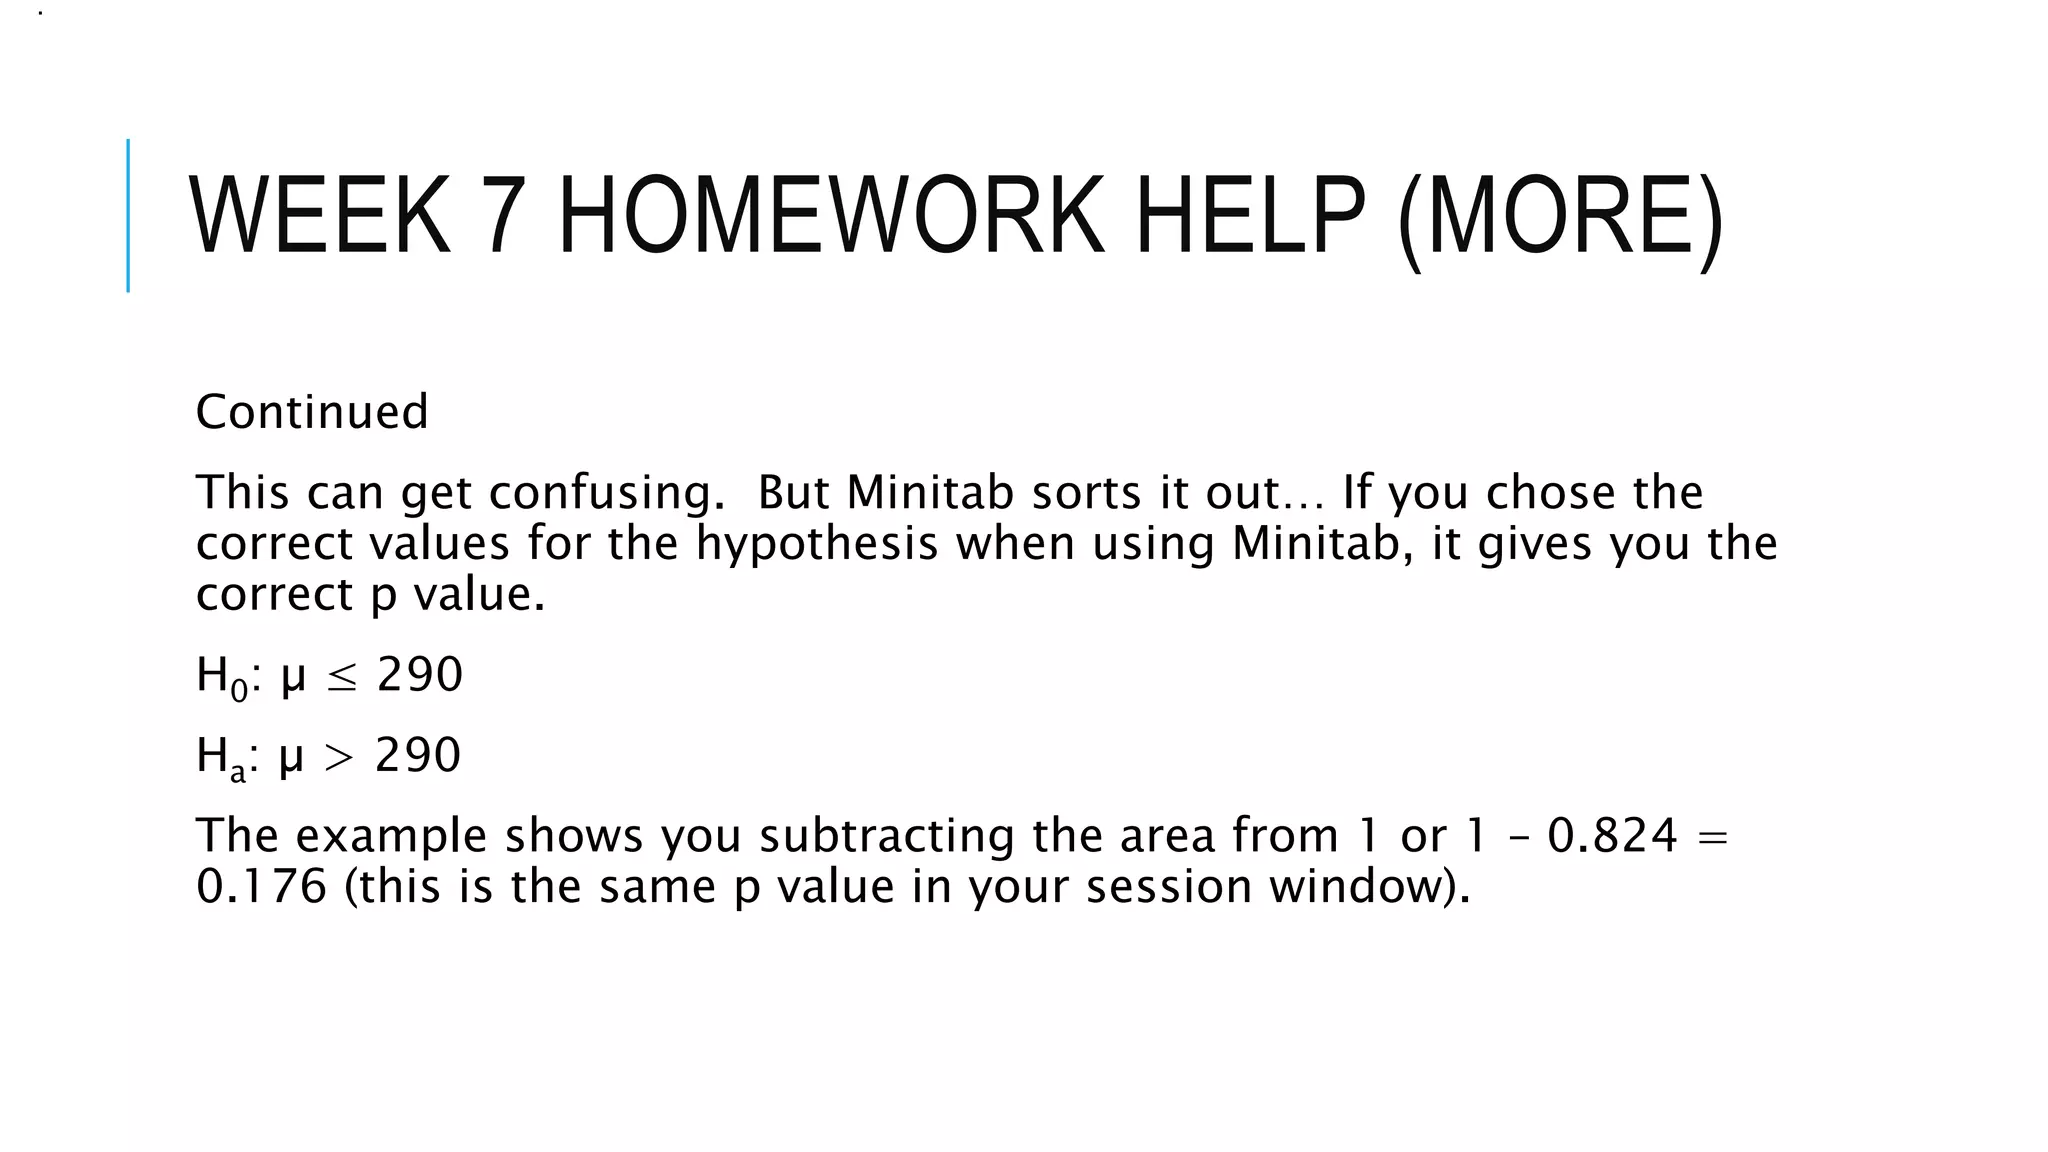


This document provides step-by-step instructions for completing homework problems related to hypothesis testing using z-tests. It includes instructions for finding critical values, performing left-tailed, right-tailed, and two-tailed z-tests using Minitab software. Examples are provided for problems testing claims about population means, finding test statistics, determining p-values, and interpreting results to either reject or fail to reject the null hypothesis. Guidance is given to carefully consider the wording of claims and hypotheses and set up tests accordingly.


![Week7 Quiz Help 2009[1]](https://cdn.slidesharecdn.com/ss_thumbnails/week7quizhelp20091-091012152329-phpapp02-thumbnail.jpg?width=640&height=640&fit=bounds)