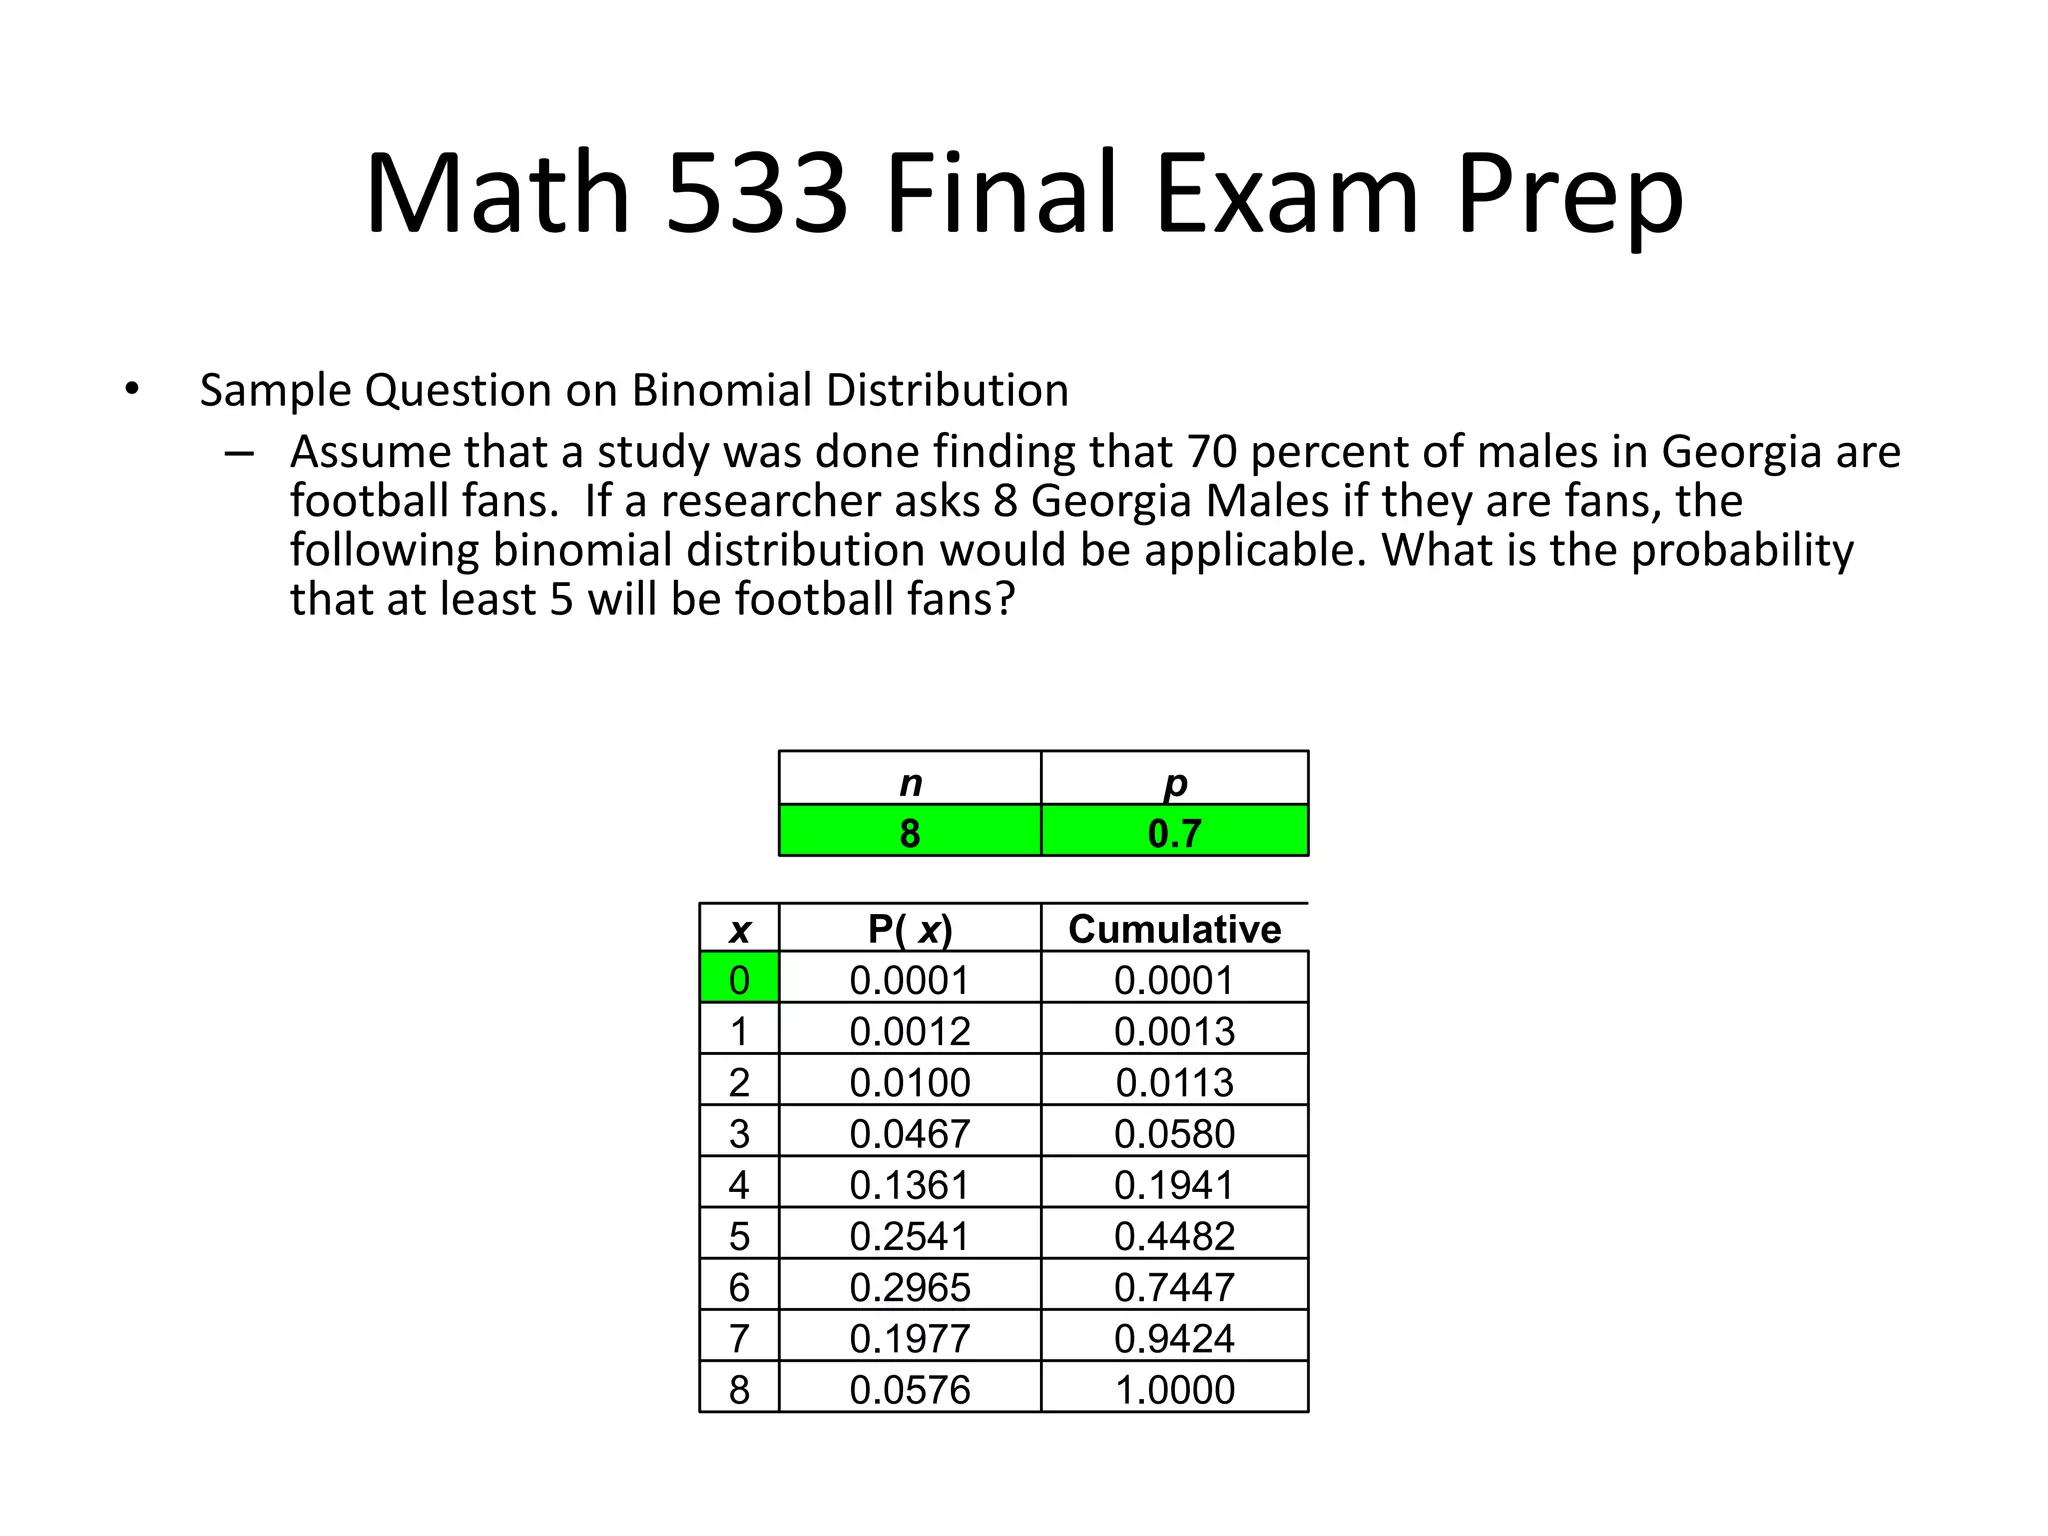
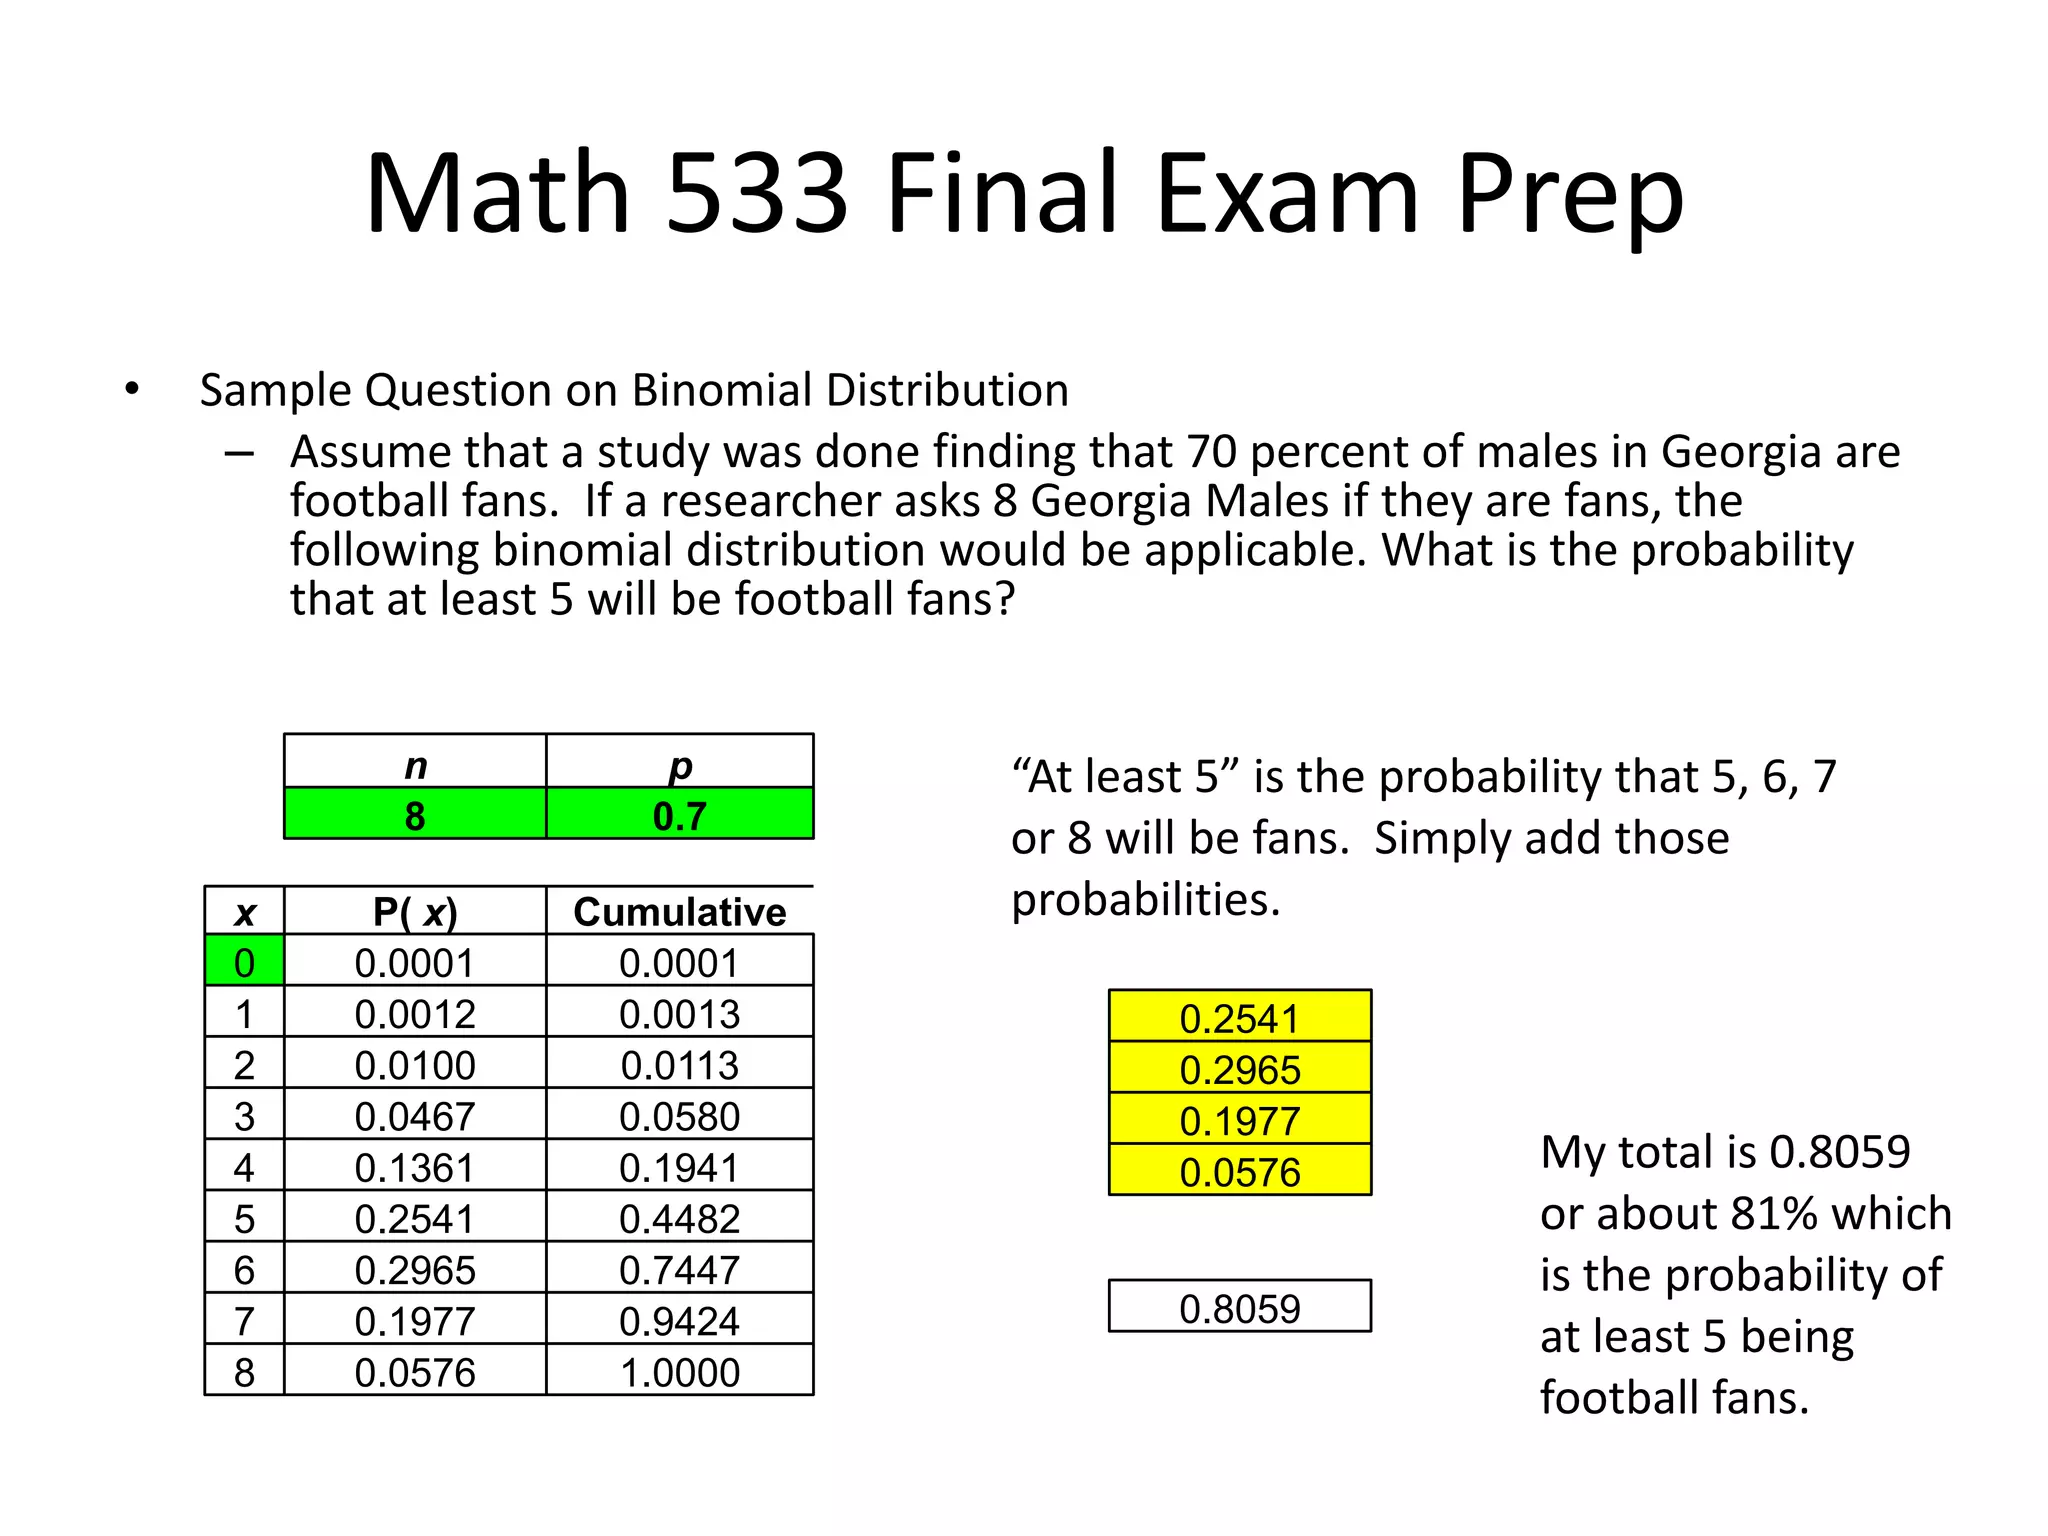
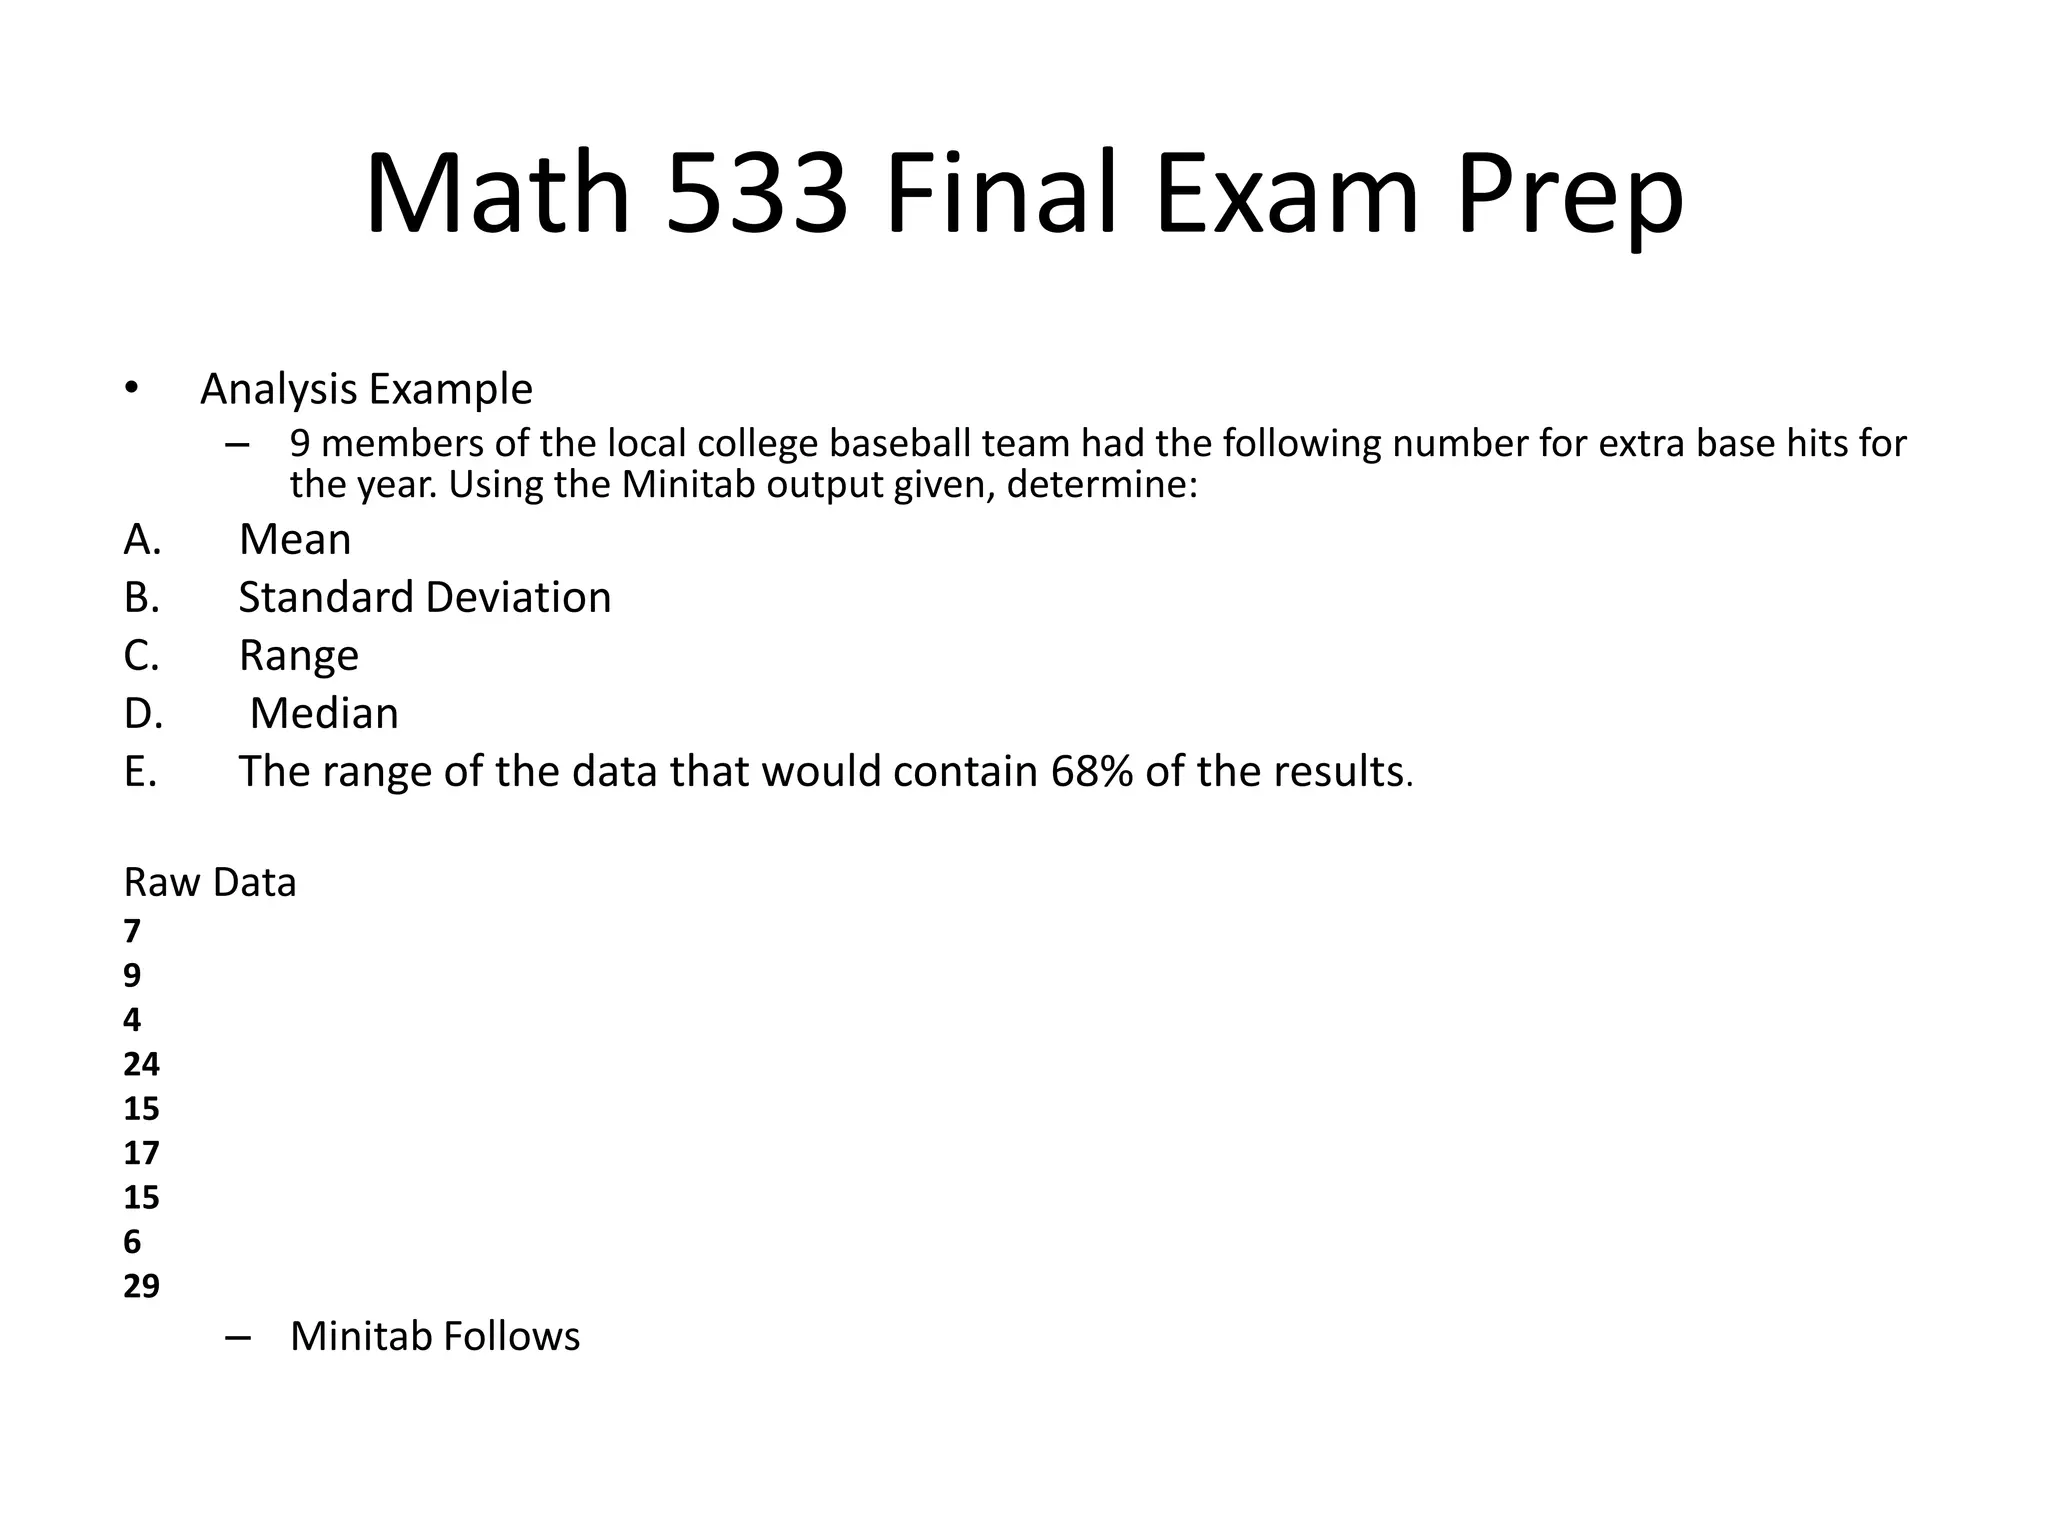
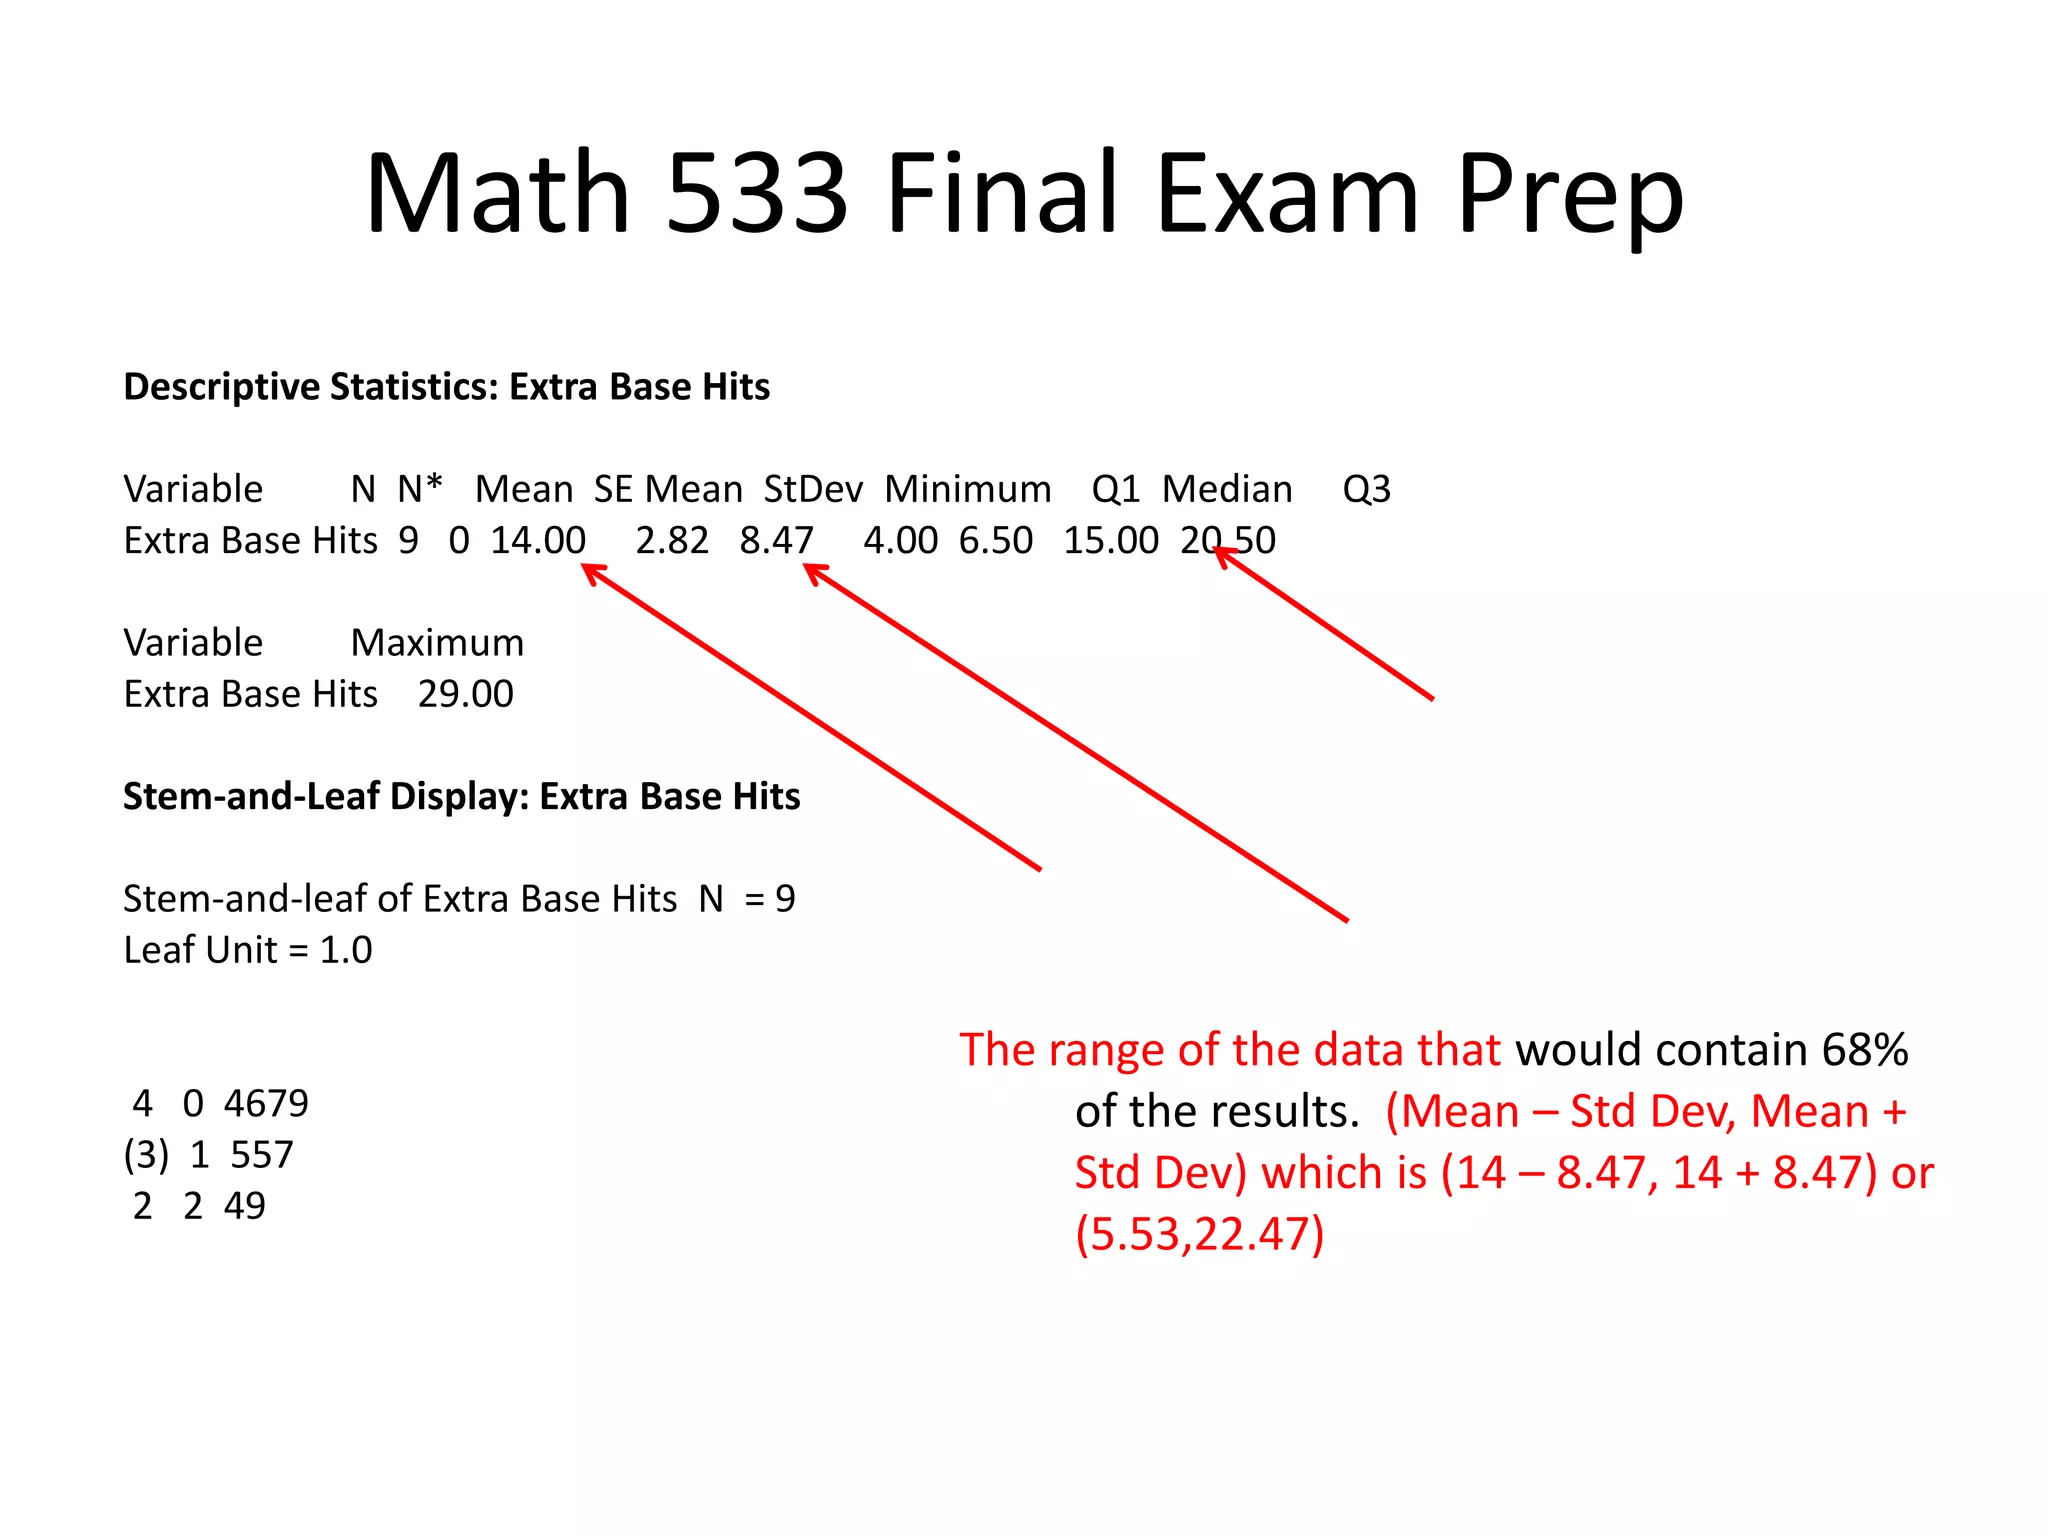
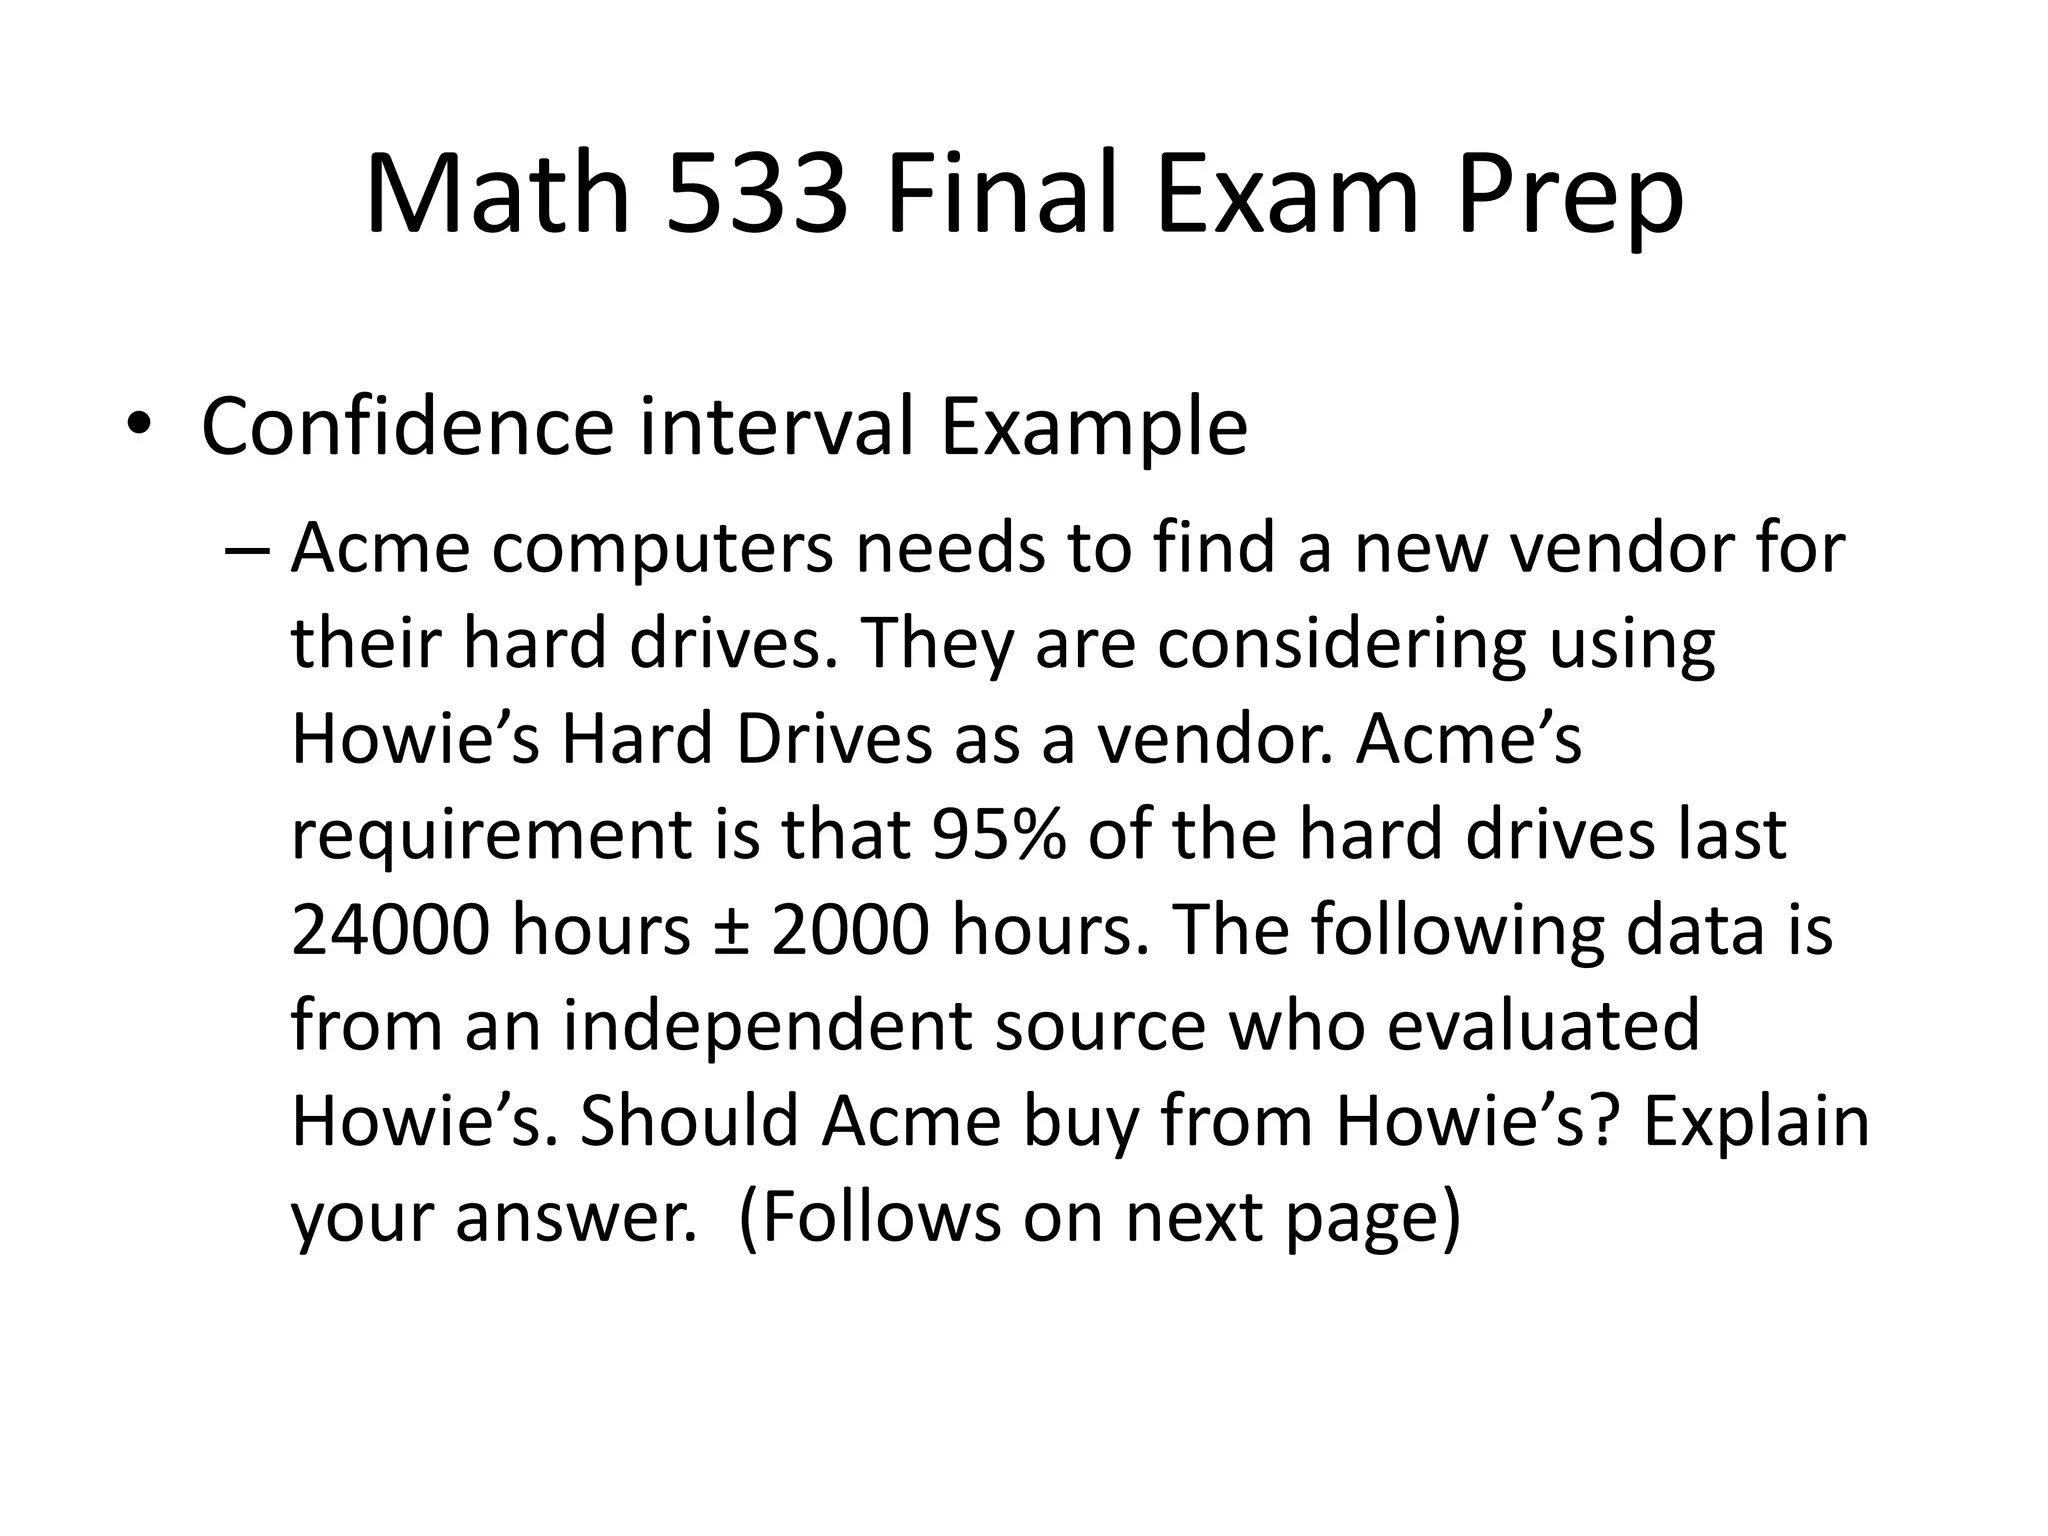
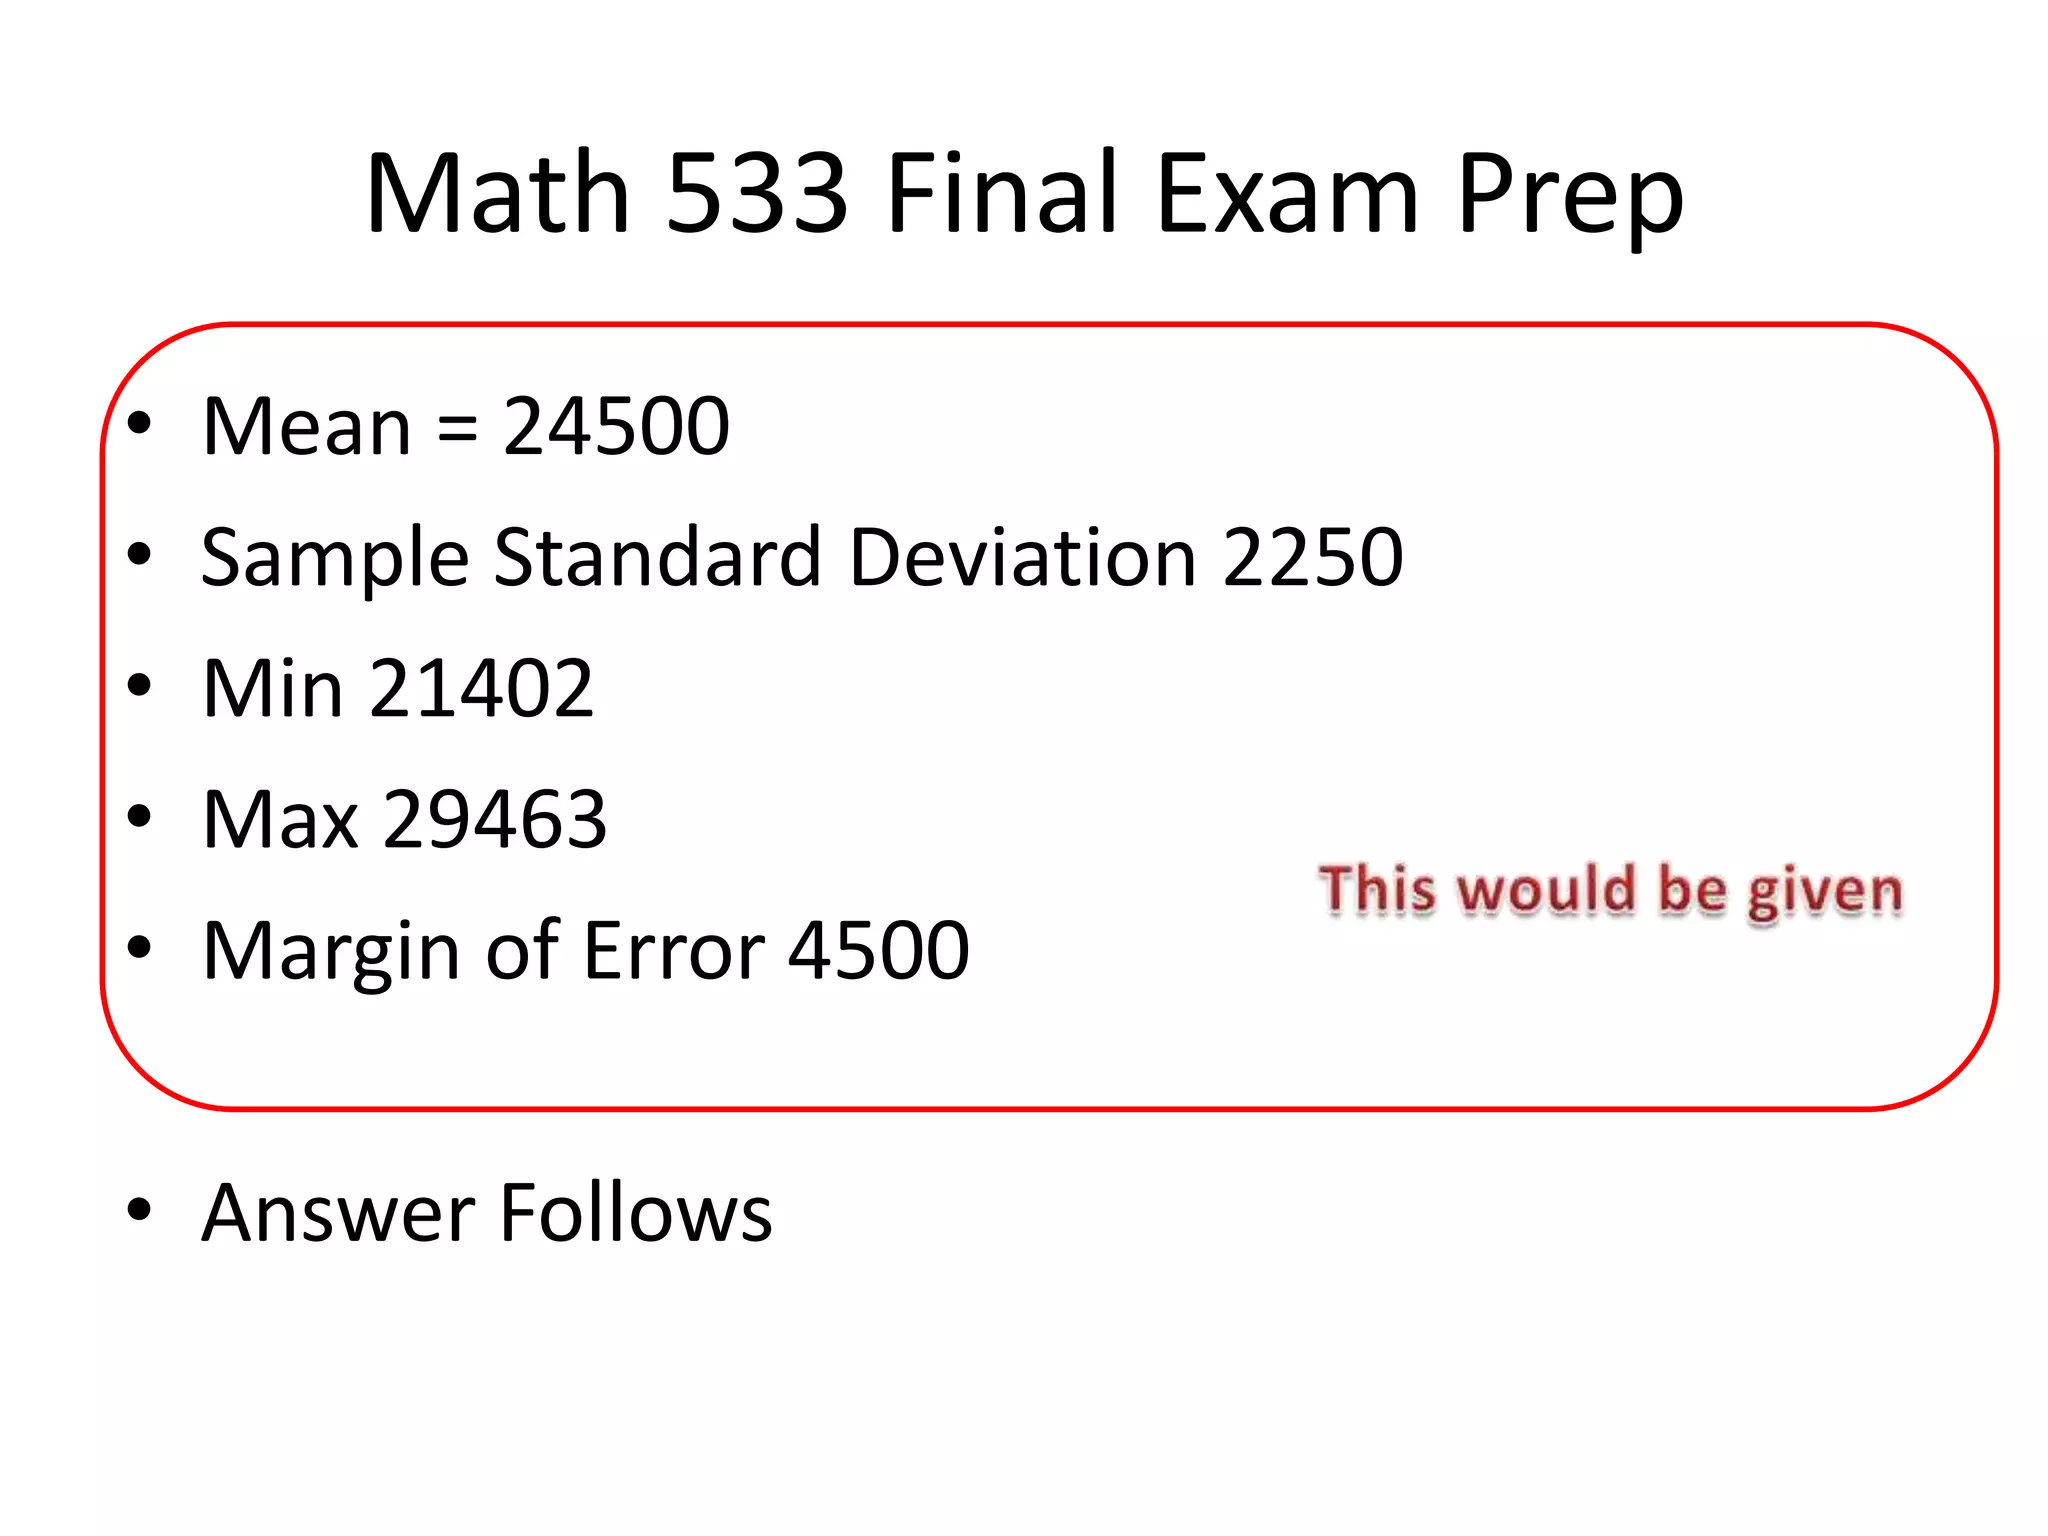
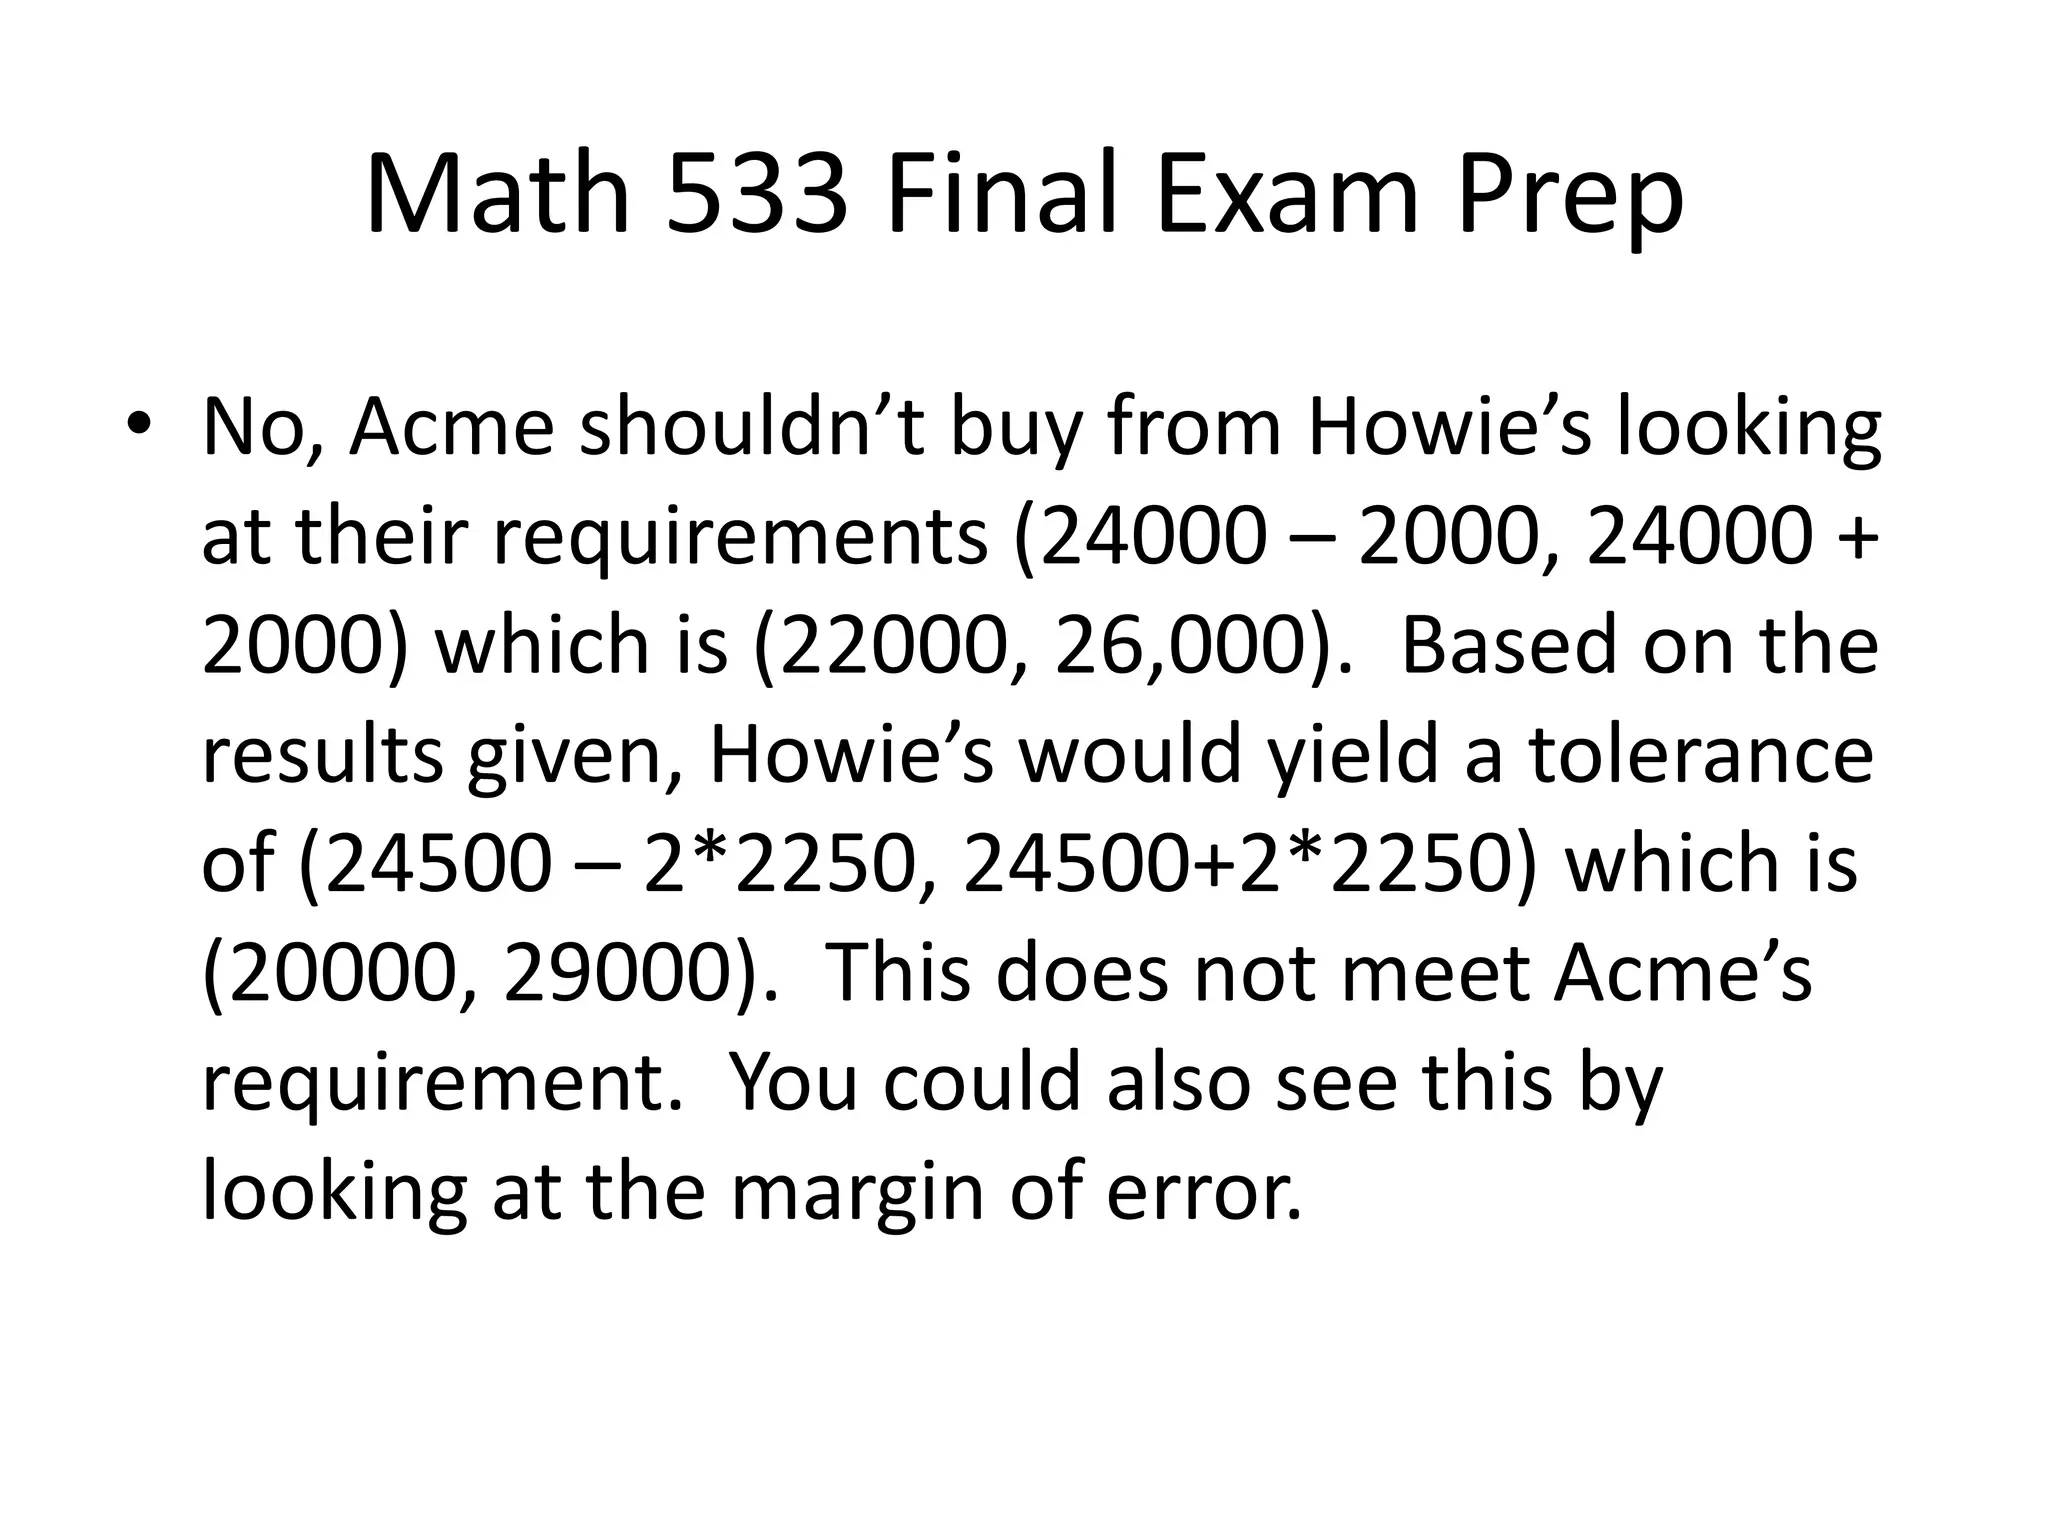
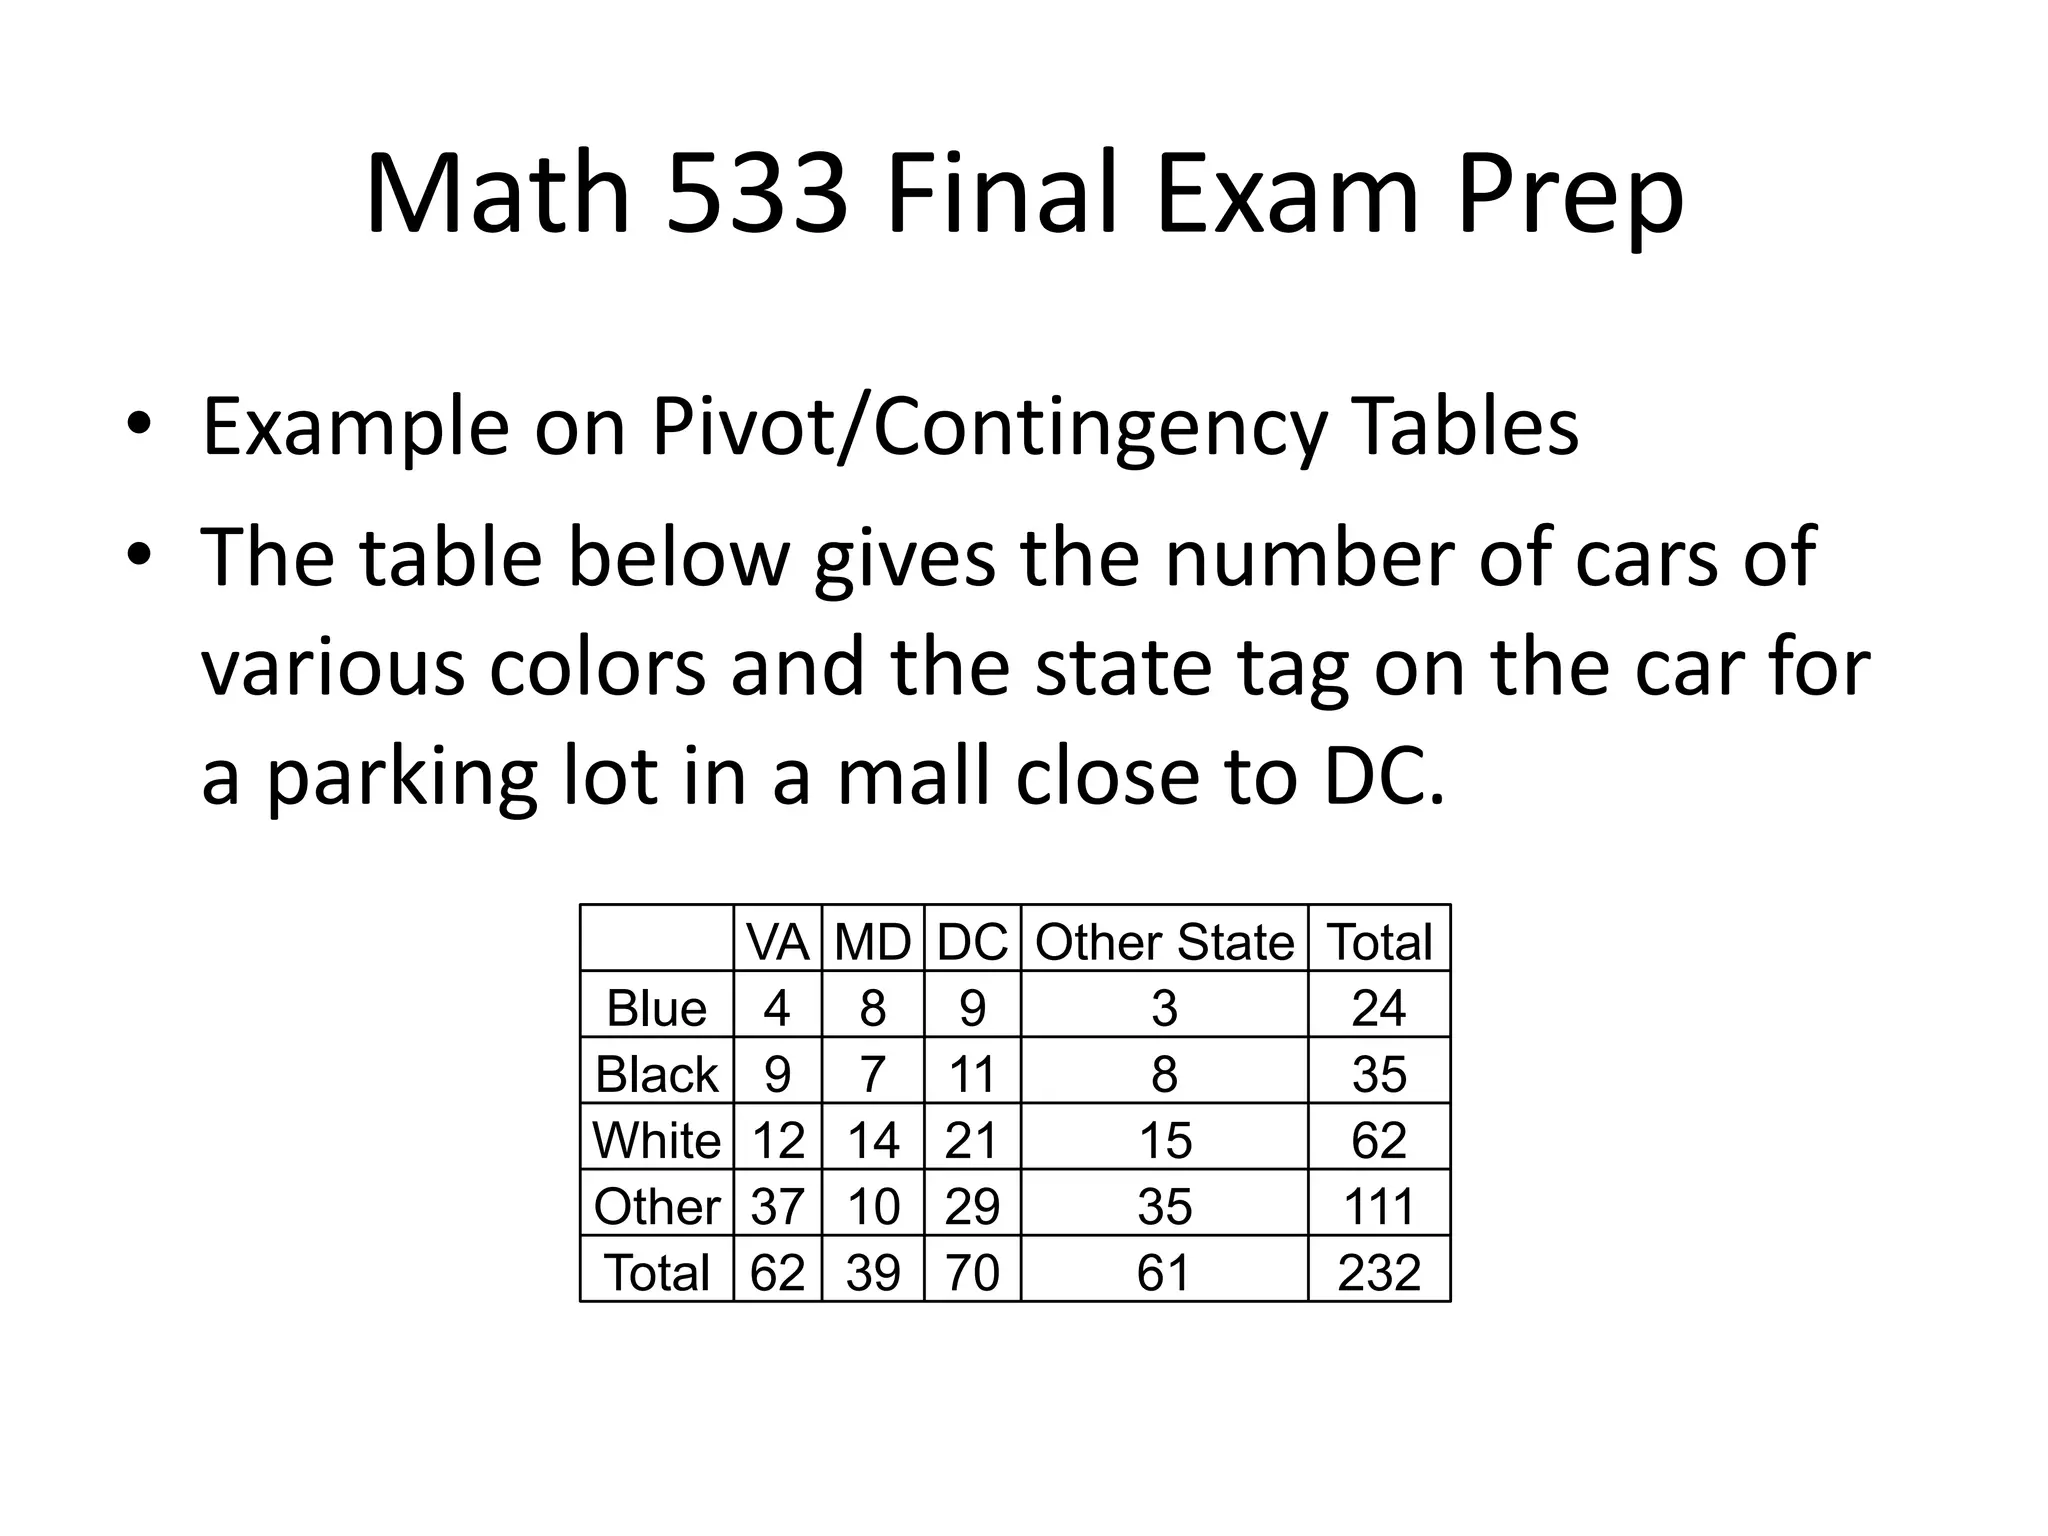
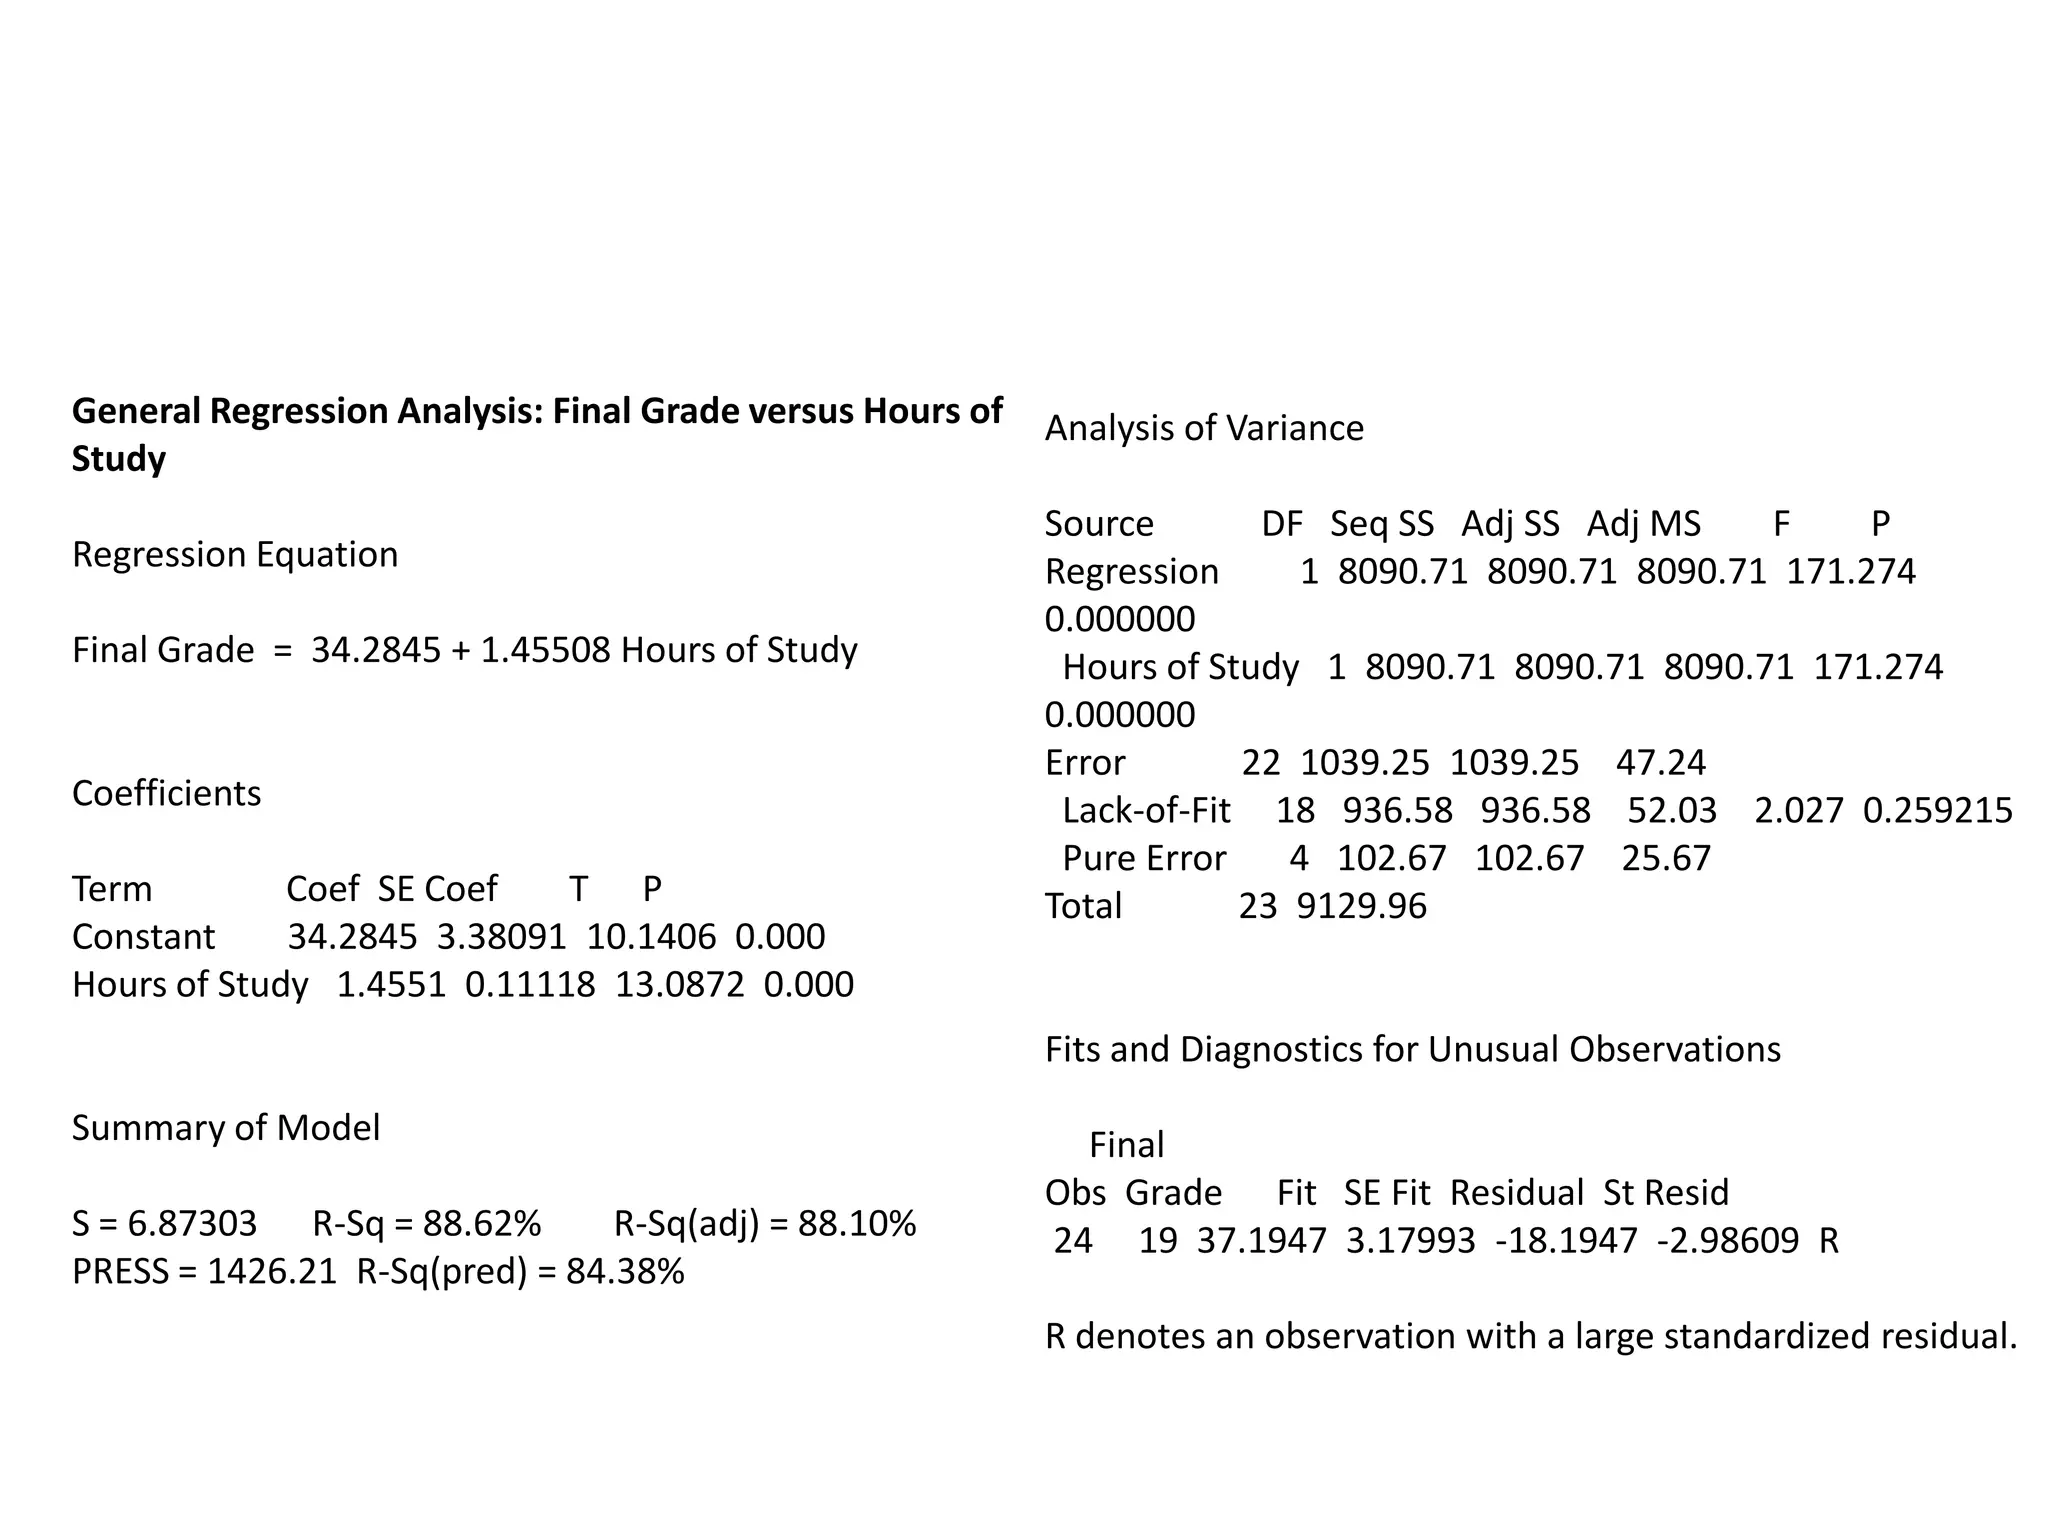
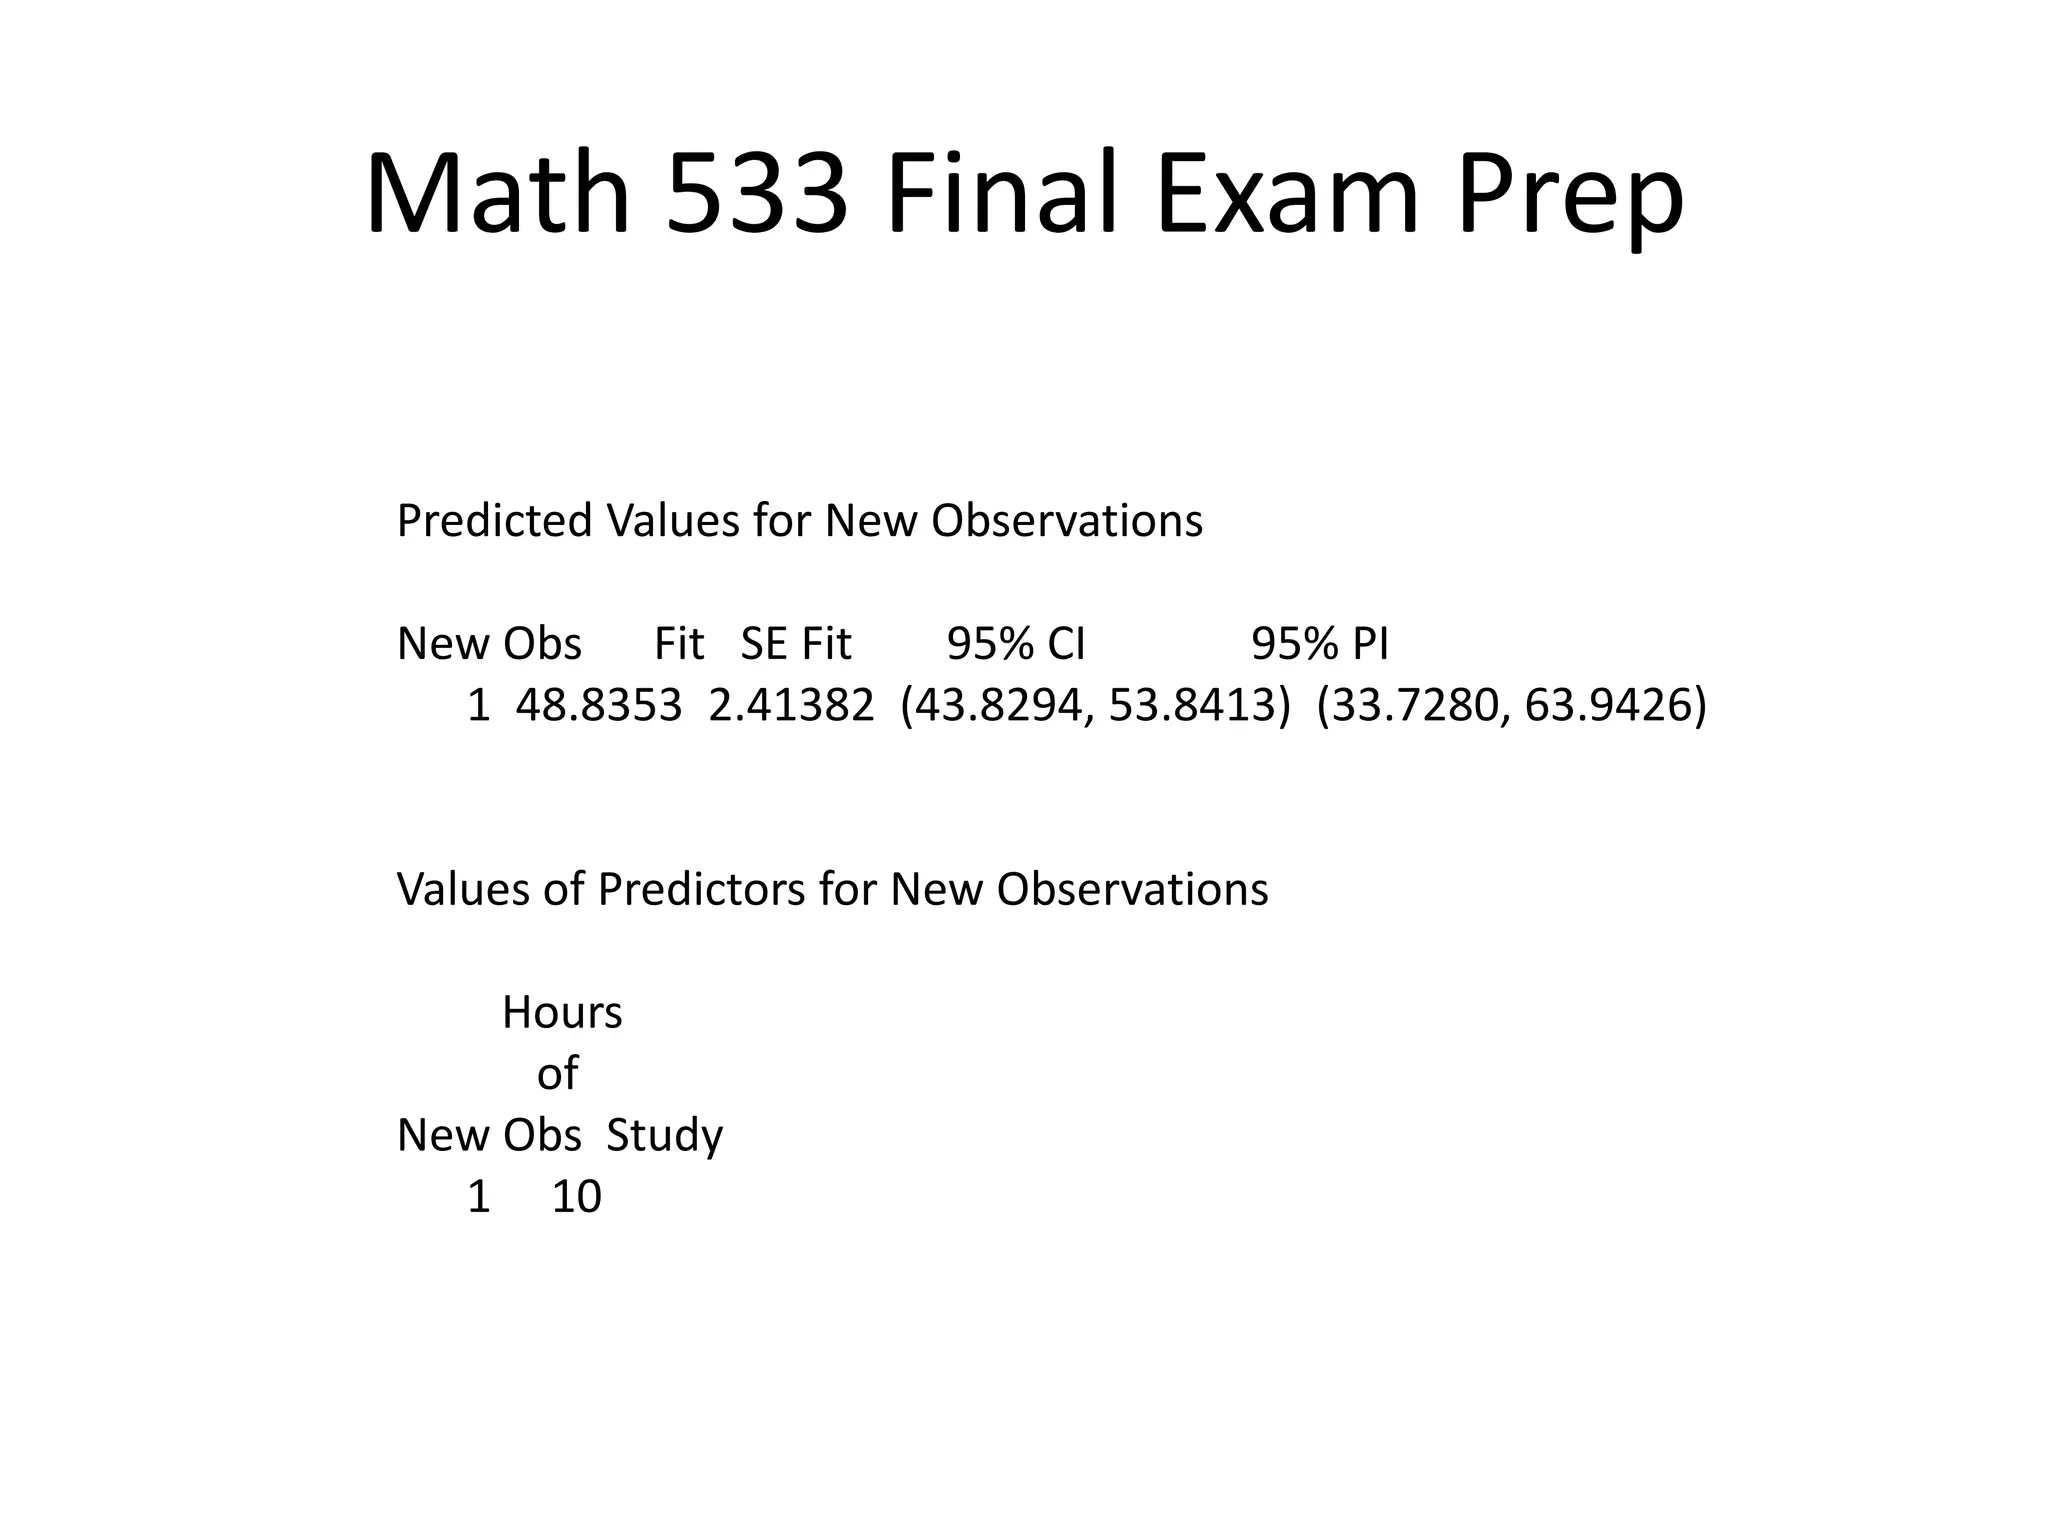
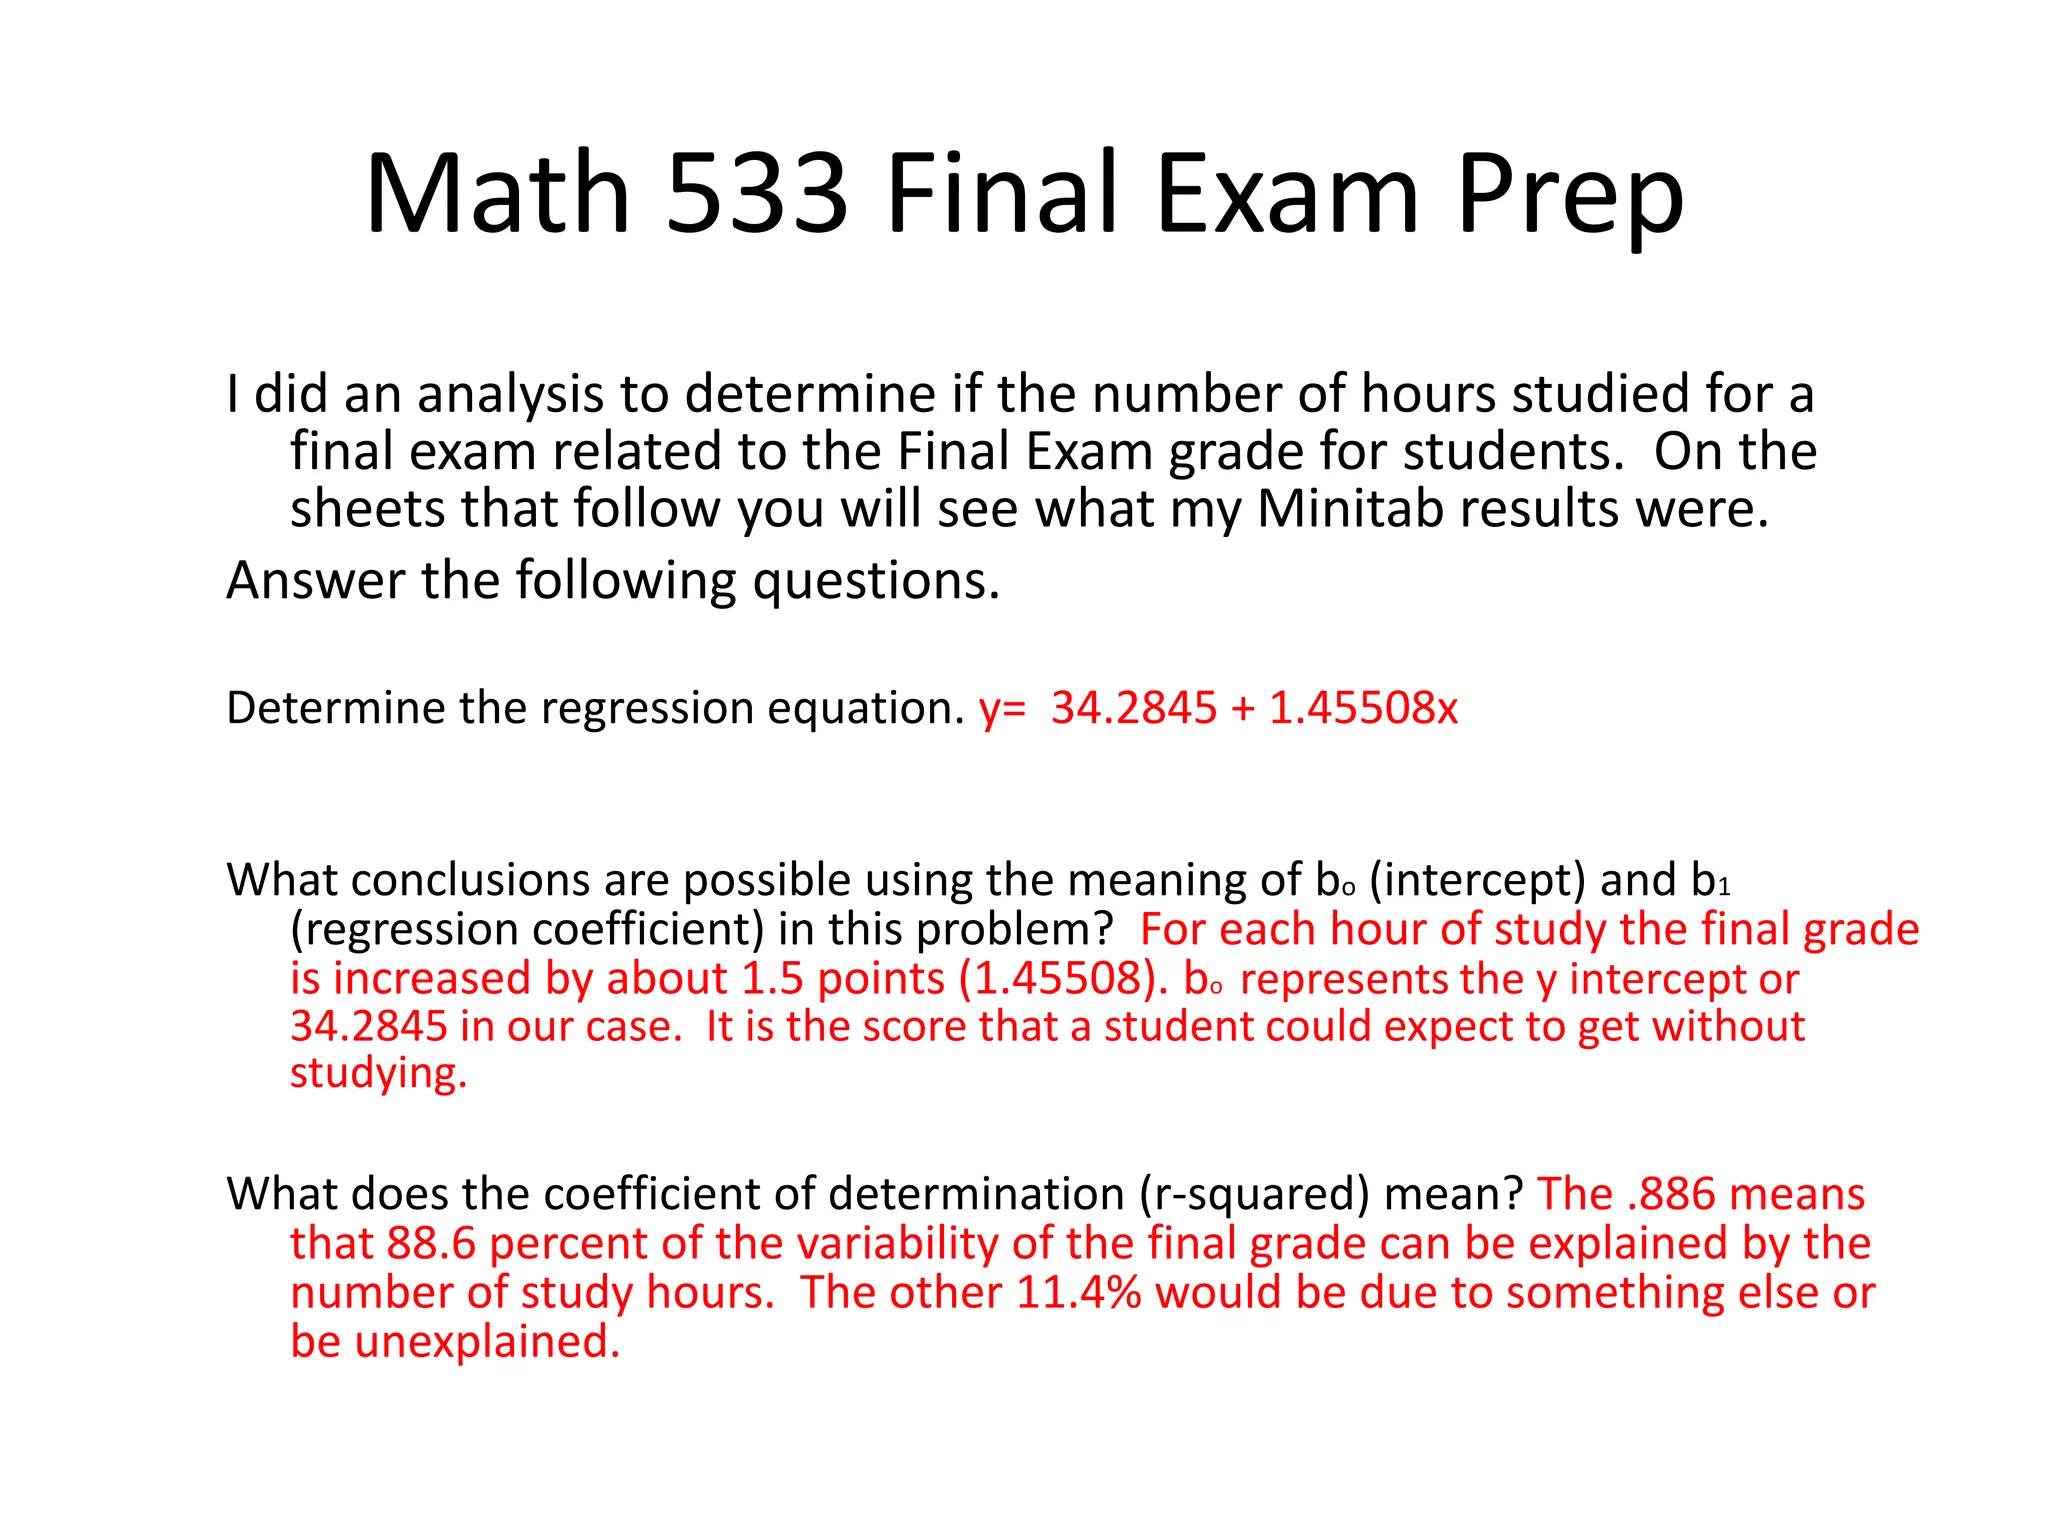
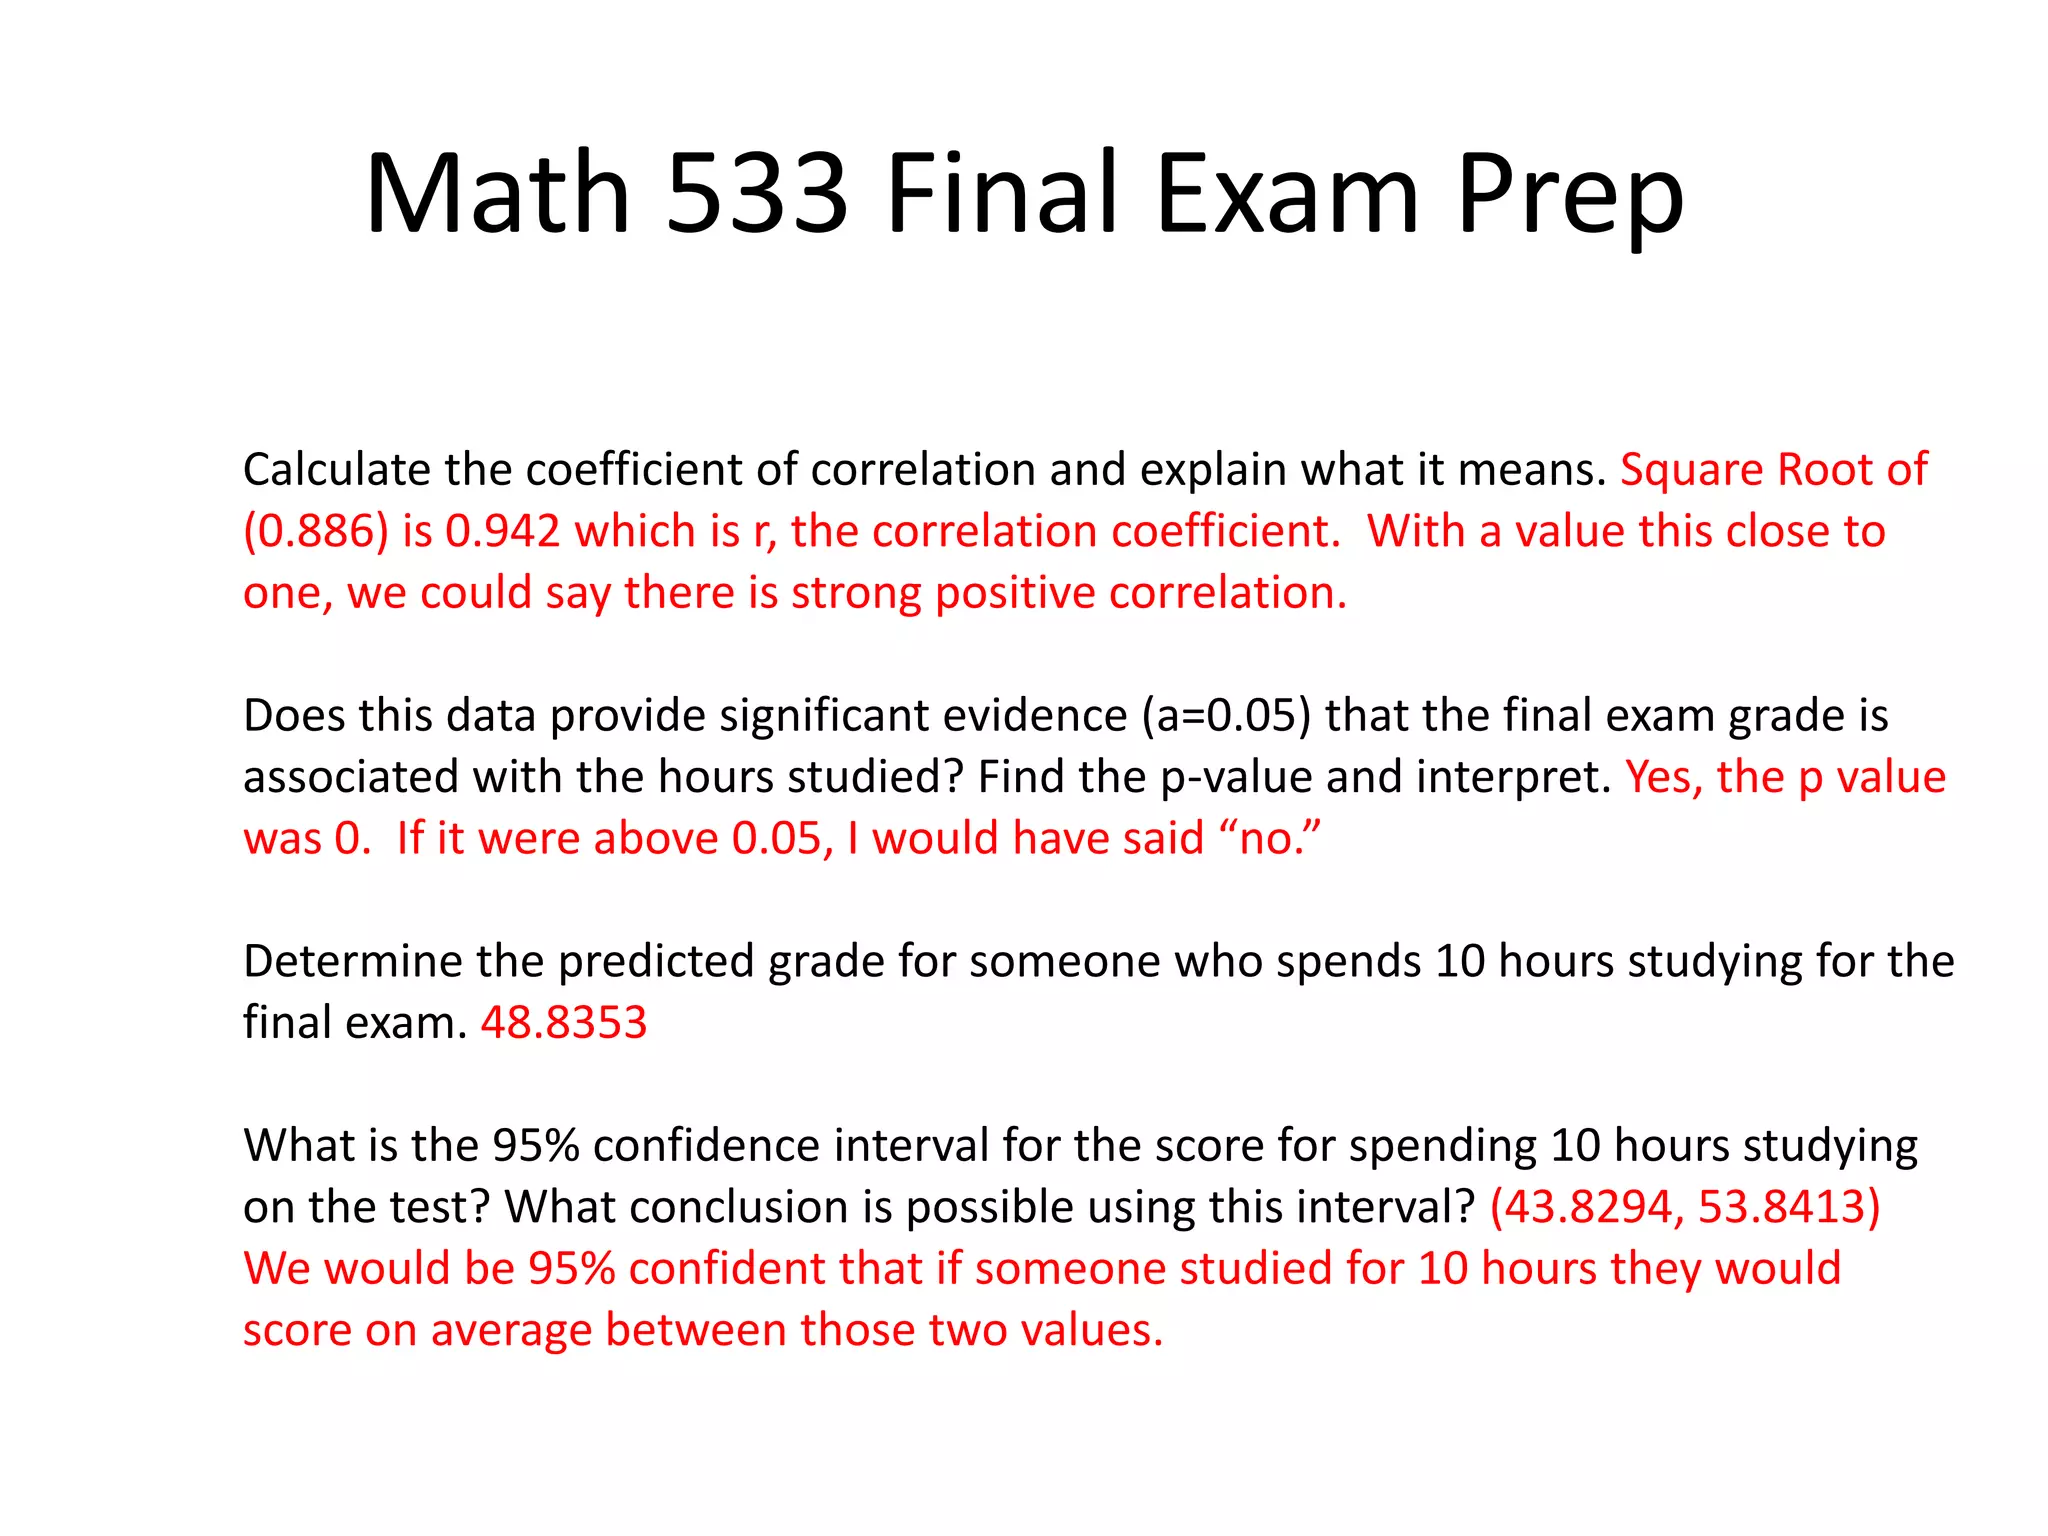
Some Hints for Preparing for the
Math 533 Final Exam
Professor Brent Heard
Math 533 Final Exam Prep
• Hypothesis Tests
Math 533 Final Exam Prep
• Sample Question on Hypothesis Testing
– Pepito’s Pizza Work is putting pizzas out by delivery as fast as they can.
Pepito’s claims they can deliver pizzas within their delivery area in less
than 29 minutes. You are given the following data from a sample.
Sample size: 120 Deliveries
Population standard deviation: 1.4
Sample mean: 28.3
Formulate a hypothesis test to evaluate the claim.
– Answer: Ho: µ ≥ 29, Ha : µ < 29
– (In this case, the claim was Ha)
– Remember Ho always contains equality (It will either be =, ≤ or ≥)
– Ha will be either ≠, < or >
Math 533 Final Exam Prep
• Sample Question on Binomial Distribution
– Assume that a study was done finding that 70 percent of males in Georgia are
football fans. If a researcher asks 8 Georgia Males if they are fans, the
following binomial distribution would be applicable. What is the probability
that at least 5 will be football fans?
n p
8 0.7
x P( x) Cumulative
0 0.0001 0.0001
1 0.0012 0.0013
2 0.0100 0.0113
3 0.0467 0.0580
4 0.1361 0.1941
5 0.2541 0.4482
6 0.2965 0.7447
7 0.1977 0.9424
8 0.0576 1.0000
“At least 5” is the probability that 5, 6, 7
or 8 will be fans. Simply add those
probabilities.
0.2541
0.2965
0.1977
0.0576
0.8059
My total is 0.8059
or about 81% which
is the probability of
at least 5 being
football fans.
Math 533 Final Exam Prep
• Analysis Example
– 9 members of the local college baseball team had the following number for extra base hits for
the year. Using the Minitab output given, determine:
A. Mean
B. Standard Deviation
C. Range
D. Median
E. The range of the data that would contain 68% of the results.
Raw Data
7
9
4
24
15
17
15
6
29
– Minitab Follows
Math 533 Final Exam Prep
Descriptive Statistics: Extra Base Hits
Variable N N* Mean SE Mean StDev Minimum Q1 Median Q3
Extra Base Hits 9 0 14.00 2.82 8.47 4.00 6.50 15.00 20.50
Variable Maximum
Extra Base Hits 29.00
Stem-and-Leaf Display: Extra Base Hits
Stem-and-leaf of Extra Base Hits N = 9
Leaf Unit = 1.0
4 0 4679
(3) 1 557
2 2 49
The range of the data that would contain 68%
of the results. (Mean – Std Dev, Mean +
Std Dev) which is (14 – 8.47, 14 + 8.47) or
(5.53,22.47)
Math 533 Final Exam Prep
• Confidence interval Example
– Acme computers needs to find a new vendor for
their hard drives. They are considering using
Howie’s Hard Drives as a vendor. Acme’s
requirement is that 95% of the hard drives last
24000 hours ± 2000 hours. The following data is
from an independent source who evaluated
Howie’s. Should Acme buy from Howie’s? Explain
your answer. (Follows on next page)
Math 533 Final Exam Prep
• Mean = 24500
• Sample Standard Deviation 2250
• Min 21402
• Max 29463
• Margin of Error 4500
• Answer Follows
Math 533 Final Exam Prep
• No, Acme shouldn’t buy from Howie’s looking
at their requirements (24000 – 2000, 24000 +
2000) which is (22000, 26,000). Based on the
results given, Howie’s would yield a tolerance
of (24500 – 2*2250, 24500+2*2250) which is
(20000, 29000). This does not meet Acme’s
requirement. You could also see this by
looking at the margin of error.
Math 533 Final Exam Prep
• Example on Pivot/Contingency Tables
• The table below gives the number of cars of
various colors and the state tag on the car for
a parking lot in a mall close to DC.
VA MD DC Other State Total
Blue 4 8 9 3 24
Black 9 7 11 8 35
White 12 14 21 15 62
Other 37 10 29 35 111
Total 62 39 70 61 232
Math 533 Final Exam Prep
• Based on the table, find the probability that a
car is from VA or MD.
• Based on the table, given that a car is from
DC, find the probability it is black.
Math 533 Final Exam Prep
VA MD DC Other State Total
Blue 4 8 9 3 24
Black 9 7 11 8 35
White 12 14 21 15 62
Other 37 10 29 35 111
Total 62 39 70 61 232
find the probability that a car is
from VA or MD. Add 62 + 39 to get
So the answer would be 91/232 or it’s
decimal form.
62 + 39 = 91
Math 533 Final Exam Prep
VA MD DC Other State Total
Blue 4 8 9 3 24
Black 9 7 11 8 35
White 12 14 21 15 62
Other 37 10 29 35 111
Total 62 39 70 61 232
Given that a car is from DC, find
the probability it is black.
Given that it is from DC means we are only
dealing with the 70 cars from DC.
There are 11 of those that are black, so the
probability is 11/70
Math 533 Final Exam Prep
• Normal Distribution Example
– The number of students who use the dining hall at
an urban college on a given day is normally
distributed with a mean of 1578 students and a
standard deviation of 274 students.
– Use Minitab for these and shouldn’t have any
issues.
Math 533 Final Exam Prep
• Another Confidence Interval Example
– I randomly sampled 18 engineers where I work and asked
them how many projects they have worked on in the last
five years. The sample mean was 21, with a standard
deviation of 5. What is the mean number of projects of all
engineers at my research center? Why? What is the 95%
confidence interval for the population mean? You are
given the information below from Minitab.
One-Sample T
N Mean StDev SE Mean 95% CI
18 21.00 5.00 1.18 (18.51, 23.49)
Math 533 Final Exam Prep
• Another Confidence Interval Example
– I randomly sampled 18 engineers where I work and asked them
how many projects they have worked on in the last five years.
The sample mean was 21, with a standard deviation of 5. What
is the mean number of projects of all engineers at my research
center? Why? What is the 95% confidence interval for the
population mean? You are given the information below from
Minitab.
Answer:
21 projects would be the best estimate for the mean. I
would expect 95% of the population mean to fall between
18.51 and 23.49 projects. The t is used because of the
sample size.
Math 533 Final Exam Prep
• Regression Example
– I did an analysis to determine if the number of
hours studied for a final exam related to the Final
Exam grade for students. On the sheets that
follow you will see what my Minitab results were.
General Regression Analysis: Final Grade versus Hours of
Study
Regression Equation
Final Grade = 34.2845 + 1.45508 Hours of Study
Coefficients
Term Coef SE Coef T P
Constant 34.2845 3.38091 10.1406 0.000
Hours of Study 1.4551 0.11118 13.0872 0.000
Summary of Model
S = 6.87303 R-Sq = 88.62% R-Sq(adj) = 88.10%
PRESS = 1426.21 R-Sq(pred) = 84.38%
Analysis of Variance
Source DF Seq SS Adj SS Adj MS F P
Regression 1 8090.71 8090.71 8090.71 171.274
0.000000
Hours of Study 1 8090.71 8090.71 8090.71 171.274
0.000000
Error 22 1039.25 1039.25 47.24
Lack-of-Fit 18 936.58 936.58 52.03 2.027 0.259215
Pure Error 4 102.67 102.67 25.67
Total 23 9129.96
Fits and Diagnostics for Unusual Observations
Final
Obs Grade Fit SE Fit Residual St Resid
24 19 37.1947 3.17993 -18.1947 -2.98609 R
R denotes an observation with a large standardized residual.
Math 533 Final Exam Prep
Predicted Values for New Observations
New Obs Fit SE Fit 95% CI 95% PI
1 48.8353 2.41382 (43.8294, 53.8413) (33.7280, 63.9426)
Values of Predictors for New Observations
Hours
of
New Obs Study
1 10
Math 533 Final Exam Prep
I did an analysis to determine if the number of hours studied for a final exam related to the
Final Exam grade for students. On the sheets that follow you will see what my Minitab
results were.
Answer the following questions.
Determine the regression equation.
What conclusions are possible using the meaning of bo (intercept) and b1 (regression coefficient) in this
problem?
What does the coefficient of determination (r-squared) mean?
Calculate the coefficient of correlation and explain what it means.
Does this data provide significant evidence (a=0.05) that the final exam grade is associated with the hours
studied? Find the p-value and interpret.
Determine the predicted grade for someone who spends 10 hours studying for the final exam.
What is the 95% confidence interval for the score for spending 10 hours studying on the test? What conclusion is
possible using this interval?
Math 533 Final Exam Prep
I did an analysis to determine if the number of hours studied for a
final exam related to the Final Exam grade for students. On the
sheets that follow you will see what my Minitab results were.
Answer the following questions.
Determine the regression equation. y= 34.2845 + 1.45508x
What conclusions are possible using the meaning of bo (intercept) and b1
(regression coefficient) in this problem? For each hour of study the final grade
is increased by about 1.5 points (1.45508). bo represents the y intercept or
34.2845 in our case. It is the score that a student could expect to get without
studying.
What does the coefficient of determination (r-squared) mean? The .886 means
that 88.6 percent of the variability of the final grade can be explained by the
number of study hours. The other 11.4% would be due to something else or
be unexplained.
Math 533 Final Exam Prep
Calculate the coefficient of correlation and explain what it means. Square Root of
(0.886) is 0.942 which is r, the correlation coefficient. With a value this close to
one, we could say there is strong positive correlation.
Does this data provide significant evidence (a=0.05) that the final exam grade is
associated with the hours studied? Find the p-value and interpret. Yes, the p value
was 0. If it were above 0.05, I would have said “no.”
Determine the predicted grade for someone who spends 10 hours studying for the
final exam. 48.8353
What is the 95% confidence interval for the score for spending 10 hours studying
on the test? What conclusion is possible using this interval? (43.8294, 53.8413)
We would be 95% confident that if someone studied for 10 hours they would
score on average between those two values.

Math533 finalexamreviewapr13

  • 1.
    Some Hints forPreparing for the Math 533 Final Exam Professor Brent Heard
  • 2.
    Math 533 FinalExam Prep • Hypothesis Tests
  • 3.
    Math 533 FinalExam Prep • Sample Question on Hypothesis Testing – Pepito’s Pizza Work is putting pizzas out by delivery as fast as they can. Pepito’s claims they can deliver pizzas within their delivery area in less than 29 minutes. You are given the following data from a sample. Sample size: 120 Deliveries Population standard deviation: 1.4 Sample mean: 28.3 Formulate a hypothesis test to evaluate the claim.
  • 4.
    Math 533 FinalExam Prep • Sample Question on Hypothesis Testing – Pepito’s Pizza Work is putting pizzas out by delivery as fast as they can. Pepito’s claims they can deliver pizzas within their delivery area in less than 29 minutes. You are given the following data from a sample. Sample size: 120 Deliveries Population standard deviation: 1.4 Sample mean: 28.3 Formulate a hypothesis test to evaluate the claim. – Answer: Ho: µ ≥ 29, Ha : µ < 29 – (In this case, the claim was Ha) – Remember Ho always contains equality (It will either be =, ≤ or ≥) – Ha will be either ≠, < or >
  • 5.
    Math 533 FinalExam Prep • Sample Question on Binomial Distribution – Assume that a study was done finding that 70 percent of males in Georgia are football fans. If a researcher asks 8 Georgia Males if they are fans, the following binomial distribution would be applicable. What is the probability that at least 5 will be football fans? n p 8 0.7 x P( x) Cumulative 0 0.0001 0.0001 1 0.0012 0.0013 2 0.0100 0.0113 3 0.0467 0.0580 4 0.1361 0.1941 5 0.2541 0.4482 6 0.2965 0.7447 7 0.1977 0.9424 8 0.0576 1.0000
  • 6.
    Math 533 FinalExam Prep • Sample Question on Binomial Distribution – Assume that a study was done finding that 70 percent of males in Georgia are football fans. If a researcher asks 8 Georgia Males if they are fans, the following binomial distribution would be applicable. What is the probability that at least 5 will be football fans? n p 8 0.7 x P( x) Cumulative 0 0.0001 0.0001 1 0.0012 0.0013 2 0.0100 0.0113 3 0.0467 0.0580 4 0.1361 0.1941 5 0.2541 0.4482 6 0.2965 0.7447 7 0.1977 0.9424 8 0.0576 1.0000 “At least 5” is the probability that 5, 6, 7 or 8 will be fans. Simply add those probabilities. 0.2541 0.2965 0.1977 0.0576 0.8059 My total is 0.8059 or about 81% which is the probability of at least 5 being football fans.
  • 7.
    Math 533 FinalExam Prep • Analysis Example – 9 members of the local college baseball team had the following number for extra base hits for the year. Using the Minitab output given, determine: A. Mean B. Standard Deviation C. Range D. Median E. The range of the data that would contain 68% of the results. Raw Data 7 9 4 24 15 17 15 6 29 – Minitab Follows
  • 8.
    Math 533 FinalExam Prep Descriptive Statistics: Extra Base Hits Variable N N* Mean SE Mean StDev Minimum Q1 Median Q3 Extra Base Hits 9 0 14.00 2.82 8.47 4.00 6.50 15.00 20.50 Variable Maximum Extra Base Hits 29.00 Stem-and-Leaf Display: Extra Base Hits Stem-and-leaf of Extra Base Hits N = 9 Leaf Unit = 1.0 4 0 4679 (3) 1 557 2 2 49 The range of the data that would contain 68% of the results. (Mean – Std Dev, Mean + Std Dev) which is (14 – 8.47, 14 + 8.47) or (5.53,22.47)
  • 9.
    Math 533 FinalExam Prep • Confidence interval Example – Acme computers needs to find a new vendor for their hard drives. They are considering using Howie’s Hard Drives as a vendor. Acme’s requirement is that 95% of the hard drives last 24000 hours ± 2000 hours. The following data is from an independent source who evaluated Howie’s. Should Acme buy from Howie’s? Explain your answer. (Follows on next page)
  • 10.
    Math 533 FinalExam Prep • Mean = 24500 • Sample Standard Deviation 2250 • Min 21402 • Max 29463 • Margin of Error 4500 • Answer Follows
  • 11.
    Math 533 FinalExam Prep • No, Acme shouldn’t buy from Howie’s looking at their requirements (24000 – 2000, 24000 + 2000) which is (22000, 26,000). Based on the results given, Howie’s would yield a tolerance of (24500 – 2*2250, 24500+2*2250) which is (20000, 29000). This does not meet Acme’s requirement. You could also see this by looking at the margin of error.
  • 12.
    Math 533 FinalExam Prep • Example on Pivot/Contingency Tables • The table below gives the number of cars of various colors and the state tag on the car for a parking lot in a mall close to DC. VA MD DC Other State Total Blue 4 8 9 3 24 Black 9 7 11 8 35 White 12 14 21 15 62 Other 37 10 29 35 111 Total 62 39 70 61 232
  • 13.
    Math 533 FinalExam Prep • Based on the table, find the probability that a car is from VA or MD. • Based on the table, given that a car is from DC, find the probability it is black.
  • 14.
    Math 533 FinalExam Prep VA MD DC Other State Total Blue 4 8 9 3 24 Black 9 7 11 8 35 White 12 14 21 15 62 Other 37 10 29 35 111 Total 62 39 70 61 232 find the probability that a car is from VA or MD. Add 62 + 39 to get So the answer would be 91/232 or it’s decimal form. 62 + 39 = 91
  • 15.
    Math 533 FinalExam Prep VA MD DC Other State Total Blue 4 8 9 3 24 Black 9 7 11 8 35 White 12 14 21 15 62 Other 37 10 29 35 111 Total 62 39 70 61 232 Given that a car is from DC, find the probability it is black. Given that it is from DC means we are only dealing with the 70 cars from DC. There are 11 of those that are black, so the probability is 11/70
  • 16.
    Math 533 FinalExam Prep • Normal Distribution Example – The number of students who use the dining hall at an urban college on a given day is normally distributed with a mean of 1578 students and a standard deviation of 274 students. – Use Minitab for these and shouldn’t have any issues.
  • 17.
    Math 533 FinalExam Prep • Another Confidence Interval Example – I randomly sampled 18 engineers where I work and asked them how many projects they have worked on in the last five years. The sample mean was 21, with a standard deviation of 5. What is the mean number of projects of all engineers at my research center? Why? What is the 95% confidence interval for the population mean? You are given the information below from Minitab. One-Sample T N Mean StDev SE Mean 95% CI 18 21.00 5.00 1.18 (18.51, 23.49)
  • 18.
    Math 533 FinalExam Prep • Another Confidence Interval Example – I randomly sampled 18 engineers where I work and asked them how many projects they have worked on in the last five years. The sample mean was 21, with a standard deviation of 5. What is the mean number of projects of all engineers at my research center? Why? What is the 95% confidence interval for the population mean? You are given the information below from Minitab. Answer: 21 projects would be the best estimate for the mean. I would expect 95% of the population mean to fall between 18.51 and 23.49 projects. The t is used because of the sample size.
  • 19.
    Math 533 FinalExam Prep • Regression Example – I did an analysis to determine if the number of hours studied for a final exam related to the Final Exam grade for students. On the sheets that follow you will see what my Minitab results were.
  • 20.
    General Regression Analysis:Final Grade versus Hours of Study Regression Equation Final Grade = 34.2845 + 1.45508 Hours of Study Coefficients Term Coef SE Coef T P Constant 34.2845 3.38091 10.1406 0.000 Hours of Study 1.4551 0.11118 13.0872 0.000 Summary of Model S = 6.87303 R-Sq = 88.62% R-Sq(adj) = 88.10% PRESS = 1426.21 R-Sq(pred) = 84.38% Analysis of Variance Source DF Seq SS Adj SS Adj MS F P Regression 1 8090.71 8090.71 8090.71 171.274 0.000000 Hours of Study 1 8090.71 8090.71 8090.71 171.274 0.000000 Error 22 1039.25 1039.25 47.24 Lack-of-Fit 18 936.58 936.58 52.03 2.027 0.259215 Pure Error 4 102.67 102.67 25.67 Total 23 9129.96 Fits and Diagnostics for Unusual Observations Final Obs Grade Fit SE Fit Residual St Resid 24 19 37.1947 3.17993 -18.1947 -2.98609 R R denotes an observation with a large standardized residual.
  • 21.
    Math 533 FinalExam Prep Predicted Values for New Observations New Obs Fit SE Fit 95% CI 95% PI 1 48.8353 2.41382 (43.8294, 53.8413) (33.7280, 63.9426) Values of Predictors for New Observations Hours of New Obs Study 1 10
  • 22.
    Math 533 FinalExam Prep I did an analysis to determine if the number of hours studied for a final exam related to the Final Exam grade for students. On the sheets that follow you will see what my Minitab results were. Answer the following questions. Determine the regression equation. What conclusions are possible using the meaning of bo (intercept) and b1 (regression coefficient) in this problem? What does the coefficient of determination (r-squared) mean? Calculate the coefficient of correlation and explain what it means. Does this data provide significant evidence (a=0.05) that the final exam grade is associated with the hours studied? Find the p-value and interpret. Determine the predicted grade for someone who spends 10 hours studying for the final exam. What is the 95% confidence interval for the score for spending 10 hours studying on the test? What conclusion is possible using this interval?
  • 23.
    Math 533 FinalExam Prep I did an analysis to determine if the number of hours studied for a final exam related to the Final Exam grade for students. On the sheets that follow you will see what my Minitab results were. Answer the following questions. Determine the regression equation. y= 34.2845 + 1.45508x What conclusions are possible using the meaning of bo (intercept) and b1 (regression coefficient) in this problem? For each hour of study the final grade is increased by about 1.5 points (1.45508). bo represents the y intercept or 34.2845 in our case. It is the score that a student could expect to get without studying. What does the coefficient of determination (r-squared) mean? The .886 means that 88.6 percent of the variability of the final grade can be explained by the number of study hours. The other 11.4% would be due to something else or be unexplained.
  • 24.
    Math 533 FinalExam Prep Calculate the coefficient of correlation and explain what it means. Square Root of (0.886) is 0.942 which is r, the correlation coefficient. With a value this close to one, we could say there is strong positive correlation. Does this data provide significant evidence (a=0.05) that the final exam grade is associated with the hours studied? Find the p-value and interpret. Yes, the p value was 0. If it were above 0.05, I would have said “no.” Determine the predicted grade for someone who spends 10 hours studying for the final exam. 48.8353 What is the 95% confidence interval for the score for spending 10 hours studying on the test? What conclusion is possible using this interval? (43.8294, 53.8413) We would be 95% confident that if someone studied for 10 hours they would score on average between those two values.