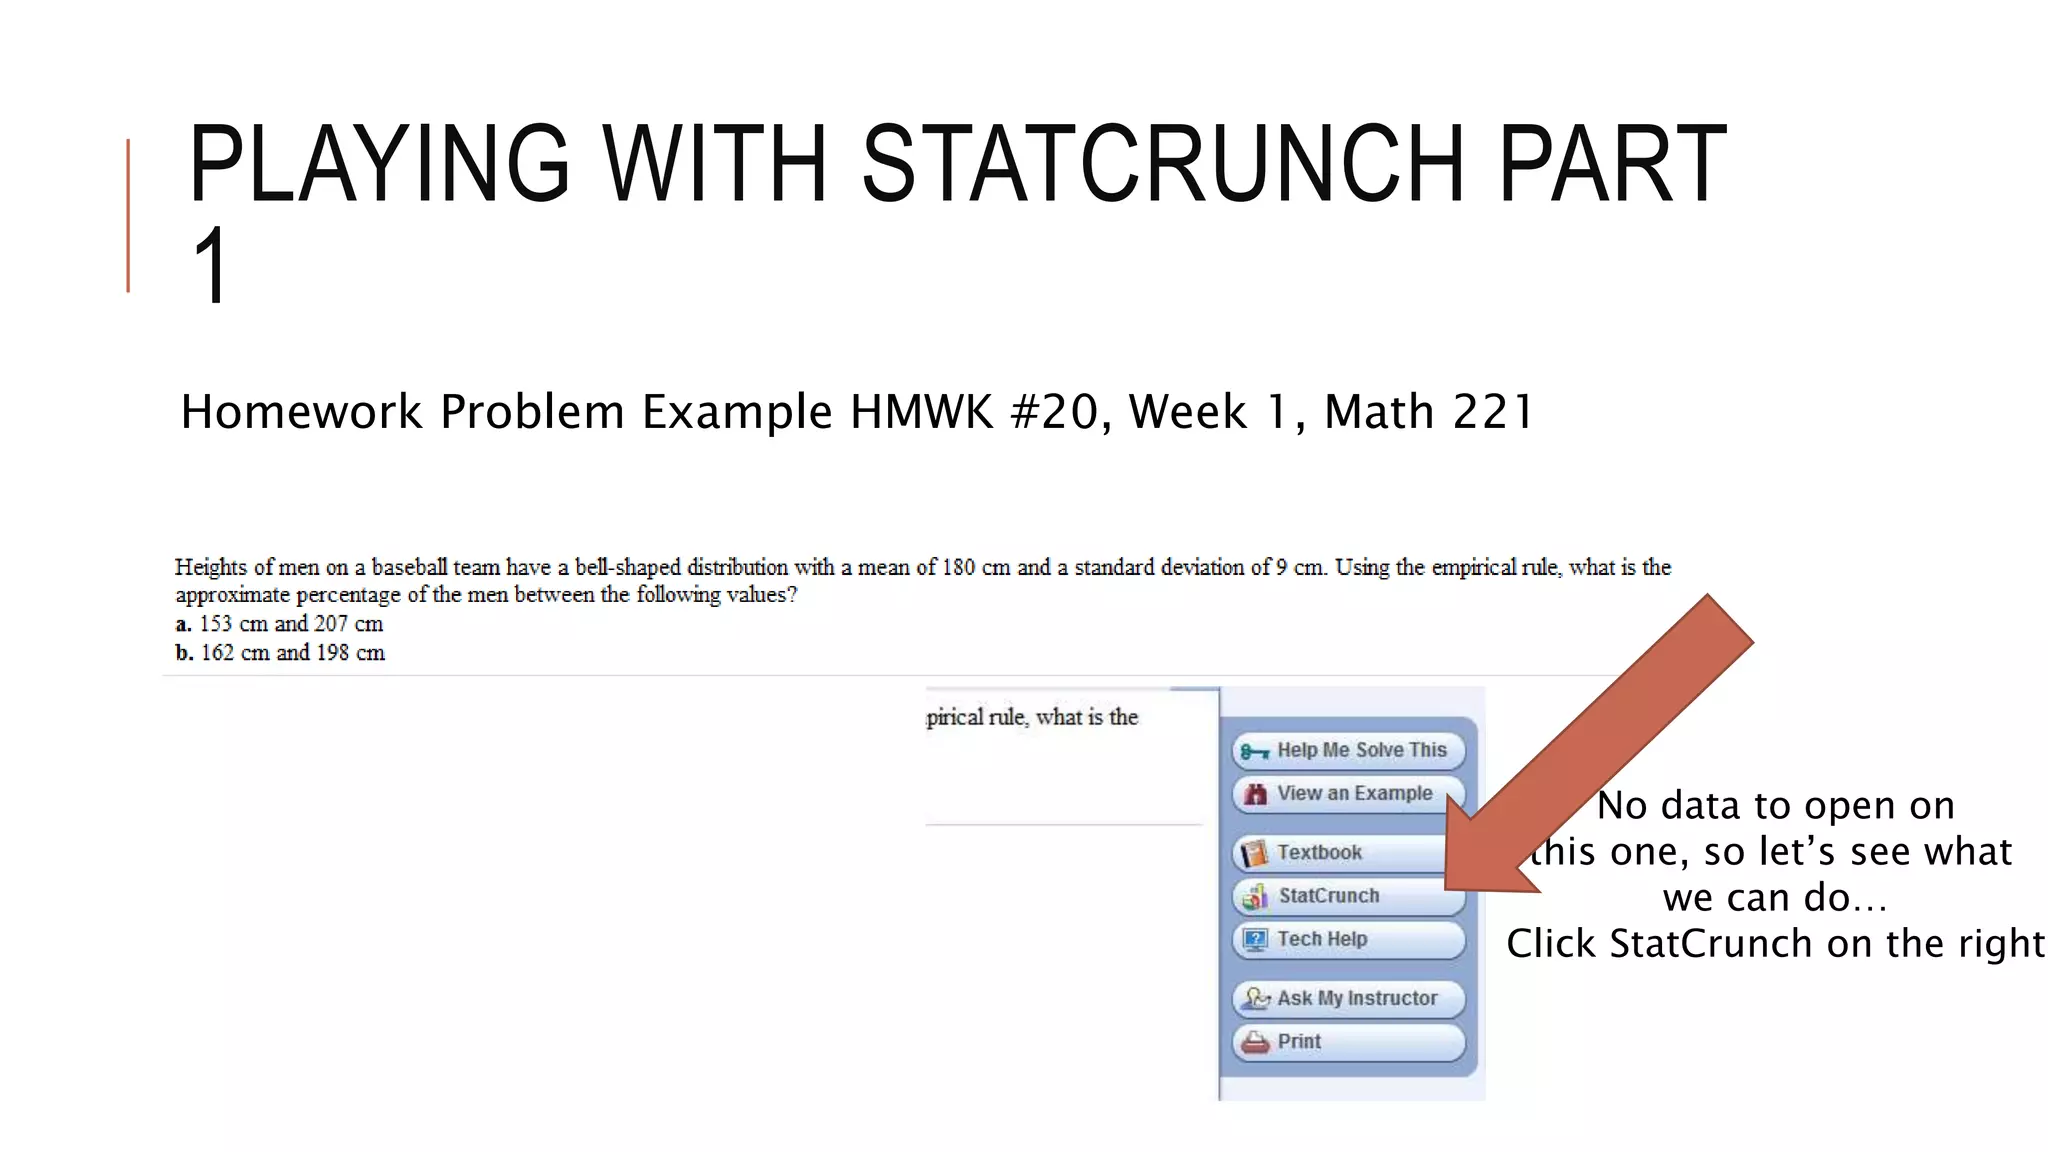
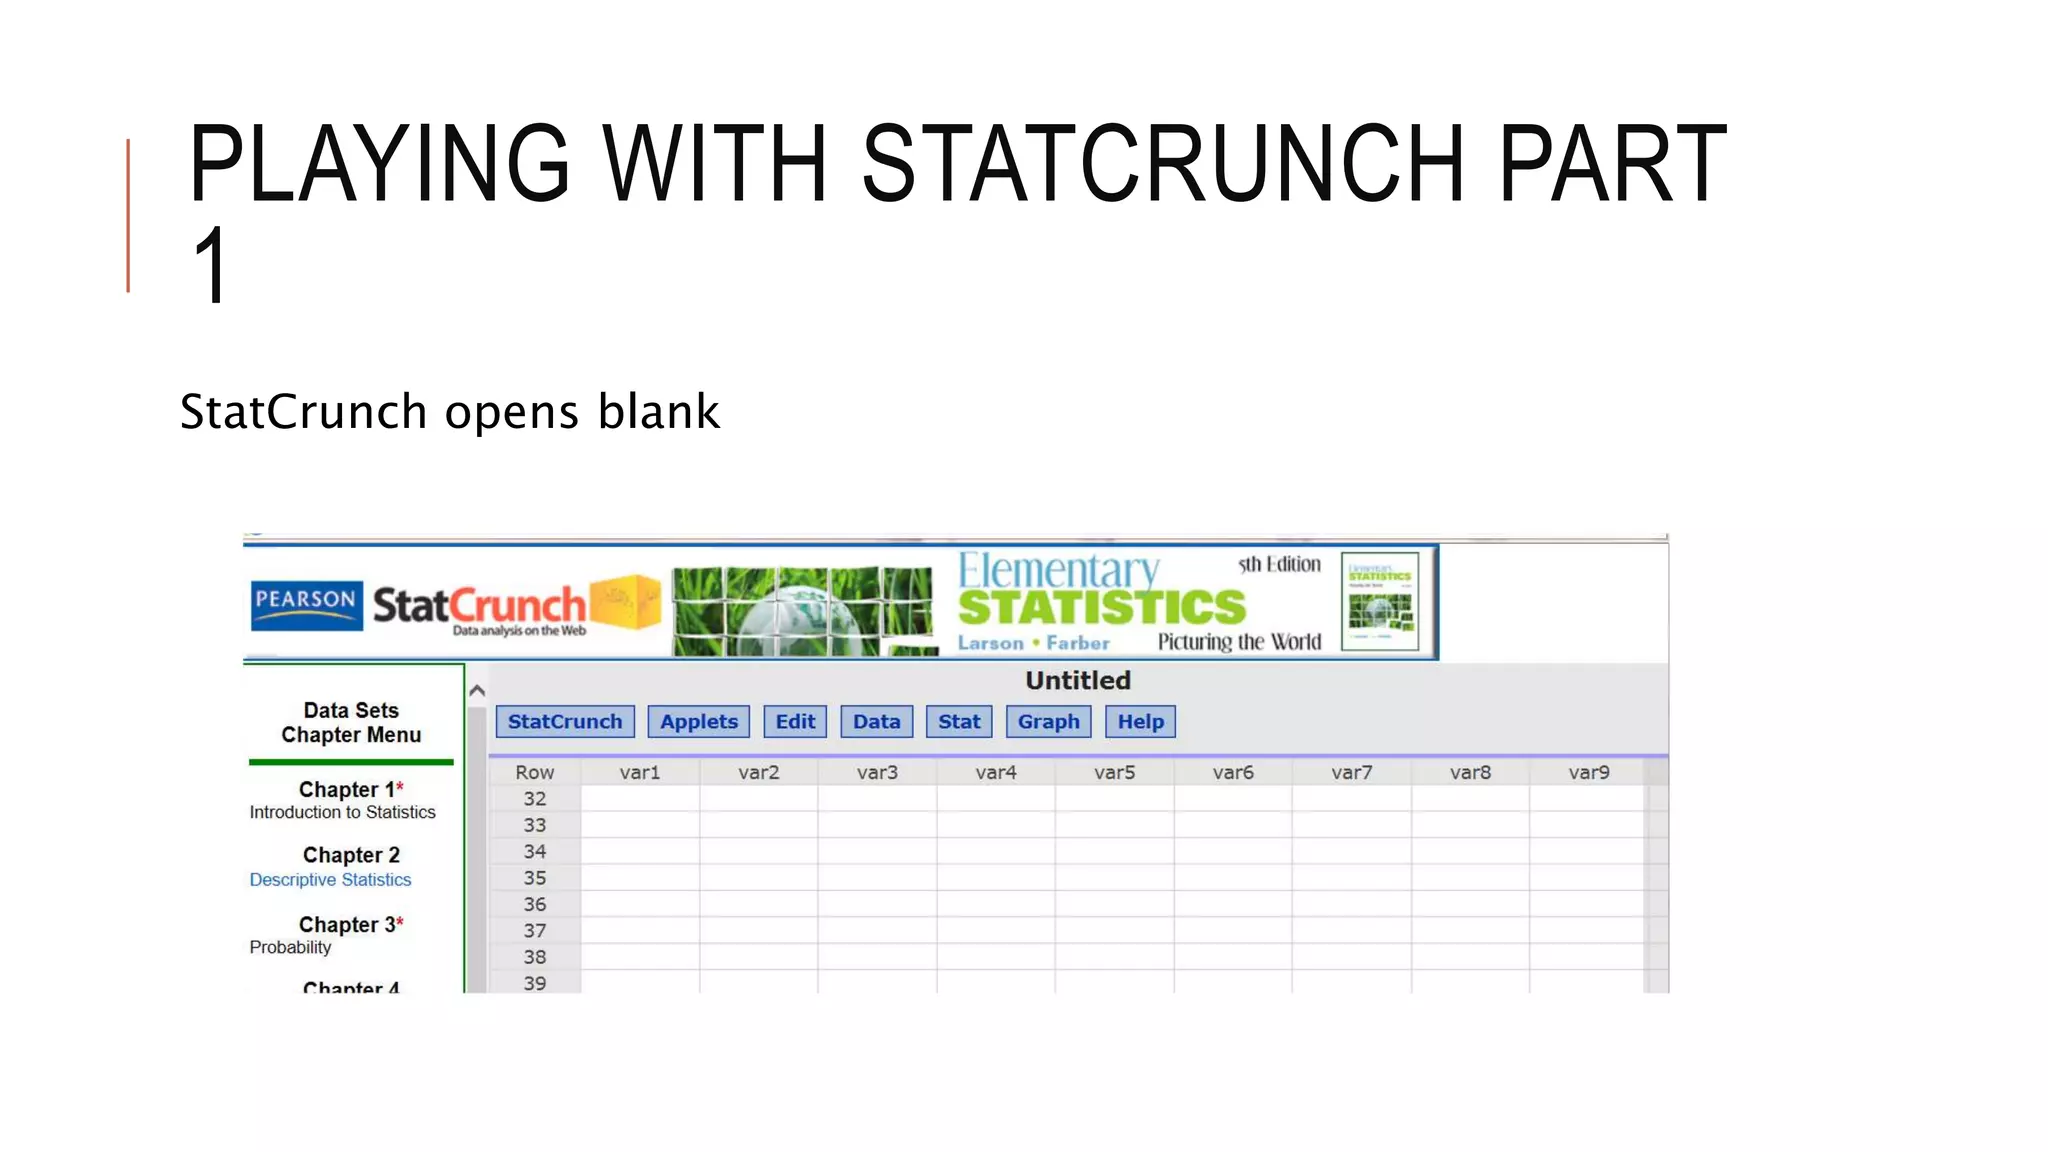
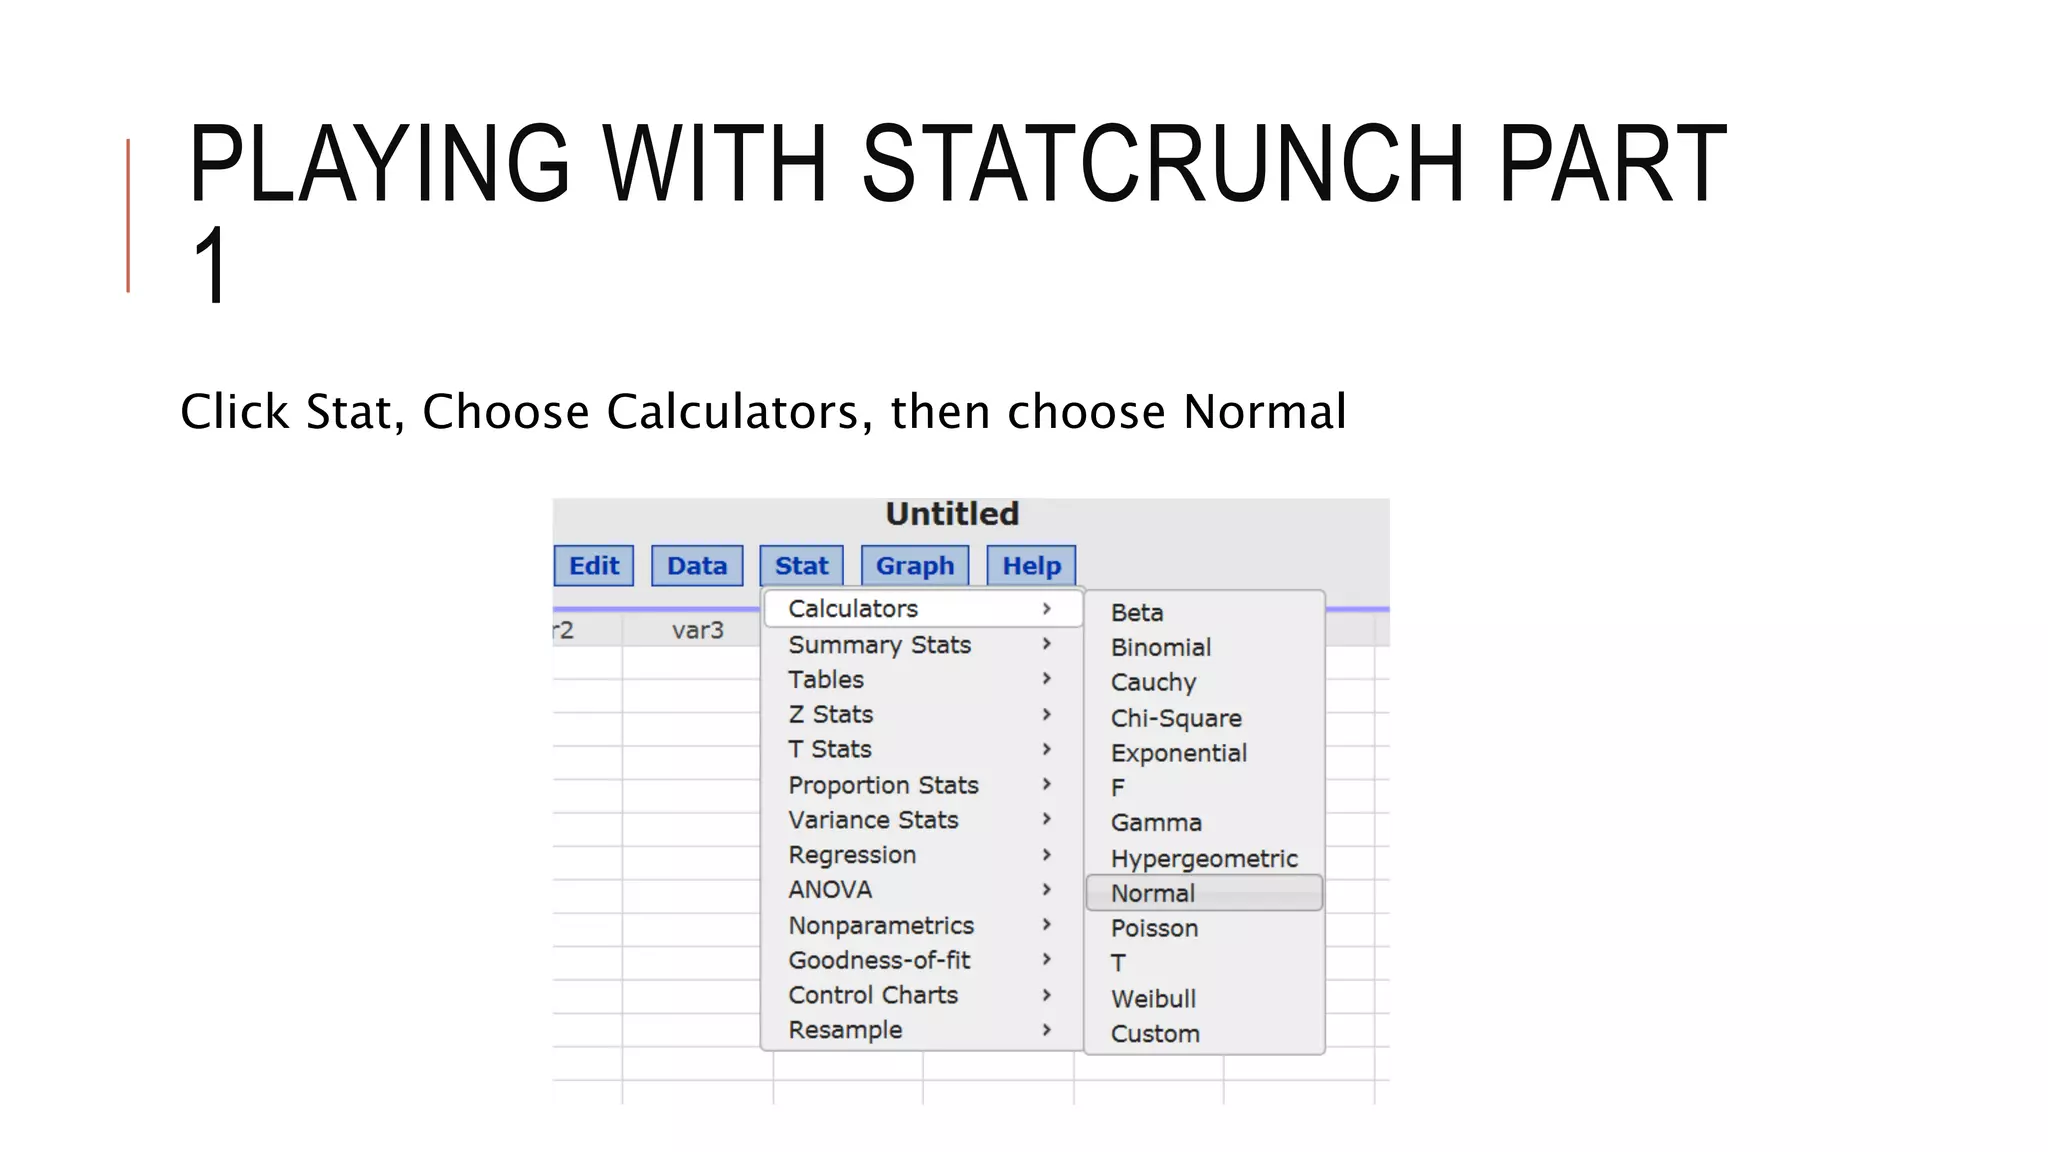
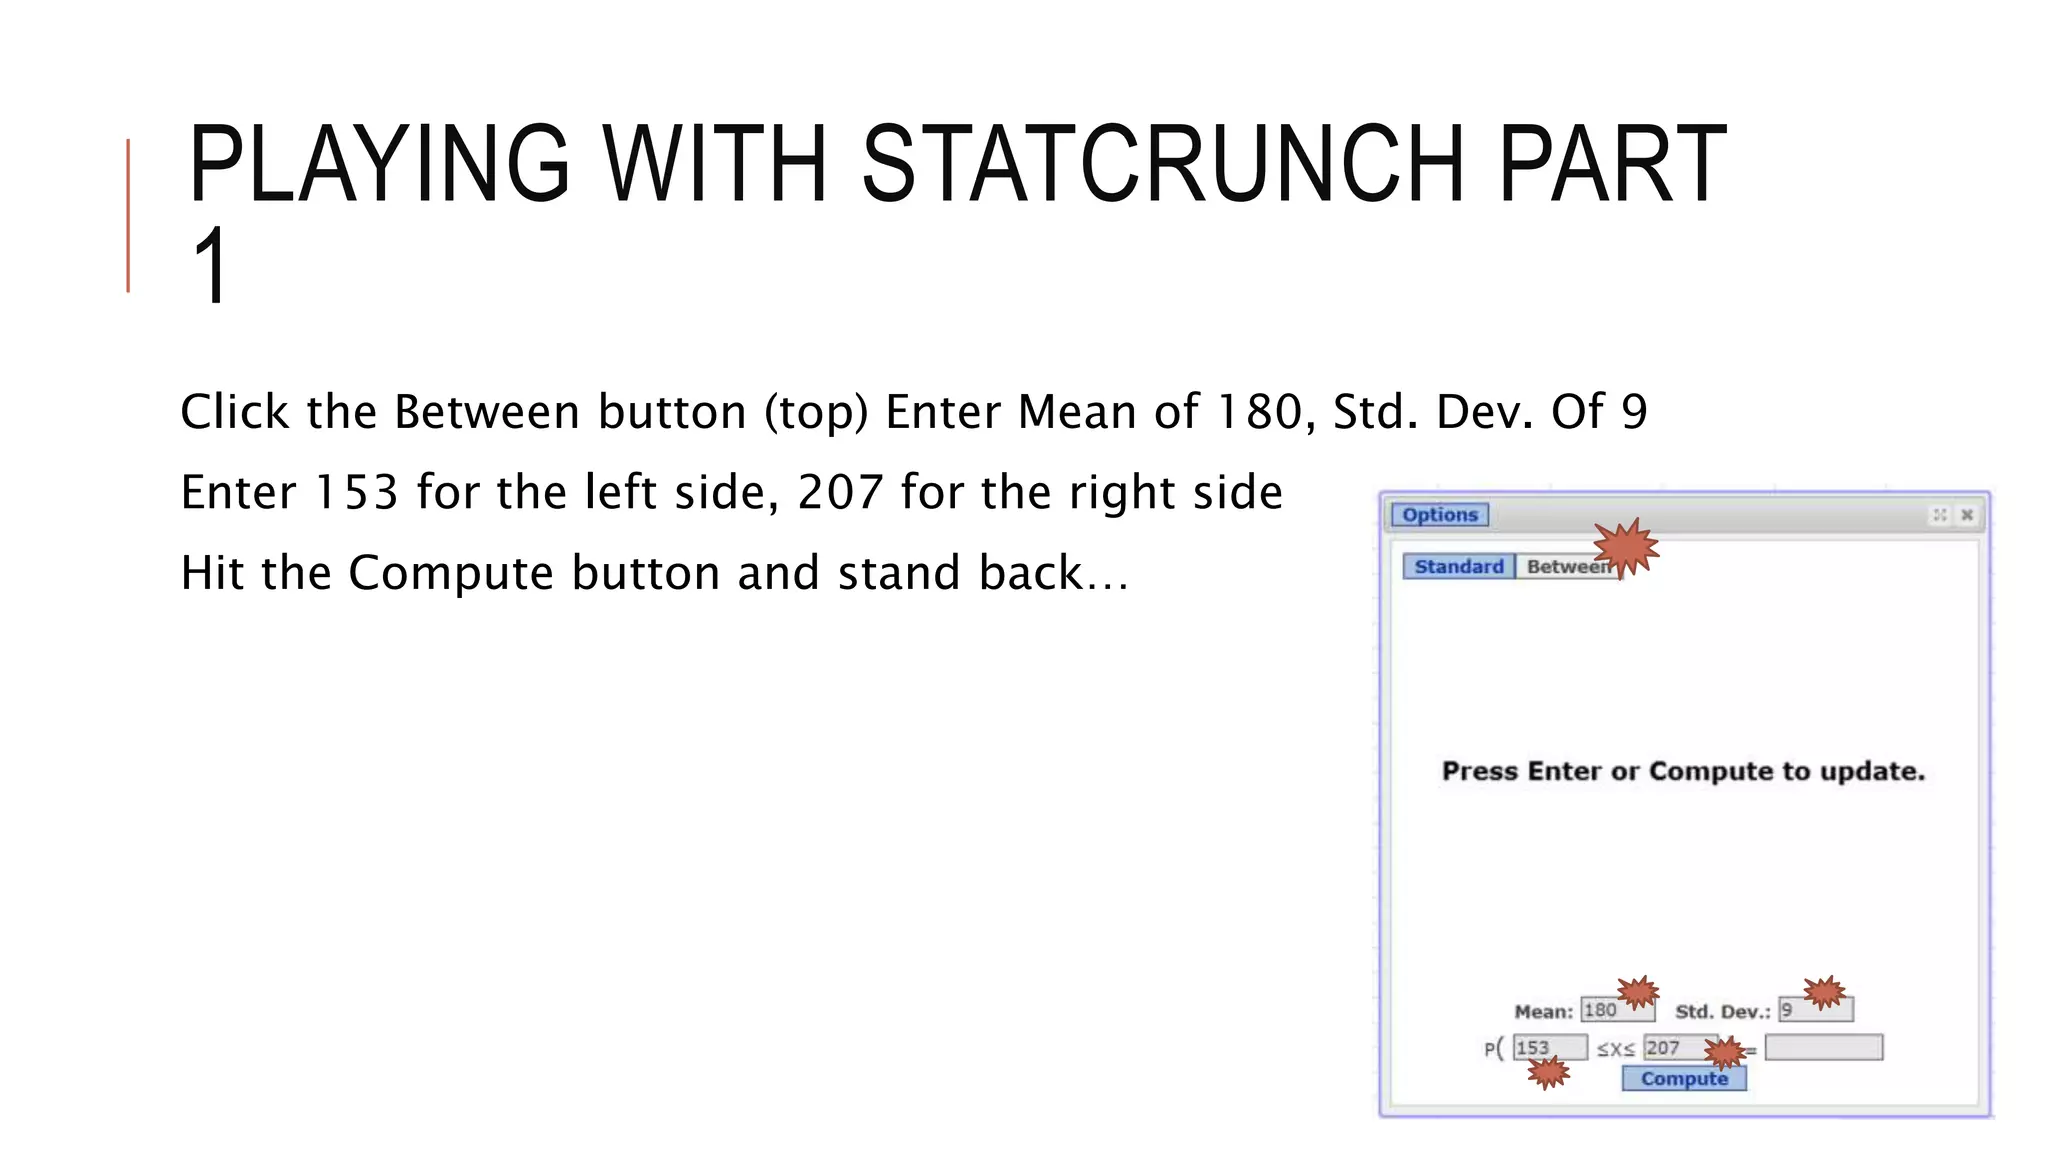
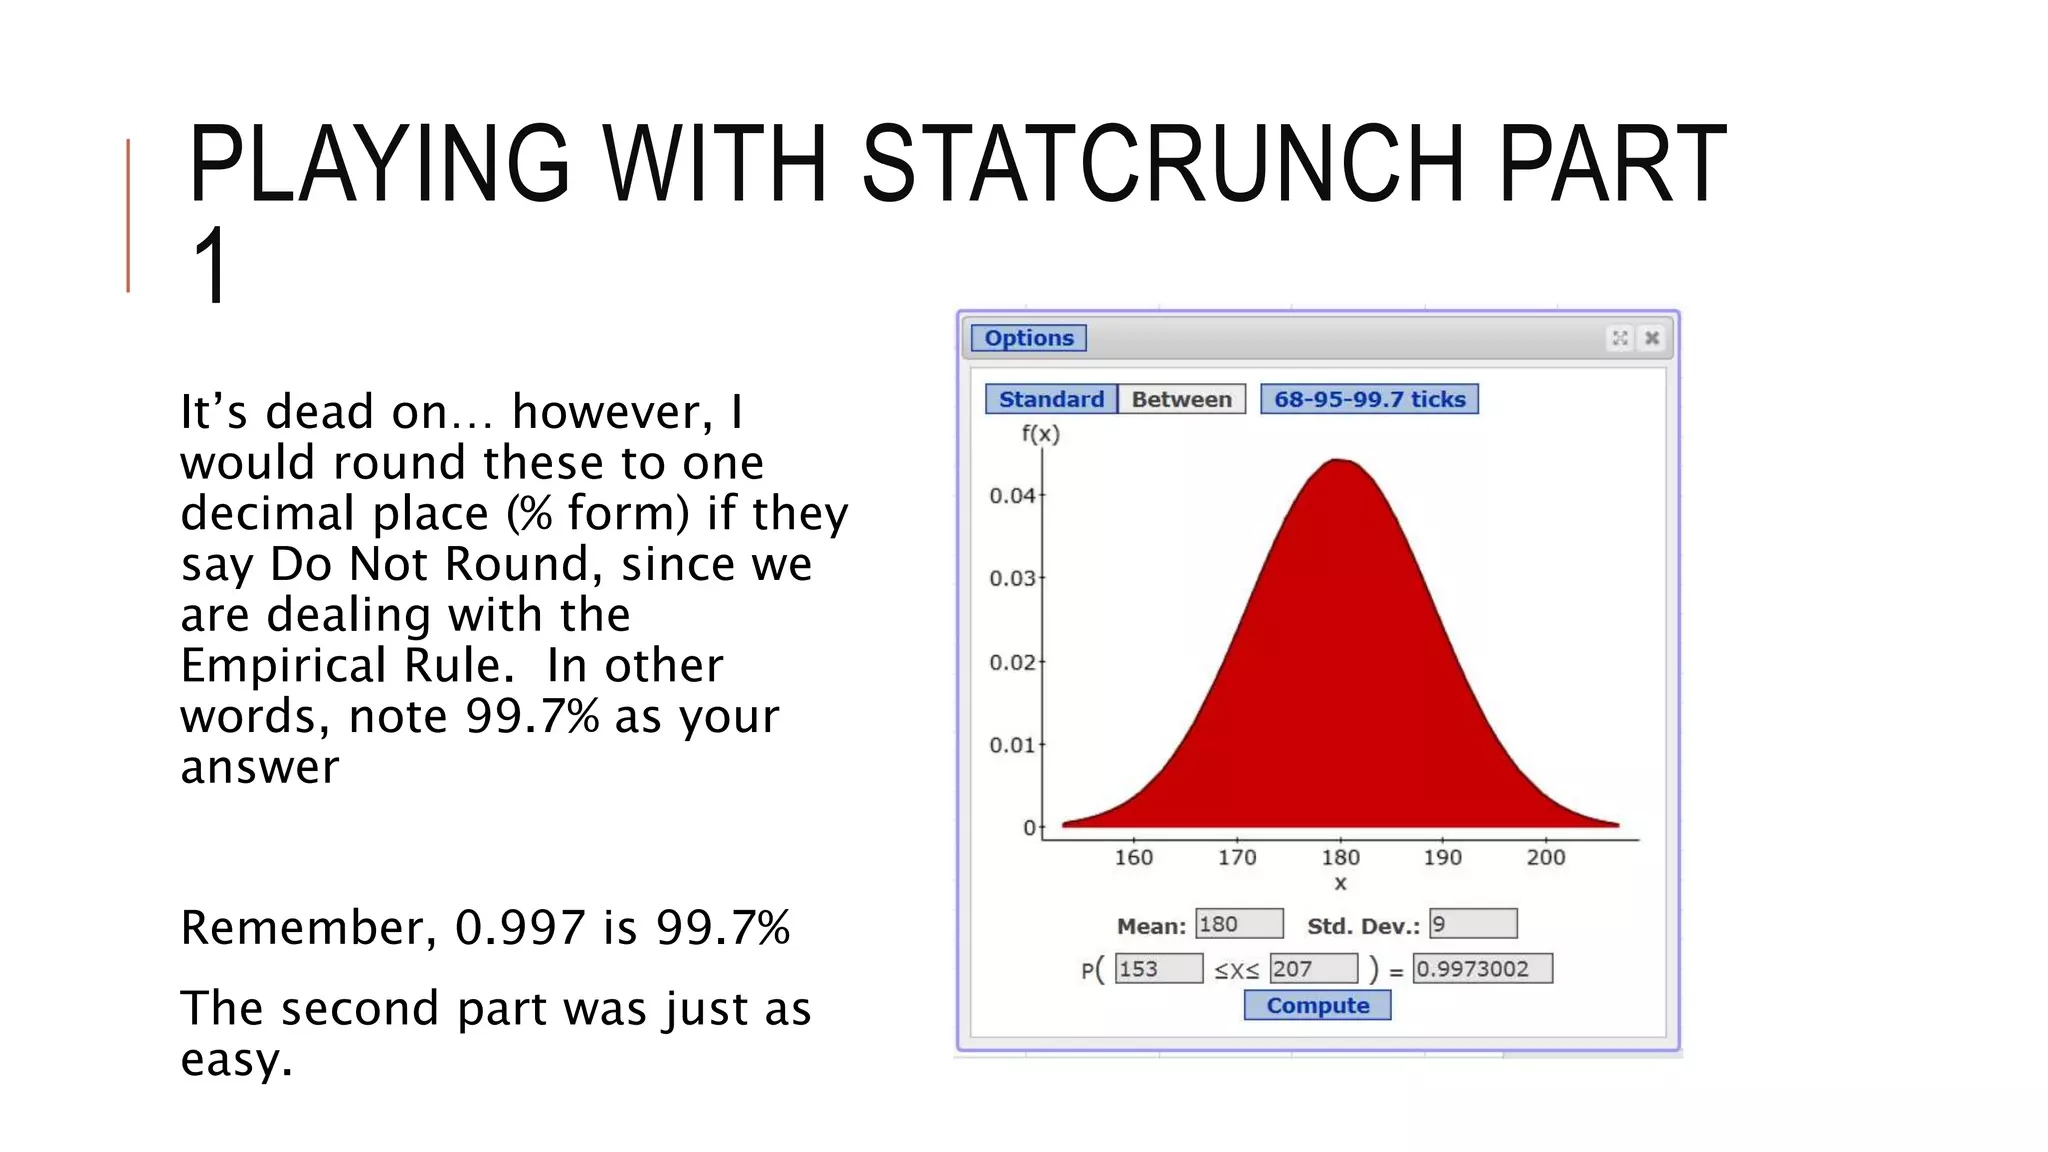
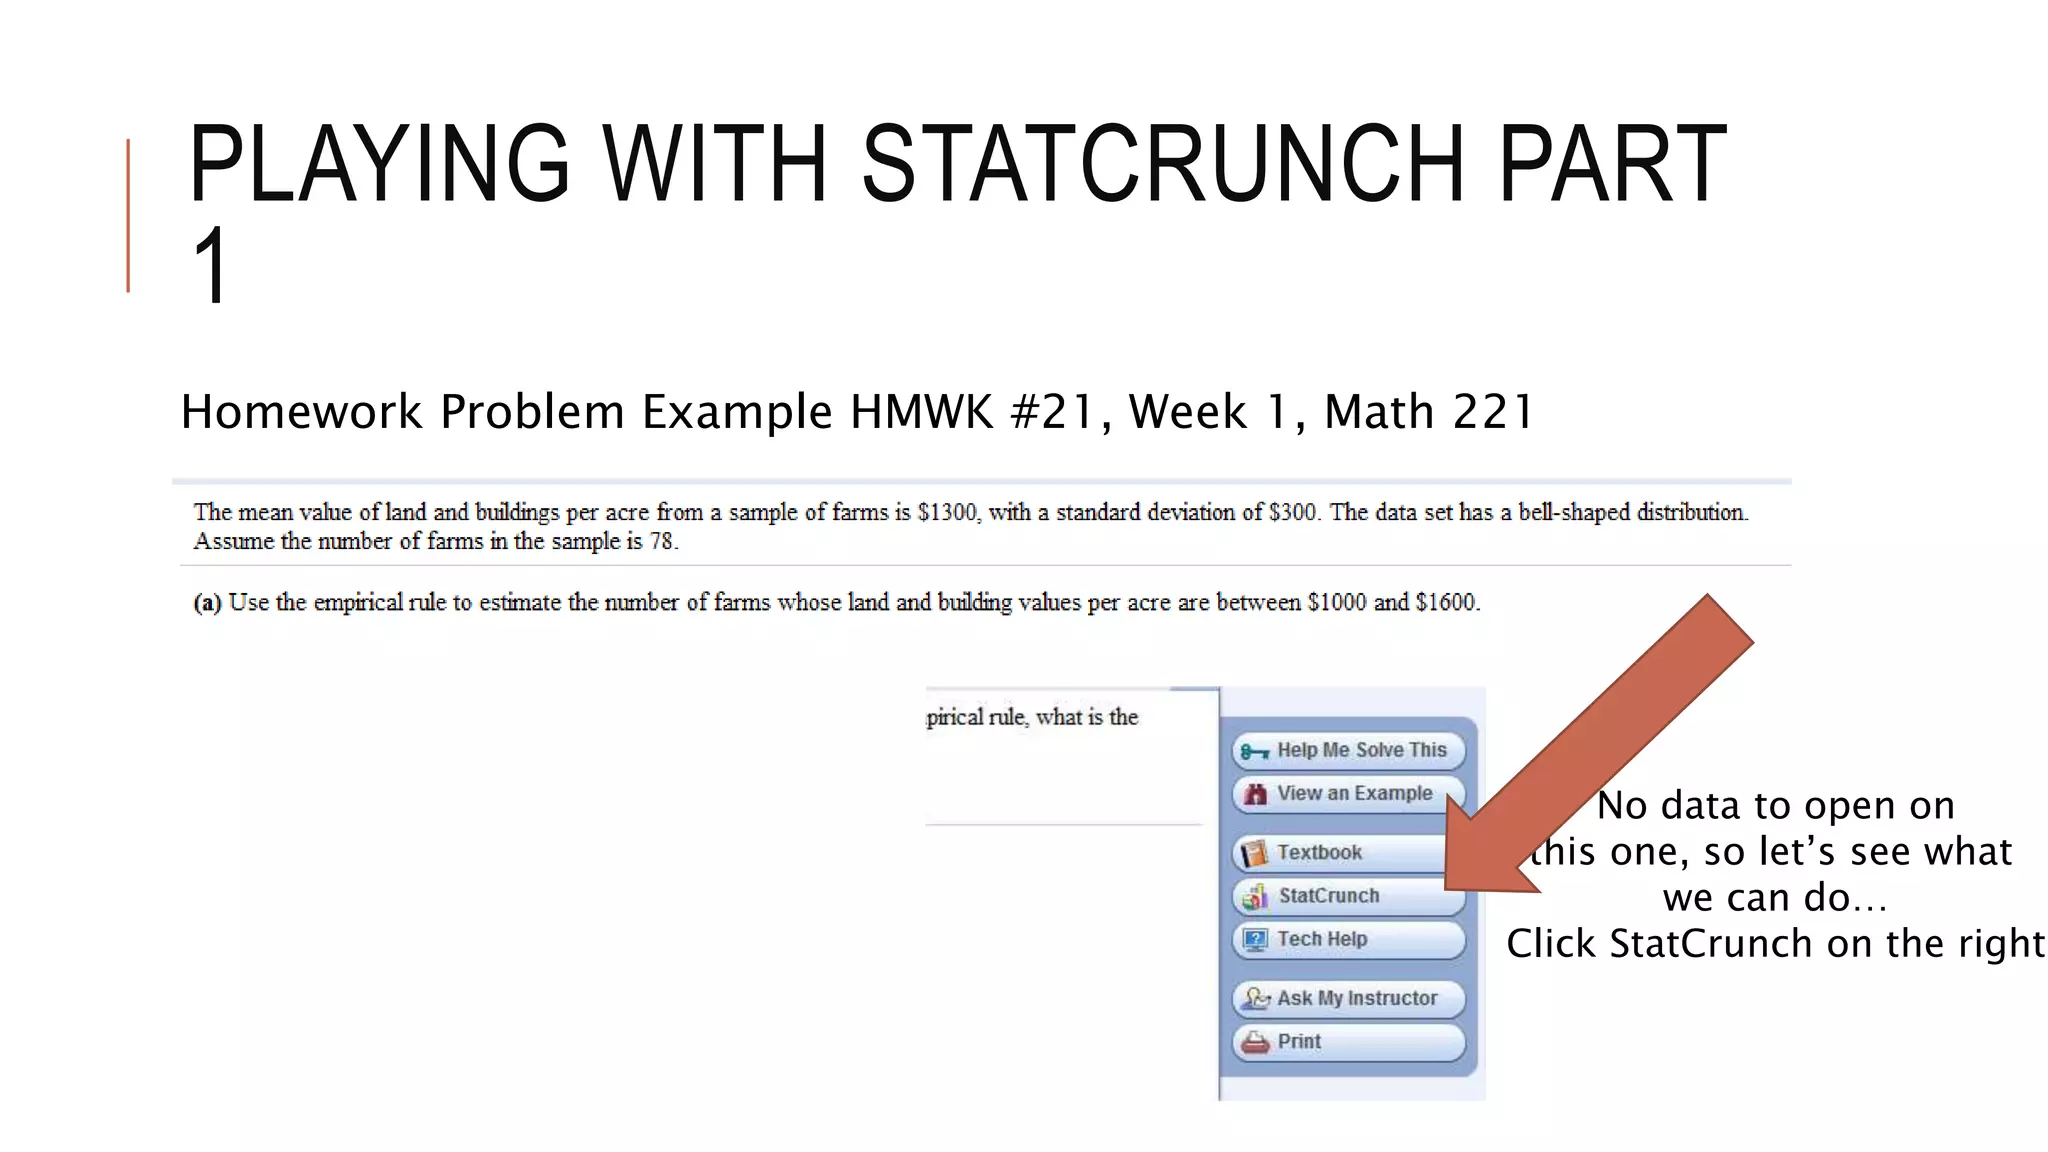
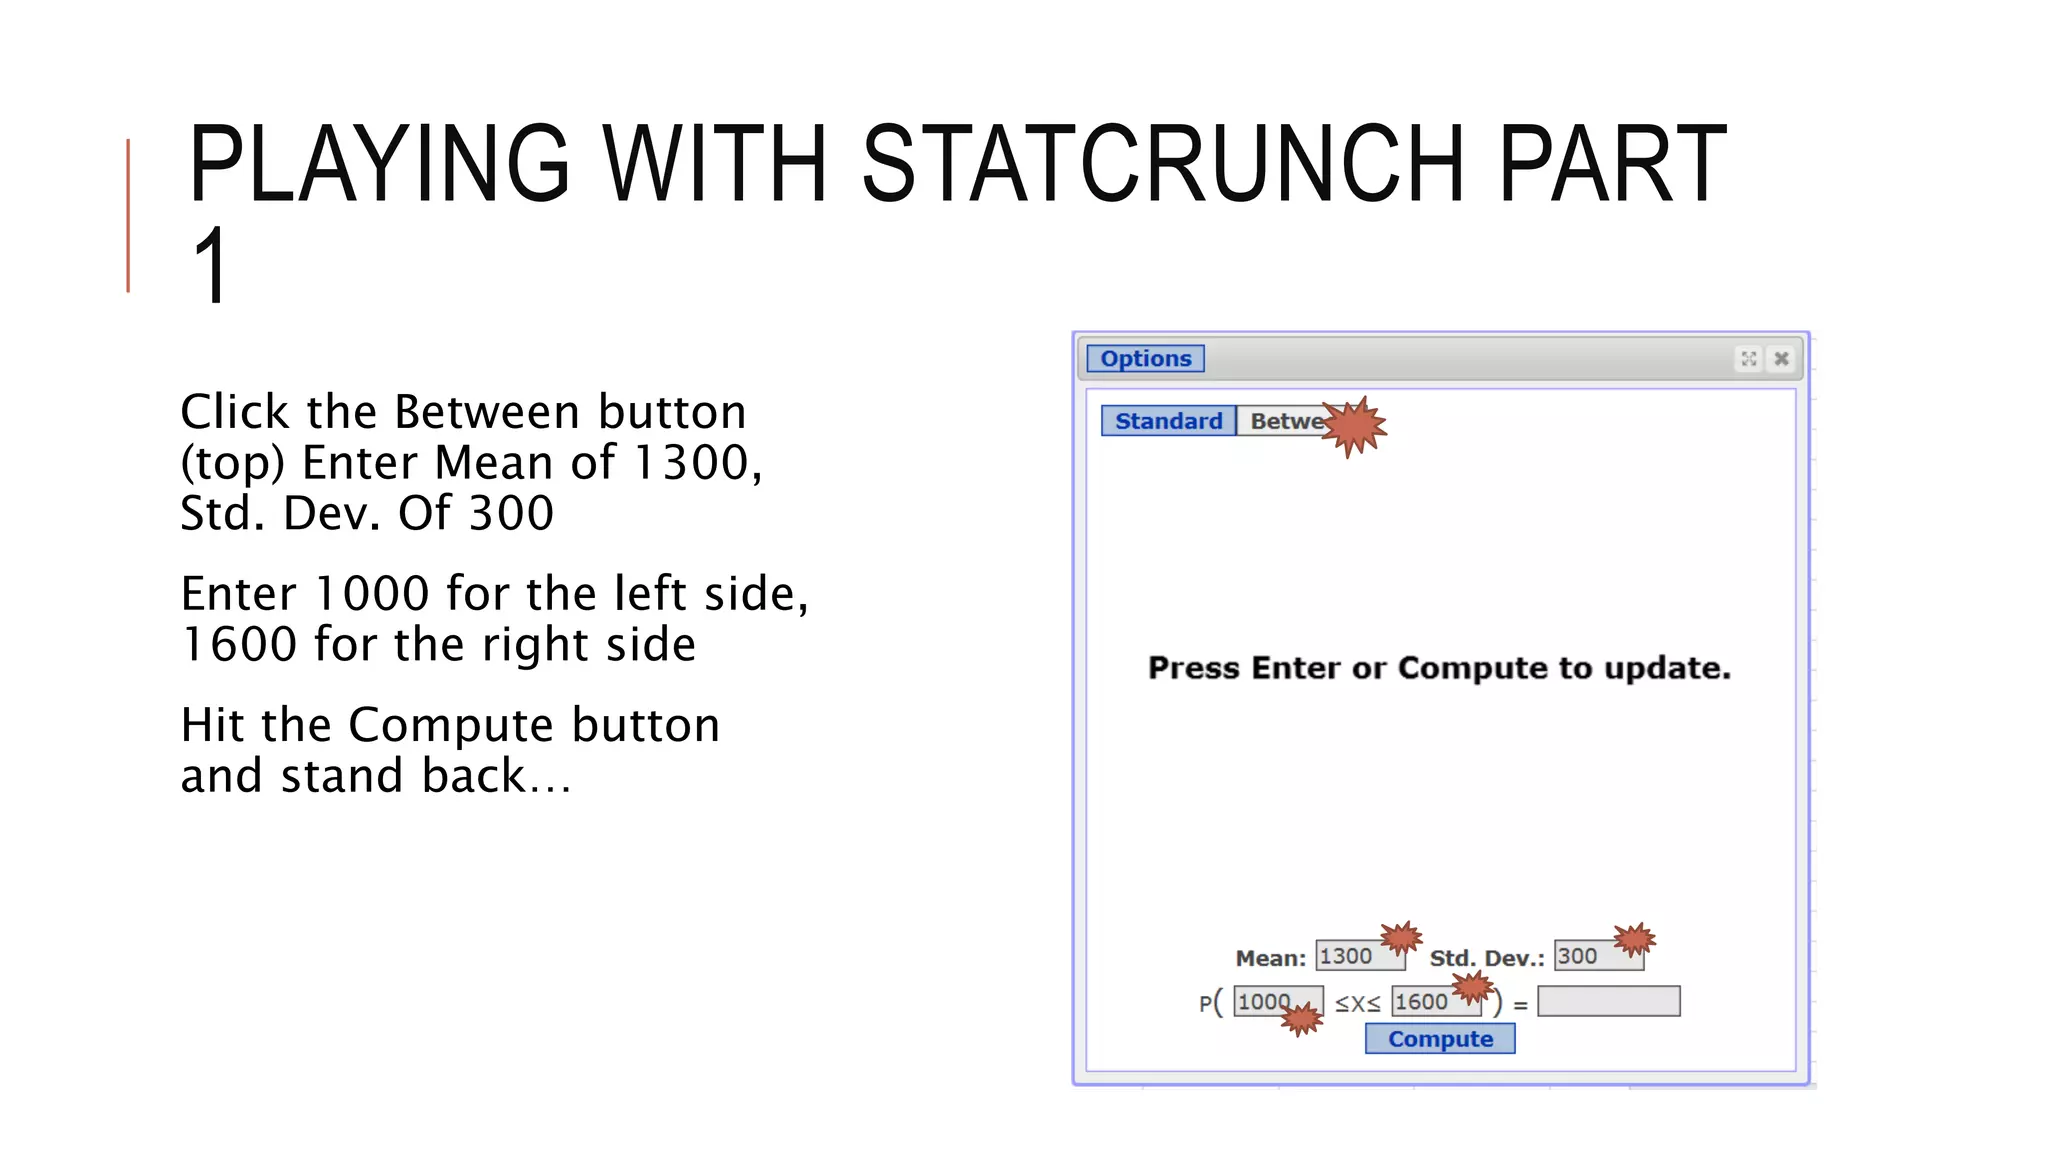
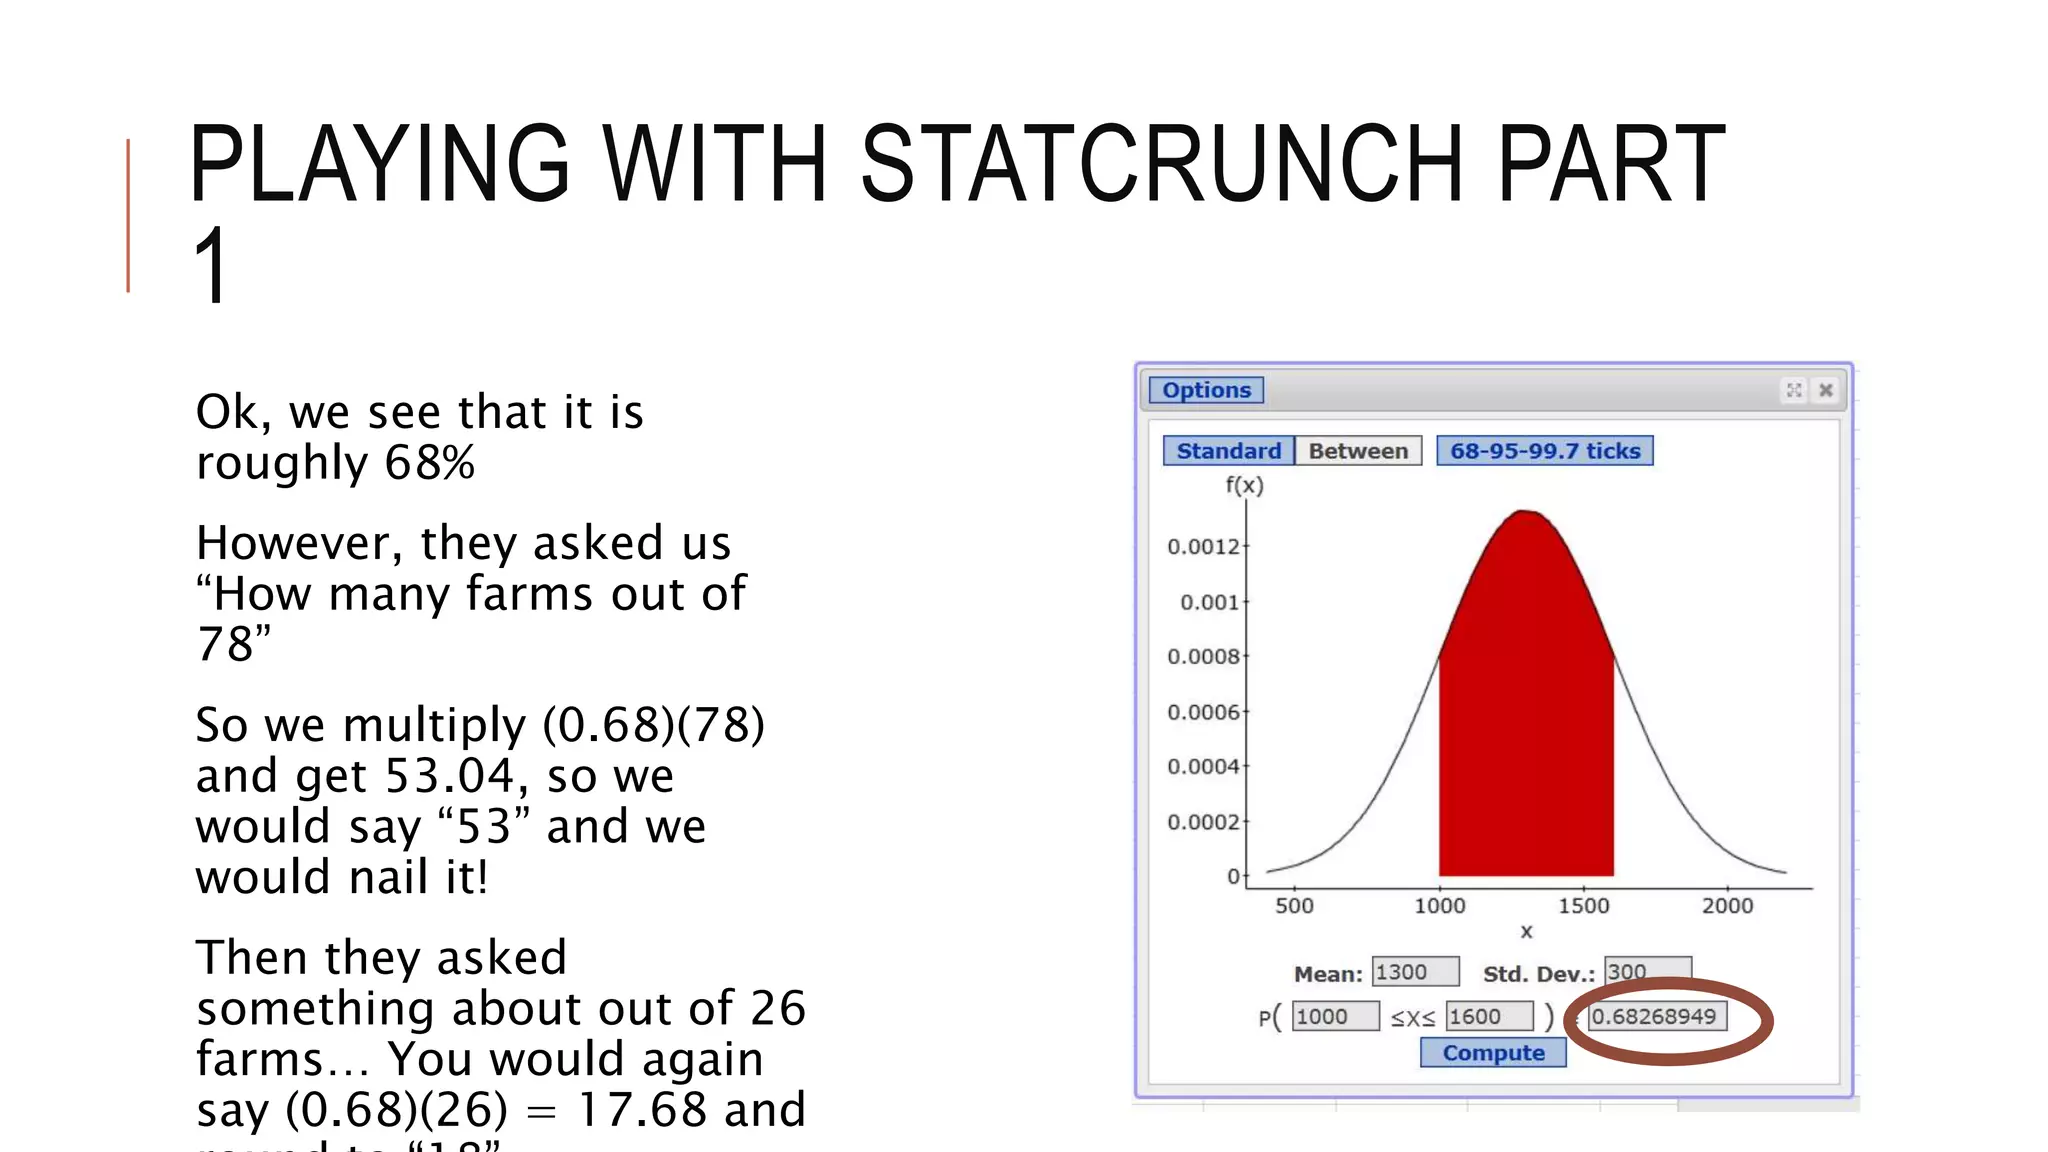
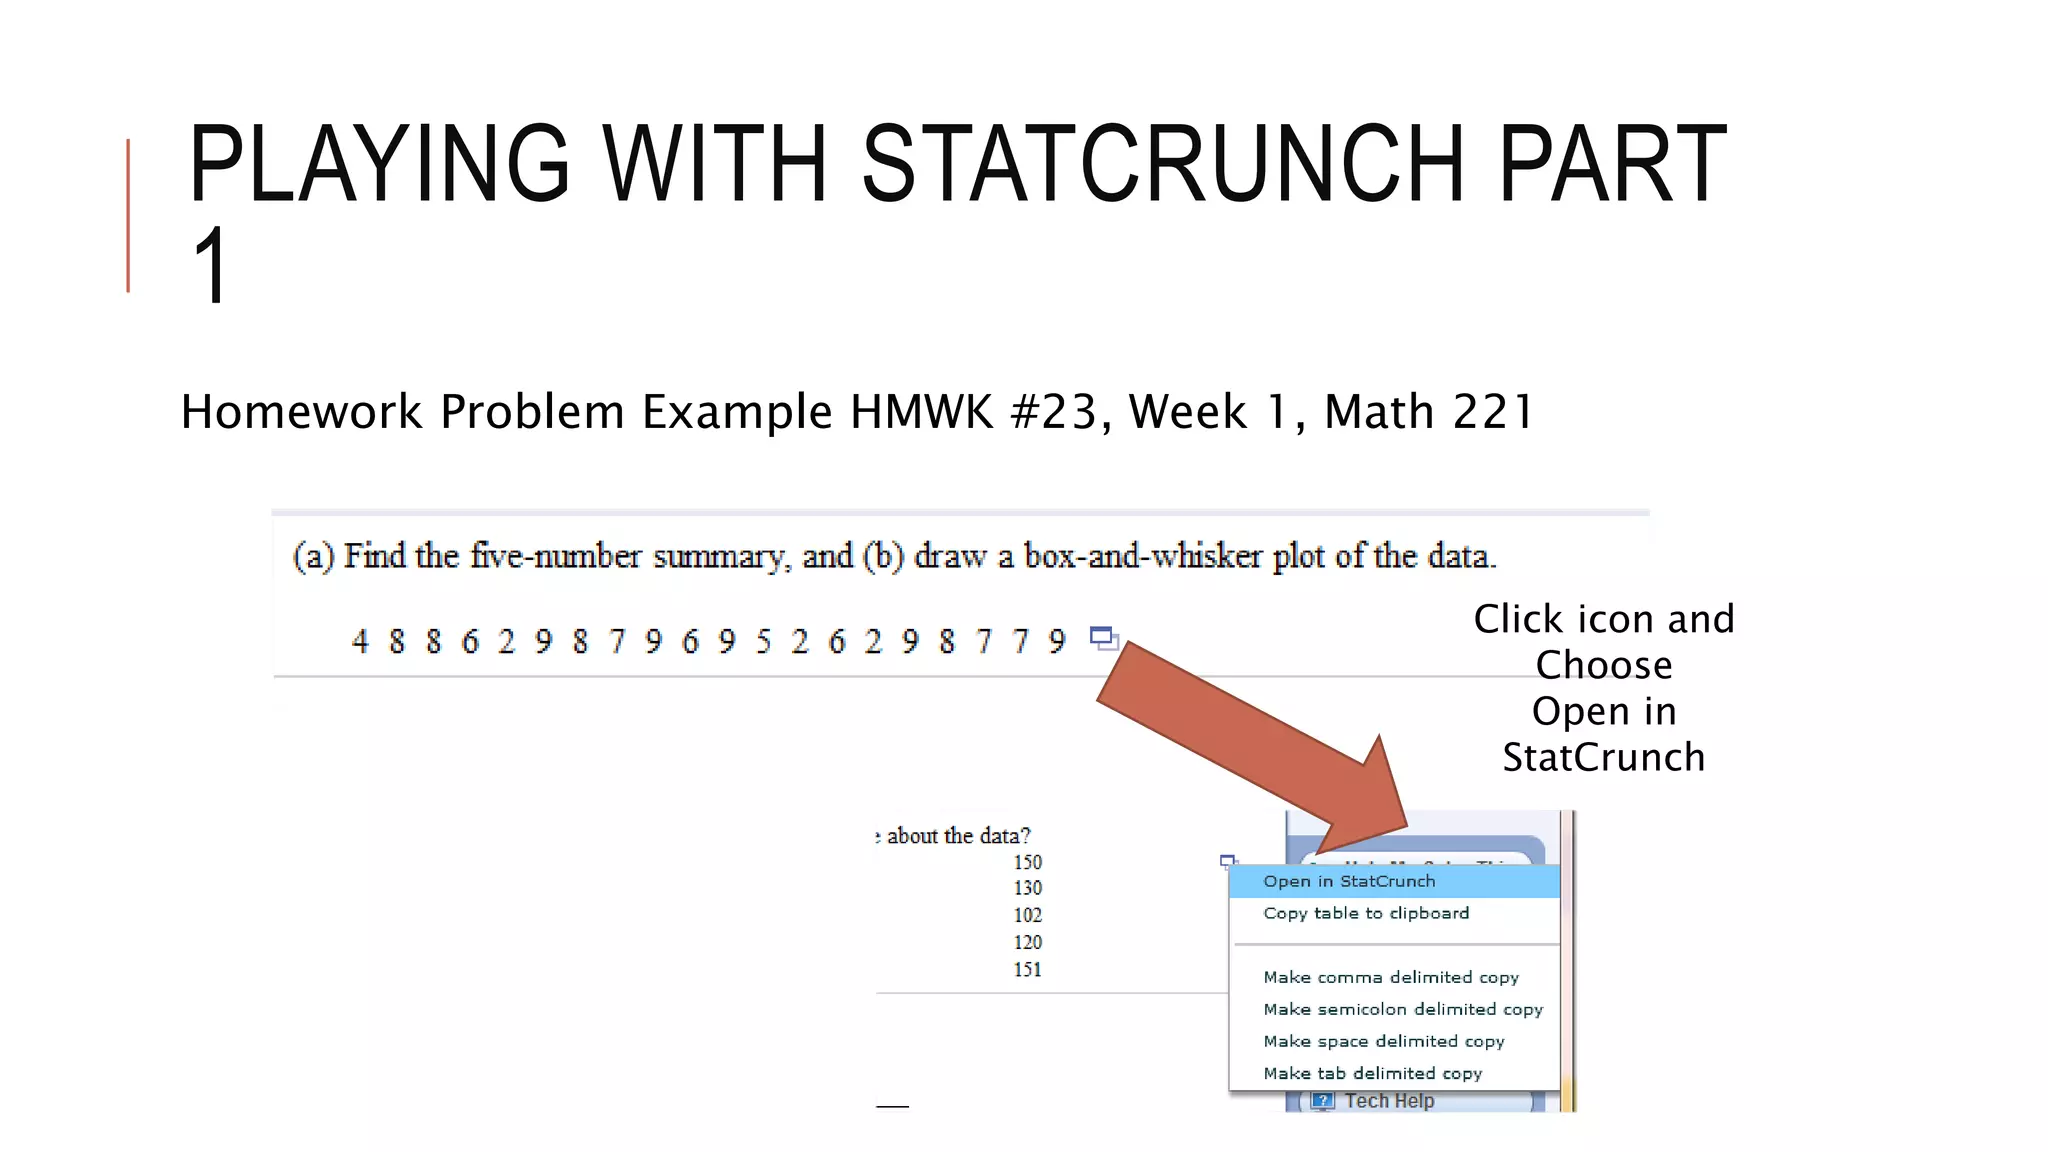
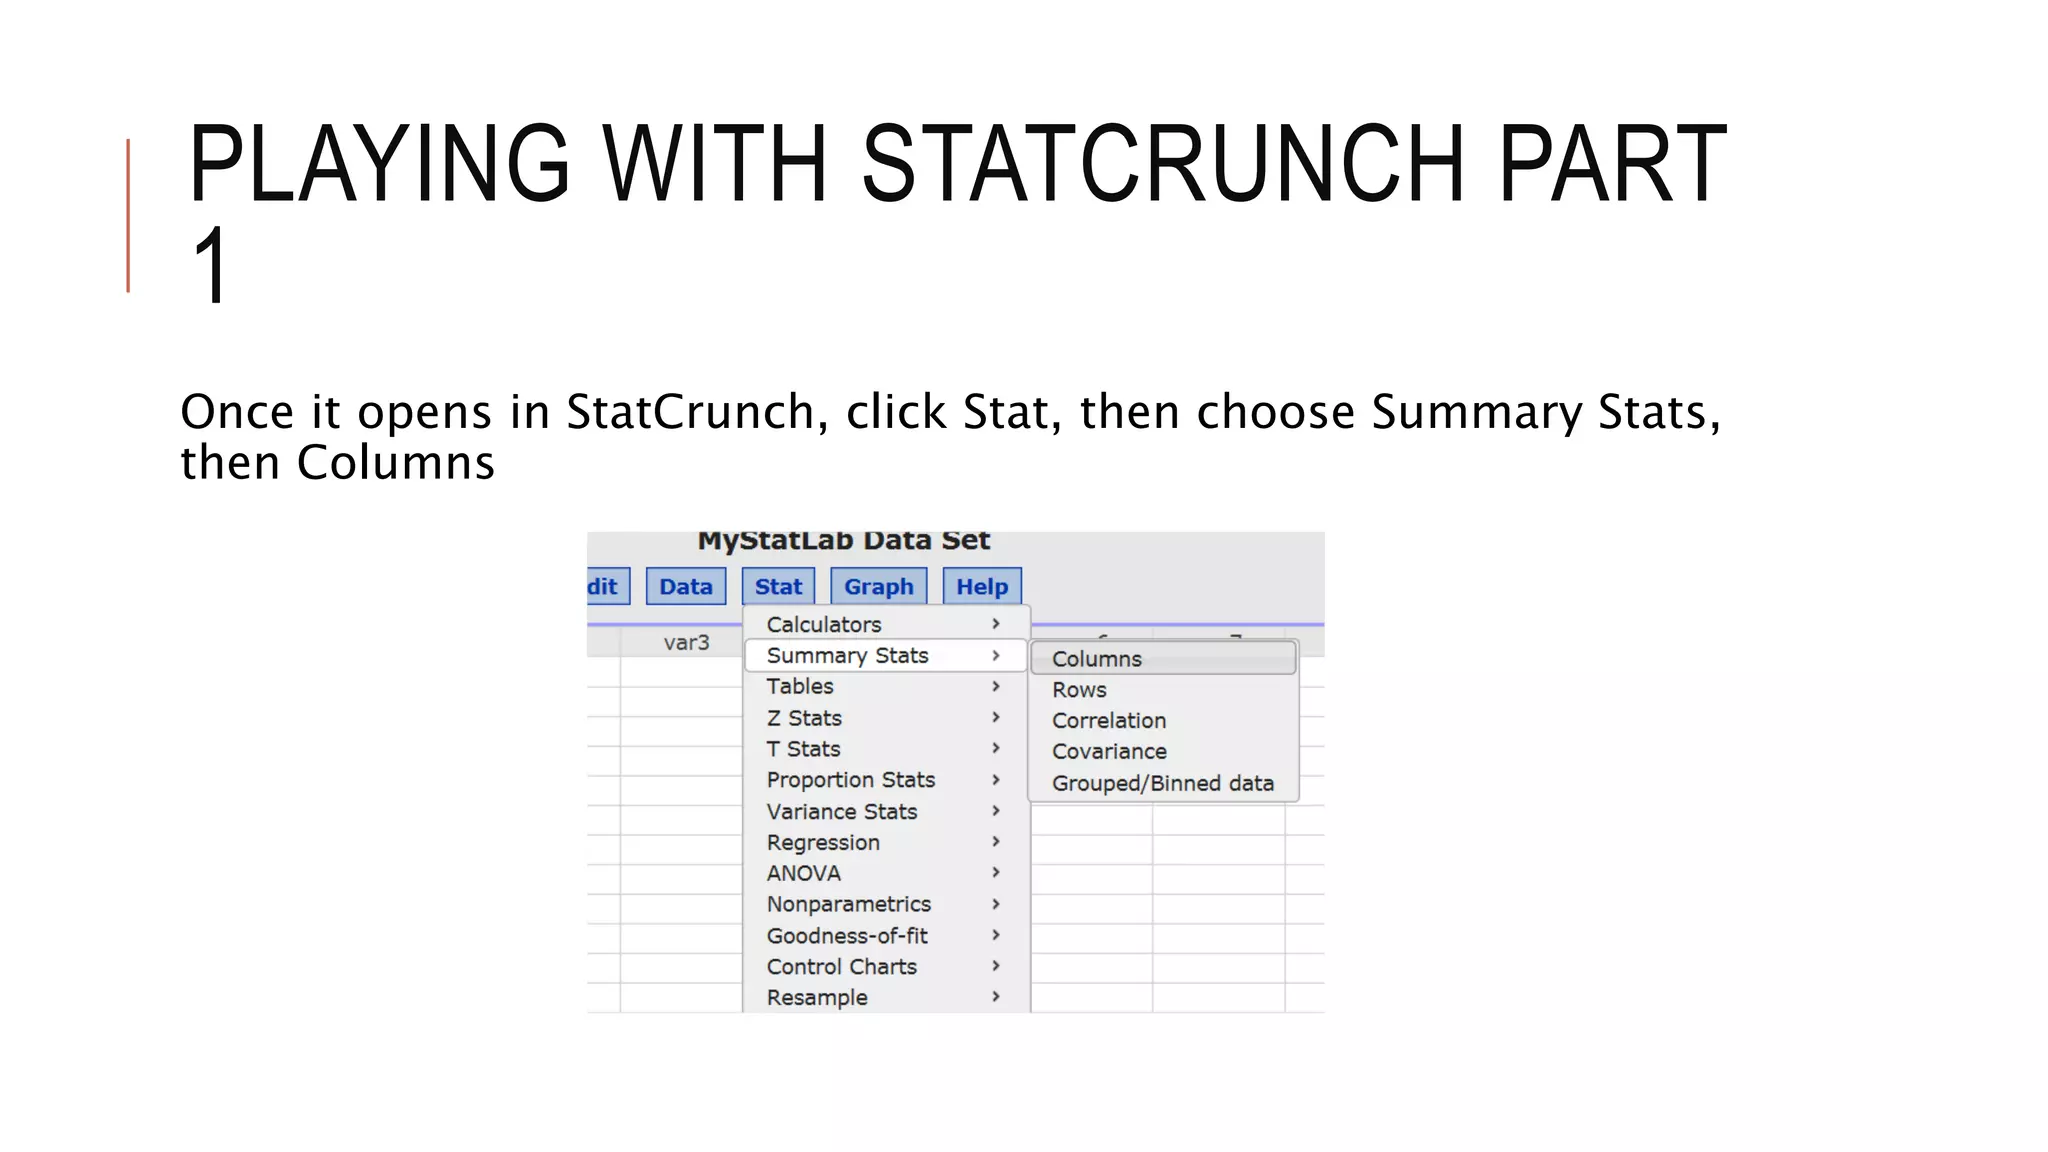
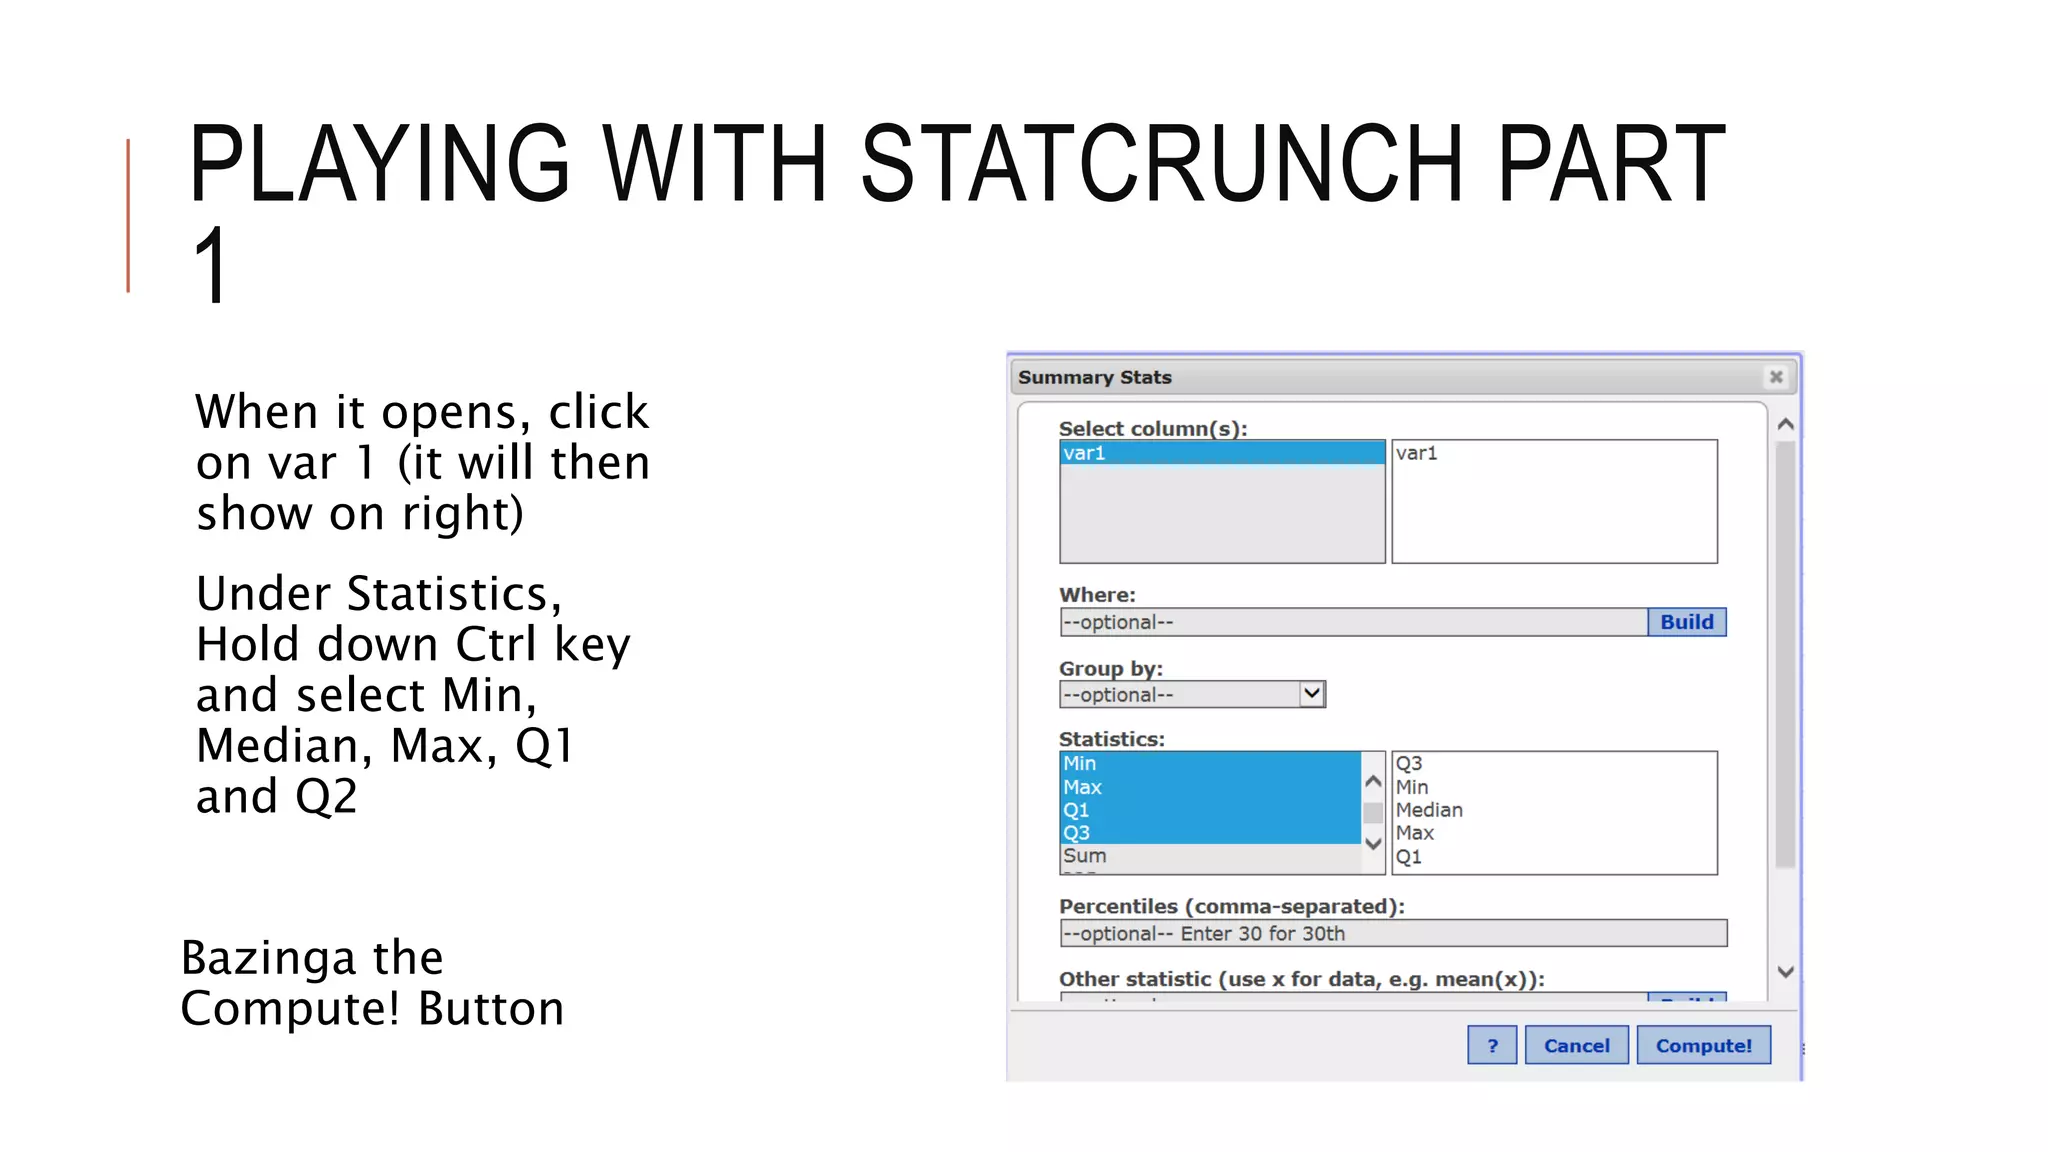
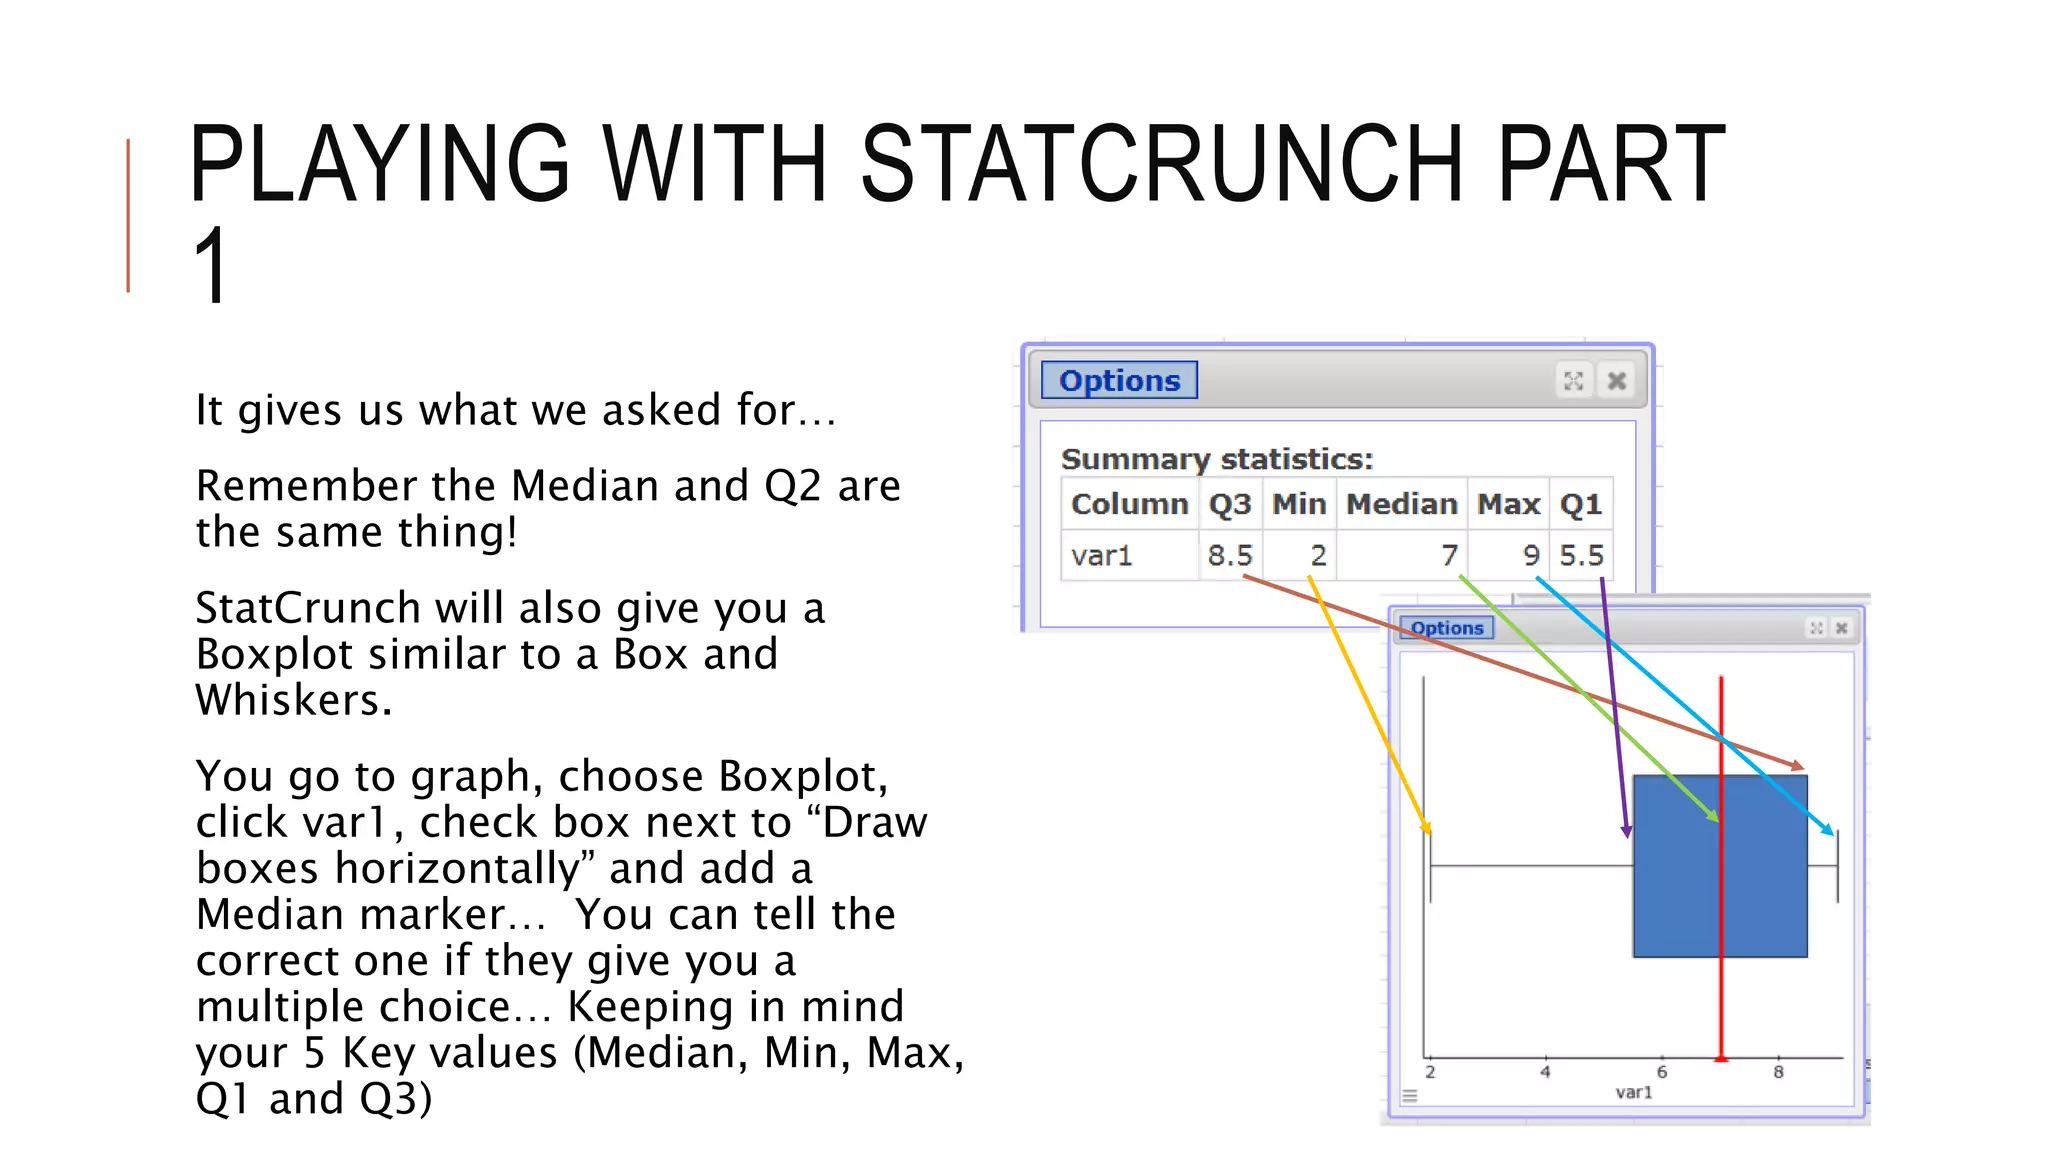
PLAYING WITH
STATCRUNCH PART 1
B Heard
These charts are not to be
posted or used without my
permission. Students may
download a copy for
personal use.
PLAYING WITH STATCRUNCH PART
1
First let me note that I use Minitab in my live lectures because the
course is mainly based on Minitab.
This presentation and those that follow throughout the term are
simply a “diary” of sorts as I use Statcrunch on various problems.
A student in one of my classes noted that he used it and liked it, thus
I thought I would play around with it and share my findings.
That is the wonderful thing I enjoy about teaching – I get to learn.
This should be applicable to both undergraduate and graduate
students.
I am not advising you to use Statcrunch, rather than Minitab (not at
all). However, I want to see what it will do.
PLAYING WITH STATCRUNCH PART
1
Homework Problem Example HMWK #15, Week 1, Math 221
Click icon and
Choose
Open in
StatCrunch
PLAYING WITH STATCRUNCH PART
1
Ok, it opens in StatCrunch and looks pretty cool
I did this tutorial
and found it interesting,
but I will show you how to
work this one…
PLAYING WITH STATCRUNCH PART
1
I clicked the Graph button and chose Stem and Leaf
Let’s see what it looks like…
PLAYING WITH STATCRUNCH PART
1
I clicked on var1
Chose “None” for
Outlier Trimming and
didn’t mess with
anything else
Of course I hit the
Compute button!
PLAYING WITH STATCRUNCH PART
1
It gave me this… Which is perfect.
By looking at the plot, you can see that
“Most of the values are below 149”
The follow up questions can be
confusing, just be careful.
PLAYING WITH STATCRUNCH PART
1
Homework Problem Example HMWK #17, Week 1, Math 221
Click icon and
Choose
Open in
StatCrunch
PLAYING WITH STATCRUNCH PART
1
It opens in StatCrunch just as the first one did. The first cell with the
5 highlighted just opens that way and doesn’t seem to affect
anything. Let’s push some buttons.
PLAYING WITH STATCRUNCH PART
1
I clicked Stat, chose Summary Stats, then Columns
PLAYING WITH STATCRUNCH PART
1
They ask for the mean, median and mode.
I clicked on var1 and it shows up on the right
They ask for the mean, median and mode, but
just in case they ask for something else, I chose
a few more …
Under Statistics, Hold down the Ctrl key and
Select what you want…
I chose Mean, Variance, Std. dev., Median,
Range and Mode… Compute! Button…
PLAYING WITH STATCRUNCH PART
1
Bazinga! Just make sure to round properly…
PLAYING WITH STATCRUNCH PART
1
Homework Problem Example HMWK #20, Week 1, Math 221
No data to open on
this one, so let’s see what
we can do…
Click StatCrunch on the right
PLAYING WITH STATCRUNCH PART
1
StatCrunch opens blank
PLAYING WITH STATCRUNCH PART
1
Click Stat, Choose Calculators, then choose Normal
PLAYING WITH STATCRUNCH PART
1
Click the Between button (top) Enter Mean of 180, Std. Dev. Of 9
Enter 153 for the left side, 207 for the right side
Hit the Compute button and stand back…
PLAYING WITH STATCRUNCH PART
1
It’s dead on… however, I
would round these to one
decimal place (% form) if they
say Do Not Round, since we
are dealing with the
Empirical Rule. In other
words, note 99.7% as your
answer
Remember, 0.997 is 99.7%
The second part was just as
easy.
PLAYING WITH STATCRUNCH PART
1
Homework Problem Example HMWK #21, Week 1, Math 221
No data to open on
this one, so let’s see what
we can do…
Click StatCrunch on the right
PLAYING WITH STATCRUNCH PART
1
StatCrunch opens blank
PLAYING WITH STATCRUNCH PART
1
Click Stat, Choose Calculators, then choose Normal
PLAYING WITH STATCRUNCH PART
1
Click the Between button
(top) Enter Mean of 1300,
Std. Dev. Of 300
Enter 1000 for the left side,
1600 for the right side
Hit the Compute button
and stand back…
PLAYING WITH STATCRUNCH PART
1
Ok, we see that it is
roughly 68%
However, they asked us
“How many farms out of
78”
So we multiply (0.68)(78)
and get 53.04, so we
would say “53” and we
would nail it!
Then they asked
something about out of 26
farms… You would again
say (0.68)(26) = 17.68 and
PLAYING WITH STATCRUNCH PART
1
Homework Problem Example HMWK #23, Week 1, Math 221
Click icon and
Choose
Open in
StatCrunch
PLAYING WITH STATCRUNCH PART
1
Once it opens in StatCrunch, click Stat, then choose Summary Stats,
then Columns
PLAYING WITH STATCRUNCH PART
1
When it opens, click
on var 1 (it will then
show on right)
Under Statistics,
Hold down Ctrl key
and select Min,
Median, Max, Q1
and Q2
Bazinga the
Compute! Button
PLAYING WITH STATCRUNCH PART
1
It gives us what we asked for…
Remember the Median and Q2 are
the same thing!
StatCrunch will also give you a
Boxplot similar to a Box and
Whiskers.
You go to graph, choose Boxplot,
click var1, check box next to “Draw
boxes horizontally” and add a
Median marker… You can tell the
correct one if they give you a
multiple choice… Keeping in mind
your 5 Key values (Median, Min, Max,
Q1 and Q3)
PLAYING WITH STATCRUNCH PART
1
I will note again that I did this just to see what it will do.
It seems to do a great job…
However, lectures will continue to be based on Minitab.
I will “try” to some questions in StatCrunch and post the link here in
the StatCave in coming weeks based on my time. (I can’t promise this,
but I will try when possible.)

Playing with statcrunch part 1

  • 1.
    PLAYING WITH STATCRUNCH PART1 B Heard These charts are not to be posted or used without my permission. Students may download a copy for personal use.
  • 2.
    PLAYING WITH STATCRUNCHPART 1 First let me note that I use Minitab in my live lectures because the course is mainly based on Minitab. This presentation and those that follow throughout the term are simply a “diary” of sorts as I use Statcrunch on various problems. A student in one of my classes noted that he used it and liked it, thus I thought I would play around with it and share my findings. That is the wonderful thing I enjoy about teaching – I get to learn. This should be applicable to both undergraduate and graduate students. I am not advising you to use Statcrunch, rather than Minitab (not at all). However, I want to see what it will do.
  • 3.
    PLAYING WITH STATCRUNCHPART 1 Homework Problem Example HMWK #15, Week 1, Math 221 Click icon and Choose Open in StatCrunch
  • 4.
    PLAYING WITH STATCRUNCHPART 1 Ok, it opens in StatCrunch and looks pretty cool I did this tutorial and found it interesting, but I will show you how to work this one…
  • 5.
    PLAYING WITH STATCRUNCHPART 1 I clicked the Graph button and chose Stem and Leaf Let’s see what it looks like…
  • 6.
    PLAYING WITH STATCRUNCHPART 1 I clicked on var1 Chose “None” for Outlier Trimming and didn’t mess with anything else Of course I hit the Compute button!
  • 7.
    PLAYING WITH STATCRUNCHPART 1 It gave me this… Which is perfect. By looking at the plot, you can see that “Most of the values are below 149” The follow up questions can be confusing, just be careful.
  • 8.
    PLAYING WITH STATCRUNCHPART 1 Homework Problem Example HMWK #17, Week 1, Math 221 Click icon and Choose Open in StatCrunch
  • 9.
    PLAYING WITH STATCRUNCHPART 1 It opens in StatCrunch just as the first one did. The first cell with the 5 highlighted just opens that way and doesn’t seem to affect anything. Let’s push some buttons.
  • 10.
    PLAYING WITH STATCRUNCHPART 1 I clicked Stat, chose Summary Stats, then Columns
  • 11.
    PLAYING WITH STATCRUNCHPART 1 They ask for the mean, median and mode. I clicked on var1 and it shows up on the right They ask for the mean, median and mode, but just in case they ask for something else, I chose a few more … Under Statistics, Hold down the Ctrl key and Select what you want… I chose Mean, Variance, Std. dev., Median, Range and Mode… Compute! Button…
  • 12.
    PLAYING WITH STATCRUNCHPART 1 Bazinga! Just make sure to round properly…
  • 13.
    PLAYING WITH STATCRUNCHPART 1 Homework Problem Example HMWK #20, Week 1, Math 221 No data to open on this one, so let’s see what we can do… Click StatCrunch on the right
  • 14.
    PLAYING WITH STATCRUNCHPART 1 StatCrunch opens blank
  • 15.
    PLAYING WITH STATCRUNCHPART 1 Click Stat, Choose Calculators, then choose Normal
  • 16.
    PLAYING WITH STATCRUNCHPART 1 Click the Between button (top) Enter Mean of 180, Std. Dev. Of 9 Enter 153 for the left side, 207 for the right side Hit the Compute button and stand back…
  • 17.
    PLAYING WITH STATCRUNCHPART 1 It’s dead on… however, I would round these to one decimal place (% form) if they say Do Not Round, since we are dealing with the Empirical Rule. In other words, note 99.7% as your answer Remember, 0.997 is 99.7% The second part was just as easy.
  • 18.
    PLAYING WITH STATCRUNCHPART 1 Homework Problem Example HMWK #21, Week 1, Math 221 No data to open on this one, so let’s see what we can do… Click StatCrunch on the right
  • 19.
    PLAYING WITH STATCRUNCHPART 1 StatCrunch opens blank
  • 20.
    PLAYING WITH STATCRUNCHPART 1 Click Stat, Choose Calculators, then choose Normal
  • 21.
    PLAYING WITH STATCRUNCHPART 1 Click the Between button (top) Enter Mean of 1300, Std. Dev. Of 300 Enter 1000 for the left side, 1600 for the right side Hit the Compute button and stand back…
  • 22.
    PLAYING WITH STATCRUNCHPART 1 Ok, we see that it is roughly 68% However, they asked us “How many farms out of 78” So we multiply (0.68)(78) and get 53.04, so we would say “53” and we would nail it! Then they asked something about out of 26 farms… You would again say (0.68)(26) = 17.68 and
  • 23.
    PLAYING WITH STATCRUNCHPART 1 Homework Problem Example HMWK #23, Week 1, Math 221 Click icon and Choose Open in StatCrunch
  • 24.
    PLAYING WITH STATCRUNCHPART 1 Once it opens in StatCrunch, click Stat, then choose Summary Stats, then Columns
  • 25.
    PLAYING WITH STATCRUNCHPART 1 When it opens, click on var 1 (it will then show on right) Under Statistics, Hold down Ctrl key and select Min, Median, Max, Q1 and Q2 Bazinga the Compute! Button
  • 26.
    PLAYING WITH STATCRUNCHPART 1 It gives us what we asked for… Remember the Median and Q2 are the same thing! StatCrunch will also give you a Boxplot similar to a Box and Whiskers. You go to graph, choose Boxplot, click var1, check box next to “Draw boxes horizontally” and add a Median marker… You can tell the correct one if they give you a multiple choice… Keeping in mind your 5 Key values (Median, Min, Max, Q1 and Q3)
  • 27.
    PLAYING WITH STATCRUNCHPART 1 I will note again that I did this just to see what it will do. It seems to do a great job… However, lectures will continue to be based on Minitab. I will “try” to some questions in StatCrunch and post the link here in the StatCave in coming weeks based on my time. (I can’t promise this, but I will try when possible.)