Downloaded 109 times


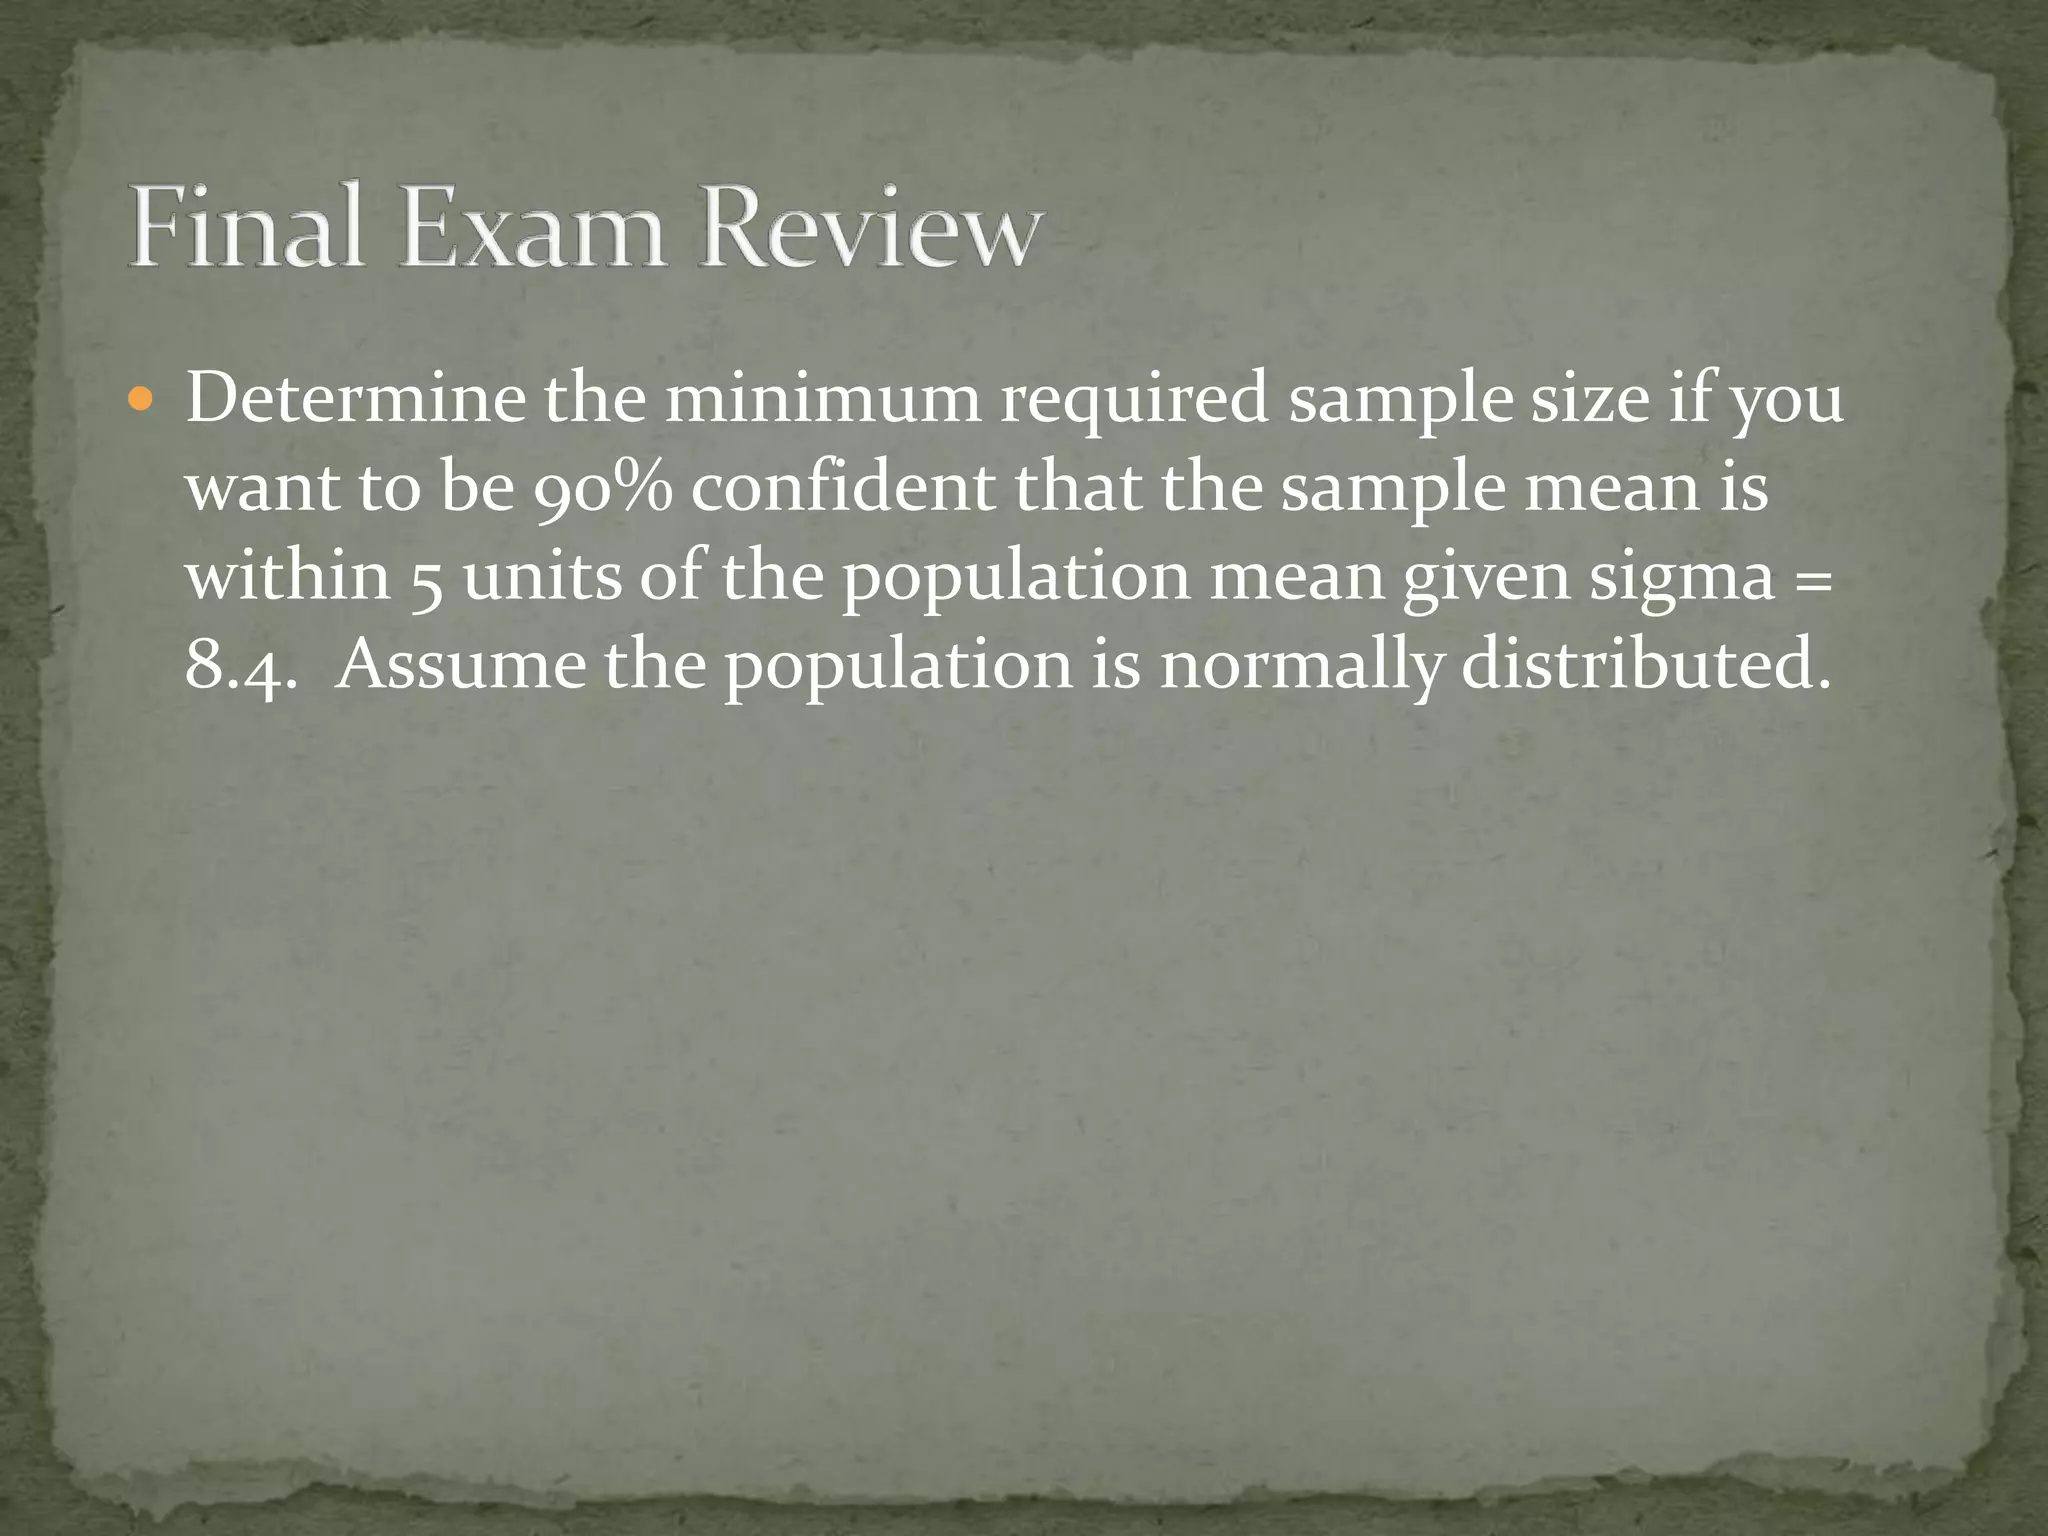
![ Determine the minimum required sample size if you
want to be 90% confident that the sample mean is
within 5 units of the population mean given sigma =
8.4. Assume the population is normally distributed.
n = (Zc*sigma/E)^2
= [(1.645 * 8.4)/ 5]^2 = (2.7636)^2
= 7.64
= 8 (always round up sample sizes)](https://image.slidesharecdn.com/finalexamexamplesapr2013-130420145454-phpapp01/75/Final-examexamplesapr2013-23-2048.jpg)


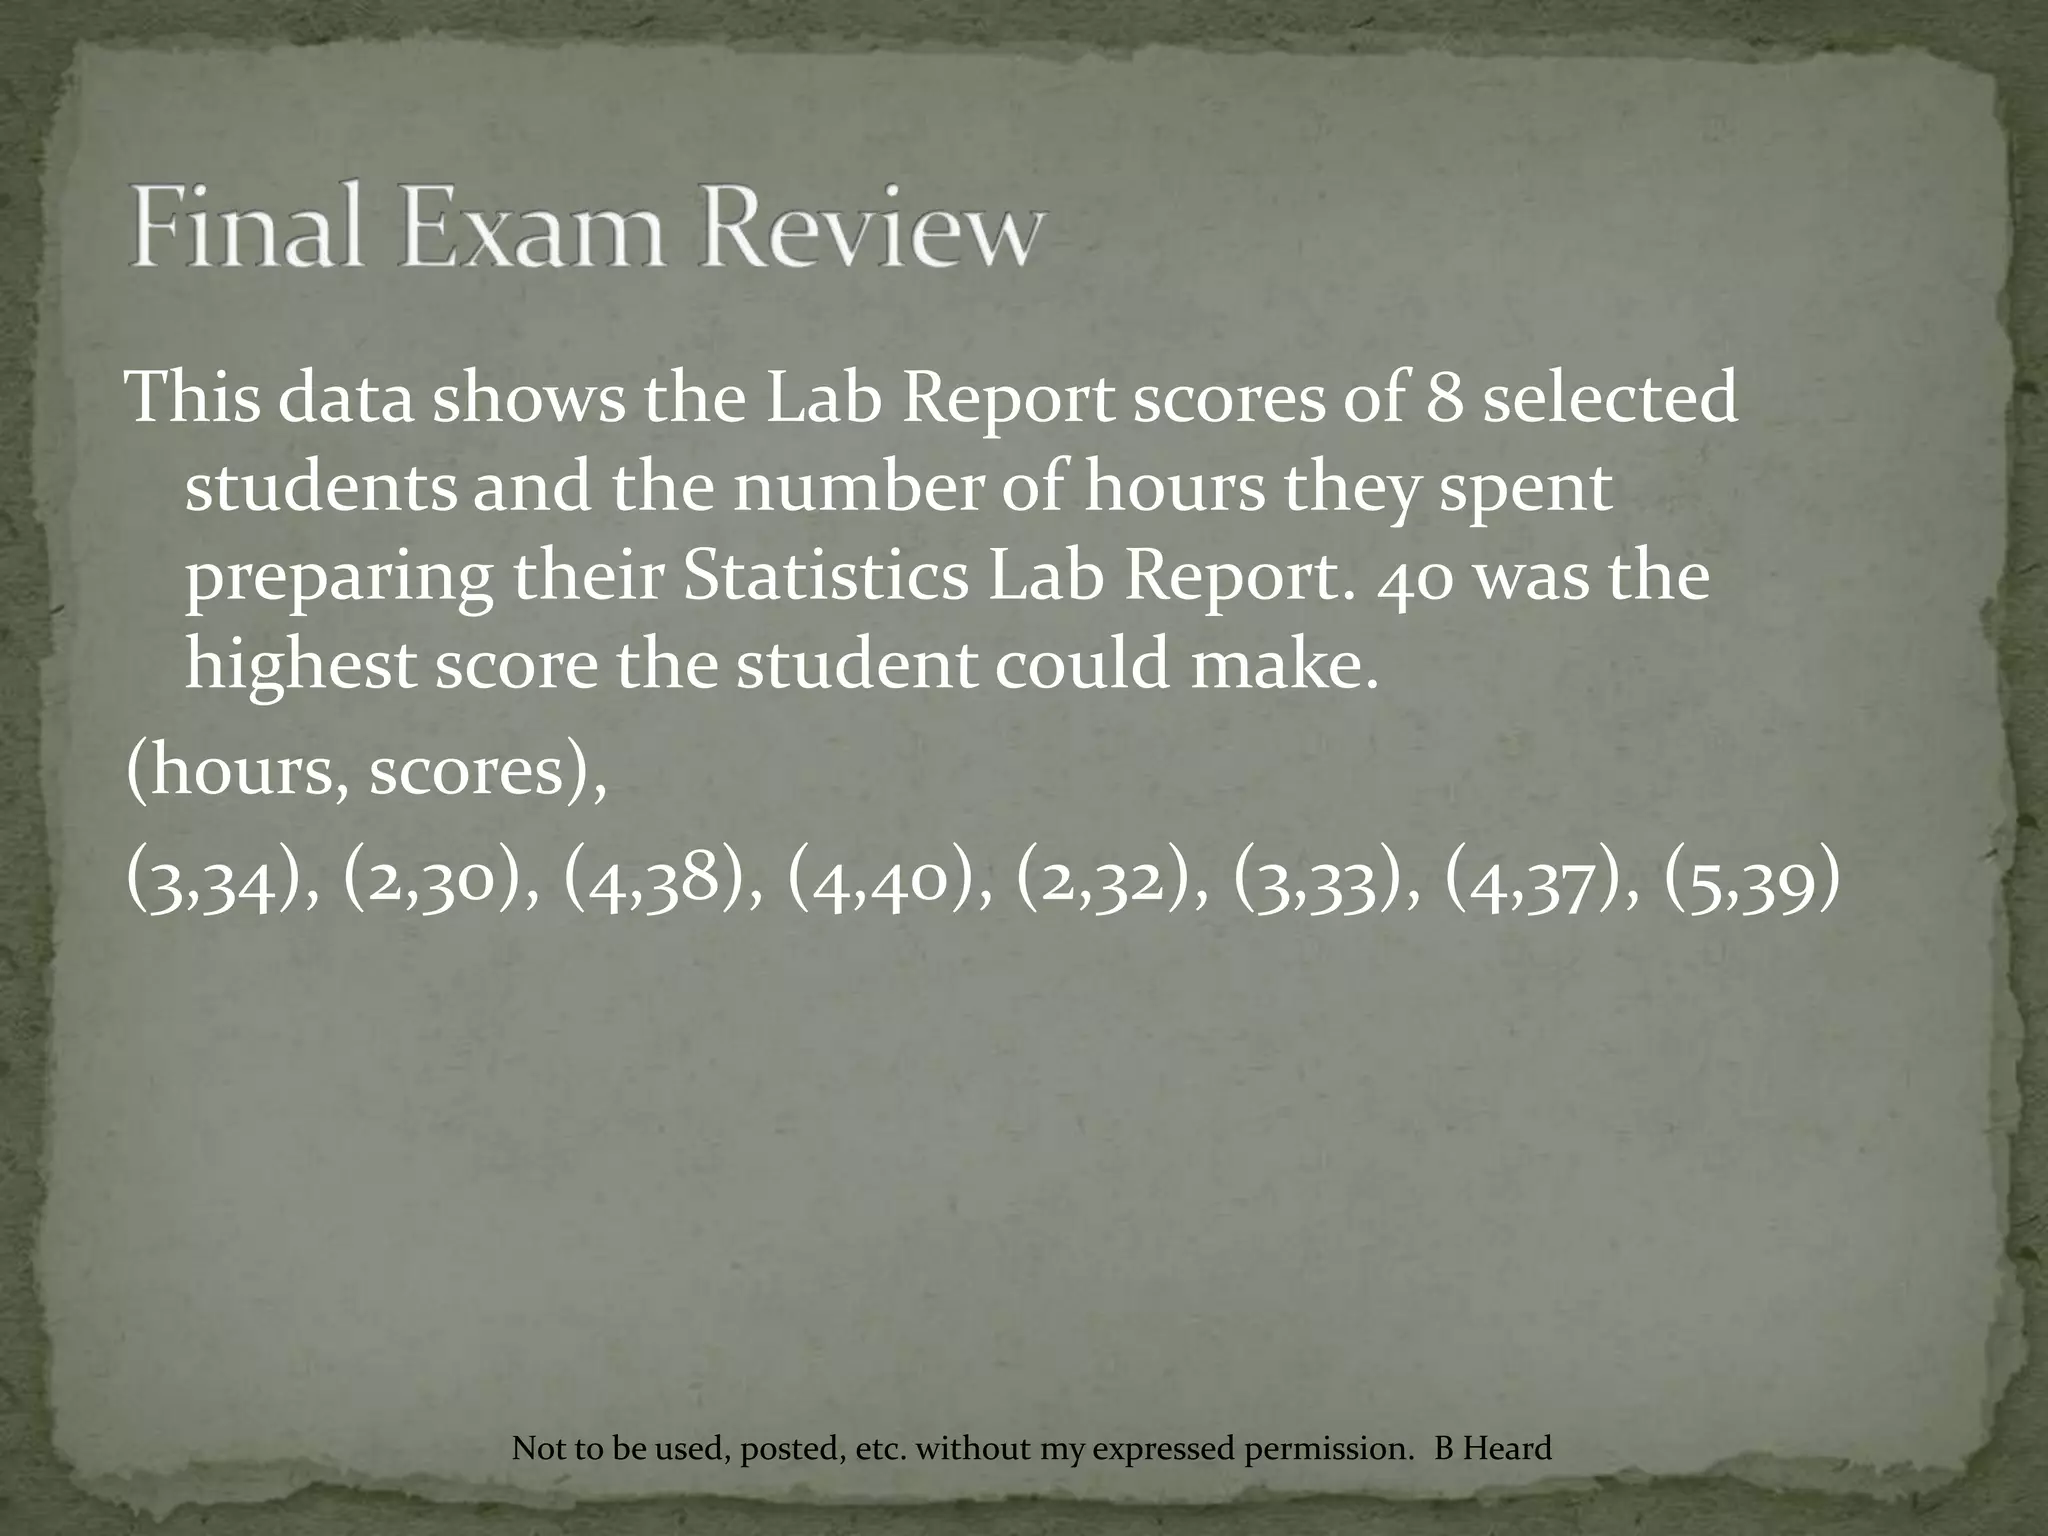
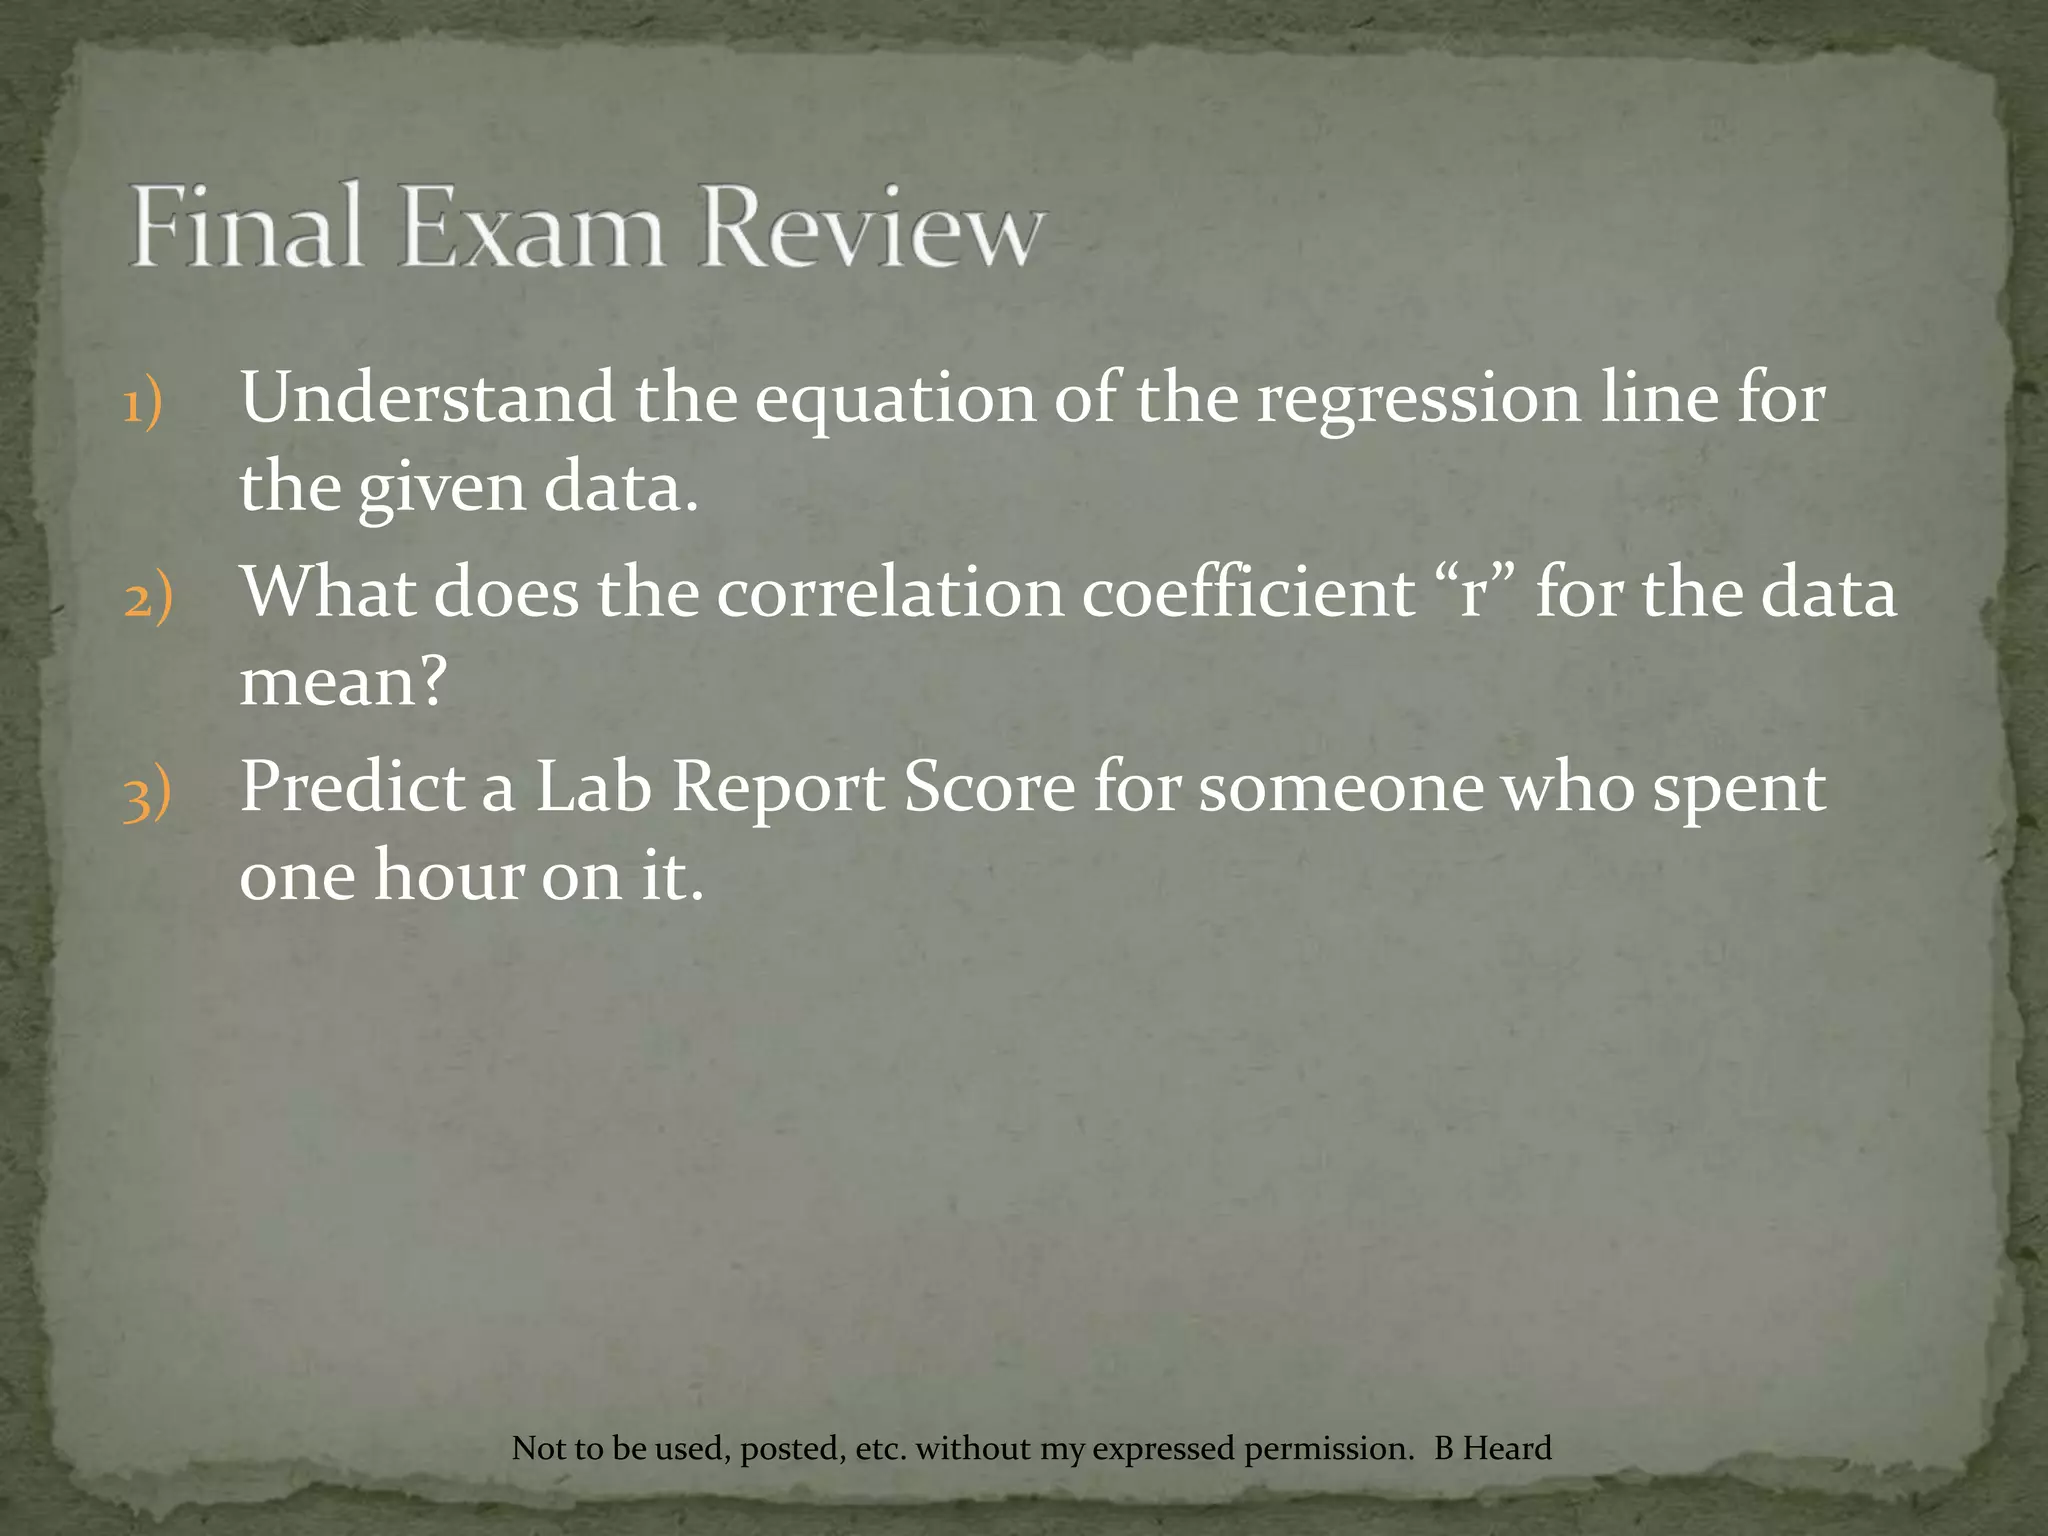
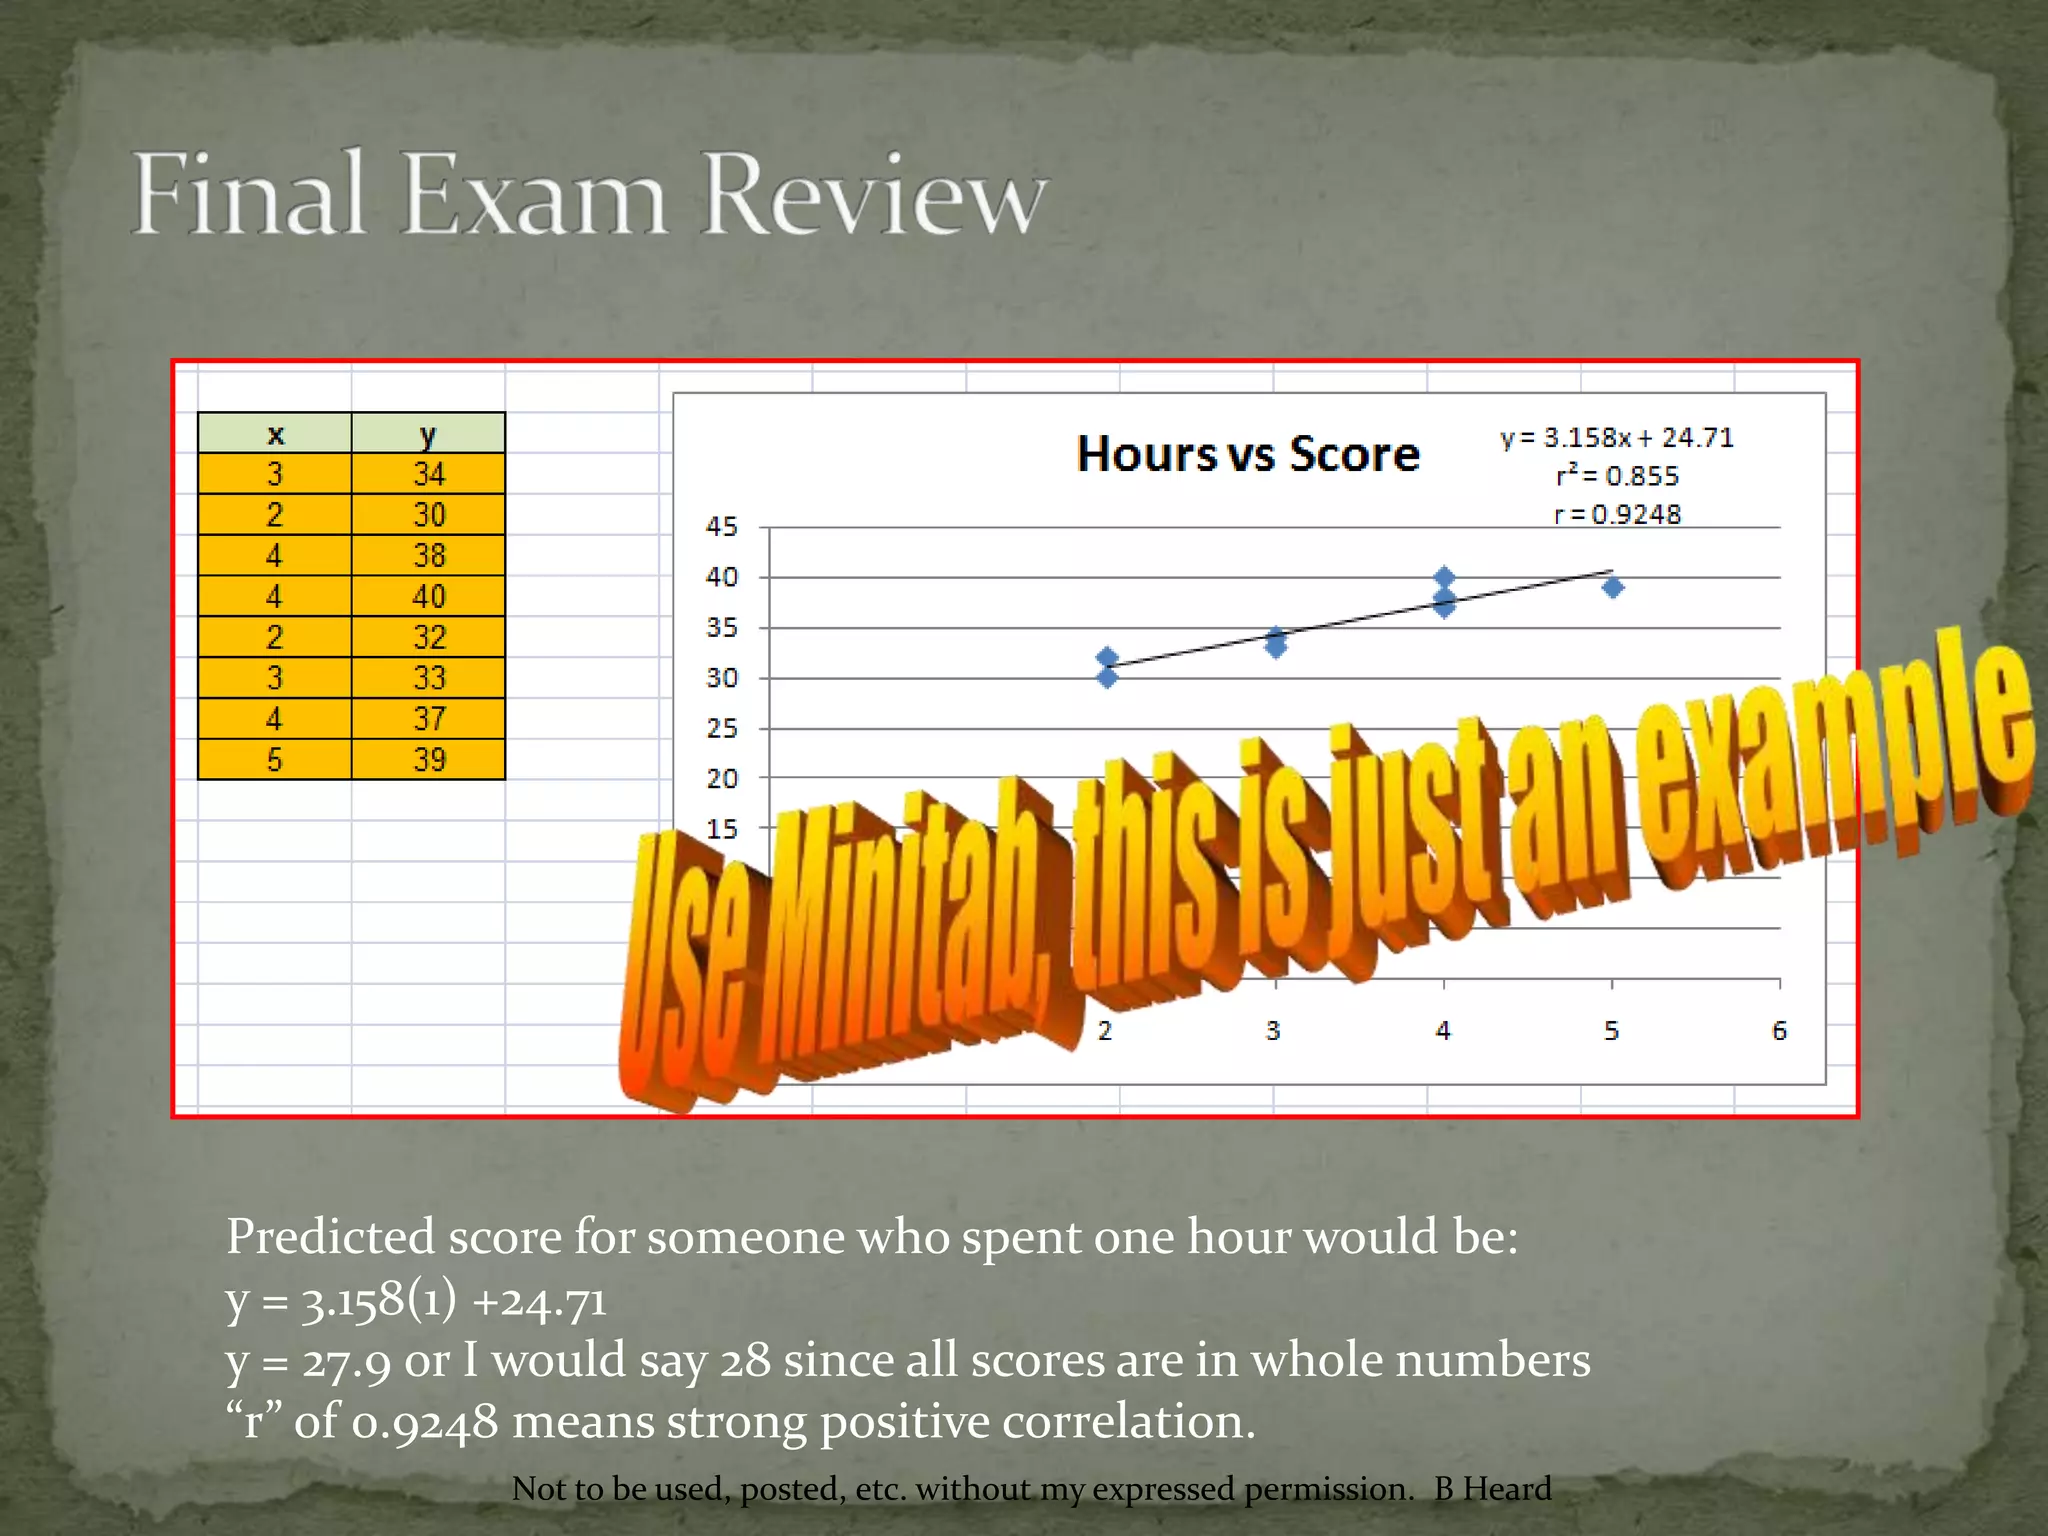
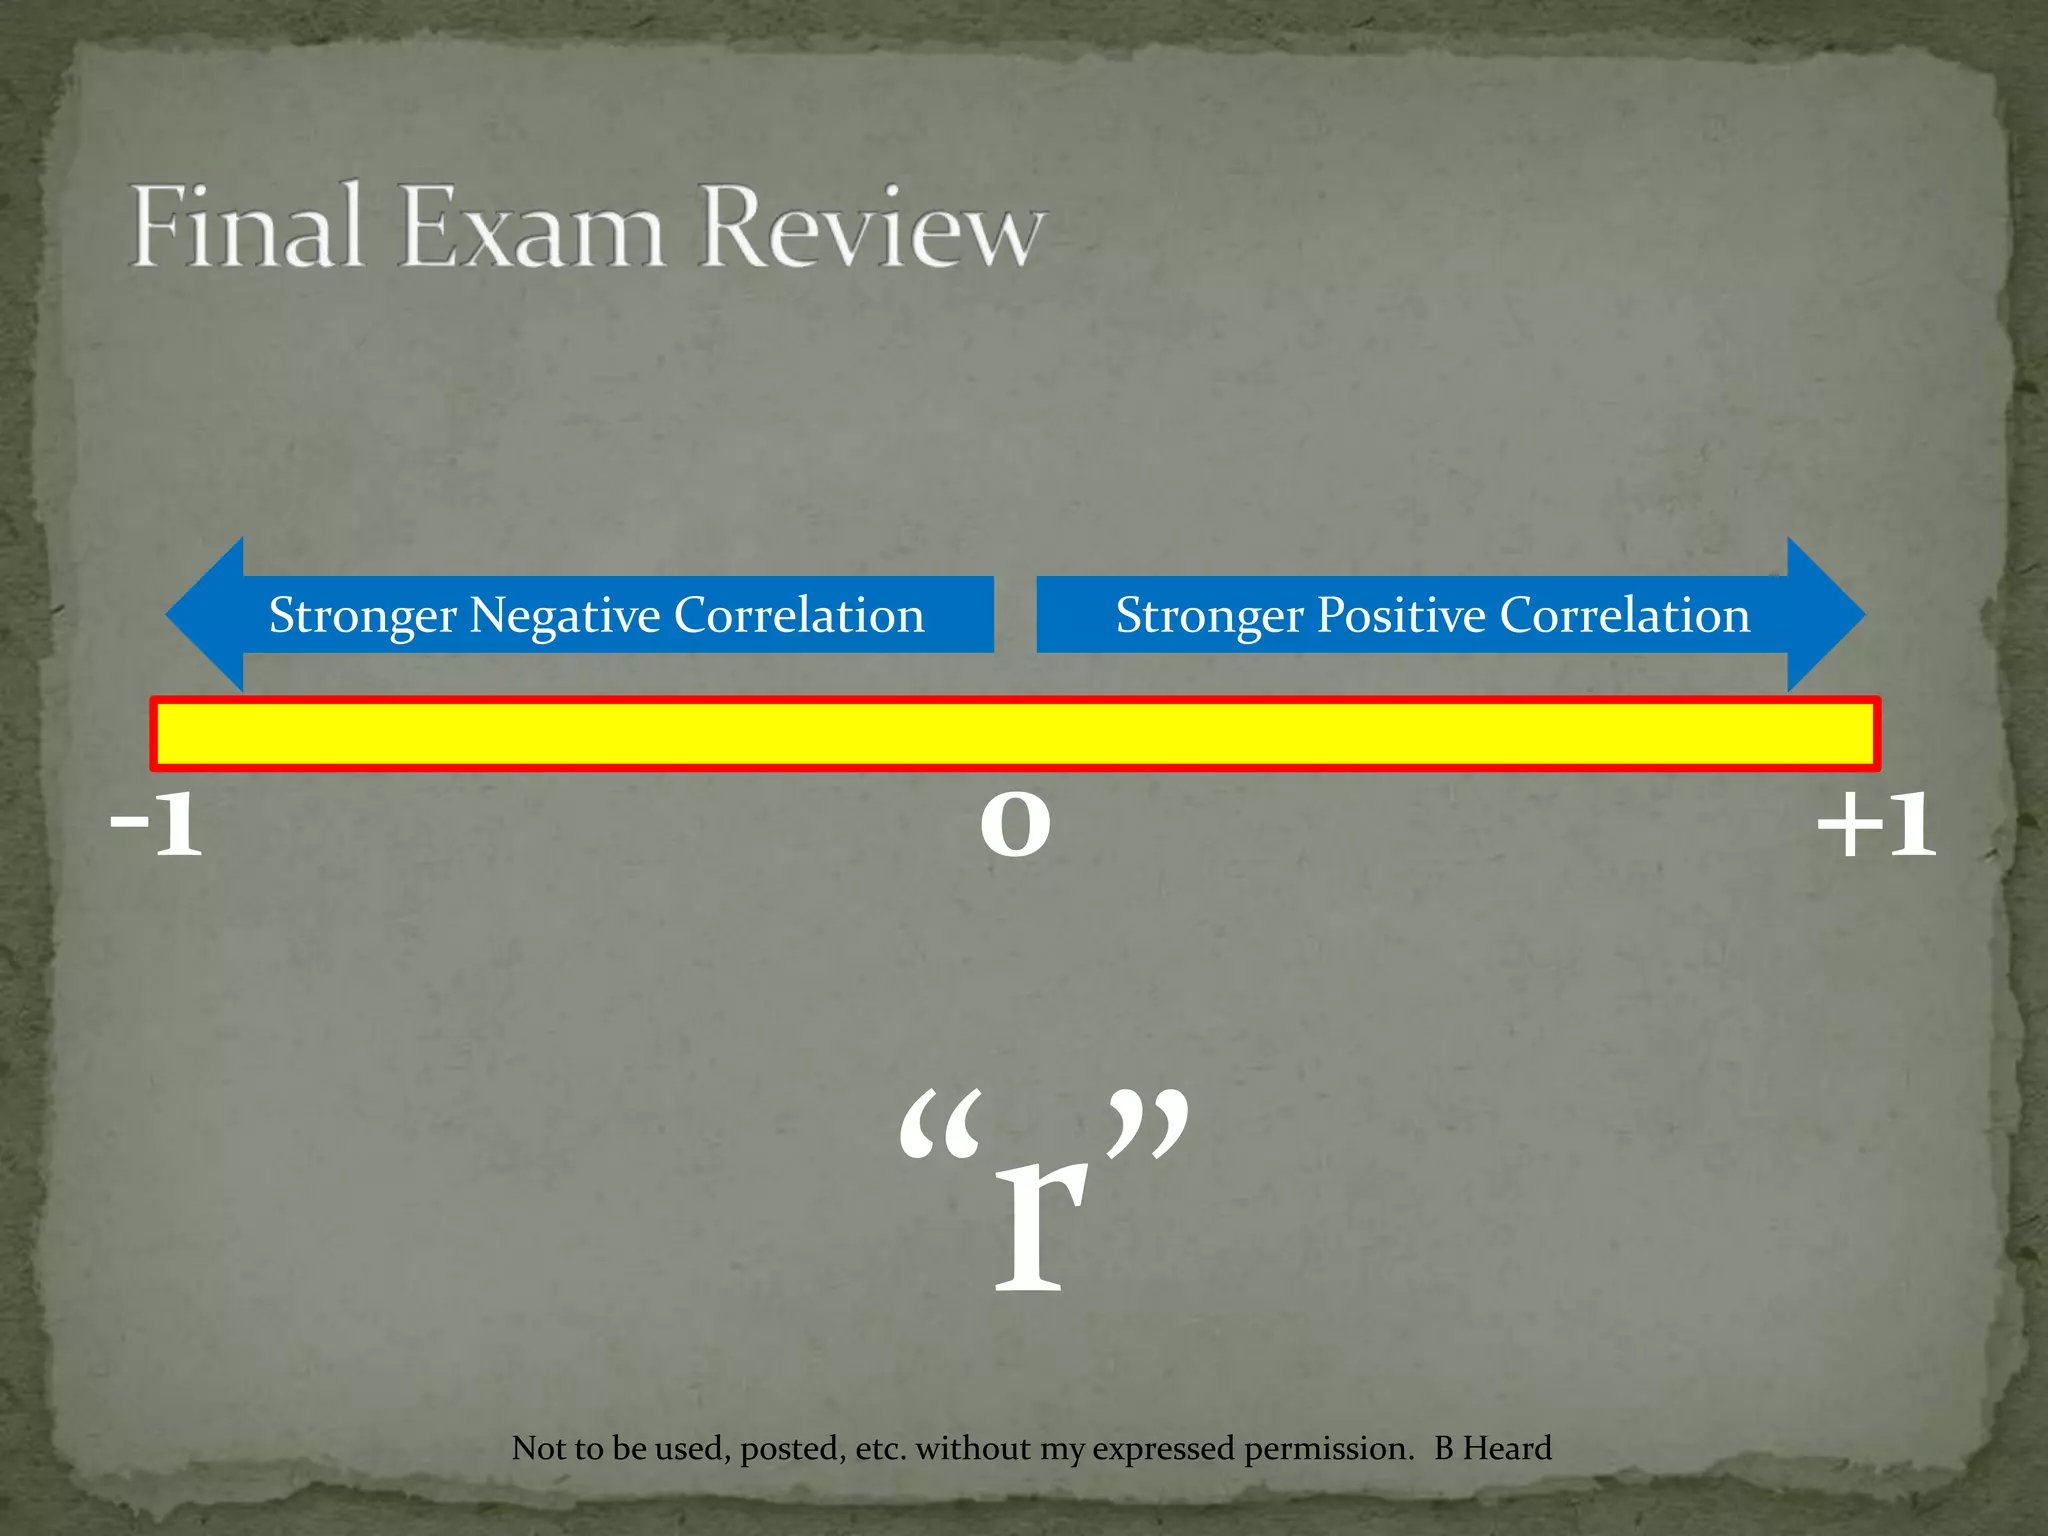
The document contains statistics lab report scores for 8 students who spent varying amounts of time preparing. It includes the regression equation relating hours spent to score and predicts a score for someone who spent 1 hour. It also defines the correlation coefficient and explains it measures the strength of the linear relationship between two variables.


![Week7 Quiz Help 2009[1]](https://cdn.slidesharecdn.com/ss_thumbnails/week7quizhelp20091-091012152329-phpapp02-thumbnail.jpg?width=640&height=640&fit=bounds)